
Archived - Gonorrhea 2010–2015

 Download this article as a PDF
 Published by: The Public Health Agency of Canada
Issue: Volume 44-2: Sexually transmitted infections
Date published: February 1, 2018
ISSN: 1481-8531
Submit a manuscript
About CCDR
Browse
Volume 44-2, February 1, 2018: Sexually transmitted infections
Surveillance
Gonorrhea in Canada, 2010–2015
Y Choudhri1, J Miller1, J Sandhu1, A Leon1, J Aho1*
Affiliation
1 Centre for Communicable Diseases and Infection Control, Public Health Agency of Canada, Ottawa, ON
Correspondence
Suggested citation
Choudhri Y, Miller J, Sandhu J, Leon A, Aho J. Gonorrhea in Canada, 2010-2015. Can Commun Dis Rep. 2018;44(2):37-42. https://doi.org/10.14745/ccdr.v44i02a01
Abstract
Background: Gonorrhea is the second most commonly reported sexually transmitted infection (STI) in Canada after chlamydia, and rates for this STI have been increasing since 1997.
Objective: To summarize trends observed in gonorrhea rates for 2010-2015 in Canada.
Methods: Laboratory-confirmed cases of gonorrhea are reported to the Public Health Agency of Canada (PHAC) by all of the Canadian provinces and territories. The overall national rate was computed, as were rates per sex, age group and province/territory.
Results: In 2015, 19,845 cases of gonorrhea were reported in Canada, corresponding to a rate of 55.4 cases per 100,000 population and a 65.4% increase from 2010 (33.5 cases per 100,000 population). Males had consistently higher rates than did females (70.2 per 100,000 versus 40.6 per 100,000 in 2015) and faster rising rates (85.2% versus 39.5% in 2010-2015). Rates among adults 60 years and older increased faster than rates among younger people, although the highest rates were among those 15-29 years of age. The Northwest Territories, Nunavut and Yukon had the highest gonorrhea rates in 2015.
Conclusion: Males, adolescents and young adults continue to represent the majority of gonorrhea cases. Research is needed to better understand the current trends in gonorrhea infection in order to maintain, evaluate and improve primary and secondary STI prevention activities.
Introduction
Gonorrhea, caused by the bacterium Neisseria gonorrhoeae, is the second most commonly reported sexually transmitted infection (STI) in Canada, after chlamydia. Globally, there were an estimated 78 million cases of gonorrhea in 2012Footnote 1. Most infections are genital, but pharyngeal and anorectal infections may occur. Gonococcal infections are usually asymptomatic in females, but symptomatic in malesFootnote 2. In females, symptoms can include vaginal discharge; in males, symptoms often present as painful urination, abnormal urethral discharge and swollen testiclesFootnote 3. Untreated gonorrhea may lead to reactive arthritis, disseminated gonococcal infection and infertility in both sexes (although infertility is rare for men)Footnote 2. Clinical outcomes of untreated gonorrhea include pelvic inflammatory disease, chronic pelvic pain and ectopic pregnancy in females; in males, clinical outcomes include epididymo-orchitisFootnote 2. Mother-to-child transmission at birth can result in conjunctivitis in newborns, with a possible progression to blindness if the infection is not detected and treated rapidlyFootnote 4. Gonorrhea also increases the infectiousness of and susceptibility to HIV by increasing the number of HIV target cells in the genital tract and by amplifying HIV shedding (an infected cell releases viral particles, which in turn can infect new cells)Footnote 5Footnote 6.
Since 1997, Canada has seen a rise in gonorrhea rates in most jurisdictions, increasing the burden of the disease on our health care systemFootnote 2. In 2012, the overall rate of gonorrhea was 36.2 per 100,000, a 38.9% increase from the rate in 2003Footnote 7. As in previous years, more cases were reported in males than females (at a ratio of 1:1.3), but the relative rate increase was greater among femalesFootnote 7. Moreover, the control and treatment of gonorrhea have become more complex due to the development of antimicrobial resistance in several countries, including CanadaFootnote 8. The recent emergence of strains resistant to azithromycin and with decreased susceptibility to cephalosporins are threatening the last available treatment optionsFootnote 9. In 2014, 52.4% of N. gonorrhoeae isolates in Canada were resistant to at least one antibiotic tested.
The objective of this article is to summarize observed trends in reported gonorrhea infection rates across Canada in the period 2010–2015.
Methods
Data sources
Gonorrhea has been nationally notifiable since 1924. Provincial and territorial health authorities provide non-nominal data on laboratory-confirmed cases to the Public Health Agency of Canada (PHAC) through the Canadian Notifiable Disease Surveillance System (CNDSS)Footnote 10. Confirmed case definitions are shown in the AppendixFootnote 11.
Variables submitted along with the diagnosis include age at diagnosis, year of diagnosis, province/territory of diagnosis and sex. The received data are validated in collaboration with the corresponding province or territory. Data from January 1, 2010 to December 31, 2015 were available from all provinces and territories and were extracted from the CNDSS in July 2017.
Data analysis
Descriptive analysis was performed using Microsoft Excel. National annual rates of reported cases were computed using the number of cases from the CNDSS as numerators, and Statistics Canada yearly population estimates as denominators. Sex, age group and province/territory-specific rates were also calculated. For all years, rates are given per 100,000 population. No statistical procedures were used for comparative analyses. Small numbers are more susceptible to change and so corresponding rates should be interpreted with caution. Previous reports may contain different rates for some years due to reporting delays and data updating.
Results
Between 2010 and 2015, the number of reported gonorrhea cases increased from 11,386 to 19,845. The corresponding overall rate in 2015 was 55.4 cases per 100,000 population (versus 33.5 cases per 100,000 population in 2010) (Figure 1).
Sex and age
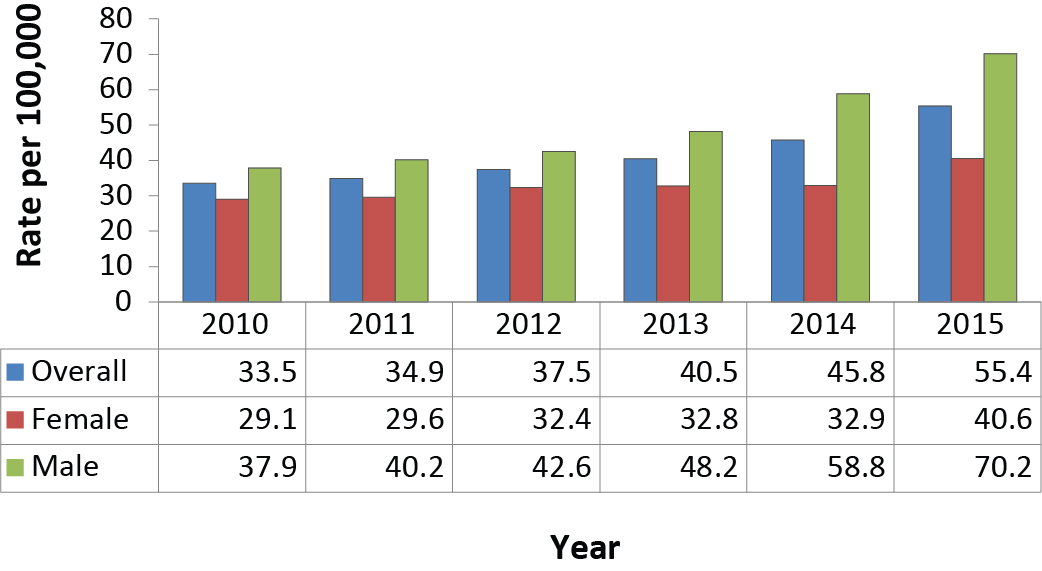
During the surveillance period of 2010-2015, the rate of gonorrhea was higher among males than among females (70.2 cases per 100,000 males compared with 40.6 per 100,000 females in 2015). In addition, the rate among males increased at a faster pace than the rate among females, 85.2% (from 37.9 to 70.2 per 100,000) compared with 39.5% (from 29.1 to 40.6 per 100,000) (Figure 1).
Figure 1: OverallFigure 1 footnote a and sex-specific rates of reported laboratory-confirmed gonorrhea cases, 2010–2015, Canada
Text description: Figure 1
Figure 1: OverallFigure 1 footnote a and sex-specific rates of reported laboratory-confirmed gonorrhea cases, 2010–2015, Canada
| Year | 2010 | 2011 | 2012 | 2013 | 2014 | 2015 |
|---|---|---|---|---|---|---|
| Overall | 33.5 | 34.9 | 37.5 | 40.5 | 45.8 | 55.4 |
| Female | 29.1 | 29.6 | 32.4 | 32.8 | 32.9 | 40.6 |
| Male | 37.9 | 40.2 | 42.6 | 48.2 | 58.8 | 70.2 |
Table 1 footnotes
|
||||||
Adolescents and young adults had the highest rates of gonorrhea in 2015 (205.3, 176.7 and 113.4 cases per 100,000 for people aged 20–24 years, 25–29 years and 15–19 years, respectively). The lowest rates were among those under 10 years old (0.6 cases per 100,000) and those aged 60 years and older (3.3 cases per 100,000).
From 2010 to 2015, adolescents aged 10–14 years were the only age group that showed a decrease in gonorrhea rates (−13.5%, from 4.6 to 4.0 cases per 100,000). In contrast, adults aged 30–39 years had the highest rate increase (128.7%, from 42.9 to 98.1 cases per 100,000), followed by those aged 40–59 years (100.0%, from 14.1 to 28.2 cases per 100,000).
When stratifying age-specific rates by sex, rates among females under 20 years old were consistently higher than those among males the same age (data not shown). Rates among males generally increased faster for all age groups except for the 10-14-year age group for which there was a 55.0% relative decrease for males (and a 1.0% decrease for females).
Geographic distribution
Rates and number of cases for each province and territory are presented in Table 1. Only Nunavut and New Brunswick showed a decrease in the reported rates of gonorrhea (56.9% and 22.0% decreases, respectively). Nunavut, along with the Northwest Territories and Yukon had the highest rates in 2015. The Atlantic provinces (Nova Scotia, New Brunswick, Prince Edward Island and Newfoundland and Labrador) had the lowest reported rates. The provinces and territories with the highest rate increase in the time period were Yukon (237.3%), Newfoundland and Labrador (212.7%), Alberta (159.8%) and British Columbia (143.7%).
| Province or territory | Laboratory-confirmed cases by year of diagnosis (rate per 100,000) | |||||
|---|---|---|---|---|---|---|
| 2010 | 2011 | 2012 | 2013 | 2014 | 2015 | |
| Alberta | 1,182 (31.7) |
1,508 (39.8) |
2,103 (54.2) |
2,017 (50.5) |
1,908 (46.4) |
3,438 (82.3) |
| British Columbia | 1,365 (30.6) |
1,649 (36.7) |
1,420 (31.2) |
1,841 (40.1) |
2,031 (43.7) |
3,495 (74.5) |
| Manitoba | 982 (80.4) |
1,055 (85.5) |
1,349 (107.9) |
1,217 (96.2) |
1,107 (86.4) |
1,085 (83.7) |
| New Brunswick | 64 (8.5) |
64 (8.5) |
38 (5.0) |
47 (6.2) |
44 (5.8) |
50 (6.6) |
| Newfoundland and Labrador | 12 (2.3) |
26 (5.0) |
16 (3.0) |
41 (7.8) |
66 (12.5) |
38 (7.2) |
| Northwest Territories | 219 (506.0) |
143 (328.7) |
192 (440.4) |
97 (221.5) |
245 (558.2) |
361 (815.9) |
| Nova Scotia | 100 (10.6) |
102 (10.8) |
119 (12.6) |
97 (10.3) |
114 (12.1) |
133 (14.1) |
| Nunavut | 648 (1942.9) |
595 (1740.0) |
448 (1290.8) |
466 (1316.3) |
326 (905.0) |
306 (837.6) |
| Ontario | 3,966 (30.2) |
4,205 (31.7) |
4,097 (30.5) |
4,540 (33.5) |
5,840 (42.7) |
5,932 (43.0) |
| PrinceEdward Island | 0 (0.0) |
11 (7.6) |
8 (5.5) |
6 (4.1) |
7 (4.8) |
10 (6.8) |
| Quebec | 2,054 (25.9) |
1,864 (23.3) |
2,219 (27.4) |
2,642 (32.4) |
3,312 (40.3) |
3,927 (47.5) |
| Saskatchewan | 763 (72.6) |
758 (71.1) |
1,018 (93.7) |
1,213 (109.8) |
1,240 (110.6) |
957 (84.5) |
| Yukon | 31 (89.6) |
6 (16.9) |
9 (25.0) |
10 (27.5) |
49 (132.9) |
113 (302.2) |
| Canada | 11,386 (33.5) |
11,986 (34.9) |
13,036 (37.5) |
14,234 (40.5) |
16,289 (45.8) |
19,845 (55.4) |
Discussion
After a sharp decrease from the early 1980s to the 1990s, gonorrhea rates rose in Canada in the late 1990s and continued to rise among both males and females in almost all age groups, from 2010 to 2015. Other countries have had similar trends. For example, the United States of America (USA) saw a rate increase of 22.2% in males and 13.8% in females from 2015 to 2016Footnote 12Footnote 13. In line with the trend seen in 2012-2014, in 2015 Canada had the lowest reported rate of gonorrhea compared with the USA, Australia and England (55.4 cases per 100,000 versus 123.9, 79.7 and 75.3 cases per 100,000, respectively) Footnote 13Footnote 14Footnote 15.
Several factors may help explain the apparent increase in gonorrhea rates. The introduction of a more sensitive diagnostic tool, Nucleic Acid Amplification Test (NAAT), has significantly increased the number of cases detected Footnote 16. Moreover, Canadian and other national treatment guidelines have emphasized the importance of screening at other anatomical sites (oropharyngeal and rectal infections) in some populations, which may have increased the number of cases detectedFootnote 2.
Along with improved screening and detection, antimicrobial resistance to first-line medications also contributes to the high rates of gonorrheaFootnote 17. Gonococcal infections have recently shown resistance or decreased susceptibility to all of the antibiotics commonly used for treatment in Canada, including penicillins, tetracyclines, macrolides and quinolonesFootnote 8Footnote 18. Antimicrobial resistance can lead to ineffective treatment and ongoing transmission of the uncured infection. A study conducted in the USA reported higher antibiotic resistance among men who have sex with men (MSM)Footnote 19. Higher gonorrhea antimicrobial resistance may have contributed to the rate increase in Canadian men. Canadian treatment guidelines for gonorrhea have been updated frequently in the past five years to account for new information on antimicrobial resistance to N. gonorrhoeae. However, a recent Ontario study has shown poor adherence to gonorrhea treatment guidelinesFootnote 20. Ineffective treatment affects the patient and may increase the transmission of resistant strainsFootnote 17. Monitoring of resistant strains has proven more challenging due to the increased use of NAAT for screening. The NAAT is a diagnostic tool that does not allow for antimicrobial susceptibility assessment. However, new molecular testing methods using polymerase chain reaction (PCR), single nucleotide polymorphism or sequencing to identify resistance are being explored to improve the screening of resistant strains of gonorrheaFootnote 21Footnote 22.
Unlike chlamydia, most cases of gonorrhea in Canada were reported among men, like in the USA, Australia and EnglandFootnote 13Footnote 14Footnote 15. However, in Canada, gonorrhea rates were higher in females aged less than 20 than in men the same age.
The rising gonorrhea rates among men can be explained partly by rapidly increasing rates of gonorrhea in the MSM populationFootnote 23Footnote 24. Literature findings show that some MSM have adopted changes in their sexual behaviour, such as seroadaptation, as a harm reduction strategy for HIV infectionFootnote 25. Seroadaptation includes serosorting, defined as choosing a sexual partner known to be of the same HIV serostatus to engage in unprotected sex, in order to reduce the risk of acquiring or transmitting HIVFootnote 25. However, these behaviours potentially increase their risk of contracting other STIsFootnote 25Footnote 26. Another factor that may explain the increased rates in males would be the fact that gonorrhea tends to be symptomatic more often in males than in females, which may motivate men to seek health care more often, and consequently, get diagnosedFootnote 23. High rates among females under 20 are particularly worrisome given that infertility is a potential outcome of gonorrhea infection, which may result in substantial psychosocial and economic costs.
Gonorrhea rates seem to be rising at a faster rate in older than in younger cohorts. This may be because ageing comes with natural physiological changes (vaginal drying), psychosocial changes (loss of a partner) and behavioural changes (increases in risky behaviour due to loss of fear of pregnancy), all of which can make older adults more susceptible to contracting STIsFootnote 27Footnote 28.
Strengths and limitations
This surveillance report presents national data on gonorrhea with information collected by all provinces and territories. Moreover, it describes rates over a six-year period.
Some limitations of the data should be noted. Data presented in this report likely underestimate the incidence rate of gonorrhea as some infections may be asymptomatic, unscreened, undiagnosed or unreported. Screening, laboratory testing and reporting practices are heterogeneous across provinces and territories. Therefore, direct comparisons between provinces and territories should be made with caution. Common barriers to reporting include lack of knowledge about which diseases to report, time required for notification and perception of the severity of the diseaseFootnote 29Footnote 30. However, as comprehensive incidence and prevalence studies are rare, the reported case rates provide valuable information on trends of disease and on minimum incidence rates.
Reinfections are common for gonorrhea, and more than one infection may have occurred and been reported for a given individual. Thus, the true number of infected people may be lower than the number of cases reported. In addition, information on risk factors is unavailable in the CNDSS, limiting our ability to identify factors associated with higher gonorrhea rates.
The absence of statistical analysis in this surveillance report is a limitation. As rates were not age-standardized, changes in rates over the past three decades might be due partly to changes in the age structure of the provinces and territories and in Canada in general.
Conclusion
Gonorrhea rates in Canada rose by 65.4% between 2010 and 2015. Males continue to have higher rates than females. Studies indicate that more sensitive testing and antimicrobial resistance may account for a portion of the increase in cases. Ongoing monitoring of gonorrhea rates and antimicrobial resistance will help adjust current recommendations for treatment. Risk factor data would be useful in improving surveillance. Research and surveillance data are needed to better understand the current gonorrhea epidemic in order to maintain, evaluate and improve primary and secondary STI prevention activities including safer-sex awareness campaigns, screening, case finding and partner notification.
Authors' statement
YC – Conceptualization, methodology, writing – original draft
JM – Software, data collection and curation, validation, formal analysis, visualization, writing – review and editing
JS – Writing – original draft, visualization
AL – Validation, formal analysis, visualization, writing – review and editing
JA – Conceptualization, writing – original draft
Conflict of interest
None.
Contributors
Chris Archibald: Supervision, writing – review and editing, resources, project administration
Jennifer Siushansian: writing – review and editing
Acknowledgements
It would not have been possible to publish this report without the continuous and greatly appreciated contribution of all provinces and territories to STI national surveillance.
Funding
This work was supported by the Public Health Agency of Canada.
Appendix: Case definition of confirmed case of gonorrhea
Laboratory evidence of genital, extra–genital or perinatally acquired infections:
- detection of Neisseria gonorrhoeae by culture
OR - detection of Neisseria gonorrhoeae nucleic acid