
TB trend in Canada from 2008–2018

 Download this article as a PDF
Published by: The Public Health Agency of Canada
Issue: Volume 46–1: Antimicrobial resistance (AMR)
Date published: January 2, 2020
ISSN: 1481-8531
Submit a manuscript
About CCDR
Browse
Volume 46–1, January 2, 2020: Antimicrobial resistance (AMR)
Surveillance
Tuberculosis drug resistance in Canada: 2018
Marie LaFreniere1, Demy Dam1,2, Canadian Tuberculosis Laboratory Technical Network3, Lori Strudwick4, Sarah McDermott1
Affiliations
1 Centre for Communicable Disease and Infection Control, Public Health Agency of Canada, Ottawa, ON
2 Department of Epidemiology, Biostatistics and Occupational Health, McGill University, Montreal, QC
3 Canadian Tuberculosis Laboratory Technical Network
4 Government of Yukon, Health and Social Services, Yukon Communicable Disease Control, Whitehorse, YT
Note: Network members are noted under Contributors at the end of the paper
Correspondence
Suggested citation
LaFreniere M, Dam D, Canadian Tuberculosis Laboratory Technical Network, Strudwick L, McDermott S. Tuberculosis drug resistance in Canada: 2018. Can Commun Dis Rep 2020;46(1):10-6. https://doi.org/10.14745/ccdr.v46i01a02
Keywords: tuberculosis, surveillance, drug resistance, Canada
Abstract
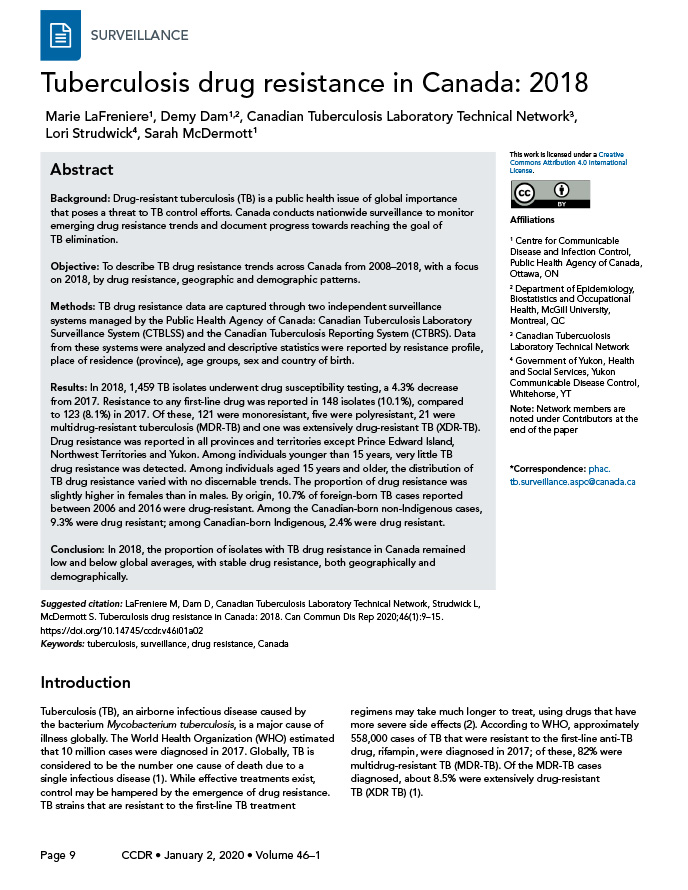
Background: Drug-resistant tuberculosis (TB) is a public health issue of global importance that poses a threat to TB control efforts. Canada conducts nationwide surveillance to monitor emerging drug resistance trends and document progress towards reaching the goal of TB elimination.
Objective: To describe TB drug resistance trends across Canada from 2008–2018, with a focus on 2018, by drug resistance, geographic and demographic patterns.
Methods: TB drug resistance data are captured through two independent surveillance systems managed by the Public Health Agency of Canada: Canadian Tuberculosis Laboratory Surveillance System (CTBLSS) and the Canadian Tuberculosis Reporting System (CTBRS). Data from these systems were analyzed and descriptive statistics were reported by resistance profile, place of residence (province), age groups, sex and country of birth.
Results: In 2018, 1,459 TB isolates underwent drug susceptibility testing, a 4.3% decrease from 2017. Resistance to any first-line drug was reported in 148 isolates (10.1%), compared to 123 (8.1%) in 2017. Of these, 121 were monoresistant, five were polyresistant, 21 were multidrug-resistant tuberculosis (MDR-TB) and one was extensively drug-resistant TB (XDR-TB). Drug resistance was reported in all provinces and territories except Prince Edward Island, Northwest Territories and Yukon. Among individuals younger than 15 years, very little TB drug resistance was detected. Among individuals aged 15 years and older, the distribution of TB drug resistance varied with no discernable trends. The proportion of drug resistance was slightly higher in females than in males. By origin, 10.7% of foreign-born TB cases reported between 2006 and 2016 were drug-resistant. Among the Canadian-born non-Indigenous cases, 9.3% were drug resistant; among Canadian-born Indigenous, 2.4% were drug resistant.
Conclusion: In 2018, the proportion of isolates with TB drug resistance in Canada remained low and below global averages, with stable drug resistance, both geographically and demographically.
Introduction
Tuberculosis (TB), an airborne infectious disease caused by the bacterium Mycobacterium tuberculosis, is a major cause of illness globally. The World Health Organization (WHO) estimated that 10 million cases were diagnosed in 2017. Globally, TB is considered to be the number one cause of death due to a single infectious diseaseFootnote 1. While effective treatments exist, control may be hampered by the emergence of drug resistance. TB strains that are resistant to the first-line TB treatment regimens may take much longer to treat, using drugs that have more severe side effectsFootnote 2. According to WHO, approximately 558,000 cases of TB that were resistant to the first-line anti-TB drug, rifampin, were diagnosed in 2017; of these, 82% were multidrug-resistant TB (MDR-TB). Of the MDR-TB cases diagnosed, about 8.5% were extensively drug-resistant TB (XDR-TB)Footnote 1.
In September 2018, the United Nations General Assembly gathered for the first high-level meeting on TB. At this meeting, Member States reaffirmed their commitment to end the global TB epidemic by 2030Footnote 3. Created as a result of this meeting, the Political Declaration recognizes that drug-resistant TB has a significant impact on global health and, if this issue is not adequately addressed, any progress made on TB elimination could be reversedFootnote 4. While the proportion of TB isolates with drug resistance in Canada has remained low over the preceding decadeFootnote 5, it is important to maintain the epidemiologic surveillance of drug-resistant TB in order to monitor of the evolution of drug-resistant TB in Canada, and inform public health officials on necessary appropriate actions. In addition, the data contribute to monitoring Canada’s progress towards eliminating TB and to measuring the global burden of drug-resistant TB.
The Canadian Tuberculosis Standards recommend that all culture-positive TB isolates in Canada undergo drug susceptibility testing to determine the best course of anti-TB drug treatment for that particular caseFootnote 2. These data can also be used for surveillance of drug-resistant TB. The Canadian Tuberculosis Laboratory Surveillance System (CTBLSS) was implemented in 1998 with the goal of monitoring emerging trends and patterns in TB drug resistance in CanadaFootnote 6. The Canadian Tuberculosis Reporting System (CTBRS), a case-based surveillance system that maintains nonnominal demographic and clinical data on people diagnosed with active TB disease in Canada.
The objective of this report is to describe drug-resistant TB trend across Canada from 2008–2018, with a focus on 2018, as well as the geographic and demographic patterns.
Methods
Data sources
Data were derived and analyzed from two surveillance systems, the CTBLSS and the CTBRS.
The CTBLSS is an isolate-based laboratory surveillance system used to monitor TB drug resistance across Canada. (For definitions of types of TB drug resistance patterns, see Table 1.) Every year, provincial TB laboratories voluntarily submit results of culture-based, phenotypic drug susceptibility testing of isolates from cases with culture-positive TB from the previous calendar year. Basic nonnominal demographic data (sex, age and province/territory of residence) of the cases are also collected. Further details on the CTBLSS methods on data collection, data management and other laboratory processes have been previously describedFootnote 6. For this report, data were available up to and including 2018.
| Type of resistance | Definition |
|---|---|
| Monoresistance | Resistance to one first-line anti-TB drug only (isoniazid, rifampin, ethambutol or pyrazinamide) |
| Polyresistance | Resistance to more than one first-line anti-TB drug, not including the combination of isoniazid and rifampin |
| Multidrug-resistant tuberculosis (MDR-TB) | Resistance to isoniazid and rifampin with or without resistance to other anti-TB drugs |
| Extensively drug-resistant tuberculosis (XDR-TB) | Resistance to isoniazid and rifampin AND any fluoroquinolone and at least one of the three injectable second-line drugs (amikacin, capreomycin or kanamycin) |
Any TB isolates demonstrating positive cultures of M. tuberculosis complex (M. tuberculosis, M. africanum, M. canetti, M. caprae, M. microti, M. pinnipedii or M. bovis) were included in the analyses. Isolates positive for M. bovis Bacillus Calmette-Guérin (BCG) were excluded as these represent a complication of TB vaccination often found in immunocompromised patients and this strain is not infectious.
While the CTBLSS collects data on M. tuberculosis isolates, the CTBRS is a case-based surveillance system with information on active and retreatment TB cases in Canada. The CTBRS collects drug resistance data on TB cases when provincial and territorial health authorities report these cases to the Public Health Agency of Canada.
In this article, the researchers use data from CTBRS to describe TB drug resistance by country of birth, with Canadian-born further stratified by Indigenous and non-Indigenous. Further details on the CTBRS system have been previously describedFootnote 7. For this report, data were available up to and including 2016.
Data analysis
To the extent possible, potential duplicates were identified using demographic information (sex, date of birth or age, and the province/territory). Potential duplicates, along with any missing data, were subsequently clarified with the submitting laboratories. Following tabulation of the data, isolate counts were sent to provinces and territories for verification to ensure accuracy. Data were cleaned and analyzed using SAS Enterprise Guide 5.1 (Cary, North Carolina, United States (US)) and Microsoft Excel 2010 (Redmond, Washington, US).
Descriptive statistics of the data, by drug resistance, geographic and demographic patterns, were computed and compared with trends from the previous 10 years. No statistical methods were used for comparative analyses. Supplementary data tables are available upon request (see Appendix for the list of tables).
Results
TB drug resistance profiles in 2018
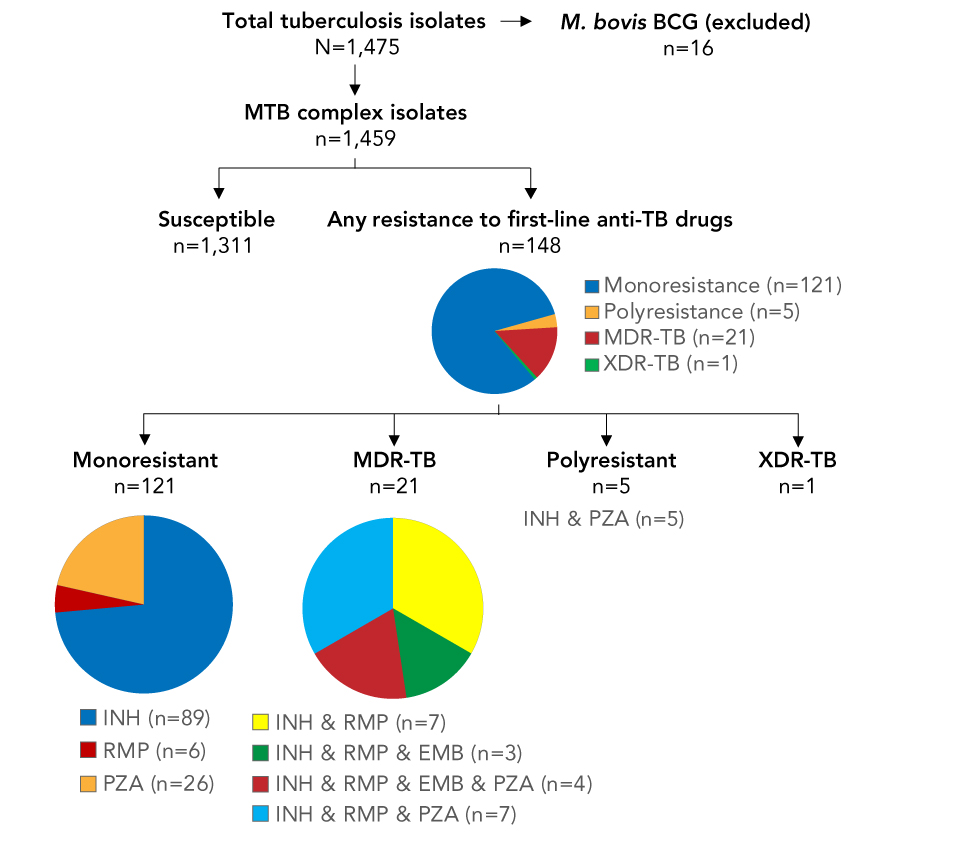
In 2018, 1,475 M. tuberculosis isolates were submitted for drug resistance testing. Of these, 16 were determined to be M. bovis BCG strain and were excluded from further analysis. The majority of isolates, 1,311 (89.9%), were susceptible to all first-line anti-TB drugs, and the remaining 148 (10.1%) isolates were resistant to one or more drugs. The majority were monoresistant (81.8%, n=121), with isoniazid monoresistance the most commonly reported resistance pattern (n=89), followed by pyrazinamide monoresistance (n=26) and rifampin monoresistance (n=6). Polyresistance was identified in five isolates; these were all resistant to the combination of isoniazid and pyrazinamide. MDR-TB was detected in 21 isolates and XDR-TB in one (Figure 1).
Figure 1: Tuberculosis isolates tested for anti-TB drug susceptibility, Canada, 2018
Text description: Figure 1
Figure 1: Tuberculosis isolates tested for anti-TB drug susceptibility, Canada, 2018
Figure 1 is a flowchart depicting the number of tuberculosis isolates tested for anti-TB drug susceptibility and results for Canada in 2018. The top of the figure begins with the total TB isolates N=1,475, with an arrow pointing to the right M. bovis BCG (excluded) n=16. Immediately below the total isolates text is a right arrow pointing down to MTB complex isolates n=1,459. Immediately below, it branches off into two arrows. The left arrow identifies Susceptible n=1,311, and the right arrow identifies any resistance to first line anti-TB drugs n=148. Immediately below the TB-Drugs n=148, is a pie chart. The pie chart has four colors; blue signifies Monoresistance n=121, yellow for Polyresistance n=5, red for MDR-TB n=21 and green for XDR-TB n=1. From this pie chart, it branches off into four arrows. From the left Monoresistance n=121 with a pie chart immediately below with three colored sections: blue for IHN n=89, red for RMP n=6 and yellow for PZA n=26. Second arrow from the left is MDR-TB n=21 with a pie chart immediately below broken into four colors; orange INH & RMP n=7, green INH & RMP & EMB n=3, red INH & RMP &EMB & PZA n=4 and blue INH & RMP & PZA n=7. Third arrow from the left is Polyresistance n=5 with INH & PZA n=5 immediately below. The fourth arrow is XDR-TB n=1.
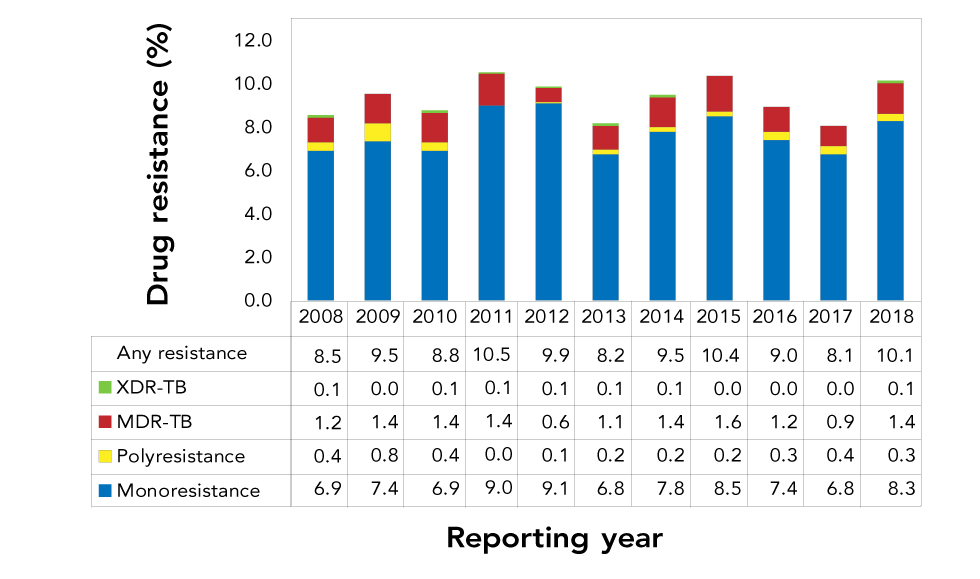
Between 2008 and 2018, the proportion of TB isolates with drug resistance in Canada changed little (Figure 2). The proportion of isolates resistant to anti-TB drugs fluctuated from year to year, but remained within a narrow range of values (8.1%–10.5%). During this time period, proportions of monoresistance ranged from 6.8% to 9.1%, polyresistance from 0.0% to 0.8%, MDR-TB from 0.6% to 1.6% and XDR-TB from 0.0% to 0.1%. A total of seven XDR-TB isolates were detected during this time frame and never were there more than one per year (Figure 2).
Figure 2: Proportion of tuberculosis isolates with reported drug resistance, by drug resistance pattern, Canada, 2008–2018
Text description: Figure 2
Figure 2: Proportion of tuberculosis isolates with reported drug resistance, by drug resistance pattern, Canada, 2008–2018
| Resistance pattern | 2008 | 2009 | 2010 | 2011 | 2012 | 2013 | 2014 | 2015 | 2016 | 2017 | 2018 |
|---|---|---|---|---|---|---|---|---|---|---|---|
| Monoresistance | 6.9 | 7.4 | 6.9 | 9.0 | 9.1 | 6.8 | 7.8 | 8.5 | 7.4 | 6.8 | 8.3 |
| Polyresistance | 0.4 | 0.8 | 0.4 | 0.0 | 0.1 | 0.2 | 0.2 | 0.2 | 0.3 | 0.4 | 0.3 |
| MDR-TB | 1.2 | 1.4 | 1.4 | 1.4 | 0.6 | 1.1 | 1.4 | 1.6 | 1.2 | 0.9 | 1.4 |
| XDR-TB | 0.1 | 0.0 | 0.1 | 0.1 | 0.1 | 0.1 | 0.1 | 0.0 | 0.0 | 0.0 | 0.1 |
| Any resistance | 8.5 | 9.5 | 8.8 | 10.5 | 9.9 | 8.2 | 9.5 | 10.4 | 9.0 | 8.1 | 10.1 |
Geographic distribution of TB drug-resistant cases
In 2018, the majority of isolates that underwent drug susceptibility testing were from Ontario (n=546; 37.4%), followed by British Columbia (n=255; 17.5%), Quebec (n=213; 14.6%), Alberta (n=161; 11.0%) and Manitoba (n=149; 10.2%). The Atlantic provinces (Newfoundland and Labrador, Prince Edward Island, Nova Scotia and New Brunswick) as well as the territories (Yukon, the Northwest Territories and Nunavut) recorded between zero and two isolates with any anti-TB drug resistance each (Table 2).
| P/T | Total isolates | Any resistance | Monoresistance | Polyresistance | MDR-TB | XDR-TB | ||||||
|---|---|---|---|---|---|---|---|---|---|---|---|---|
| n | % | n | % | n | % | n | % | n | % | n | % | |
| NL | 18 | 1.2 | 1 | 5.6 | 1 | 5.6 | 0 | 0.0 | 0 | 0.0 | 0 | 0.0 |
| PE | 2 | 0.1 | 0 | 0.0 | 0 | 0.0 | 0 | 0.0 | 0 | 0.0 | 0 | 0.0 |
| NS | 8 | 0.5 | 2 | 25.0 | 2 | 25.0 | 0 | 0.0 | 0 | 0.0 | 0 | 0.0 |
| NB | 6 | 0.4 | 1 | 16.7 | 0 | 0.0 | 0 | 0.0 | 1 | 16.7 | 0 | 0.0 |
| QC | 213 | 14.6 | 25 | 11.7 | 23 | 10.8 | 1 | 0.5 | 1 | 0.5 | 0 | 0.0 |
| ON | 546 | 37.4 | 68 | 12.5 | 54 | 9.9 | 1 | 0.2 | 13 | 2.4 | 0 | 0.0 |
| MB | 149 | 10.2 | 10 | 6.7 | 9 | 6.0 | 0 | 0.0 | 1 | 0.7 | 0 | 0.0 |
| SK | 59 | 4.0 | 8 | 13.6 | 6 | 10.2 | 1 | 1.7 | 0 | 0.0 | 1 | 1.7 |
| AB | 161 | 11.0 | 9 | 5.6 | 5 | 3.1 | 1 | 0.6 | 3 | 1.9 | 0 | 0.0 |
| BC | 255 | 17.5 | 23 | 9.0 | 20 | 7.8 | 1 | 0.4 | 2 | 0.8 | 0 | 0.0 |
| YK | 3 | 0.2 | 0 | 0.0 | 0 | 0.0 | 0 | 0.0 | 0 | 0.0 | 0 | 0.0 |
| NT | 3 | 0.2 | 0 | 0.0 | 0 | 0.0 | 0 | 0.0 | 0 | 0.0 | 0 | 0.0 |
| NU | 36 | 2.5 | 1 | 2.8 | 1 | 2.8 | 0 | 0.0 | 0 | 0.0 | 0 | 0.0 |
| Total | 1,459 | 100.0 | 148 | 10.1 | 121 | 8.3 | 5 | 0.3 | 21 | 1.4 | 1 | 0.1 |
The highest number of resistant isolates were recorded by Ontario (n=68), Quebec (n=25) and British Columbia (n=23), which together accounted for about 78.4% (n=116) of reported drug-resistant isolates (Table 2). Resistance to any anti-TB drug was slightly higher than the Canadian average (10.1%) in Saskatchewan (13.6%), Ontario (12.5%) and Quebec (11.7%), and lower in British Columbia (9.0%), Manitoba (6.7%), Newfoundland and Labrador (5.6%), Alberta (5.6%) and Nunavut (2.7%). No drug resistance was reported in Prince Edward Island, Northwest Territories and Yukon.
Of all isolates that were MDR-TB in 2018, Ontario reported the most (n=13), followed by Alberta (n=3) and British Columbia (n=2). New Brunswick, Quebec and Manitoba reported one MDR-TB isolate each. The one XDR-TB isolate reported in 2018 was reported in Saskatchewan.
Tuberculosis drug resistance cases by age group
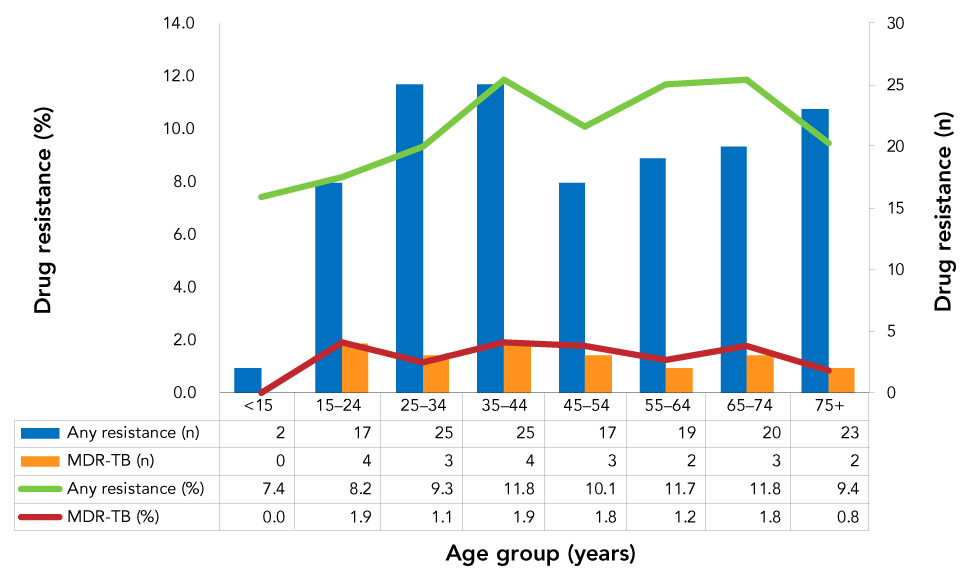
Of all eligible isolates submitted (n=1,459) for drug susceptibility testing in 2018, only 1.9% (n=27) were from individuals less than 15 years of age. The distribution of isolates across other age groups ranged from 11.2% (n=163) in the 55–64 years old age group to 18.4% (n=268) from individuals in the 25–34 years old age group.
The proportion of isolates with any resistance to anti-TB drugs was 7.4% (n=2) among individuals aged less than 15 years; however, none of these isolates was multidrug resistant (Figure 3). Among individuals aged over 14 years, the proportion of isolates with any resistance to anti-TB drugs ranged from 8.2% (15–24 years of age) to 11.8% (35–44 and 65–74 years of age). The proportion identified as MDR-TB (Figure 3) ranged from 0.8% (n=2) in individuals age 75 years and over to 1.9% (n=4) in individuals within the age ranges of 15–24 and 35–44 years.
Figure 3: Number and proportion of tuberculosis isolates with reported drug resistance, by age group and resistance pattern, Canada, 2018
Text description: Figure 3
Figure 3: Number and proportion of tuberculosis isolates with reported drug resistance, by age group and resistance pattern, Canada, 2018
| Age group | Any resistance (%) | MDR-TB (%) | Any resistance (n) | MDR-TB (n) |
|---|---|---|---|---|
| <15 | 7.4 | 0.0 | 2 | 0 |
| 15–24 | 8.2 | 1.9 | 17 | 4 |
| 25–34 | 9.3 | 1.1 | 25 | 3 |
| 35–44 | 11.8 | 1.9 | 25 | 4 |
| 45–54 | 10.1 | 1.8 | 17 | 3 |
| 55–64 | 11.7 | 1.2 | 19 | 2 |
| 65–74 | 11.8 | 1.8 | 20 | 3 |
| 75+ | 9.4 | 0.8 | 23 | 2 |
Tuberculosis drug resistance by sex
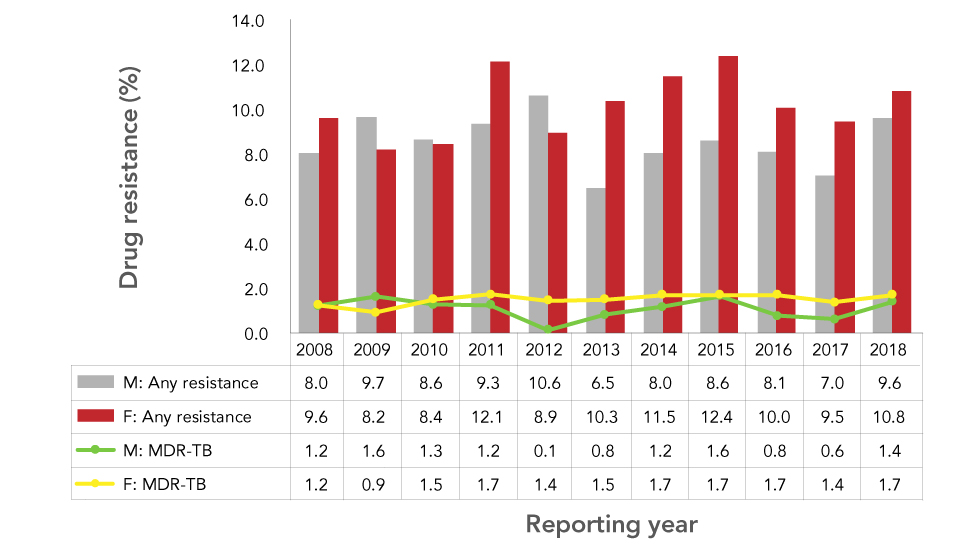
Of the isolates submitted for drug susceptibility testing in 2018, 54.9% (n=801) were from males and 45.0% (n=657) from females. The sex of the case was not reported for one isolate. The proportions of isolates with drug-resistant TB was similar in both sexes. Among males, 9.6% (n=77) of TB isolates had any resistance to first-line anti-TB drugs and 1.4% (n=11) were MDR-TB. Among females, 10.8% (n=71) had any resistance, and 1.5% (n=10) were MDR-TB. These findings are consistent with the trend from the previous five years (2013–2017), where the proportions of any drug resistance were higher in females than in males (Figure 4).
Figure 4: Percentage of tuberculosis isolates with reported drug resistance, by sex and resistance pattern, Canada, 2008–2018
Text description: Figure 4
Figure 4: Percentage of tuberculosis isolates with reported drug resistance, by sex and resistance pattern, Canada, 2008–2018
| Year | Male: Any resistance |
Female: Any resistance |
Male: MDR-TB |
Female: MDR-TB |
|---|---|---|---|---|
| 2008 | 8.0 | 9.6 | 1.2 | 1.2 |
| 2009 | 9.7 | 8.2 | 1.6 | 0.9 |
| 2010 | 8.6 | 8.4 | 1.3 | 1.5 |
| 2011 | 9.3 | 12.1 | 1.2 | 1.7 |
| 2012 | 10.6 | 8.9 | 0.1 | 1.4 |
| 2013 | 6.5 | 10.3 | 0.8 | 1.5 |
| 2014 | 8.0 | 11.5 | 1.2 | 1.7 |
| 2015 | 8.6 | 12.4 | 1.6 | 1.7 |
| 2016 | 8.1 | 10.0 | 0.8 | 1.7 |
| 2017 | 7.0 | 9.5 | 0.6 | 1.4 |
| 2018 | 9.6 | 10.8 | 1.4 | 1.7 |
Tuberculosis drug resistance by country of birth
From 2006 through 2016, isolates from Canadians born abroad expressed a higher level of resistance to any anti-TB drugs (n=1,086 of 10,110 isolates; 10.7%) compared to those from Canadians born in Canada (n=211 of 4,373 isolates; 4.8%). The proportions of MDR-TB isolates followed a similar pattern; 1.4% (n=148) of those from Canadians born abroad and 0.2% (n=7) of those from Canadians born in Canada were MDR-TB. Differences in drug resistance proportions were also detected among different subgroups of Canadian-born cases. From 2006 through 2016, 2.4% (n=68 of 2,822 isolates) of the TB cases among Canadian-born Indigenous people were resistant to any of the first-line anti-TB drugs, and none of these cases were MDR-TB. Among non-Indigenous Canadian-born TB cases, 9.3% (n=145 of 1,551 isolates) were resistant to at least one first-line anti-TB drug; and of these, 4.8% (n=7) were MDR-TB.
Discussion
In 2018, the proportion of drug resistance among culture-positive TB isolates in Canada remained low. Although the percentage of isolates with any reported anti-TB drug resistance increased from 8.1% in 2017 to 10.1% in 2018, the reported proportion was not out of the range observed (8.1%–10.5%) over the last 10 years. No new trends were noted with respect to age, sex or country of birth. Of note, there was one XDR-TB isolate reported in Canada in 2018. While this is the first to be reported since 2014, it is not unusual to see one in a given year, as single XDR-TB isolates were reported in six of the years over the past decade. In 2017, WHO estimated that 3.5% of new TB cases globally had rifampin resistance or were MDR-TBFootnote 2. Canadian statistics are significantly below these estimations as can be observed in the 2018 results, which registered only 1.8% of isolates resistant to rifampin or MDR-TB.
Limitations
The CTBLSS is the result of a successful collaboration between federal, provincial and territorial governments and public health laboratories. As the primary source of national data on TB drug resistance in Canada, the data in this report provide information for public health action, as well as policy and program development and assessment. Nonetheless, a few limitations should be considered when interpreting these results.
It is important to note that because the CTBLSS is a laboratory-based surveillance system, limited demographic information is available, and the isolates reported cannot be directly linked to case-based surveillance data from the CTBRS. Drug resistance information reported in CTBRS has been shown to be fairly completeFootnote 8 and reasonably comparable to the CTBLSS, although some discrepancies may exist that cannot be resolved. Future efforts to enhance TB surveillance include investigating the possibility of linking these two surveillance systems to provide detailed epidemiologic data on cases of drug-resistant TB, and more in-depth analyses and detailed interpretations.
Even though the overall number of cases of TB globally and in Canada among children under the age of 15 is lowFootnote 9, the data in this report may still underrepresent the proportion of drug-resistant TB in this age group, as it is difficult to obtain sputum specimens in young children for culture-based drug susceptibility testing.
Conclusion
In 2018, the proportion of isolates with TB drug resistance remained relatively stable and below global averages across Canadian demographics and geographic locations.
Authors’ statement
- ML — Conceptualization, methodology, software, validation, formal analysis, writing (original draft)
- DD — Conceptualization, software, validation, formal analysis, writing (review) and editing, visualization
- LS — Validation, writing (review) and editing
- SM — Conceptualization, writing (review) and editing, supervision
Conflict of interest
None.
Contributors
The Surveillance and Epidemiology Division, Centre for Communicable Diseases and Infection Control at the Public Health Agency of Canada would like to acknowledge the teams at the Canadian Tuberculosis Laboratory Technical Network for their contribution to and participation in the Canadian Tuberculosis Laboratory Surveillance System (CTBLSS):
Canadian Tuberculosis Laboratory Technical Network members: H Adam, PM Akochy, R Bittner, K Cronin, D Farrell, D Haldane, H Hannah, F Jamieson, H Mackenzie, E Martin, R Needle, K Ray, M Rodrigues, I Sekirov, C Shandro, H Soualhine, R Thomas, G Tyrrell.
Funding
This work was supported by the Public Health Agency of Canada as part of its core mandate.
Appendix: List of supplementary tables available upon request
-
Supplementary Table 1: Total number and percentage of Mycobacterium tuberculosis complex isolates identified with any resistance, as multidrug and extensively drug resistant, by year, 2008–2018, Canada
-
Supplementary Table 2: Overall pattern of reported tuberculosis drug resistance in Canada, 2008 to 2018
-
Supplementary Table 3: Results for routine to anti-tuberculosis drug susceptibility testing of Mycobacterium tuberculosis complex isolates originating from Alberta, 2008 to 2018
-
Supplementary Table 4: Results for routine to anti-tuberculosis drug susceptibility testing of Mycobacterium tuberculosis complex isolates originating from British Columbia, 2008 to 2018
-
Supplementary Table 5: Results for routine to anti-tuberculosis drug susceptibility testing of Mycobacterium tuberculosis complex isolates originating from Manitoba, 2008 to 2018
-
Supplementary Table 6: Results for routine to anti-tuberculosis drug susceptibility testing of Mycobacterium tuberculosis complex isolates originating from New Brunswick, 2008 to 2018
-
Supplementary Table 7: Results for routine to anti-tuberculosis drug susceptibility testing of Mycobacterium tuberculosis complex isolates originating from Newfoundland and Labrador, 2008 to 2018
-
Supplementary Table 8: Results for routine to anti-tuberculosis drug susceptibility testing of Mycobacterium tuberculosis complex isolates originating from Northwest Territories, 2008 to 2018
-
Supplementary Table 9: Results for routine to anti-tuberculosis drug susceptibility testing of Mycobacterium tuberculosis complex isolates originating from Nova Scotia, 2008 to 2018
-
Supplementary Table 10: Results for routine to anti-tuberculosis drug susceptibility testing of Mycobacterium tuberculosis complex isolates originating from Nunavut, 2008 to 2018
-
Supplementary Table 11: Results for routine to anti-tuberculosis drug susceptibility testing of Mycobacterium tuberculosis complex isolates originating from Ontario, 2008 to 2018
-
Supplementary Table 12: Results for routine to anti-tuberculosis drug susceptibility testing of Mycobacterium tuberculosis complex isolates originating from Prince Edward Island, 2008 to 2018
-
Supplementary Table 13: Results for routine to anti-tuberculosis drug susceptibility testing of Mycobacterium tuberculosis complex isolates originating from Quebec, 2008 to 2018
-
Supplementary Table 14: Results for routine to anti-tuberculosis drug susceptibility testing of Mycobacterium tuberculosis complex isolates originating from Saskatchewan, 2008 to 2018
-
Supplementary Table 15: Results for routine to anti-tuberculosis drug susceptibility testing of Mycobacterium tuberculosis complex isolates originating from Yukon, 2008 to 2018
-
Supplementary Table 16: Multidrug-resistant tuberculosis and extensively drug-resistant tuberculosis isolates by province/territory of origin, 2018
-
Supplementary Table 17: Total number of Mycobacterium tuberculosis complex isolates by reporting and originating province/territory, 2018
-
Supplementary Table 18: Provincial/territorial breakdown by any resistance, multidrug-resistant tuberculosis and extensively drug-resistant tuberculosis in Canada, 2008 to 2018
-
Supplementary Table 19: Tuberculosis drug resistance by sex and age group in Canada, 2018
