
Contact tracing of COVID-19 transmission during restrictive closures in Canada

 Download this article as a PDF
Published by: The Public Health Agency of Canada
Issue: Volume 46-11/12: Oral Health in Canada
Date published: November 5, 2020
ISSN: 1481-8531
Submit a manuscript
About CCDR
Browse
Volume 46-11/12, November 5, 2020: Oral Health in Canada
Overview
Assessing the impact of varying levels of case detection and contact tracing on COVID-19 transmission in Canada during lifting of restrictive closures using a dynamic compartmental model
Antoinette Ludwig1, Philippe Berthiaume1, Heather Orpana2,3, Claude Nadeau4, Maikol Diasparra4, Joel Barnes4, Deirdre Hennessy4,5, Ainsley Otten4,6, Nicholas Ogden1
Affiliations
1 Public Health Risk Sciences Division, Public Health Agency of Canada, St-Hyacinthe, QC
2 Centre for Surveillance and Applied Research, Public Health Agency of Canada, Ottawa, ON
3 School of Epidemiology and Public Health, University of Ottawa, Ottawa, ON
4 Health Analysis Division, Statistics Canada, Ottawa, ON
5 Department of Community Health Sciences, University of Calgary, Calgary, AB
6 Public Health Risk Sciences Division, Public Health Agency of Canada, Guelph, ON
Correspondence
Suggested citation
Ludwig A, Berthiaume P, Orpana H, Nadeau C, Diasparra M, Barnes J, Hennessy D, Otten A, Ogden N. Assessing the impact of varying levels of case detection and contact tracing on COVID-19 transmission in Canada during lifting of restrictive closures using a dynamic compartmental model. Can Commun Dis Rep 2020;46(11/12):409-21. https://doi.org/10.14745/ccdr.v46i1112a08
Keywords: COVID-19, case detection, contact tracing, dynamic compartmental model, Canada
Abstract
Background: The coronavirus disease 2019 (COVID-19) pandemic began with a detected cluster of pneumonia cases in Wuhan, China in December 2019. Endemic transmission was recognized in Canada in early February 2020, making it urgent for public health stakeholders to have access to robust and reliable tools to support decision-making for epidemic management. The objectives of this paper are to present one of these tools-an aged-stratified dynamic compartmental model developed by the Public Health Agency of Canada in collaboration with Statistics Canada-and to model the impact of non-pharmaceutical interventions on the attack rate of COVID-19 infection in Canada.
Methods: This model simulates the impact of different levels of non-pharmaceutical interventions, including case detection/isolation, contact tracing/quarantine and changes in the level of physical distancing in Canada, as restrictive closures began to be lifted in May 2020.
Results: This model allows us to highlight the importance of a relatively high level of detection and isolation of cases, as well as tracing and quarantine of individuals in contact with those cases, in order to avoid a resurgence of the epidemic in Canada as restrictive closures are lifted. Some level of physical distancing by the public will also likely need to be maintained.
Conclusion: This study underlines the importance of a cautious approach to lifting restrictive closures in this second phase of the epidemic. This approach includes efforts by public health to identify cases and trace contacts, and to encourage Canadians to get tested if they are at risk of having been infected and to maintain physical distancing in public areas.
Introduction
The coronavirus disease 2019 (COVID-19) pandemic is a global health threat on a scale that was not seen in a century. The first cases of a cluster of pneumonia in Wuhan, China were reported to the World Health Organization (WHO) on December 31, 2019 with the cause of the outbreak identified as a novel coronavirus (now called severe acute respiratory syndrome coronavirus 2; SARS-CoV-2) on January 7, 2020Footnote 1. Cases were soon detected outside China, with the first case of COVID-19 identified in Canada on January 25, 2020 in a resident who had returned from Wuhan, ChinaFootnote 2Footnote 3. As of September 16, 2020, there have been 28.6 million confirmed cases of COVID-19, and over 900,000 deaths, globallyFootnote 4; within Canada, there have been 139,747 confirmed cases and 9,193 deathsFootnote 3.
A number of researchers have developed dynamic models of COVID-19 transmission to explore the effects of public health interventions for Canadian jurisdictions, including in OntarioFootnote 5Footnote 6Footnote 7 and British Columbia (similar findings have been found in personal communications, Anderson et al. Estimating the impact of COVID-19 control measures using a Bayesian model of physical distancing. medRxiv 2020), while many provinces and territories have released the results of COVID-19 modellingFootnote 8Footnote 9Footnote 10Footnote 11Footnote 12. Given the observed variation in the risk of severe outcomes of COVID-19 by ageFootnote 13Footnote 14, and the need to consider differences in contact and transmission rates amongst age groupsFootnote 15Footnote 16, age stratification is an important consideration for dynamic models of COVID-19. As of early July 2020, only a minority of the models for Canada or its provinces presented in the peer-reviewed or pre-print literature are age-structured (similar findings can be found in personal communications, Tuite et al. Reduced COVID-19-Related Critical Illness and Death, and High Risk of Epidemic Resurgence, After Physical Distancing in Ontario, Canada. medRxiv 2020).
In Canada, public health intervention strategies including physical (social) distancing, case detection and isolation, contact tracing and quarantine of contacts, among othersFootnote 16Footnote 17 have been implemented with the aim of slowing the spread of the epidemic, reducing peak health care demand, reducing the possibility of infection for those most at risk of severe outcomes of the disease and reducing the overall number of deathsFootnote 18. In order to implement and optimize effective interventions, decision-makers in Canada need information on the relative impact of these measures. They also need to assess scenarios for lifting restrictive closures (e.g. stay-at-home orders, workplace, school and university closures, which may have severe economic and non-COVID-19 health impacts), while avoiding resurgence of the epidemic (often termed a "second wave") in a Canadian population that remains largely naïve to this infection.
The objectives of this paper are 1) to present an aged-stratified dynamic compartmental model developed by the Public Health Agency of Canada in collaboration with Statistics Canada and 2) to model the impact of non-pharmaceutical interventions (NPIs) including case detection/isolation, contact tracing/quarantine and changes in the level of physical distancing associated with lifting restrictive closures, on the attack rate of COVID-19 infection in Canada.
Simulations of the epidemic
Model presentation
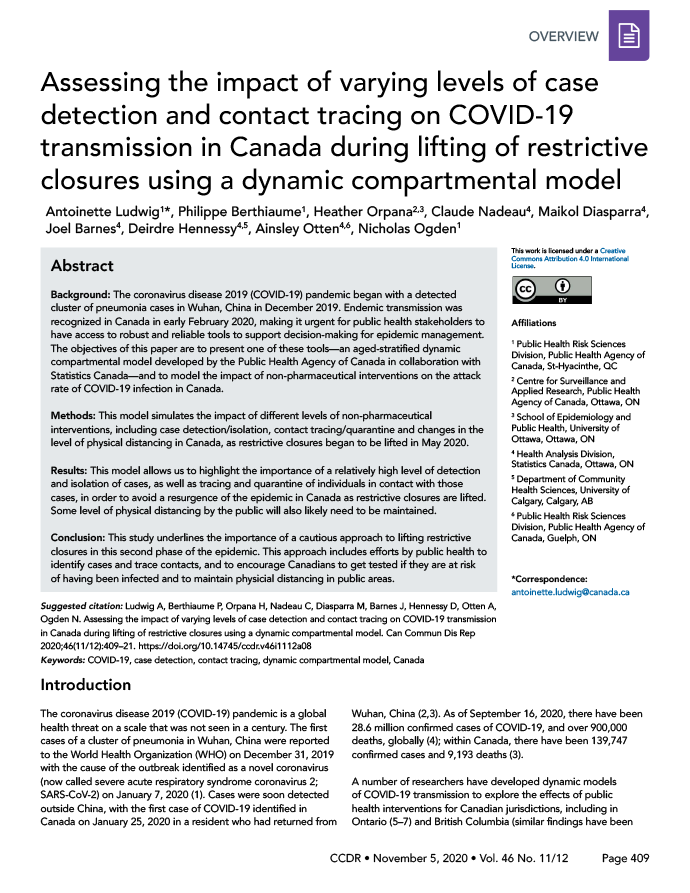
An age-stratified dynamic deterministic compartmental model using the susceptible, exposed, infected, removed framework, was developed and applied to the Canadian population stratified into six age groups. Model states are presented in Figure 1. Transmission between individuals can occur within or between age groups at rates influenced by the daily contact number, based on the matrix projected for Canada by Prem etal.Footnote 19. Individuals in quarantine were assumed to interact with a maximum of one person daily during the course of the quarantine. As the model aimed to explore the epidemic over a short time period (730 days), the model had a closed population with no births or non-COVID-19 related deaths, with a population comprising susceptible people at the beginning of the epidemic. Cases who recovered were assumed not to be susceptible to re-infection during the time period of the model (730 days). The model also assumed the infectivity of presymptomatic infectious individuals who become symptomatic was the same as that of symptomatic individuals, as well as individuals who remained asymptomatic throughout the course of infection. Assuming that all detected cases went into isolation, so case detection was a proxy for isolation (see Table 1). See Appendix A for a description of population flows in the model. While the model includes compartments for hospitalizations, intensive care unit (ICU) admissions, those in ICU on ventilators, and deaths, here are the results of the model for number of cases only. Model equations can be found in Appendix B.
Figure 1: Diagram of the states and flows of the model
Text description: Figure 1
Figure 1: Diagram of the states and flows of the model
Figure 1 shows the states and flows of the model. The susceptible state is the brown box; yellow boxes are latent infection states, blue boxes are detected and isolated case states; green boxes are quarantined contact states; orange boxes are undetected and non-quarantined or isolated case states; red boxes are hospitalized case states, the purple box is the recovered case state, and the grey box indicates deaths. The orange triangles indicate processes by which hospital systems may be overwhelmed if the need for hospital services exceeds available resources. Flows go from the susceptible reservoir to either the latent in the general population or the latent in quarantine. Latent in general population flow to the infected pre/asymptomatic in the general population from which they then go to either infectious not detected with mild symptoms/asymptomatics, infectious detected with mild symptoms/asymptomatics or infectious detected with severe symptoms. Latent in quarantine flow in the quarantined infected pre/asymptomatic from which they then go to either infectious detected with mild symptoms/asymptomatics or infectious detected with severe symptoms or infectious not detected in quarantine. Infectious not detected quarantined or not flow to recovered. Infectious detected with mild symptoms flow to recovered. Infectious with severe symptoms all enter a first compartment where they stay until they flow into a sorting compartment in hospital from which they then flow to either a general hospitalized compartment, or an ICU compartment, or a ventilator compartment. In addition, there is also two alternate compartments for those denied ICU or ventilator due to lack of resources. Every compartment in hospital, past the sorting can flow to either a recovered or dead compartment.
| Case detection/isolation | Contact tracing and quarantine | |||||
|---|---|---|---|---|---|---|
| 0.30 | 0.40 | 0.50 | 0.60 | 0.70 | 0.80 | |
| Contact rate reduced by 50% after day 88 | ||||||
| 0.30 | 53.57 | 51.68 | 49.66 | 47.49 | 45.15 | 42.62 |
| 0.40 | 44.21 | 41.06 | 37.61 | 33.84 | 29.71 | 25.24 |
| 0.50 | 31.92 | 27.10 | 21.86 | 16.35 | 11.09 | 7.06Footnote a of Table 1 |
| 0.60 | 16.46 | 10.82 | 6.61Footnote a of Table 1 | 4.34Footnote a of Table 1 | 3.25Footnote a of Table 1 | 2.66Footnote a of Table 1 |
| 0.70 | 4.69Footnote a of Table 1 | 3.35Footnote a of Table 1 | 2.68Footnote a of Table 1 | 2.29Footnote a of Table 1 | 2.05Footnote a of Table 1 | 1.88Footnote a of Table 1 |
| 0.80 | 2.33Footnote a of Table 1 | 2.06Footnote a of Table 1 | 1.88Footnote a of Table 1 | 1.75Footnote a of Table 1 | 1.65Footnote a of Table 1 | 1.58Footnote a of Table 1 |
| Contact rate reduced by 33% after day 88 | ||||||
| 0.30 | 68.68 | 67.41 | 66.04 | 64.56 | 62.95 | 61.20 |
| 0.40 | 62.54 | 60.37 | 57.95 | 55.26 | 52.24 | 48.84 |
| 0.50 | 54.22 | 50.68 | 46.65 | 42.02 | 36.70 | 30.61 |
| 0.60 | 42.70 | 37.17 | 30.77 | 23.49 | 15.67 | 8.86Footnote a of Table 1 |
| 0.70 | 26.68 | 18.89 | 11.18 | 6.02Footnote a of Table 1 | 3.82Footnote a of Table 1 | 2.88Footnote a of Table 1 |
| 0.80 | 8.34Footnote a of Table 1 | 4.69Footnote a of Table 1 | 3.23Footnote a of Table 1 | 2.56Footnote a of Table 1 | 2.19Footnote a of Table 1 | 1.96Footnote a of Table 1 |
| Contact rate reduced by 16.7% after day 88 | ||||||
| 0.30 | 76.56 | 75.65 | 74.66 | 73.58 | 72.41 | 71.13 |
| 0.40 | 72.20 | 70.63 | 68.87 | 66.89 | 64.66 | 62.13 |
| 0.50 | 66.27 | 63.67 | 60.67 | 57.19 | 53.10 | 48.29 |
| 0.60 | 57.92 | 53.73 | 48.74 | 42.77 | 35.59 | 27.03 |
| 0.70 | 45.80 | 39.18 | 31.21 | 21.85 | 12.20 | 6.03Footnote a of Table 1 |
| 0.80 | 27.95 | 18.53 | 9.65Footnote a of Table 1 | 4.96Footnote a of Table 1 | 3.28Footnote a of Table 1 | 2.57Footnote a of Table 1 |
Parameterization and initialization of model
Assuming that the first community transmission of SARS-CoV-2 in Canada was February 8, 2020. The simulations were run for the entire Canadian population (N=37,894,799 inhabitants), stratified in six age groups as shown in Appendix A Table S1 and Table S2Footnote 19Footnote 20.
Parameter values were set according to observed data for Canada (when available) and values in the literature (see Table S2 in Appendix A), obtained in a scan of the COVID-19 literature (published and pre-published) conducted daily by the Public Health Agency of Canada. Searches to retrieve relevant COVID-19 literature were conducted in Pubmed, Scopus, BioRxiv, MedRxiv, ArXiv, SSRN, Research Square and cross-referenced with the literature on the WHO COVID-19 literature list, and COVID-19 information centers run by Lancet, BMJ, Elsevier and Wiley. Literature with relevant prioritized outcomes were identified from the daily scan and parameter values were recorded in a data-extraction form. Model parameters are reassessed weekly according to new research. The choice of the literature source was made according to the relevance and quality of the publication. Estimates were chosen to reflect the most likely value based on minimum and maximum estimates from studies identified from the literature scanning process, using geography, date of study, sample size and target population as criteria in the choice of the retained literature. Estimates from Canada or similar countries, those with more recent study dates, larger sample sizes and more representative samples were prioritized.
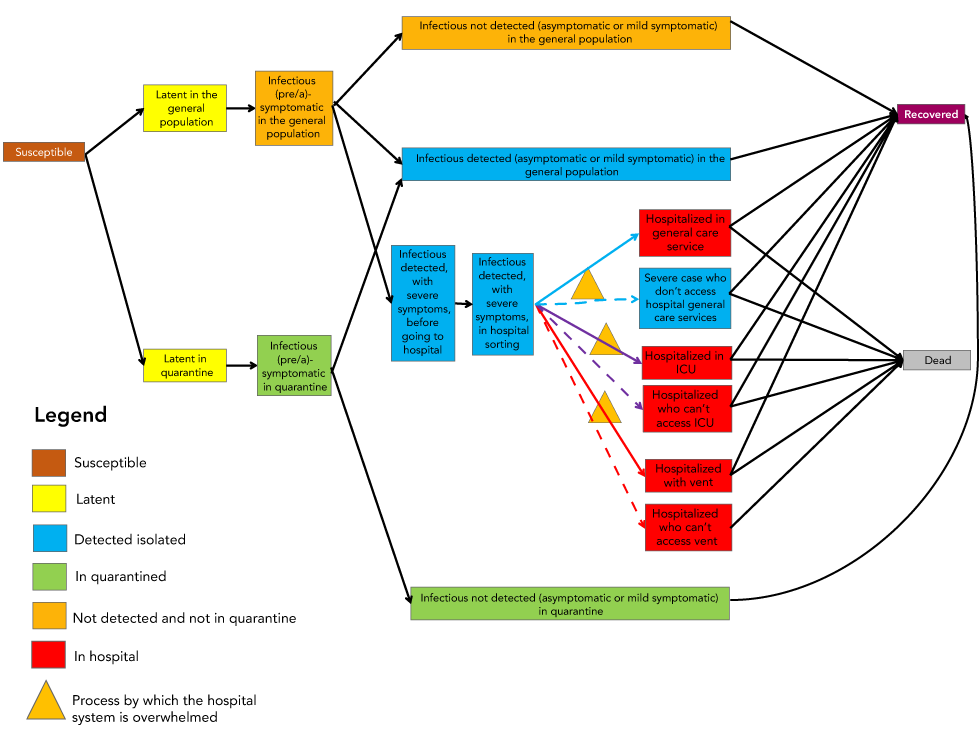
A simple calibration of the probability of successful transmission (beta) of SARS-CoV-2 from an infectious person to an uninfected person when they make contact was obtained (Figure 2). This was achieved through iterative trials that compared a target curve based on reported cases from February 8 to May 4, 2020Footnote 21, and simulation results for the same period. The target curve was obtained from increasing the observed count by 25% (assuming later in the epidemic reported cases underestimate the actual number by 25%: personal communication, Dougherty et al., September 15, 2020), and moving the entire curve to be one week earlier (assuming each case was reported one week later than symptom onset). The number of reported cases in the target curve and the number of simulated cases were compared visually to ensure that the parameter values for the simulations were reasonable before assessing the impacts of NPIs.
Figure 2: Comparison of observed cases in Canada from February 8 (day 1) to May 4, 2020 (day 88)
Text description: Figure 2
Figure 2: Comparison of observed cases in Canada from February 8 (day 1) to May 4, 2020 (day 88)
| Day | Number of observed cases | Number of corrected observed cases | Number of infectious simulated |
|---|---|---|---|
| 1 | 0 | 8.75 | 22 |
| 2 | 7 | 8.75 | 25 |
| 3 | 7 | 8.75 | 28 |
| 4 | 7 | 10 | 32 |
| 5 | 7 | 10 | 38 |
| 6 | 7 | 10 | 44 |
| 7 | 7 | 10 | 51 |
| 8 | 7 | 10 | 59 |
| 9 | 7 | 11.25 | 69 |
| 10 | 8 | 11.25 | 80 |
| 11 | 8 | 11.25 | 92 |
| 12 | 8 | 12.5 | 107 |
| 13 | 8 | 13.75 | 123 |
| 14 | 8 | 15 | 142 |
| 15 | 9 | 16.25 | 164 |
| 16 | 9 | 16.25 | 189 |
| 17 | 9 | 18.75 | 218 |
| 18 | 10 | 30 | 251 |
| 19 | 11 | 33.75 | 290 |
| 20 | 12 | 37.5 | 333 |
| 21 | 13 | 42.5 | 384 |
| 22 | 13 | 46.25 | 442 |
| 23 | 15 | 67.5 | 509 |
| 24 | 24 | 75 | 587 |
| 25 | 27 | 82.5 | 675 |
| 26 | 30 | 96.25 | 778 |
| 27 | 34 | 118.75 | 896 |
| 28 | 37 | 137.5 | 1,032 |
| 29 | 54 | 177.5 | 1,188 |
| 30 | 60 | 247.5 | 1,369 |
| 31 | 66 | 315 | 1,576 |
| 32 | 77 | 426.25 | 1,815 |
| 33 | 95 | 551.25 | 2,091 |
| 34 | 110 | 747.5 | 2,409 |
| 35 | 142 | 908.75 | 2,775 |
| 36 | 198 | 1,091.25 | 3,196 |
| 37 | 252 | 1,358.75 | 3,682 |
| 38 | 341 | 1660 | 4,242 |
| 39 | 441 | 1,837.5 | 4,887 |
| 40 | 598 | 2,613.75 | 5,630 |
| 41 | 727 | 3490 | 6,486 |
| 42 | 873 | 4,261.25 | 7,472 |
| 43 | 1,087 | 5,053.75 | 8,584 |
| 44 | 1,328 | 5,946.25 | 9,795 |
| 45 | 1,470 | 7,068.75 | 11,073 |
| 46 | 2,091 | 7,900 | 12,384 |
| 47 | 2,792 | 9,310 | 13,686 |
| 48 | 3,409 | 10,685 | 14,936 |
| 49 | 4,043 | 12,016.25 | 16,083 |
| 50 | 4,757 | 14,103.75 | 17,127 |
| 51 | 5,655 | 15,671.25 | 18,105 |
| 52 | 6,320 | 17,380 | 19,048 |
| 53 | 7,448 | 19,390 | 19,977 |
| 54 | 8,548 | 20,833.75 | 20,909 |
| 55 | 9,613 | 22,371.25 | 21,854 |
| 56 | 11,283 | 24,111.25 | 22,822 |
| 57 | 12,537 | 25,956.25 | 23,820 |
| 58 | 13,904 | 27,685 | 24,852 |
| 59 | 15,512 | 29,147.5 | 25,922 |
| 60 | 16,667 | 30,478.75 | 27,034 |
| 61 | 17,897 | 32,100 | 28,191 |
| 62 | 19,289 | 33,828.75 | 29,394 |
| 63 | 20,765 | 35,476.25 | 30,648 |
| 64 | 22,148 | 37,615 | 31,953 |
| 65 | 23,318 | 39,855 | 33,312 |
| 66 | 24,383 | 41,692.5 | 34,728 |
| 67 | 25,680 | 43,482.5 | 36,203 |
| 68 | 27,063 | 46,038.75 | 37,740 |
| 69 | 28,381 | 48,027.5 | 39,340 |
| 70 | 30,092 | 50,237.5 | 41,007 |
| 71 | 31,884 | 52,637.5 | 42,744 |
| 72 | 33,354 | 54,860 | 44,552 |
| 73 | 34,786 | 56,692.5 | 46,435 |
| 74 | 36,831 | 58,618.75 | 48,395 |
| 75 | 38,422 | 60,625 | 50,437 |
| 76 | 40,190 | 62,532.5 | 52,562 |
| 77 | 42,110 | 64,496.25 | 54,775 |
| 78 | 43,888 | 66,545 | 57,078 |
| 79 | 45,354 | 68,826.25 | 59,475 |
| 80 | 46,895 | 70,892.5 | 61,970 |
| 81 | 48,500 | 74,342.5 | 64,567 |
| 82 | 50,026 | 75,965 | 67,268 |
| 83 | 51,597 | 77,557.5 | 70,079 |
| 84 | 53,236 | 79,370 | 73,003 |
| 85 | 55,061 | 81,152.5 | 76,044 |
| 86 | 56,714 | 83,042.5 | 79,207 |
| 87 | 59,474 | 84,627.5 | 82,496 |
Initial values for each model state were set according to the number of cases reported in Canada at February 8, 2020, which was seven cases. The epidemic was initiated with 10 latent individuals, 20 presymptomatic individuals and two individuals with mild symptoms in the general population. The values were chosen to be higher than the observed number of cases to reflect both likely underdetection of cases, as well as the lag between the moment of exposure and the detection and declaration of cases. All other model state variables were set to zero.
The model was implemented in R using RStudio, using the following packages: adaptivetau; deSolve; dplyr; DT; forcats; ggplot2; htmlwidgets; lhs; magrittr; openxlsx; plotly; readxl; scales; tidyr; and triangle. Code is available upon request to the authors.
No ethics approval was required as all data were based on surveillance reports publically available from the Public Health Agency of Canada and published literature sources.
Simulations of non-pharmaceutical interventions
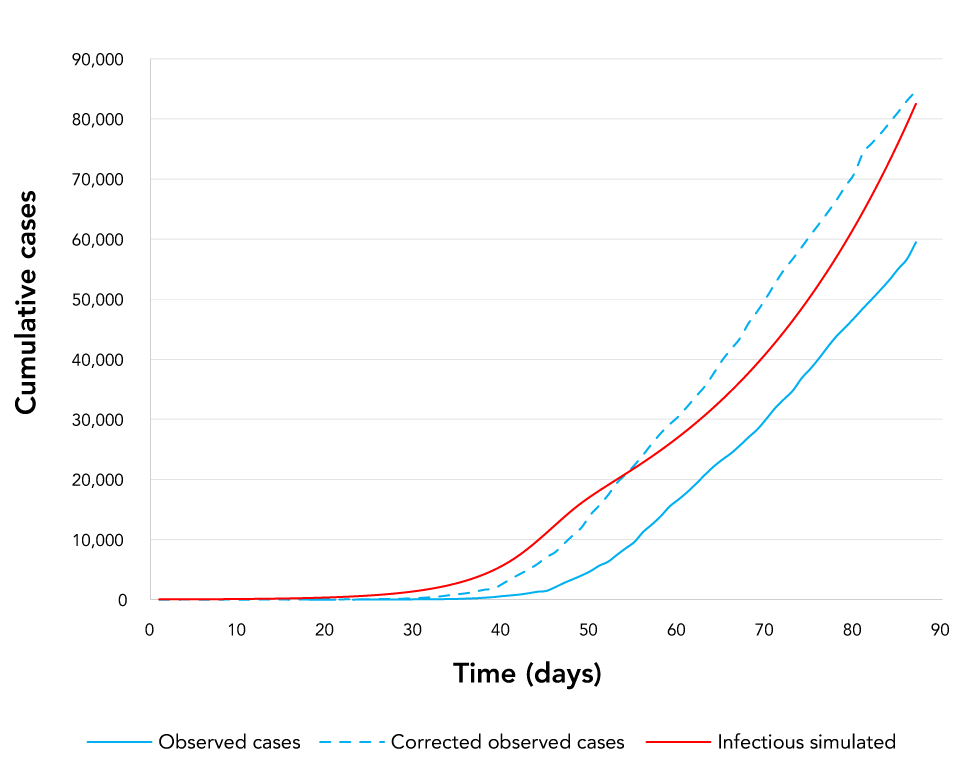
A total of 108 possible epidemics were simulated to assess the impact of different levels of case detection/isolation and contact tracing/quarantine under three scenarios for different levels of contact rates due to changes in physical distancing following de-escalation of restrictive closures as of May 4, 2020 (day 88). The study design is represented in Figure 3. From day 0 until day 88, all three scenarios are identical and involved constant levels of case detection/isolation (a conservative 40% of cases detected) and contact tracing/quarantine (40% traced and quarantined) while physical distancing (and thus the contact rates) varied according to the following: 1) an initial period of 40 days during which the level of daily contacts corresponded to what is normally observed in the general population; 2) a seven-day period during which the daily contact rate was gradually reduced by 50% to represent the implementation of physical distancing associated with the start of implementation of restrictive closures in Canada; and 3) a period of 40 days (from day 47 to day 87) over which physical distancing due to the restrictive closures maintained contact rates at 50% below pre-COVID-19 levels.
Figure 3: Simulation study design showing initial period of epidemic (before day 88)
Text description: Figure 3
Figure 3: Simulation study design showing initial period of epidemic (before day 88)
Figure 3 describes visually and in text format the simulation design used, indicating the levels of case detection/isolation, contact tracing, physical distancing and average contact rate in the general population for the calibration period (up to day 88) and the scenarios (from day 88). For the calibration period, both the case detection/isolation and contact tracing levels are kept at 40% until day 88. Starting from day 88, six scenarios of case detection and six scenarios of contact tracing are simulated, varying from 30% to 80% by increments of 10%. Physical distancing is not implemented and contact level is kept at 100% (12 contact/day) of initial level until day 40. After day 40 contact level is reduced to 50% of initial level (at six contact per day) over a period of seven days and is kept constant until day 87 inclusively. Starting from day 88, the physical distancing reduction is implemented according to three scenarios, respectively kept at 50% reduction than normal, eased to 33% reduction (than normal) or eased to 16.7% reduction (than normal).
From day 88 (the date of lifting restrictive closures), there were three scenarios for physical distancing: 1) physical distancing was kept such that contact rates remained 50% less than pre-COVID-19 levels (i.e. restrictive closures are not lifted); while in 2) and 3) restrictive closure were lifted to allow contact rates to increase, respectively, to 33% or 16.7% below pre-COVID-19 levels until the end of the simulation. Six levels of case detection/isolation (from 30% to 80% in 10% increments) and six levels of contact tracing/quarantine (from 30% to 80% by 10% increments) were simulated for each one of the three scenarios of physical distancing, for a total of 108 simulated epidemics.
Outcome measures
The attack rate was the primary outcome of the simulation experiments, consisting of the cumulative number of infected people over the entire initial population, for the entire 730 days of the epidemic, or at the end of the simulation period if the epidemic was not completed. Simulations longer than two years were considered as unrealistic given the assumption that recovered individuals do not return to the susceptible state during the simulation. Currently, there is not enough scientific evidence to confirm post-infection immunity in all recovered cases, or the duration of immunity any individual may achieve from a COVID-19 infectionFootnote 22Footnote 23Footnote 24. Attack rates below 10% were considered corresponded to a condition of "epidemic control" of COVID-19 in Canada, below which the healthcare system was less likely to be overwhelmed.
A analysis of sensity of the attack rate to an increase or decrease of the transmission coefficient (beta) by 10% (using the formula Sensitivity=((Vi - V0)/V0)/(|(Ti - T0)/T0|)Footnote 25 was performed, where V0 is the attack rate without changes to input data [T0] and Vi is the attack rate with a given increase or decrease of input [Ti]).
Outcomes
Attack rates of the 108 simulations are presented in Table 1 and illustrated in Figure 4; both table and figure show how the attack rate reduction evolved according to the different levels of NPI. Results showed that relaxing physical distancing at day 88 (40 days after its implementation) had a significant impact on the attack rate in all the simulated epidemics, with the attack rate varying between 1.6% and 76.6%. The extent of the impact of the easing of physical distancing varied according to the values of the other control measures already in place; i.e. the case detection/isolation rate and the contact tracing/quarantine rate. An attack rate below 10%, which was considered here to represent epidemic control, was much more frequent when the contact rate was kept at 50% level below normal after day 88, compared with lower levels of physical distancing.
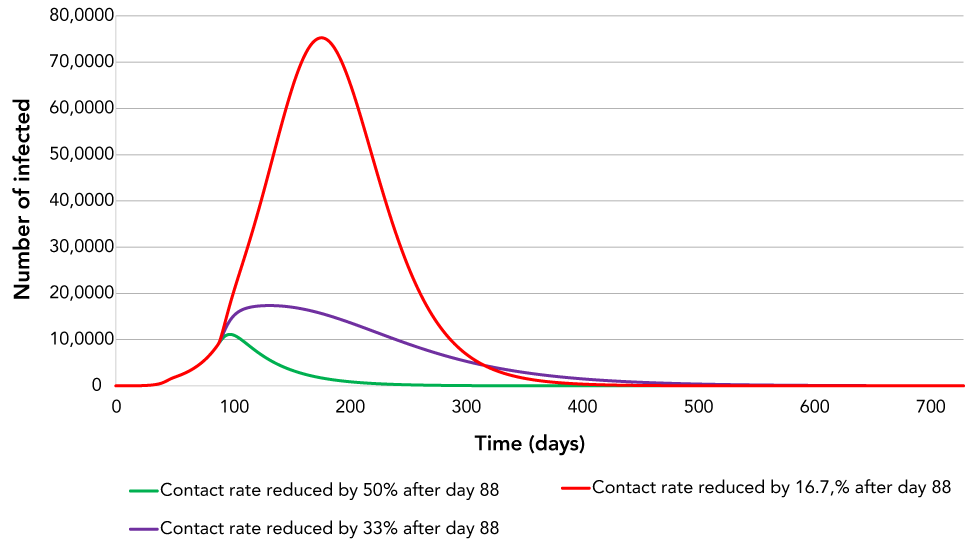
Figure 4: Simulation of the epidemic for three scenarios after day 88, May 4, 2020
Text description: Figure 4
Figure 4: Simulation of the epidemic for three scenarios after day 88, May 4, 2020
| Day | Number of infected using a contact rate after day 88 | ||
|---|---|---|---|
| Reduced by 50% | Reduced by 33% | Reduced by 16.7% | |
| 0 | 22 | 22 | 22 |
| 1 | 25 | 25 | 25 |
| 2 | 28 | 28 | 28 |
| 3 | 32 | 32 | 32 |
| 4 | 38 | 38 | 38 |
| 5 | 44 | 44 | 44 |
| 6 | 51 | 51 | 51 |
| 7 | 59 | 59 | 59 |
| 8 | 69 | 69 | 69 |
| 9 | 80 | 80 | 80 |
| 10 | 92 | 92 | 92 |
| 11 | 107 | 107 | 107 |
| 12 | 123 | 123 | 123 |
| 13 | 142 | 142 | 142 |
| 14 | 164 | 164 | 164 |
| 15 | 189 | 189 | 189 |
| 16 | 218 | 218 | 218 |
| 17 | 251 | 251 | 251 |
| 18 | 290 | 290 | 290 |
| 19 | 333 | 333 | 333 |
| 20 | 384 | 384 | 384 |
| 21 | 442 | 442 | 442 |
| 22 | 509 | 509 | 509 |
| 23 | 587 | 587 | 587 |
| 24 | 675 | 675 | 675 |
| 25 | 778 | 778 | 778 |
| 26 | 896 | 896 | 896 |
| 27 | 1,032 | 1,032 | 1,032 |
| 28 | 1,188 | 1,188 | 1,188 |
| 29 | 1,369 | 1,369 | 1,369 |
| 30 | 1,576 | 1,576 | 1,576 |
| 31 | 1,815 | 1,816 | 1,816 |
| 32 | 2,091 | 2,091 | 2,091 |
| 33 | 2,409 | 2,409 | 2,409 |
| 34 | 2,775 | 2,775 | 2,775 |
| 35 | 3,196 | 3,196 | 3,196 |
| 36 | 3,682 | 3,682 | 3,682 |
| 37 | 4,242 | 4,242 | 4,242 |
| 38 | 4,887 | 4,887 | 4,887 |
| 39 | 5,630 | 5,630 | 5,630 |
| 40 | 6,486 | 6,486 | 6,486 |
| 41 | 7,472 | 7,472 | 7,472 |
| 42 | 8,584 | 8,584 | 8,584 |
| 43 | 9,795 | 9,795 | 9,795 |
| 44 | 11,073 | 11,073 | 11,073 |
| 45 | 12,384 | 12,384 | 12,384 |
| 46 | 13,686 | 13,686 | 13,686 |
| 47 | 14,936 | 14,936 | 14,936 |
| 48 | 16,083 | 16,083 | 16,083 |
| 49 | 17,127 | 17,127 | 17,127 |
| 50 | 18,105 | 18,105 | 18,105 |
| 51 | 19,048 | 19,048 | 19,048 |
| 52 | 19,977 | 19,977 | 19,977 |
| 53 | 20,909 | 20,909 | 20,909 |
| 54 | 21,854 | 21,854 | 21,854 |
| 55 | 22,822 | 22,822 | 22,822 |
| 56 | 23,820 | 23,820 | 23,820 |
| 57 | 24,852 | 24,852 | 24,852 |
| 58 | 25,922 | 25,922 | 25,922 |
| 59 | 27,034 | 27,034 | 27,034 |
| 60 | 28,191 | 28,191 | 28,191 |
| 61 | 29,394 | 29,395 | 29,395 |
| 62 | 30,648 | 30,648 | 30,648 |
| 63 | 31,953 | 31,953 | 31,953 |
| 64 | 33,312 | 33,312 | 33,312 |
| 65 | 34,728 | 34,728 | 34,728 |
| 66 | 36,203 | 36,203 | 36,203 |
| 67 | 37,740 | 37,740 | 37,740 |
| 68 | 39,340 | 39,340 | 39,340 |
| 69 | 41,007 | 41,007 | 41,007 |
| 70 | 42,744 | 42,744 | 42,744 |
| 71 | 44,552 | 44,552 | 44,552 |
| 72 | 46,435 | 46,435 | 46,435 |
| 73 | 48,395 | 48,395 | 48,395 |
| 74 | 50,437 | 50,437 | 50,437 |
| 75 | 52,562 | 52,562 | 52,562 |
| 76 | 54,775 | 54,775 | 54,775 |
| 77 | 57,078 | 57,078 | 57,078 |
| 78 | 59,475 | 59,475 | 59,475 |
| 79 | 61,970 | 61,970 | 61,970 |
| 80 | 64,567 | 64,567 | 64,567 |
| 81 | 67,268 | 67,268 | 67,268 |
| 82 | 70,079 | 70,079 | 70,079 |
| 83 | 73,003 | 73,003 | 73,003 |
| 84 | 76,044 | 76,044 | 76,044 |
| 85 | 79,207 | 79,207 | 79,207 |
| 86 | 82,496 | 82,496 | 82,496 |
| 87 | 85,916 | 85,916 | 85,916 |
| 88 | 89,471 | 89,471 | 89,471 |
| 89 | 93,137 | 93,735 | 94,335 |
| 90 | 96,724 | 98,917 | 101,129 |
| 91 | 100,058 | 104,582 | 109,190 |
| 92 | 103,024 | 110,410 | 118,027 |
| 93 | 105,554 | 116,175 | 127,286 |
| 94 | 107,617 | 121,722 | 136,720 |
| 95 | 109,207 | 126,954 | 146,161 |
| 96 | 110,335 | 131,814 | 155,505 |
| 97 | 111,027 | 136,279 | 164,691 |
| 98 | 111,317 | 140,344 | 173,689 |
| 99 | 111,240 | 144,020 | 182,492 |
| 100 | 110,837 | 147,328 | 191,107 |
| 101 | 110,146 | 150,292 | 199,551 |
| 102 | 109,204 | 152,941 | 207,845 |
| 103 | 108,047 | 155,304 | 216,015 |
| 104 | 106,707 | 157,408 | 224,085 |
| 105 | 105,214 | 159,282 | 232,080 |
| 106 | 103,593 | 160,950 | 240,025 |
| 107 | 101,870 | 162,435 | 247,941 |
| 108 | 100,064 | 163,758 | 255,848 |
| 109 | 98,194 | 164,937 | 263,764 |
| 110 | 96,276 | 165,990 | 271,704 |
| 111 | 94,325 | 166,931 | 279,682 |
| 112 | 92,350 | 167,772 | 287,711 |
| 113 | 90,364 | 168,526 | 295,798 |
| 114 | 88,375 | 169,201 | 303,954 |
| 115 | 86,390 | 169,807 | 312,184 |
| 116 | 84,415 | 170,351 | 320,493 |
| 117 | 82,456 | 170,838 | 328,886 |
| 118 | 80,517 | 171,275 | 337,364 |
| 119 | 78,601 | 171,667 | 345,929 |
| 120 | 76,712 | 172,016 | 354,582 |
| 121 | 74,852 | 172,328 | 363,322 |
| 122 | 73,022 | 172,604 | 372,147 |
| 123 | 71,225 | 172,847 | 381,055 |
| 124 | 69,462 | 173,060 | 390,044 |
| 125 | 67,732 | 173,244 | 399,110 |
| 126 | 66,038 | 173,401 | 408,248 |
| 127 | 64,379 | 173,532 | 417,453 |
| 128 | 62,755 | 173,638 | 426,720 |
| 129 | 61,167 | 173,721 | 436,042 |
| 130 | 59,614 | 173,781 | 445,414 |
| 131 | 58,096 | 173,819 | 454,826 |
| 132 | 56,613 | 173,836 | 464,273 |
| 133 | 55,165 | 173,831 | 473,746 |
| 134 | 53,750 | 173,806 | 483,236 |
| 135 | 52,370 | 173,761 | 492,734 |
| 136 | 51,022 | 173,697 | 502,230 |
| 137 | 49,707 | 173,613 | 511,715 |
| 138 | 48,424 | 173,510 | 521,179 |
| 139 | 47,172 | 173,388 | 530,611 |
| 140 | 45,951 | 173,248 | 539,999 |
| 141 | 44,760 | 173,090 | 549,334 |
| 142 | 43,599 | 172,913 | 558,603 |
| 143 | 42,466 | 172,718 | 567,795 |
| 144 | 41,362 | 172,506 | 576,898 |
| 145 | 40,286 | 172,276 | 585,900 |
| 146 | 39,237 | 172,028 | 594,788 |
| 147 | 38,214 | 171,764 | 603,551 |
| 148 | 37,217 | 171,482 | 612,176 |
| 149 | 36,245 | 171,183 | 620,651 |
| 150 | 35,299 | 170,868 | 628,962 |
| 151 | 34,376 | 170,536 | 637,099 |
| 152 | 33,476 | 170,188 | 645,048 |
| 153 | 32,600 | 169,823 | 652,797 |
| 154 | 31,746 | 169,443 | 660,335 |
| 155 | 30,914 | 169,047 | 667,649 |
| 156 | 30,103 | 168,634 | 674,728 |
| 157 | 29,313 | 168,207 | 681,560 |
| 158 | 28,544 | 167,764 | 688,135 |
| 159 | 27,794 | 167,306 | 694,441 |
| 160 | 27,064 | 166,833 | 700,468 |
| 161 | 26,352 | 166,345 | 706,207 |
| 162 | 25,659 | 165,843 | 711,647 |
| 163 | 24,984 | 165,326 | 716,781 |
| 164 | 24,326 | 164,796 | 721,599 |
| 165 | 23,686 | 164,251 | 726,093 |
| 166 | 23,062 | 163,693 | 730,256 |
| 167 | 22,454 | 163,121 | 734,082 |
| 168 | 21,862 | 162,536 | 737,565 |
| 169 | 21,285 | 161,938 | 740,698 |
| 170 | 20,724 | 161,328 | 743,477 |
| 171 | 20,177 | 160,704 | 745,898 |
| 172 | 19,644 | 160,069 | 747,958 |
| 173 | 19,125 | 159,421 | 749,653 |
| 174 | 18,620 | 158,761 | 750,982 |
| 175 | 18,128 | 158,090 | 751,943 |
| 176 | 17,648 | 157,408 | 752,537 |
| 177 | 17,182 | 156,714 | 752,762 |
| 178 | 16,727 | 156,009 | 752,621 |
| 179 | 16,285 | 155,294 | 752,113 |
| 180 | 15,854 | 154,569 | 751,242 |
| 181 | 15,434 | 153,833 | 750,011 |
| 182 | 15,025 | 153,088 | 748,423 |
| 183 | 14,627 | 152,332 | 746,482 |
| 184 | 14,240 | 151,568 | 744,194 |
| 185 | 13,863 | 150,794 | 741,563 |
| 186 | 13,495 | 150,012 | 738,596 |
| 187 | 13,137 | 149,221 | 735,299 |
| 188 | 12,789 | 148,421 | 731,679 |
| 189 | 12,450 | 147,614 | 727,745 |
| 190 | 12,120 | 146,799 | 723,503 |
| 191 | 11,798 | 145,976 | 718,963 |
| 192 | 11,485 | 145,145 | 714,134 |
| 193 | 11,180 | 144,308 | 709,024 |
| 194 | 10,883 | 143,464 | 703,644 |
| 195 | 10,594 | 142,613 | 698,002 |
| 196 | 10,313 | 141,756 | 692,111 |
| 197 | 10,039 | 140,893 | 685,979 |
| 198 | 9,772 | 140,024 | 679,617 |
| 199 | 9,513 | 139,150 | 673,037 |
| 200 | 9,260 | 138,270 | 666,249 |
| 201 | 9,014 | 137,385 | 659,264 |
| 202 | 8,774 | 136,496 | 652,093 |
| 203 | 8,541 | 135,601 | 644,747 |
| 204 | 8,314 | 134,703 | 637,238 |
| 205 | 8,093 | 133,800 | 629,577 |
| 206 | 7,878 | 132,893 | 621,773 |
| 207 | 7,668 | 131,983 | 613,840 |
| 208 | 7,464 | 131,070 | 605,786 |
| 209 | 7,266 | 130,153 | 597,624 |
| 210 | 7,072 | 129,233 | 589,363 |
| 211 | 6,884 | 128,311 | 581,015 |
| 212 | 6,701 | 127,386 | 572,589 |
| 213 | 6,523 | 126,458 | 564,095 |
| 214 | 6,349 | 125,529 | 555,543 |
| 215 | 6,180 | 124,598 | 546,943 |
| 216 | 6,015 | 123,665 | 538,304 |
| 217 | 5,855 | 122,731 | 529,636 |
| 218 | 5,699 | 121,796 | 520,946 |
| 219 | 5,547 | 120,859 | 512,244 |
| 220 | 5,400 | 119,922 | 503,537 |
| 221 | 5,256 | 118,984 | 494,835 |
| 222 | 5,116 | 118,046 | 486,143 |
| 223 | 4,980 | 117,107 | 477,470 |
| 224 | 4,847 | 116,168 | 468,823 |
| 225 | 4,718 | 115,230 | 460,209 |
| 226 | 4,592 | 114,292 | 451,633 |
| 227 | 4,470 | 113,354 | 443,102 |
| 228 | 4,351 | 112,417 | 434,622 |
| 229 | 4,235 | 111,481 | 426,198 |
| 230 | 4,122 | 110,546 | 417,836 |
| 231 | 4,012 | 109,612 | 409,540 |
| 232 | 3,905 | 108,680 | 401,315 |
| 233 | 3,801 | 107,749 | 393,166 |
| 234 | 3,699 | 106,819 | 385,096 |
| 235 | 3,601 | 105,892 | 377,109 |
| 236 | 3,505 | 104,966 | 369,209 |
| 237 | 3,411 | 104,042 | 361,398 |
| 238 | 3,320 | 103,121 | 353,681 |
| 239 | 3,232 | 102,202 | 346,059 |
| 240 | 3,146 | 101,286 | 338,535 |
| 241 | 3,062 | 100,372 | 331,112 |
| 242 | 2,980 | 99,461 | 323,791 |
| 243 | 2,901 | 98,553 | 316,574 |
| 244 | 2,823 | 97,648 | 309,463 |
| 245 | 2,748 | 96,746 | 302,459 |
| 246 | 2,675 | 95,848 | 295,563 |
| 247 | 2,603 | 94,953 | 288,776 |
| 248 | 2,534 | 94,061 | 282,100 |
| 249 | 2,466 | 93,173 | 275,534 |
| 250 | 2,400 | 92,289 | 269,080 |
| 251 | 2,336 | 91,408 | 262,737 |
| 252 | 2,274 | 90,531 | 256,507 |
| 253 | 2,213 | 89,659 | 250,388 |
| 254 | 2,154 | 88,790 | 244,380 |
| 255 | 2,097 | 87,926 | 238,485 |
| 256 | 2,041 | 87,065 | 232,701 |
| 257 | 1,986 | 86,210 | 227,027 |
| 258 | 1,933 | 85,358 | 221,464 |
| 259 | 1,882 | 84,511 | 216,011 |
| 260 | 1,831 | 83,669 | 210,666 |
| 261 | 1,783 | 82,831 | 205,430 |
| 262 | 1,735 | 81,998 | 200,301 |
| 263 | 1,689 | 81,170 | 195,278 |
| 264 | 1,644 | 80,346 | 190,361 |
| 265 | 1,600 | 79,528 | 185,547 |
| 266 | 1,557 | 78,714 | 180,837 |
| 267 | 1,515 | 77,906 | 176,229 |
| 268 | 1,475 | 77,102 | 171,722 |
| 269 | 1,436 | 76,304 | 167,313 |
| 270 | 1,397 | 75,511 | 163,003 |
| 271 | 1,360 | 74,723 | 158,790 |
| 272 | 1,324 | 73,940 | 154,672 |
| 273 | 1,288 | 73,162 | 150,648 |
| 274 | 1,254 | 72,390 | 146,716 |
| 275 | 1,220 | 71,623 | 142,875 |
| 276 | 1,188 | 70,862 | 139,124 |
| 277 | 1,156 | 70,106 | 135,461 |
| 278 | 1,125 | 69,355 | 131,884 |
| 279 | 1,095 | 68,610 | 128,393 |
| 280 | 1,066 | 67,870 | 124,985 |
| 281 | 1,037 | 67,136 | 121,659 |
| 282 | 1,010 | 66,408 | 118,414 |
| 283 | 983 | 65,685 | 115,248 |
| 284 | 957 | 64,967 | 112,159 |
| 285 | 931 | 64,255 | 109,147 |
| 286 | 906 | 63,549 | 106,209 |
| 287 | 882 | 62,848 | 103,343 |
| 288 | 858 | 62,153 | 100,550 |
| 289 | 835 | 61,464 | 97,827 |
| 290 | 813 | 60,780 | 95,172 |
| 291 | 791 | 60,102 | 92,584 |
| 292 | 770 | 59,430 | 90,062 |
| 293 | 750 | 58,763 | 87,605 |
| 294 | 730 | 58,102 | 85,210 |
| 295 | 710 | 57,446 | 82,877 |
| 296 | 691 | 56,796 | 80,605 |
| 297 | 673 | 56,152 | 78,391 |
| 298 | 655 | 55,514 | 76,234 |
| 299 | 637 | 54,881 | 74,134 |
| 300 | 620 | 54,253 | 72,089 |
| 301 | 604 | 53,632 | 70,097 |
| 302 | 588 | 53,016 | 68,158 |
| 303 | 572 | 52,405 | 66,270 |
| 304 | 557 | 51,800 | 64,432 |
| 305 | 542 | 51,201 | 62,643 |
| 306 | 527 | 50,607 | 60,901 |
| 307 | 513 | 50,019 | 59,206 |
| 308 | 499 | 49,436 | 57,556 |
| 309 | 486 | 48,858 | 55,950 |
| 310 | 473 | 48,287 | 54,387 |
| 311 | 461 | 47,720 | 52,867 |
| 312 | 448 | 47,159 | 51,387 |
| 313 | 436 | 46,604 | 49,948 |
| 314 | 425 | 46,054 | 48,547 |
| 315 | 413 | 45,509 | 47,185 |
| 316 | 402 | 44,970 | 45,859 |
| 317 | 391 | 44,436 | 44,570 |
| 318 | 381 | 43,907 | 43,315 |
| 319 | 371 | 43,384 | 42,096 |
| 320 | 361 | 42,865 | 40,909 |
| 321 | 351 | 42,352 | 39,755 |
| 322 | 342 | 41,845 | 38,633 |
| 323 | 333 | 41,342 | 37,542 |
| 324 | 324 | 40,844 | 36,480 |
| 325 | 315 | 40,352 | 35,448 |
| 326 | 307 | 39,865 | 34,445 |
| 327 | 299 | 39,383 | 33,469 |
| 328 | 291 | 38,905 | 32,521 |
| 329 | 283 | 38,433 | 31,598 |
| 330 | 275 | 37,966 | 30,702 |
| 331 | 268 | 37,503 | 29,830 |
| 332 | 261 | 37,046 | 28,982 |
| 333 | 254 | 36,593 | 28,159 |
| 334 | 247 | 36,146 | 27,358 |
| 335 | 240 | 35,703 | 26,579 |
| 336 | 234 | 35,264 | 25,823 |
| 337 | 228 | 34,831 | 25,087 |
| 338 | 222 | 34,402 | 24,372 |
| 339 | 216 | 33,978 | 23,677 |
| 340 | 210 | 33,558 | 23,002 |
| 341 | 204 | 33,143 | 22,346 |
| 342 | 199 | 32,733 | 21,708 |
| 343 | 194 | 32,327 | 21,088 |
| 344 | 188 | 31,926 | 20,486 |
| 345 | 183 | 31,529 | 19,900 |
| 346 | 178 | 31,136 | 19,331 |
| 347 | 174 | 30,748 | 18,778 |
| 348 | 169 | 30,364 | 18,241 |
| 349 | 165 | 29,985 | 17,719 |
| 350 | 160 | 29,609 | 17,212 |
| 351 | 156 | 29,238 | 16,719 |
| 352 | 152 | 28,872 | 16,240 |
| 353 | 148 | 28,509 | 15,774 |
| 354 | 144 | 28,151 | 15,322 |
| 355 | 140 | 27,796 | 14,883 |
| 356 | 136 | 27,446 | 14,456 |
| 357 | 133 | 27,099 | 14,041 |
| 358 | 129 | 26,757 | 13,638 |
| 359 | 126 | 26,419 | 13,247 |
| 360 | 122 | 26,084 | 12,867 |
| 361 | 119 | 25,754 | 12,497 |
| 362 | 116 | 25,427 | 12,138 |
| 363 | 113 | 25,104 | 11,789 |
| 364 | 110 | 24,785 | 11,451 |
| 365 | 107 | 24,469 | 11,122 |
| 366 | 104 | 24,158 | 10,802 |
| 367 | 101 | 23,849 | 10,491 |
| 368 | 98 | 23,545 | 10,189 |
| 369 | 96 | 23,244 | 9,896 |
| 370 | 93 | 22,947 | 9,612 |
| 371 | 91 | 22,653 | 9,335 |
| 372 | 88 | 22,363 | 9,066 |
| 373 | 86 | 22,076 | 8,805 |
| 374 | 84 | 21,793 | 8,552 |
| 375 | 81 | 21,513 | 8,306 |
| 376 | 79 | 21,236 | 8,066 |
| 377 | 77 | 20,963 | 7,834 |
| 378 | 75 | 20,693 | 7,608 |
| 379 | 73 | 20,426 | 7,389 |
| 380 | 71 | 20,162 | 7,176 |
| 381 | 69 | 19,902 | 6,970 |
| 382 | 67 | 19,645 | 6,769 |
| 383 | 66 | 19,391 | 6,574 |
| 384 | 64 | 19,140 | 6,384 |
| 385 | 62 | 18,892 | 6,200 |
| 386 | 60 | 18,647 | 6,021 |
| 387 | 59 | 18,405 | 5,847 |
| 388 | 57 | 18,166 | 5,679 |
| 389 | 56 | 17,930 | 5,515 |
| 390 | 54 | 17,697 | 5,356 |
| 391 | 53 | 17,467 | 5,201 |
| 392 | 51 | 17,239 | 5,051 |
| 393 | 50 | 17,015 | 4,906 |
| 394 | 49 | 16,793 | 4,764 |
| 395 | 47 | 16,574 | 4,626 |
| 396 | 46 | 16,357 | 4,493 |
| 397 | 45 | 16,144 | 4,363 |
| 398 | 44 | 15,932 | 4,237 |
| 399 | 42 | 15,724 | 4,115 |
| 400 | 41 | 15,518 | 3,996 |
| 401 | 40 | 15,315 | 3,881 |
| 402 | 39 | 15,114 | 3,769 |
| 403 | 38 | 14,916 | 3,660 |
| 404 | 37 | 14,720 | 3,554 |
| 405 | 36 | 14,527 | 3,451 |
| 406 | 35 | 14,336 | 3,352 |
| 407 | 34 | 14,148 | 3,255 |
| 408 | 33 | 13,962 | 3,161 |
| 409 | 32 | 13,778 | 3,070 |
| 410 | 32 | 13,597 | 2,981 |
| 411 | 31 | 13,418 | 2,895 |
| 412 | 30 | 13,241 | 2,811 |
| 413 | 29 | 13,066 | 2,730 |
| 414 | 28 | 12,894 | 2,651 |
| 415 | 28 | 12,724 | 2,574 |
| 416 | 27 | 12,556 | 2,500 |
| 417 | 26 | 12,390 | 2,428 |
| 418 | 25 | 12,226 | 2,358 |
| 419 | 25 | 12,064 | 2,289 |
| 420 | 24 | 11,905 | 2,223 |
| 421 | 23 | 11,747 | 2,159 |
| 422 | 23 | 11,591 | 2,097 |
| 423 | 22 | 11,438 | 2,036 |
| 424 | 22 | 11,286 | 1,977 |
| 425 | 21 | 11,136 | 1,920 |
| 426 | 20 | 10,989 | 1,864 |
| 427 | 20 | 10,843 | 1,810 |
| 428 | 19 | 10,699 | 1,758 |
| 429 | 19 | 10,557 | 1,707 |
| 430 | 18 | 10,416 | 1,658 |
| 431 | 18 | 10,278 | 1,610 |
| 432 | 17 | 10,141 | 1,563 |
| 433 | 17 | 10,006 | 1,518 |
| 434 | 16 | 9,873 | 1,474 |
| 435 | 16 | 9,742 | 1,432 |
| 436 | 16 | 9,612 | 1,390 |
| 437 | 15 | 9,484 | 1,350 |
| 438 | 15 | 9,357 | 1,311 |
| 439 | 14 | 9,232 | 1,273 |
| 440 | 14 | 9,109 | 1,236 |
| 441 | 14 | 8,988 | 1,200 |
| 442 | 13 | 8,868 | 1,166 |
| 443 | 13 | 8,749 | 1,132 |
| 444 | 13 | 8,632 | 1,099 |
| 445 | 12 | 8,517 | 1,067 |
| 446 | 12 | 8,403 | 1,037 |
| 447 | 12 | 8,291 | 1,007 |
| 448 | 11 | 8,180 | 978 |
| 449 | 11 | 8,070 | 949 |
| 450 | 11 | 7,962 | 922 |
| 451 | 10 | 7,856 | 895 |
| 452 | 10 | 7,750 | 869 |
| 453 | 10 | 7,647 | 844 |
| 454 | 10 | 7,544 | 820 |
| 455 | 9 | 7,443 | 796 |
| 456 | 9 | 7,343 | 773 |
| 457 | 9 | 7,245 | 751 |
| 458 | 9 | 7,147 | 729 |
| 459 | 8 | 7,052 | 708 |
| 460 | 8 | 6,957 | 687 |
| 461 | 8 | 6,863 | 667 |
| 462 | 8 | 6,771 | 648 |
| 463 | 8 | 6,680 | 629 |
| 464 | 7 | 6,590 | 611 |
| 465 | 7 | 6,502 | 593 |
| 466 | 7 | 6,414 | 576 |
| 467 | 7 | 6,328 | 560 |
| 468 | 7 | 6,243 | 543 |
| 469 | 6 | 6,159 | 528 |
| 470 | 6 | 6,076 | 512 |
| 471 | 6 | 5,994 | 498 |
| 472 | 6 | 5,914 | 483 |
| 473 | 6 | 5,834 | 469 |
| 474 | 6 | 5,755 | 456 |
| 475 | 5 | 5,678 | 442 |
| 476 | 5 | 5,601 | 430 |
| 477 | 5 | 5,526 | 417 |
| 478 | 5 | 5,451 | 405 |
| 479 | 5 | 5,378 | 393 |
| 480 | 5 | 5,305 | 382 |
| 481 | 5 | 5,234 | 371 |
| 482 | 4 | 5,163 | 360 |
| 483 | 4 | 5,093 | 350 |
| 484 | 4 | 5,025 | 340 |
| 485 | 4 | 4,957 | 330 |
| 486 | 4 | 4,890 | 320 |
| 487 | 4 | 4,824 | 311 |
| 488 | 4 | 4,759 | 302 |
| 489 | 4 | 4,694 | 293 |
| 490 | 4 | 4,631 | 285 |
| 491 | 4 | 4,568 | 277 |
| 492 | 3 | 4,506 | 269 |
| 493 | 3 | 4,446 | 261 |
| 494 | 3 | 4,385 | 253 |
| 495 | 3 | 4,326 | 246 |
| 496 | 3 | 4,268 | 239 |
| 497 | 3 | 4,210 | 232 |
| 498 | 3 | 4,153 | 225 |
| 499 | 3 | 4,097 | 219 |
| 500 | 3 | 4,041 | 212 |
| 501 | 3 | 3,986 | 206 |
| 502 | 3 | 3,932 | 200 |
| 503 | 3 | 3,879 | 194 |
| 504 | 2 | 3,827 | 189 |
| 505 | 2 | 3,775 | 183 |
| 506 | 2 | 3,724 | 178 |
| 507 | 2 | 3,673 | 173 |
| 508 | 2 | 3,623 | 168 |
| 509 | 2 | 3,574 | 163 |
| 510 | 2 | 3,526 | 158 |
| 511 | 2 | 3,478 | 154 |
| 512 | 2 | 3,431 | 149 |
| 513 | 2 | 3,384 | 145 |
| 514 | 2 | 3,338 | 141 |
| 515 | 2 | 3,293 | 137 |
| 516 | 2 | 3,248 | 133 |
| 517 | 2 | 3,204 | 129 |
| 518 | 2 | 3,161 | 125 |
| 519 | 2 | 3,118 | 122 |
| 520 | 2 | 3,076 | 118 |
| 521 | 2 | 3,034 | 115 |
| 522 | 2 | 2,993 | 111 |
| 523 | 1 | 2,952 | 108 |
| 524 | 1 | 2,912 | 105 |
| 525 | 1 | 2,872 | 102 |
| 526 | 1 | 2,833 | 99 |
| 527 | 1 | 2,795 | 96 |
| 528 | 1 | 2,757 | 93 |
| 529 | 1 | 2,719 | 91 |
| 530 | 1 | 2,683 | 88 |
| 531 | 1 | 2,646 | 85 |
| 532 | 1 | 2,610 | 83 |
| 533 | 1 | 2,575 | 81 |
| 534 | 1 | 2,540 | 78 |
| 535 | 1 | 2,505 | 76 |
| 536 | 1 | 2,471 | 74 |
| 537 | 1 | 2,437 | 72 |
| 538 | 1 | 2,404 | 70 |
| 539 | 1 | 2,372 | 68 |
| 540 | 1 | 2,339 | 66 |
| 541 | 1 | 2,307 | 64 |
| 542 | 1 | 2,276 | 62 |
| 543 | 1 | 2,245 | 60 |
| 544 | 1 | 2,215 | 58 |
| 545 | 1 | 2,184 | 57 |
| 546 | 1 | 2,155 | 55 |
| 547 | 1 | 2,125 | 53 |
| 548 | 1 | 2,096 | 52 |
| 549 | 1 | 2,068 | 50 |
| 550 | 1 | 2,040 | 49 |
| 551 | 1 | 2,012 | 47 |
| 552 | 1 | 1,985 | 46 |
| 553 | 1 | 1,958 | 45 |
| 554 | 1 | 1,931 | 43 |
| 555 | 1 | 1,905 | 42 |
| 556 | 1 | 1,879 | 41 |
| 557 | 1 | 1,853 | 40 |
| 558 | 1 | 1,828 | 39 |
| 559 | 1 | 1,803 | 38 |
| 560 | 1 | 1,778 | 36 |
| 561 | 1 | 1,754 | 35 |
| 562 | 1 | 1,730 | 34 |
| 563 | 1 | 1,707 | 33 |
| 564 | 0 | 1,683 | 32 |
| 565 | 0 | 1,660 | 31 |
| 566 | 0 | 1,638 | 31 |
| 567 | 0 | 1,615 | 30 |
| 568 | 0 | 1,593 | 29 |
| 569 | 0 | 1,572 | 28 |
| 570 | 0 | 1,550 | 27 |
| 571 | 0 | 1,529 | 26 |
| 572 | 0 | 1,508 | 26 |
| 573 | 0 | 1,488 | 25 |
| 574 | 0 | 1,467 | 24 |
| 575 | 0 | 1,447 | 23 |
| 576 | 0 | 1,428 | 23 |
| 577 | 0 | 1,408 | 22 |
| 578 | 0 | 1,389 | 21 |
| 579 | 0 | 1,370 | 21 |
| 580 | 0 | 1,351 | 20 |
| 581 | 0 | 1,333 | 20 |
| 582 | 0 | 1,315 | 19 |
| 583 | 0 | 1,297 | 19 |
| 584 | 0 | 1,279 | 18 |
| 585 | 0 | 1,262 | 17 |
| 586 | 0 | 1,244 | 17 |
| 587 | 0 | 1,228 | 16 |
| 588 | 0 | 1,211 | 16 |
| 589 | 0 | 1,194 | 16 |
| 590 | 0 | 1,178 | 15 |
| 591 | 0 | 1,162 | 15 |
| 592 | 0 | 1,146 | 14 |
| 593 | 0 | 1,130 | 14 |
| 594 | 0 | 1,115 | 13 |
| 595 | 0 | 1,100 | 13 |
| 596 | 0 | 1,085 | 13 |
| 597 | 0 | 1,070 | 12 |
| 598 | 0 | 1,055 | 12 |
| 599 | 0 | 1,041 | 12 |
| 600 | 0 | 1,027 | 11 |
| 601 | 0 | 1,013 | 11 |
| 602 | 0 | 999 | 11 |
| 603 | 0 | 985 | 10 |
| 604 | 0 | 972 | 10 |
| 605 | 0 | 958 | 10 |
| 606 | 0 | 945 | 9 |
| 607 | 0 | 932 | 9 |
| 608 | 0 | 920 | 9 |
| 609 | 0 | 907 | 9 |
| 610 | 0 | 895 | 8 |
| 611 | 0 | 883 | 8 |
| 612 | 0 | 871 | 8 |
| 613 | 0 | 859 | 8 |
| 614 | 0 | 847 | 7 |
| 615 | 0 | 835 | 7 |
| 616 | 0 | 824 | 7 |
| 617 | 0 | 813 | 7 |
| 618 | 0 | 802 | 7 |
| 619 | 0 | 791 | 6 |
| 620 | 0 | 780 | 6 |
| 621 | 0 | 769 | 6 |
| 622 | 0 | 759 | 6 |
| 623 | 0 | 748 | 6 |
| 624 | 0 | 738 | 6 |
| 625 | 0 | 728 | 5 |
| 626 | 0 | 718 | 5 |
| 627 | 0 | 708 | 5 |
| 628 | 0 | 699 | 5 |
| 629 | 0 | 689 | 5 |
| 630 | 0 | 680 | 5 |
| 631 | 0 | 670 | 5 |
| 632 | 0 | 661 | 4 |
| 633 | 0 | 652 | 4 |
| 634 | 0 | 643 | 4 |
| 635 | 0 | 634 | 4 |
| 636 | 0 | 626 | 4 |
| 637 | 0 | 617 | 4 |
| 638 | 0 | 609 | 4 |
| 639 | 0 | 600 | 4 |
| 640 | 0 | 592 | 3 |
| 641 | 0 | 584 | 3 |
| 642 | 0 | 576 | 3 |
| 643 | 0 | 568 | 3 |
| 644 | 0 | 560 | 3 |
| 645 | 0 | 553 | 3 |
| 646 | 0 | 545 | 3 |
| 647 | 0 | 538 | 3 |
| 648 | 0 | 530 | 3 |
| 649 | 0 | 523 | 3 |
| 650 | 0 | 516 | 3 |
| 651 | 0 | 509 | 3 |
| 652 | 0 | 502 | 2 |
| 653 | 0 | 495 | 2 |
| 654 | 0 | 488 | 2 |
| 655 | 0 | 482 | 2 |
| 656 | 0 | 475 | 2 |
| 657 | 0 | 469 | 2 |
| 658 | 0 | 462 | 2 |
| 659 | 0 | 456 | 2 |
| 660 | 0 | 450 | 2 |
| 661 | 0 | 444 | 2 |
| 662 | 0 | 437 | 2 |
| 663 | 0 | 431 | 2 |
| 664 | 0 | 426 | 2 |
| 665 | 0 | 420 | 2 |
| 666 | 0 | 414 | 2 |
| 667 | 0 | 408 | 2 |
| 668 | 0 | 403 | 2 |
| 669 | 0 | 397 | 1 |
| 670 | 0 | 392 | 1 |
| 671 | 0 | 386 | 1 |
| 672 | 0 | 381 | 1 |
| 673 | 0 | 376 | 1 |
| 674 | 0 | 371 | 1 |
| 675 | 0 | 366 | 1 |
| 676 | 0 | 361 | 1 |
| 677 | 0 | 356 | 1 |
| 678 | 0 | 351 | 1 |
| 679 | 0 | 346 | 1 |
| 680 | 0 | 341 | 1 |
| 681 | 0 | 337 | 1 |
| 682 | 0 | 332 | 1 |
| 683 | 0 | 328 | 1 |
| 684 | 0 | 323 | 1 |
| 685 | 0 | 319 | 1 |
| 686 | 0 | 314 | 1 |
| 687 | 0 | 310 | 1 |
| 688 | 0 | 306 | 1 |
| 689 | 0 | 302 | 1 |
| 690 | 0 | 297 | 1 |
| 691 | 0 | 293 | 1 |
| 692 | 0 | 289 | 1 |
| 693 | 0 | 285 | 1 |
| 694 | 0 | 282 | 1 |
| 695 | 0 | 278 | 1 |
| 696 | 0 | 274 | 1 |
| 697 | 0 | 270 | 1 |
| 698 | 0 | 266 | 1 |
| 699 | 0 | 263 | 1 |
| 700 | 0 | 259 | 1 |
| 701 | 0 | 256 | 1 |
| 702 | 0 | 252 | 1 |
| 703 | 0 | 249 | 1 |
| 704 | 0 | 245 | 1 |
| 705 | 0 | 242 | 1 |
| 706 | 0 | 239 | 1 |
| 707 | 0 | 235 | 0 |
| 708 | 0 | 232 | 0 |
| 709 | 0 | 229 | 0 |
| 710 | 0 | 226 | 0 |
| 711 | 0 | 223 | 0 |
| 712 | 0 | 220 | 0 |
| 713 | 0 | 217 | 0 |
| 714 | 0 | 214 | 0 |
| 715 | 0 | 211 | 0 |
| 716 | 0 | 208 | 0 |
| 717 | 0 | 205 | 0 |
| 718 | 0 | 202 | 0 |
| 719 | 0 | 199 | 0 |
| 720 | 0 | 197 | 0 |
| 721 | 0 | 194 | 0 |
| 722 | 0 | 191 | 0 |
| 723 | 0 | 189 | 0 |
| 724 | 0 | 186 | 0 |
| 725 | 0 | 184 | 0 |
| 726 | 0 | 181 | 0 |
| 727 | 0 | 179 | 0 |
| 728 | 0 | 176 | 0 |
| 729 | 0 | 174 | 0 |
| 730 | 0 | 171 | 0 |
Additionally, a level of case detection/isolation of 70% or more allowed for control of the simulated epidemics at all levels of contact tracing above 30% when physical distancing is maintained at 50% below normal levels. However, the level of case detection and contact tracing needed to control the epidemic increased markedly if physical distancing was not maintained to reduce contact rates.
The results also suggest that the relative impact of case detection/isolation on the decrease of the attack rate appeared to be higher than that of contact tracing. Even with contact tracing at levels as high as 80%, 50% of cases had to be detected to control the epidemic when physical distancing kept contact rates 50% lower than pre-COVID-19 levels. An even higher level of case detection was required when physical distancing was lifted to allow contact rates to rise to 16.7% or 33% below pre-COVID-19 levels.
The sensitivity analysis for beta showed that the average percent change for the attack rate was lower than 10% in most scenarios, increasing with increasing beta (8.1%; SD=9.2%; data not shown) and decreasing with decreasing beta (4.1%; SD=2.9%). When beta was increased, the number of combinations of case detection and contact tracing rates resulting in an attack rate less than 10% reduced by half (from 32 to 16) while decreasing beta resulted in an increase (from 32 to 43) in the number of combinations resulting in an attack rate less than 10% (see Appendix C).
Discussion
Summary of key findings
This work highlights, in order of importance, that ensuring a relatively high level of detection/isolation of cases and tracing/quarantine of potentially infected cases while maintaining some personal physical distancing will all be necessary to avoid a resurgence of the epidemic in Canada.
Comparison with other studies
These results are in accordance with an example presented in Ogden et al.Footnote 26, based on a deterministic compartmental model that was not age stratified. Additionally, similar studies that assessed the impact of NPIs for Canada as a whole, or for a specific Canadian province, have come to similar conclusionsFootnote 5Footnote 27Footnote 28 (similar findings have been found in personal communication, Tuite et al. Reduced COVID-19-Related Critical Illness and Death, and High Risk of Epidemic Resurgence, After Physical Distancing in Ontario, Canada. medRxiv 2020 and in Eastman et al. Mathematical modeling of COVID-19 containment strategies with considerations for limited medical resources. medRxiv. 2020). Even if a direct comparison between results in different studies is difficult because of differences in details of the modelling study design (study region, epidemic start date, inclusion or not of stochasticity and epidemic outbreak metric), they all concluded that control of the epidemic requires a combination of three things: 1) maintenance of some level of physical distancing (for a minimum of 10 months according to Tuite et al.Footnote 5); 2) enhanced detection of cases; and 3) tracing and quarantine of contacts, to minimize the attack rate.
Strengths and limitations
A major strength of this study is that it provides a clear signal of the potential impact of lifting restrictive closures (represented in this study release of physical distancing), which began in many jurisdictions within Canada around mid-May 2020. The results of the simulation experiments presented here demonstrated that during the lifting restrictive closures, public health decision-makers and practitioners will need to maintain continued vigilance to avoid the resurgence of the COVID-19 epidemic (a "second wave"), through the maintenance of a high level of case detection and contact tracing and some level of physical distancing. A further strength of this work is that the chosen model states are comprehensive and account for the main disease statuses, including latent and presymptomatic states. Additionally, the model accounts for the age structure in the Canadian population, which is an important element of transmission risk heterogeneityFootnote 29. Finally, modeling the case detection level instead of the ratio of asymptomatic cases has allowed to circumvent the difficulty of obtaining precise information on the number of asymptomatic cases, which is a still a challenge for COVID-19 modelling.
A limitation of this study, which applies to most mathematical modelling work, is that translating the levels of NPI modelled into the real world is not always easy for the public health stakeholders and can be open to interpretation. In this study, we used our current best estimates for parameter values; however, these values may change as knowledge of COVID-19 increases. The preliminary sensitivity analysis that was conducted shows that the results were relatively robust to changes in beta (the transmission coefficient); therefore, the attack rate values obtained here should be considered as illustrative of the principle that increased case detection and contact tracing, as well as maintenance of some physical distancing, will be needed to control the epidemic as restrictive closures are lifted.
Additionally, the model does not account for delays between onset of symptoms and case detection or between case detection and contact tracing/quarantining. It is recognized that these delays exist and have been reported elsewhere in the worldFootnote 30. In the United States and the United Kingdom, it has been shown that these delays are subject to significant variation depending on the study population, the strength of symptoms and the vulnerability of the person, though no published estimates of these delays are yet available for Canada (Personal communication, Lawless et al. Estimation of Symptomatic Case Counts and the COVID-19 Infection Curve Through Reporting Delay Adjustment: An Observational Study of Ontario Surveillance).
Finally, the contact matrices used are the result of projections for Canada based on data from other countries in Europe and corrected for socio-demographic and health factorsFootnote 19. Actual contact rate data for Canada would strengthen future versions of this model.
Implications and next steps
This study underlines the importance of a cautious approach to lifting restrictive closures. It appears that maintaining some level of physical distancing (for example, by limitations on the size of gatherings, maintaining a two metre distance, or maintaining a social bubble) or other non-pharmaceutical measures (such as wearing non-medical masks) combined with high levels of case detection and contact tracing are key components of epidemic control. It this context, it seems important to support strategies aimed at encouraging people to get tested when they may have been exposed to suspected or confirmed COVID-19 cases, encouraging people to respect isolation instructions as well as strategies that support personal protection measures, such as mandating the use of non-medical masks in indoor public settingsFootnote 31, in order to offset the risk of infection from the increase of physical proximity of citizens that comes with re-opening.
Conclusion
This paper presents an aged-stratified dynamic compartmental model for the transmission of COVID-19 in Canada. As well, these results provide estimates of the impact of NPIs, including case detection/isolation, contact tracing/quarantine and changes in the level of physical distancing, on the COVID-19 attack rate, for a period of time after mid-May 2020, when lifting of restrictive closures began at a national level. The model and analyzed scenarios demonstrate that case detection/isolation and contact tracing/quarantine, along with reduced rates of contact through some form of physical distancing, will be essential for future control of the COVID-19 epidemic.
Authors' statement
- AL, PB and NO - Conceptualization
- AL, PB, AO, HO- Data curation (parameter values)
- AL, PB, CN, DH, JB, MD - Analysis
- AL, PB, HO - Writing-original draft
- AL, PB, NO, AO, HO, CN, DE, JB, MD - Writing-review and editing
- NO - Supervision
- AL, PB - Contributed equally to this work
Competing interests
None.
Acknowledgements
The authors would like to thank the Knowledge Synthesis team members within Public Health Risk Sciences Division of Public Health Agency of Canada. Their daily literature scans and summarization of SARS-CoV-2 publications contributed to the quick preparation of the work presented here.
Funding
This work was supported by the Public Health Agency of Canada.
Appendix A: Model flow, compartment definitions, parameter definitions and values
Model flow
Broadly, the naïve individuals (the Susceptible state), enter the latent infection state either in quarantine (state Lq) or while part of the general population (L). After the latent period, the individuals become infectious without developing symptoms-for individuals who will develop symptoms, this corresponds to a presymptomatic state (states Iq_pres or I_pres depending on whether the individual is quarantined or not). For individuals who will remain asymptomatic, the state we call presymptomatic simply corresponds to the first phase of their infectious period, until they may be detected, or not. Individuals are then either detected (a fraction of mild symptomatic individuals, asymptomatic individuals and all with severe symptoms) or not (most of the asymptomatic and a fraction of the mild symptomatic). Detected individual with mild symptoms or who are asymptomatic are isolated at home, while detected individuals with more severe symptoms enter the hospitalization section of the model. Undetected individuals, either with mild symptoms or who are completely asymptomatic are not isolated and are considered to continue to contribute to the epidemic for as long as their infectious period, at which point they recover. Once in the hospital states, depending on severity, individuals move to one of three possible compartments: a general non-emergency ward, an intensive care unit (ICU) if they are a severe case, or an ICU unit with ventilation for the most critical patients. The model accounts for lack of care for severe cases in the situation where hospital capacity is overwhelmed. Each severe case can either die or recover. State definitions can be found in Table S1.
| State | Definitions | Initial values |
|---|---|---|
| S | Susceptible | Stratification by age group, StatCan Population estimates July 1, 2019Footnote 32Ages 0-10 estimate of 3,982,527Ages 10-20 estimate of 4,146,397Ages 20-40 estimate of 10,286,131Ages 40-60 estimate of 10,069,708Ages 60-75 estimate of 6,315,255Ages 75+ estimate of 2,789,244 |
| Lq | Latent in quarantine | 0 |
| L | Latent in the general population (not in quarantine) | 10 |
| I_pres | Infected presymptomatic in the general population (and first infectious period for asymptomatic) | 20 |
| Iq_pres | Infected presymptomatic in quarantine (and first infectious period for asymptomatic) | 0 |
| Iqnd | Infected in quarantine not detected (asymptomatic or mild symptom) | 0 |
| Ind | Infected non-detected (asymptomatic or mild symptom) in the general population | 2 |
| Idam | Infectious detected asymptomatic or with mild symptoms in the general population | 0 |
| Idss | Infected detected between onset of symptoms, that are severe, and going to the hospital | 0 |
| Iss_hosp | Infected with severe symptoms who are in hospital sorting | 0 |
| H_g_OK | Infected with severe symptoms who stay at the hospital in the general care service | 0 |
| H_ICU_OK | Infected with severe symptoms who stay at the hospital in ICU | 0 |
| H_vent_OK | Infected with severe symptoms who stay at the hospital with ventilation | 0 |
| H_g_denied | Infected with severe symptoms who are not able to access hospital care because of insufficient/overwhelmed local capacity | 0 |
| H_ICU_denied | Infected with severe symptoms who are not able to access ICU because of insufficient/overwhelmed local capacity | 0 |
| H_vent_denied | Infected with severe symptoms who are not able to access ventilation because of insufficient/overwhelmed local capacity | 0 |
| R | Recovered | 0 |
| D | Dead | 0 |
| Parameter name | Definition | Value | Evidence |
|---|---|---|---|
| beta | Probability of transmission when contact made with infectious person | Ages 0-10 average value of 0.041Ages 10-20 average value of 0.041Ages 20-40 average value of 0.041Ages 40-60 average value of 0.041Ages 60-75 average value of 0.041Ages 75+ average value of 0.041 | Based on Stilianakis et al.Footnote 33 and adjusted using data from the beginning of the epidemic (Figure 2 in the article) |
| lambda | Proportion of exposed to detected infectious who are traced and quarantined (contact tracing/quarantine) | Value of 40% until day 87From day 88 up to the end of the epidemic, the value varied according to control scenarios | NA |
| cgg | Number of daily contacts between two individuals from the general population | 6*6 matrixAverage value of 12.6 from day 0 to day 40 (see Table S2.1 below)Linear decrease of 50% from days 41 and 47Value of 50% below normal from day 48 until day 87From day 88 up to the end of the epidemic, the value varied according to control scenarios | Based on Prem et al.Footnote 19 |
| cgq | Number of daily contacts between an individual from the general population and an individual from the quarantined population | 6*6 matrix identical during all the duration of the simulation (see Table S2.2 below) | We assumed a person in quarantine is in contact with a maximum of one person each day during his/her quarantine period. The value of one was then standardized according to the total population size in each stratum |
| 20sigma | Latent period (days) | 4.12 days | Based on Li et al., 2020Footnote 34 |
| delta | Proportion of presymptomatic infectious cases that will be identified (or detected) | Value of 40% until day 87From day 88 and to the end of the epidemic, the value varied according to control scenarios | NA |
| alpha | Proportion of cases who develop severe symptoms | Ages 0-10 average value of 0.02Ages 10-20 average value of 0.02Ages 20-40 average value of 0.04Ages 40-60 average value of 0.10Ages 60-75 average value of 0.30Ages 75+ average value of 0.41 | Based on Public Health Agency of CanadaFootnote 21 |
| tpres | Period of time between onset of infectiousness and onset of symptoms in those developing symptoms OR first infectious period for asymptomatic | 2 days | Based on He et al., 2020Footnote 35 |
| tsm | Period of time between onset of symptoms and recovery for cases with mild symptoms OR second infectious period for asymptomatic | 6 days | Based on Wölfel et al., 2020Footnote 36 and He et al., 2020Footnote 35 |
| tsph | Period between symptom onset for cases with severe symptoms and being taken care of by the health system | 3 days | Based on Khalili et al., 2020Footnote 37 |
| pICU | Proportion of hospitalized cases who require/access to ICU in hospital | Ages 0-10 average value of 0.20Ages 10-20 average value of 0.35Ages 20-40 average value of 0.36Ages 40-60 average value of 0.46Ages 60-75 average value of 0.46Ages 75+ average value of 0.19 | Based on Public Health Agency of CanadaFootnote 21 |
| pvent | Proportion of hospitalized cases who require/access to ventilation (Vent) | 0 | This will be updated in future models once age-specific data become available |
| tsorting | Period of time for sorting severe cases in hospital (before general service, ICU or Vent) | 1 day | We assume it takes one day on average between when a severe case arrives in the hospital and when the case is sorted to the appropriate service |
| mg | Mortality rate for severe cases in hospital that do not require ICU or Vent (general) | Ages 0-10 average value of 0Ages 10-20 average value of 0Ages 20-40 average value of 0Ages 40-60 average value of 0.02Ages 60-75 average value of 0.14Ages 75+ average value of 0.34 | Based on Public Health Agency of CanadaFootnote 34 |
| mICU | Mortality rate for severe cases dying in hospital (ICU) | Ages 0-10 average value of 0Ages 10-20 average value of 0Ages 20-40 average value of 0.06Ages 40-60 average value of 0.15Ages 60-75 average value of 0.32Ages 75+ average value of 0.57 | Based on Public Health Agency of CanadaFootnote 34 |
| mVent | Mortality rate for severe case dying in hospital (Vent) | NA | Not calibrated because this parameter has no impact on the results (e.g. attack rate) presented in this article |
| thr | Period of time between first day in hospital after sorting, and recovery or death | 12 days | Based on hospitalization and length of stay of COVID-19 casesFootnote 38Footnote 39Footnote 40 |
| mg- | Mortality rate for severe cases dying at home because they are not able to access hospital care | NA | Not calibrated because this parameter has no impact on the results (e.g. attack rate) presented in this article |
| mICU- | Mortality rate for severe cases dying in hospital because they are not able to access ICU | NA | Not calibrated because this parameter has no impact on the results (e.g. attack rate) presented in this article |
| Age group | 0-10 | 10-20 | 20-40 | 40-60 | 60-75 | 75+ |
|---|---|---|---|---|---|---|
| 0-10 | 4.60 | 0.89 | 2.59 | 1.38 | 0.34 | 0.04 |
| 10-20 | 1.03 | 10.27 | 2.80 | 2.45 | 0.21 | 0.03 |
| 20-40 | 1.15 | 1.67 | 8.18 | 4.05 | 0.35 | 0.04 |
| 40-60 | 1.00 | 2.17 | 4.89 | 5.83 | 0.60 | 0.07 |
| 60-75 | 0.63 | 0.65 | 1.89 | 2.06 | 1.98 | 0.14 |
| 75+ | 0.45 | 0.66 | 0.84 | 1.42 | 0.77 | 0.46 |
| Age group | 0-10 | 10-20 | 20-40 | 40-60 | 60-75 | 75+ |
|---|---|---|---|---|---|---|
| 0-10 | 0.47 | 0.09 | 0.26 | 0.14 | 0.03 | 0.00 |
| 10-20 | 0.06 | 0.61 | 0.17 | 0.15 | 0.01 | 0.00 |
| 20-40 | 0.07 | 0.11 | 0.53 | 0.26 | 0.02 | 0.00 |
| 40-60 | 0.07 | 0.15 | 0.34 | 0.40 | 0.04 | 0.00 |
| 60-75 | 0.09 | 0.09 | 0.26 | 0.28 | 0.27 | 0.02 |
| 75+ | 0.10 | 0.14 | 0.18 | 0.31 | 0.17 | 0.10 |
Appendix B: Equations
dS / dt = - S * beta * 1/N * [(1-lambda*delta) * ( cgg * (I_pres + Ind) + cgq * (Iq_pres + Iqnd)) + lambda * delta * ( cgg * (I_pres + Ind) + cgq * (Iq_pres + Iqnd))]
dLq / dt = S * beta * 1/N * lambda * delta * ( cgg * (I_pres + Ind) + cgq * (Iq_pres + Iqnd)) - Lq / sigma
dL / dt = S * beta * 1/N* (1-lambda *delta) * ( cgg * (I_pres + Ind) + cgq * (Iq_pres + Iqnd)) - L / sigma
dIpres / dt = L / sigma - Ipres / tpres
dIq_pres/ dt = Lq / sigma - Iq_pres / tpres
dIqnd / dt = Iq_pres *( 1-delta) / tpres - Iqnd / tsm
dInd / dt = Ipres * ( 1-delta) / tpres - Ind / tsm
dIdam / dt = (Iq_pres + Ipres) * delta* (1- alpha) / tpres - Idam / tsm
dIdss / dt = (Iq_pres + Ipres) * (delta* alpha) / tpres - Idss / tsph
dIss_hosp / dt = Idss / tsph - Iss_hosp / tsorting
dH_g_OK/ dt = Iss_hosp * (1-pICU-pvent) / tsorting - H_g_OK / thr
dH_ICU_OK / dt = Iss_hosp * pICU / tsorting - H_ICU_OK / thr
dH_vent_OK / dt = Iss_hosp * pvent / tsorting - H_vent_OK / thr
dH_g_denied / dt = 0 * Iss_hosp * (1-pICU-pvent) / tsorting - H_g_denied / thr where 0 comes from the assumed infinite capacity.
dH_ICU_denied / dt = 0 * Iss_hosp * (pICU) / tsorting - H_ICU_denied / thr where 0 comes from the assumed infinite capacity.
dH_vent_denied / dt = 0 * Iss_hosp * (pvent) / tsorting - H_vent_denied / thr where 0 comes from the assumed infinite capacity.
dR / dt = Idam / tsm + Ind / tsm + Iqnd / tsm + H_g_OK * (1- mg) / thr + H_g_denied * (1- mg-) / thr + H_ICU_OK * (1- mICU) / thr + H_ICU_denied * (1- mICU-) / thr + H_vent_OK * (1- mVent) / thr
dD / dt = H_g_OK * mg / thr + H_g_denied * mg- / thr + H_ICU_OK * mICU / thr + H_ICU_denied * mICU- / thr + H_vent_OK * mVent / thr + H_vent_denied / thr
Appendix C: Sensitivity analysis for beta
| Case detection/isolation | Contact tracing and quarantine | |||||
|---|---|---|---|---|---|---|
| 0.30 | 0.40 | 0.50 | 0.60 | 0.70 | 0.80 | |
| Attack rate for a beta 10% higher than expected (beta=0.045) | ||||||
| Contact rate still reduced by 50% after day 88 | ||||||
| 0.30 | 59.09352 | 57.4983 | 55.78916 | 53.9561 | 51.98852 | 49.87534 |
| 0.40 | 51.116 | 48.47224 | 45.58901 | 42.44803 | 39.03661 | 35.35465 |
| 0.50 | 40.72402 | 36.72655 | 32.39552 | 27.80149 | 23.12042 | 18.6755 |
| 0.60 | 27.68375 | 22.66857 | 17.92792 | 13.9703 | 11.07788 | 9.127013Footnote a of Appendix C |
| 0.70 | 14.67835 | 11.41256 | 9.222685Footnote a of Appendix C | 7.797606Footnote a of Appendix C | 6.846839Footnote a of Appendix C | 6.184861Footnote a of Appendix C |
| 0.80 | 7.997407Footnote a of Appendix C | 6.941327Footnote a of Appendix C | 6.220808Footnote a of Appendix C | 5.706796Footnote a of Appendix C | 5.325164Footnote a of Appendix C | 5.032136Footnote a of Appendix C |
| Contact rate still reduced by 50% after day 88 | ||||||
| 0.30 | 72.12056 | 71.03947 | 69.87305 | 68.6118 | 67.24506 | 65.76064 |
| 0.40 | 66.84949 | 65.00664 | 62.96262 | 60.688 | 58.14878 | 55.30608 |
| 0.50 | 59.74349 | 56.76575 | 53.38173 | 49.5269 | 45.13509 | 40.15337 |
| 0.60 | 49.97753 | 45.37923 | 40.1135 | 34.16619 | 27.6911 | 21.21683 |
| 0.70 | 36.56815 | 30.14937 | 23.41448 | 17.23498 | 12.63568 | 9.755943Footnote a of Appendix C |
| 0.80 | 20.20915 | 14.69697 | 10.93404 | 8.667255Footnote a of Appendix C | 7.296874Footnote a of Appendix C | 6.418942Footnote a of Appendix C |
| Contact rate reduced by 16.7% after day 88 | ||||||
| 0.30 | 78.97424 | 78.18379 | 77.33041 | 76.40654 | 75.40348 | 74.31118 |
| 0.40 | 75.19535 | 73.84808 | 72.34734 | 70.66763 | 68.77832 | 66.64237 |
| 0.50 | 70.09167 | 67.88819 | 65.35466 | 62.42254 | 59.0075 | 55.00747 |
| 0.60 | 62.96743 | 59.44347 | 55.27892 | 50.33294 | 44.45665 | 37.55202 |
| 0.70 | 52.71792 | 47.23034 | 40.70934 | 33.12933 | 24.9225 | 17.4795 |
| 0.80 | 37.83963 | 30.13374 | 22.10612 | 15.33652 | 11.01025 | 8.593437Footnote a of Appendix C |
| Attack rate for a beta 10% lower than expected (beta=0.037) | ||||||
| Contact rate still reduced by 50% after day 88 | ||||||
| 0.30 | 46.32687 | 44.1102 | 41.73141 | 39.17554 | 36.42638 | 33.46669 |
| 0.40 | 35.37861 | 31.69369 | 27.6635 | 23.2589 | 18.45491 | 13.23975 |
| 0.50 | 21.11151 | 15.51616 | 9.487262Footnote a of Appendix C | 4.352624Footnote a of Appendix C | 2.026998Footnote a of Appendix C | 1.268084Footnote a of Appendix C |
| 0.60 | 4.446911Footnote a of Appendix C | 1.925112Footnote a of Appendix C | 1.178985Footnote a of Appendix C | 0.892557Footnote a of Appendix C | 0.747114Footnote a of Appendix C | 0.659919Footnote a of Appendix C |
| 0.70 | 0.917685Footnote a of Appendix C | 0.750175Footnote a of Appendix C | 0.655133Footnote a of Appendix C | 0.594146Footnote a of Appendix C | 0.551763Footnote a of Appendix C | 0.520622Footnote a of Appendix C |
| 0.80 | 0.594963Footnote a of Appendix C | 0.550296Footnote a of Appendix C | 0.517993Footnote a of Appendix C | 0.493555Footnote a of Appendix C | 0.474428Footnote a of Appendix C | 0.459053Footnote a of Appendix C |
| Contact rate reduced by 33% after day 88 | ||||||
| 0.30 | 64.06551 | 62.56878 | 60.95033 | 59.19649 | 57.29164 | 55.21801 |
| 0.40 | 56.83411 | 54.26817 | 51.41448 | 48.22939 | 44.66162 | 40.65115 |
| 0.50 | 47.04398 | 42.87674 | 38.12076 | 32.67411 | 26.42855 | 19.2982 |
| 0.60 | 33.54144 | 27.06095 | 19.59878 | 11.19984 | 4.000164Footnote a of Appendix C | 1.648817Footnote a of Appendix C |
| 0.70 | 14.97949 | 6.498159Footnote a of Appendix C | 2.127114Footnote a of Appendix C | 1.165722Footnote a of Appendix C | 0.858549Footnote a of Appendix C | 0.713186Footnote a of Appendix C |
| 0.80 | 1.48164Footnote a of Appendix C | 0.962062Footnote a of Appendix C | 0.758895Footnote a of Appendix C | 0.652422Footnote a of Appendix C | 0.587167Footnote a of Appendix C | 0.543146Footnote a of Appendix C |
| Contact rate reduced by 16.7% after day 88 | ||||||
| 0.30 | 73.32151 | 72.24328 | 71.07465 | 69.80463 | 68.42056 | 66.90782 |
| 0.40 | 68.1969 | 66.33559 | 64.25373 | 61.91416 | 59.27188 | 56.27203 |
| 0.50 | 61.2006 | 58.12787 | 54.57939 | 50.45286 | 45.61944 | 39.91796 |
| 0.60 | 51.36095 | 46.40851 | 40.51931 | 33.46741 | 25.00128 | 14.98944 |
| 0.70 | 37.11735 | 29.3243 | 19.98326 | 9.323668Footnote a of Appendix C | 2.537434Footnote a of Appendix C | 1.234962Footnote a of Appendix C |
| 0.80 | 16.33694 | 6.198483Footnote a of Appendix C | 1.832707Footnote a of Appendix C | 1.050737Footnote a of Appendix C | 0.794449Footnote a of Appendix C | 0.670077Footnote a of Appendix C |
