
Provincial rotavirus immunization programs and the impact on Canadian children

 Download this article as a PDF
Published by: The Public Health Agency of Canada
Issue: Volume 47-2: HIV Testing in Canada in the Past Decade 2009–2019
Date published: February 2021
ISSN: 1481-8531
Submit a manuscript
About CCDR
Browse
Volume 47-2, February 2021: HIV Testing in Canada in the Past Decade 2009–2019
Surveillance
The impact of publicly funded rotavirus immunization programs on Canadian children
Pia K Muchaal1, Matt Hurst1, Shalini Desai2
Affiliation
1 Centre for Foodborne, Environmental and Zoonotic Infectious Diseases, Public Health Agency of Canada, Guelph, ON
2 Centre for Immunization and Respiratory Infectious Diseases, Public Health Agency of Canada, Ottawa, ON
Correspondence
Suggested citation
Muchaal PK, Hurst M, Desai S. The impact of publicly funded rotavirus immunization programs on Canadian children. Can Commun Dis Rep 2021;47(2):97–104. https://doi.org/10.14745/ccdr.v47i02a02
Keywords: rotavirus, evaluation, vaccination, intervention, burden
Abstract
Background: In 2008, the National Advisory Committee on Immunization recommended routine rotavirus immunizations in healthy Canadian infants. Over the following seven years, eight provinces and two territories introduced the rotavirus vaccine into their publicly funded immunization programs.Objective: Assess the burden of rotavirus infections before and after implementation of publicly funded immunization programs.
Methods: We analyzed laboratory-confirmed community cases of rotavirus reported to the National Enteric Surveillance Program and hospitalizations of children younger than three years old from 2007 to 2017 with rotavirus diagnosis-specific ICD-10 codes. Rates of illness were calculated for each province for the two years prior to and after implementation of public funding of the vaccine. The year of implementation was not included to accommodate the uptake period of the vaccine. Age-specific rates were assessed in jurisdictions where five years of data were available the year after the vaccine was publicly funded. The pre-post and difference-in-difference (DID) methodologies were applied to hospital discharge data to evaluate changes between the funding and non-funding jurisdictions.
Results: Community cases of laboratory-confirmed rotavirus infection reported to the National Enteric Surveillance Program declined by 54% between 2010 and 2017. Rates of hospital discharges decreased significantly among children in six provinces after the adoption of the rotavirus vaccine. Hospital discharge rates in Alberta, Manitoba, Ontario and Prince Edward Island dropped between 53% and 71%, and by 75% for British Columbia and Saskatchewan.
Conclusion: Public funding of the rotavirus vaccine appeared to lead to significant reductions in laboratory-confirmed rotavirus cases reported to the National Enteric Surveillance Program and in the rates of rotavirus gastroenteritis-related hospital discharges.
Introduction
Rotavirus is a common, infectious disease transmitted from person to person via the fecal-oral route. In the pre-vaccine era, most children experienced an infection by the time they had reached five years old. Based on limited available data, Thomas et al. estimated that between 2000 and 2010 an average of 850,233 cases of community rotavirus occurred each year in CanadaFootnote 1.
Clinical presentations vary widely, from asymptomatic infection to severe disease that can lead to severe dehydration and death. Immunocompromised children are at an increased risk of severe, prolonged and even fatal rotavirus infectionsFootnote 2. In most healthy Canadian children, the illness is self-limiting and rarely results in long-term sequelae or death.
Health Canada has approved two vaccines for use: RotaTeq (Merck Canada Inc.), a three-dose, live, oral pentavalent bovine human rotavirus reassortant, in 2006Footnote 3; and Rotarix (GlaxoSmithKline Inc.), a 2-dose live-attenuated monovalent vaccine derived from a single human strain in 2007Footnote 4. The National Advisory Committee on Immunization (NACI) recommended the use in healthy infants of RotaTeq (RV5) in 2008 and of Rotarix in 2010Footnote 5.
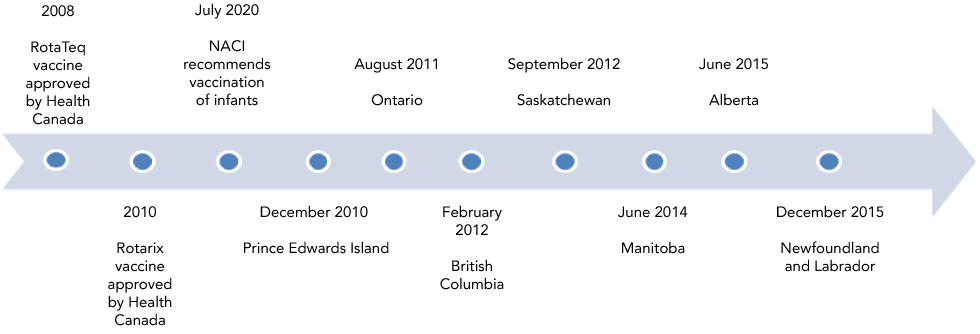
Public funding of vaccines is under the purview of the provinces and territories in Canada, and immunization schedules can differ between jurisdictions. By the end of the study period covered in this evaluation (2010–2017), eight provinces and two territories had included rotavirus vaccination in their routine infant immunization schedule. Of these ten jurisdictions, seven are considered in this study (Figure 1). Introductions were temporally staggered across the country between December 2010 and December 2015. By August 2018, nine provinces and three territories had included rotavirus vaccination in their schedules.
Figure 1: Timeline of adoption of publicly funded rotavirus immunization programs by provinces, 2010–2015
Text description: Figure 1
This figure shows the month and year that the provinces adopted publicly funded rotavirus immunization programs, beginning with Prince Edward Island in December 2010 and ending with Newfoundland and Labrador in December 2015.
Objectives
Our aim was to study the impact of publicly funded rotavirus vaccination programs by conducting a national analysis of the burden of rotavirus infections in Canada before and after implementation of publicly funded vaccination programs and to compare jurisdictions that adopted the vaccine into their respective routine immunization schedules with those that had not funded the vaccine.
Methods
Data sources
The National Enteric Surveillance Program (NESP) tracks the number of laboratory-confirmed cases of community-acquired rotavirus infections reported weekly by all provincial public health laboratories except those in Québec. However, rotavirus is not a nationally reportable disease in Canada, and laboratory testing and reporting vary by jurisdiction. Only a fraction of cases are reported, which leads to underestimating the magnitude of illness. Furthermore, demographic information is not available for these cases. Despite these limitations, the NESP dataset serves as a proxy for trends in community infection.
We obtained weekly counts of rotavirus cases reported to the NESP between 2007 and 2017 from the NESP database. A review of the dataset revealed a paucity of reporting in 2007 to 2009. Therefore, only data from 2010 onwards were submitted for analysis.
Using the Canadian Institute for Health Information (CIHI) Discharge Administration Database (DAD), we assessed hospital discharges between January 1, 2007, and December 31, 2017. CIHI-DAD captures administrative, clinical and demographic information on all hospital discharges from acute care hospitals in all Canadian provinces and territories with the exception of Québec. Clinical diagnoses are classified according to the International Statistical Classification of Diseases and Related Health Problems tenth revision (ICD-10) coding standards. We assessed individual-level records of hospitalization discharges among children younger than three years old with admission dates in CIHI-DAD between January 2007 and December 2017. We defined the primary outcome measure as an individual with either:
- The most responsible diagnosis code of acute rotavirus enteritis (A080.0)
- At least one of the separately recorded diagnoses, of which there are from 2 to 16, has a code of acute rotavirus enteritis (A080.0)
Nova Scotia publicly funded the rotavirus vaccine in 2019. Although the implementation date is outside of the timeframe considered in this study, one of the province's health authorities participated in a vaccine program in December 2010 with the aim of comparing the efficacy of two delivery systemsFootnote 6. Therefore, for the purpose of this evaluation, Nova Scotia is assessed as a jurisdiction that also had a vaccine program.
The Northwest Territories, Yukon and Nunavut were excluded from the analysis due to a lack of provincial/territorial reporting and/or a paucity of data from these jurisdictions. In total, these jurisdictions and Québec account for about 23% of the Canadian population.
We defined the pre and post-funding periods as the two years prior to and the two years after the year the vaccine was adopted into the immunization schedule. The year the vaccine was introduced was excluded from rate calculations to accommodate the vaccine uptake period.
Statistical analysis
National Enteric Surveillance Program data – community rotavirus infections
We summarized national counts of rotavirus laboratory cases reported to NESP by the participating provinces weekly and annually to reflect general reporting trends of community cases. Rotavirus season onset was identified as the first two consecutive weeks when the number of weekly cases was 15% over the annual median value or higher. Similarly, end of season was defined as the last two consecutive weeks where the number of cases was 15%, or less, of the median value. The week with the highest number of reported cases is referred to as the season peak.
Canadian Institute for Health Information-Discharge Administration Database data – hospitalizations
Children younger than three years old were grouped into one of the following age categories: younger than 12 months; 12 to 23 months; and 24 to 35 months. Statistics Canada population estimates were used to calculate age-specific annual rates of rotavirus gastroenteritis (RVGE) hospital discharges and for the reference periodsFootnote 7. Rates and 95% confidence intervals were calculated to estimate the difference between the pre and post-vaccine inclusion periods using the statistical package SAS version 9.3 (SAS Institute Inc., Cary, North Carolina, United States). Statistical significance was defined as p<0.05 from a two-sided Wald test.
Difference-in-difference approach
We used the difference-in-difference (DID) approach, a technique applied to evaluating changes in healthcare policyFootnote 8, to assess the impact of vaccinations on RVGE independently of hospitalizations. The key aspect of DID analysis is that, in addition to performing a simple comparison of rates from before and after the intervention (i.e. public funding of the vaccine) to see if rates have changed, there is also an adjustment for the hypothetical situation where there was no intervention and some other event may have been responsible for the observed change. For instance, a mild season of rotavirus after implementation might make the efficacy of the vaccine appear larger than it actually is. The DID approach corrects for this.
Results
Community rotavirus
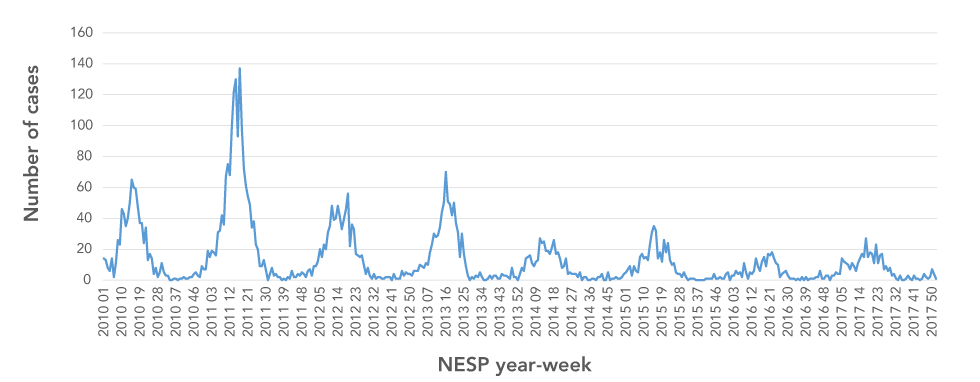
A total of 5,474 cases were reported to NESP between 2010 and 2017, with 76% of these cases reported over the first four years (2010–2013). Sustained and significant decreases (p<0.05) in the annual cases reported nationally to NESP occurred in subsequent years (2014–2017). At the peak of the 2011 rotavirus season, 137 cases were reported (annual median=14 per week) compared to a peak of 15 cases in 2017 (median=6) (Table 1; Figure 2). Over the seven-year period, the duration of the rotavirus season varied between 25 and 31 weeks. Between 2010 and 2015, 90% to 94% of annual cases were reported within the rotavirus season. Over 2016 to 2017, approximately 4% fewer cases were reported during the season, while more sporadic cases were reported at other times of the year.
| Statistics | 2010 | 2011 | 2012 | 2013 | 2014 | 2015 | 2016 | 2017 |
|---|---|---|---|---|---|---|---|---|
| Total no. of cases reported | 828 | 1,573 | 803 | 773 | 425 | 433 | 258 | 381 |
| Percentage of 10-year total (%) | 15.1 | 28.7 | 14.7 | 14.1 | 7.8 | 7.9 | 4.7 | 7.0 |
| Median no. of cases | 8 | 14 | 9 | 6 | 4 | 5 | 3 | 6 |
| Timing of season | ||||||||
Onset (NESP week) |
1 | 1 | 4 | 3 | 2 | 2 | 4 | 5 |
Peak |
15 | 17 | 19 | 16 | 11 | 15 | 22 | 17 |
End |
29 | 28 | 31 | 28 | 33 | 28 | 32 | 31 |
Duration (weeks) |
29 | 28 | 27 | 25 | 31 | 26 | 28 | 26 |
| No. of cases at peak | 65 | 137 | 56 | 70 | 27 | 35 | 18 | 27 |
| Percentage of annual cases reported in season (%) | 91.4 | 94.4 | 90.5 | 91.6 | 92.2 | 90.8 | 86.0 | 86.3 |
Figure 2: Weekly cases of laboratory-confirmed reported to National Enteric Surveillance Program, 2010–2017
Text description: Figure 2
The chart shows the seasonal trend in weekly laboratory-confirmed cases of rotavirus reported to the National Enteric Surveillance Program from 2010 to 2017. In each year, winter and spring have the highest number of cases. The chart indicates a decreasing trend in the number of cases each year.
Canadian Institute for Health Information-Discharge Administration Database data – hospital discharges
In the study period (2007–2017), infants and children younger than three years old comprised 70% (N=7,668) of all hospital RVGE discharges. In this group of children, RVGE was the "most responsible diagnosis" for 82% (n=5,379) of hospital discharges. Boys comprised 56% of discharged cases under three years old.
Overall, Canadian rates of rotavirus-related hospital discharges declined after provinces commenced funding rotavirus immunizations subsequent to the 2010 NACI recommendations (Table 2). A national comparison of pre and post-vaccine funding periods showed a reduction of 48.2 cases per 100,000 (95% CI, 43.9, 52.6) during the observation period.
| Province | Hospital discharges | Pre-vaccine vs post-vaccine rate differenceTable 2 footnote a | ||||||||||
|---|---|---|---|---|---|---|---|---|---|---|---|---|
| Pre-vaccine funding | Post-vaccine funding | |||||||||||
| Rate | LCL | UCL | Rate | LCL | UCL | Rate | LCL | UCL | % change | |||
| 2009–2010 | 2012–2013 | 2009–2010 vs 2012–2013 | ||||||||||
| Prince Edward Island | 241.7 | 138.3 | 345.0 | 70.8 | 14.1 | 127.5 | −170.8Table 2 footnote a | −288.7 | −53.0 | ↓70.7 | ||
| Ontario | 96.9 | 90.3 | 103.6 | 45.3 | 40.8 | 49.9 | −51.6Table 2 footnote a | −43.5 | −59.6 | ↓53.2 | ||
| New Brunswick | 130.7 | 97.1 | 164.4 | 166.6 | 128.1 | 205.1 | 35.8Table 2 footnote a | 78.0 | 188.8 | ↑10.6 | ||
| 2010–2011 | 2013–2014 | 2010–2011 vs 2013–2014 | ||||||||||
| British Columbia | 31.7 | 24.9 | 38.4 | 7.9 | 4.5 | 11.3 | −23.8Table 2 footnote a | −31.4 | −16.3 | ↓75.1 | ||
| Saskatchewan | 288.7 | 252.5 | 324.8 | 71.2 | 53.6 | 88.7 | −217.5Table 2 footnote a | −257.7 | −177.3 | ↓75.3 | ||
| New Brunswick | 169.6 | 131.2 | 208.0 | 169.8 | 130.6 | 209.7 | 0.23 | −46.9 | 47.4 | NS | ||
| 2012–2013 | 2015–2016 | 2012–2013 vs 2015–2016 | ||||||||||
| Manitoba | 14.6 | 6.9 | 22.2 | 4.9 | 0.6 | 9.3 | −9.6 | −18.4 | −0.8 | NS | ||
| New Brunswick | 155.1 | 117.9 | 192.1 | 118.8 | 85.6 | 152.1 | −36.2 | −80.9 | 8.5 | NS | ||
| 2013–2014 | 2016–2017 | 2013–2014 vs 2016–2017 | ||||||||||
| Alberta | 59.0 | 50.1 | 67.4 | 19.5 | 14.8 | 24.3 | −39.0Table 2 footnote a | −96.6 | −29.4 | ↓67.0 | ||
| New Brunswick | 169.8 | 130.6 | 209.1 | 121.8 | 88.0 | 155.5 | −48.1Table 2 footnote a | −95.1 | −1.1 | ↓28.3 | ||
| 2014–2015 | 2017 | 2014–2015 vs 2017 | ||||||||||
| Newfoundland & Labrador | 14.6 | 0.3 | 28.9 | 14.8 | −5.7 | 35.3 | 0.2 | −65.3 | −16.6 | NS | ||
| New Brunswick | 143.7 | 107.0 | 180.4 | 122.3 | 74.4 | 170.3 | −21.3 | −68.3 | 25.5 | NS | ||
| 2009–2010 | 2012–2013 | 2009–2010 vs 2012–2013 | ||||||||||
| Nova Scotia | 94.3 | 68.4 | 120.2 | 34.1 | 18.3 | 49.8 | −60.3Table 2 footnote a | −119.5 | −30.2 | ↓64.0 | ||
| New Brunswick | 130.7 | 97.1 | 164.4 | 166.6 | 128.1 | 205.1 | 35.8Table 2 footnote a | 78.0 | 188.8 | ↑10.6 | ||
Mean rates of RVGE hospital discharges of children declined by between 53% and 76% across the provinces after the implementation of publicly funded vaccination programs in six of the seven jurisdictions, Prince Edward Island, Ontario, British Columbia, Saskatchewan, Manitoba and Alberta. RVGE discharge rates also dropped in Nova Scotia. There was a fractional, but not significant, increase in the hospital discharge rates of children in Newfoundland and Labrador (Table 2).
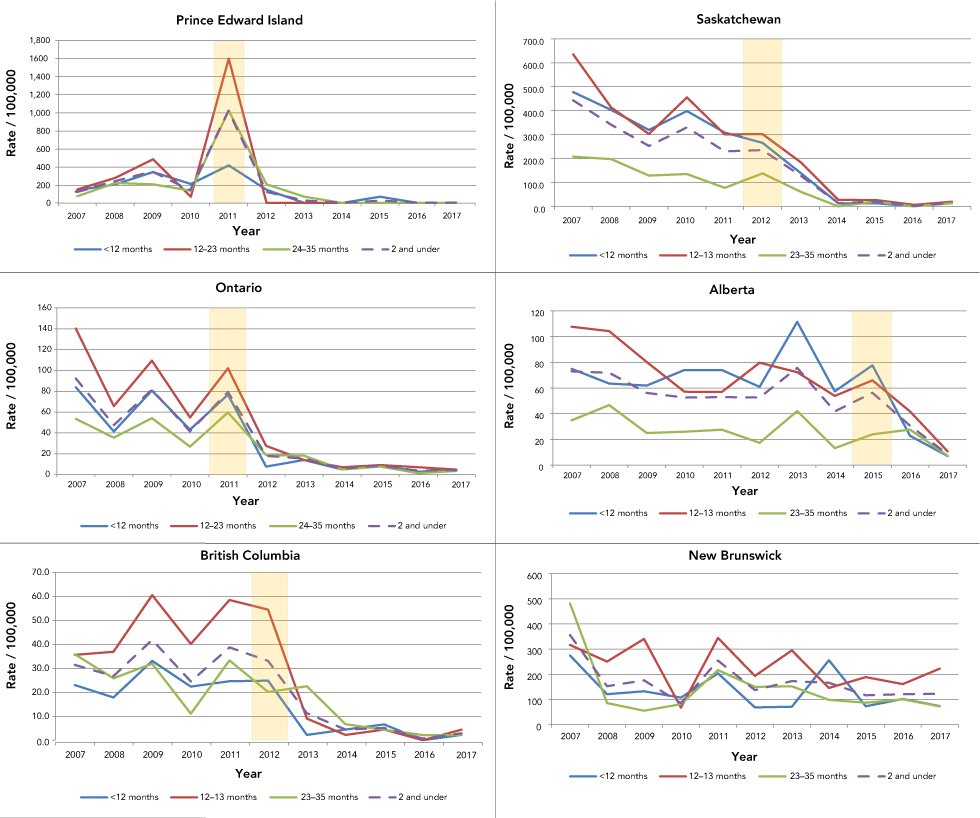
Within five years of the rotavirus vaccine being funded by the earliest adopters—Prince Edward Island, Ontario, British Columbia and Saskatchewan—RVGE discharge rates declined among children under three years of age. In these four provinces, such reductions were most prominent (over 85%) among infants and one-year-old children (Figure 3). There was also a statistically significant decrease in hospital discharge rates of two-year old children in Ontario and Saskatchewan.
Figure 3: Discharges per 100,000 of rotavirus gastroenteritis hospital discharges in the first five provinces to adopt the vaccine and New Brunswick, children younger than three years, by age group
Text description: Figure 3
The chart shows the rate (per 100,000 of the population) of rotavirus gastroenteritis cases for 2007 to 2017 for Prince Edward Island, Ontario, British Columbia, Saskatchewan, Alberta and New Brunswick. The post-vaccination period shows lower rates than the pre-vaccination period for Prince Edward Island, Ontario, British Columbia, Saskatchewan and Alberta. For New Brunswick, the trend is largely steady throughout 2007 to 2017.
Publicly funded immunization programs, as measured through a DID approach, reduced RVGE hospital discharge rates in Prince Edward Island, Ontario and Saskatchewan (p≤0.01) (Table 3). The program in Saskatchewan generated a prominent decrease of 201.4 cases per 100,000 (95% CI, −258.1, −144.8). Among children in Prince Edward Island, discharge rates dropped by 182.4 cases per 100,000 (95% CI, −308.6, −56.2). In Ontario, a decline of 63.1 (95% CI, −108.9, −17.4) was noted.
| Province | Treatment effectTable 3 footnote a between implementing jurisdiction and controlTable 3 footnote b | ||
|---|---|---|---|
| Change in rate per 100,000 | Lower confidence limit | Upper confidence limit | |
| Prince Edward Island | −182.4Table 3 footnote c | −308.6 | −56.2 |
| Ontario | −63.1Table 3 footnote c | −108.9 | −17.4 |
| British Columbia | −24.1 | −79.5 | 31.3 |
| Saskatchewan | −201.4Table 3 footnote c | −258.1 | −144.8 |
| Manitoba | 3.5 | −42.9 | 50.0 |
| Alberta | −3.2 | −51.9 | 45.5 |
| Newfoundland and Labrador | 16.9 | −46.1 | 79.8 |
| Nova Scotia | 9.1 | −22.4 | 40.6 |
Discussion
The two lines of evidence considered in this study identified decreasing rates of hospital discharges and community cases attributed to rotavirus infections in the regions where the rotavirus vaccine was publicly funded. Temporally, public funding appeared to lead to significant reductions in i) reports of laboratory-confirmed rotavirus cases reported by the provinces to NESP; and ii) RVGE-related hospital discharges.
The rates of RVGE reported to NESP dropped over 50% within the four years after provinces began implementing publicly funded immunization programs. Pre–post estimates of vaccine impact on RVGE hospital discharge rates were significantly lower for infants and one-year-old children in the provinces that funded the vaccine between December 2010 and September 2012. The dramatic rate reductions in young children is not unexpected, as historically these age groups have the highest rates of illness and so would benefit most from the direct effect of the vaccine with good coverage in the population. The Childhood National Immunization Coverage SurveyFootnote 9 reported coverage of rotavirus vaccine by the early adopting provinces to be 75.4%. Rates of vaccination coverage for rotavirus at the national level were not available prior to 2013.
Among the early-implementing provinces, the proportion of children under two years of age who had received the rotavirus vaccine was similar: British Columbia reported in 2015 that 75% of children aged younger than two years had received the two recommended doses of rotavirusFootnote 10. In the same year, 80% of Saskatchewan children under eight months had received the two recommended doses of rotavirusFootnote 11. Coverage assessments in Ontario showed rotavirus vaccine uptake had increased to 83% by 2014Footnote 12. In Prince Edward Island, where infant immunizations are delivered exclusively by public health nurses, coverage estimates are greater than 90%Footnote 5.
Though not as large, there was a distinct decline in RVGE-associated events in children in Alberta. These data may indicate lower coverage rates compared to the early adopters as the programs were underway only in the later stages of the study period. DID approach estimates for British Columbia and Alberta were not statistically significant, likely because the effects were much smaller and the effect was thus harder to detect. The DID approach found no significant reductions in RVGE hospital discharges for Nova Scotia. Our results parallel the findings from the investigation by Sanford et al.Footnote 6 that aimed to assess the relative effectiveness of public health nurses and physician offices as immunization delivery systems. The authors noted that there were no reductions in RVGE hospitalizations in study areas with low vaccine coverage. The vaccine coverage was less than 40% in the Nova Scotia setting.
Hospital RVGE discharge rates among children younger than two years old declined by more than 80% between the pre and post periods. By contrast, RVGE rates in New Brunswick, the comparison group, remained unchanged. This supports the claim that the public funding of the vaccine in Canada has been the cause of declining rotavirus infections and not a temporally aligned third factor, such as a milder season of rotavirus.
To date, three Canadian provinces, Ontario, Prince Edward Island and Québec have completed large cohort or population-based vaccination-impact studies for their respective jurisdictions. Each of these studies demonstrated large reductions in RVGE following the implementation of publicly funded programs. The program in Ontario translated to a reduction of up to 79% for RVGE hospitalizations in youth and children younger than 20 years oldFootnote 12Footnote 13 . A study in Québec identified an 80.1% reduction in positive tests of RVGE at the Montréal Children’s Hospital in 2012 to 2013, a year after the vaccine was introduced, compared to 2006 to 2009Footnote 14. In Prince Edward Island, a universal infant rotavirus vaccine program delivered by public health nurses resulted in the elimination of RVGE hospitalizations among children younger than 24 months old by the second year of the program Footnote 5.
The declines noted in the national study presented here and the individual provincial assessments are consistent with findings in multiple high-income countries where RVGE-related hospitalizations fell due to similar vaccination programs. Investigations on the impact of rotavirus vaccinations campaigns conducted in high-income countries reported modest to dramatic reductions in rotavirus hospital admissions, depending on the population assessedFootnote 15Footnote 16.
Immunization can give rise to changes in disease transmission, reducing illness directly in the vaccinated population and indirectly in unvaccinated individualsFootnote 17. Indirect immunity may be generated by community immunityFootnote 18. The data available for this study are insufficient to ascertain whether unvaccinated children remained free of illness. However, under a publicly funded immunization program, it is assumed that the majority of the target population will be administered the vaccine.
Limitations
There are several limitations to our study. First, we did not know the vaccine status of cases. In addition, rotavirus infections are not nationally reportable, and so there is no single monitoring system to capture all occurrences of rotavirus in Canadian communities. We therefore leveraged one national surveillance program and hospital discharge data as surrogates. However, doing so was not without challenges. The NESP data are devoid of information on age and sex, and reported cases may be older than the age group considered in this study. Limited diagnostic testing of symptomatic cases results in an under-representation of cases reported to all databases.
Furthermore, clinical presentation of rotavirus disease can be indistinguishable from other forms of acute diarrhea and most cases are treated symptomatically. The symptomatic treatment of acute gastroenteritis cases and the nature of reporting RVGE results in relatively low apparent annual rates of infection. This creates a problem in interpreting the burden of disease, as these rates of infection are, to a large degree, negatively biased. Nonetheless, we were primarily interested in trends, that is, how these rates may have fallen as a result of vaccination interventions. To do this, we assume that any reporting biases that existed in each system remain the same from year to year.
Also of note, hospital data from Québec are not available through the CIHI-DAD system, and hospital discharge data from Northwest Territories, Yukon and Nunavut are scarce. These four jurisdictions, comprising approximately 23% of the Canadian population, were not included in this study.
Though we observed significant decreases in disease burden after introduction of the vaccine, the reductions may not be due to vaccine alone. Years of low RVGE activity have been reported in the absence of vaccination, as was the case in the Netherlands in 2013–2014Footnote 19 . Natural fluctuations in disease incidence could have contributed to the observations presented here. The use of the DID estimator moderates this limitation.
Conclusion
In summary, this is a national evaluation of rotavirus vaccine programs in Canada. Our evaluation uses an innovative approach, the DID methodology, to show that depending on when programs were implemented rates of rotavirus-related infections and hospitalizations decreased. Further investigations using innovative methods will be required to detect further changes over time.
Authors’ statement
- PKM — Conceptualization, investigation, data curation, formal analysis, drafting original manuscript
- MH — Methodology, reviewing & editing manuscript
- SD — Conceptualization, reviewing & editing manuscript
Competing interests
None.
Acknowledgements
This work was supported by the Public Health Agency of Canada.
Funding
All efforts related to this project were undertaken as part of the obligations of the Centre for Foodborne, Environmental and Zoonotic Infectious Diseases and the Centre for Immunization and Respiratory Infectious Diseases. No external sources of funds were provided for the completion of this work.
