
Seasonal patterns of coronavirus and other respiratory viruses

 Download this article as a PDF
Published by: The Public Health Agency of Canada
Issue: Volume 47-3: Influenza and Other Respiratory Viruses
Date published: March 2021
ISSN: 1481-8531
Submit a manuscript
About CCDR
Browse
Volume 47-3: Influenza and Other Respiratory Viruses
Overview
Seasonality of coronaviruses and other respiratory viruses in Canada: Implications for COVID-19
Philippe Lagacé-Wiens1,2, Jared Bullard1,3,4, Roy Cole5, Paul Van Caeseele1,3,4
Affiliations
1 Department of Medical Microbiology and Infectious Diseases, Max Rady College of Medicine, Rady Faculty of Health Sciences, University of Manitoba, Winnipeg, MB
2 Clinical Microbiology, Diagnostics Services, Shared Health, Winnipeg, MB
3 Cadham Provincial Laboratory, Manitoba Health, Winnipeg, MB
4 Department of Pediatrics & Child Health, Max Rady College of Medicine, Rady Faculty of Health Sciences, University of Manitoba, Winnipeg, MB
5 National Microbiology Laboratory, Public Health Agency of Canada, Winnipeg, MB
Correspondence
Suggested citation
Lagacé-Wiens P, Bullard J, Cole R, Van Caeseele P. Seasonality of coronaviruses and other respiratory viruses in Canada: Implications for COVID-19. Can Commun Dis Rep 2021;47(3):132-8. https://doi.org/10.14745/ccdr.v47i03a02
Keywords: coronavirus, SARS-CoV-2, COVID-19, epidemiology, Canada, seasonality
Abstract
Background: Like endemic coronaviruses, severe acute respiratory syndrome coronavirus 2 (SARS-CoV-2) is believed to have emerged in humans from a zoonotic source and may ultimately develop a seasonal pattern. A seasonal pattern, particularly if combined with other seasonal outbreaks of respiratory virus infections, may have significant impacts on the healthcare system. We evaluated the seasonal pattern of existing endemic coronaviruses and several other common respiratory viruses to determine the potential impacts of added burden of respiratory disease should SARS-CoV-2 establish seasonality.
Methods: National surveillance data for laboratory confirmations of endemic coronaviruses, influenza A and B viruses, rhinovirus/enterovirus, human metapneumovirus, respiratory syncytial virus and parainfluenza virus for the past 10 years were obtained from the Government of Canada Open Data and FluWatch. Epidemic curves were generated from total case numbers and percent of samples testing positive for each respiratory virus by epidemiological week.
Results: In Canada, endemic coronaviruses and other common respiratory viruses cause annual seasonal outbreaks in the winter months. Should SARS-CoV-2 develop a seasonal pattern similar to endemic coronaviruses and respiratory viruses, co-circulation would be expected to peak between January and March. Peak endemic coronavirus activity occurs during the nadir of rhinovirus/enterovirus and parainfluenza activity.
Conclusion: Healthcare settings, assisted-living and long-term care homes, schools and essential services employers should anticipate and have contingencies for seasonal outbreaks of SARS-CoV-2 and co-circulating respiratory viruses during peak seasons. Given the likelihood of co-circulation, diagnostic multiplex testing targeting co-circulating pathogens may be more efficient than single target assays for symptomatic individuals if a seasonal pattern to coronavirus disease 2019 (COVID-19) is established.
Introduction
In December 2019, a novel coronavirus, severe acute respiratory syndrome coronavirus 2 (SARS-CoV-2), emerged and spread rapidly and globally via efficient human-to-human transmissionFootnote 1. The virus is currently believed to have emerged from a zoonotic reservoir and is most closely related to known bat coronaviruses; however, the exact zoonotic path to efficient human-to-human transmission remains unknownFootnote 2. Zoonotic emergence of human coronaviruses is hardly surprising and has historically been the common origin of all human coronavirusesFootnote 2. While zoonotic origin is common to all coronaviruses, some have established human endemicity while others have not. The highly pathogenic beta-coronaviruses, severe acute respiratory coronavirus 1 (SARS-CoV-1), the cause of the 2003 sudden acute respiratory syndrome (SARS) outbreak and the cause of Middle East respiratory syndrome (MERS) virus, both emerged from bat coronaviruses via intermediate hosts (civet cats and camels, respectively) but never established human endemicity. In addition, there are four endemic coronaviruses that have been circulating in humans (since prior to SARS-CoV-2); each of which had emerged from zoonotic reservoirs at different times in the past (Table 1)Footnote 2. Molecular analysis of coronavirus genomes has shown that coronaviruses crossed into human populations periodically throughout history, likely resulting in epidemics at the time of emergence. Prior to the widespread emergence of SARS-CoV-2, the most recent global emergence of a now-endemic human coronavirus was OC43, which is estimated to have occurred around 1890, coinciding with, and bringing into question the cause of the so-called "Russian flu"Footnote 2Footnote 3. While the factors associated with a virus establishing endemicity are not known, viruses that establish endemicity have common features: efficient person-to-person spread; global expansion; and limited severity (severe symptomatology contributes to rapid containment of cases). Seasonality likely adds an element of sustainability for a viral pathogen as well because sustained epidemics eventually lead to herd immunity while intermittent or seasonal epidemics allow a return of susceptible hosts in interepidemic periods.
| Endemic coronavirus | Reservoir | Intermediate host | Estimated emergence in humans | Discovery |
|---|---|---|---|---|
| NL63 | Bats | Unknown | 560-820 years ago | 2004 |
| 229E | Bats | Camelids | ~200 years ago | 1966 |
| HKU1 | Rodents | Unknown | ~1950s | 2004 |
| OC43 | Rodents | Bovines | ~1890 | 1967 |
All four of these endemic coronaviruses followed a common path from animals to humans and established endemic circulation through efficient human-to-human spread, modest symptomatology and seasonality. Thus, we hypothesize that zoonotic emergence and the spread of SARS-CoV-2 may result in establishing human endemicity. The understanding the seasonality of endemic coronaviruses as a whole may predict the eventual seasonality of SARS-CoV-2. We sought to describe the seasonal pattern of endemic coronaviruses, as well as other common respiratory viral infections, using national laboratory surveillance to better understand the possible implications of SARS-CoV-2 becoming a seasonal epidemic. In addition, we provide guidance for efficiencies in laboratory testing strategies that may be helpful in the eventual management of influenza, respiratory syncytial virus (RSV), SARS-CoV-2 and other respiratory pathogens.
Methods
National respiratory virus surveillance is coordinated by the Public Health Agency of Canada (PHAC) under a program known as FluWatch. Data from multiple sentinel public health and hospital laboratories across Canada are collected and published on a weekly basis. For coronavirus and viruses other than RSV and influenza A and B, epidemiological surveillance by FluWatch is nationally comprehensive and includes data from all major laboratories in Canada that perform testing. Both the number of positive detections and test volumes for each virus are supplied to FluWatch. These laboratories include all the provincial public health laboratories, and, in Ontario, they include the additional hospital laboratories that perform virus diagnostics: Children's Hospital of Eastern Ontario (Ottawa); University Health Network/Mount Sinai Hospital (Toronto); Sick Kids Hospital (Toronto); Sunnybrook Health Sciences Centre and Women's College Hospital (Toronto); St. Joseph's Hospital (London); and St. Joseph's Healthcare (Hamilton). Combined, these sentinel laboratories represent all laboratory-confirmed detections of coronavirus and respiratory viruses in Canada, with the exceptions of SARS-CoV-2, influenza and RSV. For influenza and RSV, the laboratory data are comprehensive for all provinces except Ontario, where detections may occur outside of the sentinel surveillance system. However, FluWatch captures more than 60% of cases through the Ontario provincial laboratory network and the majority of the remaining cases are likely captured through the sentinel hospital laboratories in Ontario. The data are supplied to the PHAC on a weekly basis and validated in a year-end report.
We retrieved the public data on laboratory-confirmed cases and testing volumes for endemic coronaviruses (NL63, 229E, HKU1 and OC43), influenza A and B viruses, rhinovirus/enterovirus (considered together because some molecular assays cannot distinguish between them), RSV, human metapneumovirus and parainfluenza virus. The study period for all viruses spanned the 2010-11 respiratory virus season (starting epidemiological week 35 of 2010, beginning August 30, 2010) through epidemiological week 10 of the 2019-20 season (ending March 7, 2020). Detections and test volumes were obtained from the Canadian open data website (https://open.canada.ca/en/open-data) and FluWatch reports (https://www.canada.ca/en/public-health/services/diseases/flu-influenza/influenza-surveillance.html). These data sets came from open-access sources of ongoing public health surveillance and are exempt from research ethics board approval. Data were complete for the entire study period. Data from 2011 through 2019 have been finalized by FluWatch for their year-end report; however, data from 2020 were collected in real-time and minor reporting delays from provinces may have occurred. Data from the most current three weeks was occasionally adjusted as updated information was received in the following weeks. At the time of this publication, all data up to and including epidemiological week 16 (April 19, 2020) were considered final.
Weekly cases and percent of tests positive were used to provide an average number of cases per week and average percent-positive specimens per week for each virus. Peak activity of each virus was defined as the maximum percent-positive samples and, if a distinct epidemic wave was observed in the combined 10-year data, the start and end of the virus season was defined as the first week and last week that percent positive exceeded 10% of the peak percent positive, respectively.
Results
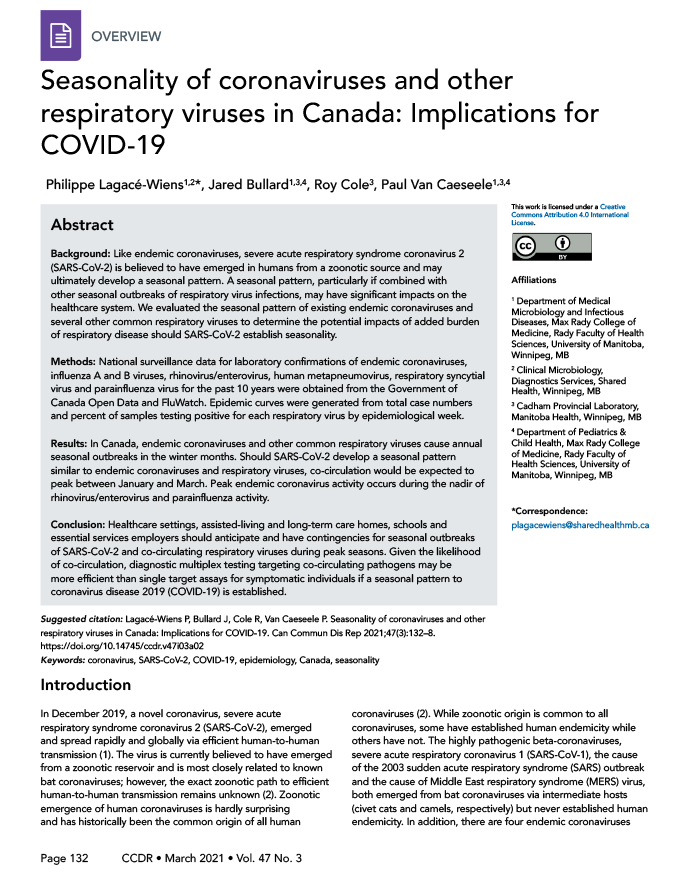
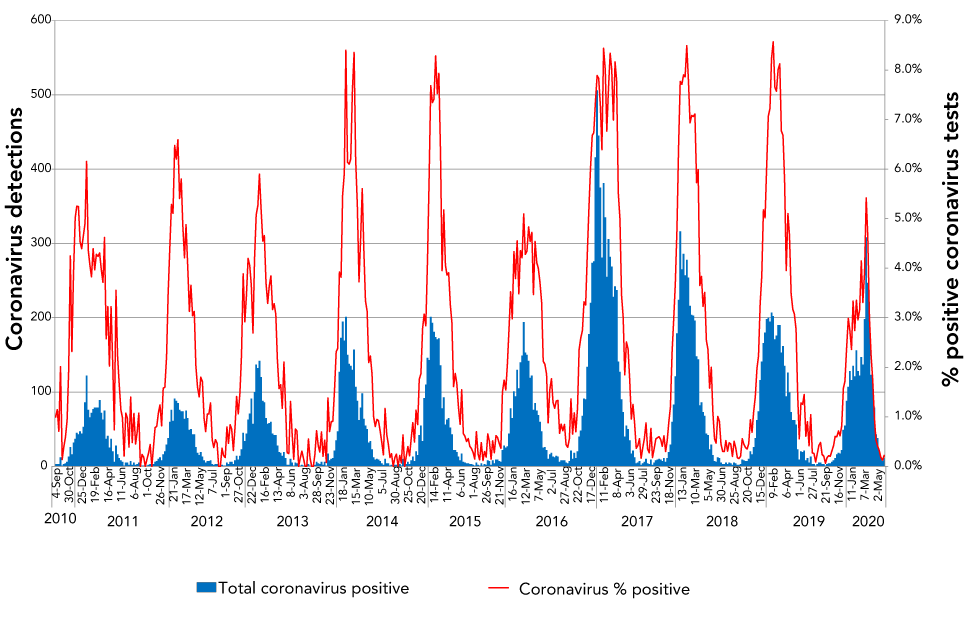
Endemic coronaviruses demonstrated strong and predictable seasonality in Canada with modest variation in intensity from year to year. This was consistent with other descriptions of global coronavirus periodicity that reported winter seasonalityFootnote 5Footnote 6. Both the number of cases of endemic coronavirus and proportion of positive coronavirus tests had dramatic periodicity with minimal year-to-year variation in onset and duration of the seasonal epidemic (Figure 1). Coronavirus seasonality in Canada, as determined by the ten-year average of positive test proportion and average number of cases detected by epidemiological week, is shown (Figure 2). A typical coronavirus season, defined here as the time above 10% percent of the highest percent positivity, began around epidemiological week 43 (typically the end of October), peaked in week five (end of January) and lasted until week 23 (early June), yielding an epidemic wave lasting 30 weeks, with significant activity between January and March and peak activity in week six (early February).
Figure 1: Seasonal pattern of endemic coronavirus detections and percent of coronavirus tests positive for endemic coronaviruses for the past ten yearsFigure 1 footnote a
Text description: Figure 1
| Year | Date | Total coronavirus positive | Coronavirus % positive |
|---|---|---|---|
| 2010 | 4-Sep | 3 | 1.0% |
| 11-Sep | 3 | 1.1% | |
| 18-Sep | 3 | 0.7% | |
| 25-Sep | 12 | 2.0% | |
| 2-Oct | 1 | 0.1% | |
| 9-Oct | 3 | 0.4% | |
| 16-Oct | 4 | 0.6% | |
| 23-Oct | 6 | 0.9% | |
| 30-Oct | 13 | 1.9% | |
| 6-Nov | 26 | 4.2% | |
| 13-Nov | 16 | 2.3% | |
| 20-Nov | 32 | 3.9% | |
| 27-Nov | 37 | 5.0% | |
| 4-Dec | 45 | 5.3% | |
| 11-Dec | 43 | 5.2% | |
| 18-Dec | 47 | 4.5% | |
| 25-Dec | 44 | 4.4% | |
| 2011 | 1-Jan | 53 | 4.7% |
| 8-Jan | 86 | 4.9% | |
| 15-Jan | 122 | 6.2% | |
| 22-Jan | 76 | 4.4% | |
| 29-Jan | 66 | 4.1% | |
| 5-Feb | 72 | 3.8% | |
| 12-Feb | 77 | 4.4% | |
| 19-Feb | 79 | 4.0% | |
| 26-Feb | 79 | 4.3% | |
| 5-Mar | 79 | 4.2% | |
| 12-Mar | 89 | 4.3% | |
| 19-Mar | 72 | 4.0% | |
| 26-Mar | 63 | 3.7% | |
| 2-Apr | 75 | 4.6% | |
| 9-Apr | 37 | 2.6% | |
| 16-Apr | 41 | 3.2% | |
| 23-Apr | 25 | 2.0% | |
| 30-Apr | 37 | 3.2% | |
| 7-May | 20 | 2.1% | |
| 14-May | 6 | 0.7% | |
| 21-May | 28 | 3.6% | |
| 28-May | 16 | 2.2% | |
| 4-Jun | 11 | 1.7% | |
| 11-Jun | 8 | 1.1% | |
| 18-Jun | 6 | 1.0% | |
| 25-Jun | 1 | 0.2% | |
| 2-Jul | 5 | 1.1% | |
| 9-Jul | 5 | 1.0% | |
| 16-Jul | 2 | 0.4% | |
| 23-Jul | 7 | 1.4% | |
| 30-Jul | 2 | 0.5% | |
| 6-Aug | 5 | 1.1% | |
| 13-Aug | 2 | 0.5% | |
| 20-Aug | 3 | 0.7% | |
| 27-Aug | 5 | 1.1% | |
| 3-Sep | 0 | 0.0% | |
| 10-Sep | 1 | 0.2% | |
| 17-Sep | 1 | 0.2% | |
| 24-Sep | 0 | 0.0% | |
| 1-Oct | 1 | 0.1% | |
| 8-Oct | 2 | 0.3% | |
| 15-Oct | 3 | 0.4% | |
| 22-Oct | 0 | 0.0% | |
| 29-Oct | 3 | 0.4% | |
| 5-Nov | 6 | 0.8% | |
| 12-Nov | 7 | 0.8% | |
| 19-Nov | 10 | 1.1% | |
| 26-Nov | 12 | 1.2% | |
| 3-Dec | 8 | 0.8% | |
| 10-Dec | 16 | 1.6% | |
| 17-Dec | 20 | 1.6% | |
| 24-Dec | 29 | 2.2% | |
| 31-Dec | 38 | 3.5% | |
| 2012 | 7-Jan | 60 | 4.4% |
| 14-Jan | 76 | 5.3% | |
| 21-Jan | 61 | 5.1% | |
| 28-Jan | 91 | 6.5% | |
| 4-Feb | 88 | 6.2% | |
| 11-Feb | 85 | 6.6% | |
| 18-Feb | 76 | 5.4% | |
| 25-Feb | 74 | 5.8% | |
| 3-Mar | 74 | 4.9% | |
| 10-Mar | 64 | 4.2% | |
| 17-Mar | 75 | 4.9% | |
| 24-Mar | 65 | 4.0% | |
| 31-Mar | 49 | 3.1% | |
| 7-Apr | 50 | 3.7% | |
| 14-Apr | 43 | 3.0% | |
| 21-Apr | 43 | 3.1% | |
| 28-Apr | 26 | 2.0% | |
| 5-May | 18 | 1.6% | |
| 12-May | 15 | 1.4% | |
| 19-May | 19 | 1.8% | |
| 26-May | 13 | 1.7% | |
| 2-Jun | 8 | 1.0% | |
| 9-Jun | 5 | 0.7% | |
| 16-Jun | 7 | 1.1% | |
| 23-Jun | 7 | 1.1% | |
| 30-Jun | 8 | 1.3% | |
| 7-Jul | 3 | 0.5% | |
| 14-Jul | 2 | 0.4% | |
| 21-Jul | 3 | 0.5% | |
| 28-Jul | 3 | 0.5% | |
| 4-Aug | 0 | 0.0% | |
| 11-Aug | 0 | 0.0% | |
| 18-Aug | 2 | 0.4% | |
| 25-Aug | 1 | 0.2% | |
| 1-Sep | 1 | 0.2% | |
| 8-Sep | 5 | 0.8% | |
| 15-Sep | 3 | 0.5% | |
| 22-Sep | 6 | 0.8% | |
| 29-Sep | 6 | 0.7% | |
| 6-Oct | 3 | 0.3% | |
| 13-Oct | 8 | 0.8% | |
| 20-Oct | 14 | 1.4% | |
| 27-Oct | 9 | 1.1% | |
| 3-Nov | 14 | 1.5% | |
| 10-Nov | 23 | 2.2% | |
| 17-Nov | 45 | 3.9% | |
| 24-Nov | 34 | 2.9% | |
| 1-Dec | 44 | 3.4% | |
| 8-Dec | 63 | 4.2% | |
| 15-Dec | 71 | 4.1% | |
| 22-Dec | 91 | 3.7% | |
| 29-Dec | 57 | 2.7% | |
| 2013 | 5-Jan | 100 | 4.2% |
| 12-Jan | 137 | 5.1% | |
| 19-Jan | 132 | 5.3% | |
| 26-Jan | 142 | 5.9% | |
| 2-Feb | 120 | 5.2% | |
| 9-Feb | 88 | 4.5% | |
| 16-Feb | 86 | 4.7% | |
| 23-Feb | 65 | 3.7% | |
| 2-Mar | 57 | 3.3% | |
| 9-Mar | 58 | 3.6% | |
| 16-Mar | 60 | 3.8% | |
| 23-Mar | 44 | 3.2% | |
| 30-Mar | 42 | 3.3% | |
| 6-Apr | 42 | 3.1% | |
| 13-Apr | 28 | 2.2% | |
| 20-Apr | 19 | 1.6% | |
| 27-Apr | 18 | 1.6% | |
| 4-May | 14 | 1.2% | |
| 11-May | 19 | 2.1% | |
| 18-May | 11 | 1.2% | |
| 25-May | 2 | 0.3% | |
| 1-Jun | 2 | 0.3% | |
| 8-Jun | 10 | 1.3% | |
| 15-Jun | 5 | 0.7% | |
| 22-Jun | 1 | 0.1% | |
| 29-Jun | 5 | 0.8% | |
| 6-Jul | 4 | 0.7% | |
| 13-Jul | 0 | 0.0% | |
| 20-Jul | 1 | 0.2% | |
| 27-Jul | 2 | 0.3% | |
| 3-Aug | 1 | 0.2% | |
| 10-Aug | 0 | 0.0% | |
| 17-Aug | 0 | 0.0% | |
| 24-Aug | 3 | 0.6% | |
| 31-Aug | 1 | 0.2% | |
| 7-Sep | 0 | 0.0% | |
| 14-Sep | 0 | 0.0% | |
| 21-Sep | 2 | 0.2% | |
| 28-Sep | 6 | 0.7% | |
| 5-Oct | 4 | 0.4% | |
| 12-Oct | 3 | 0.3% | |
| 19-Oct | 6 | 0.7% | |
| 26-Oct | 2 | 0.2% | |
| 2-Nov | 6 | 0.5% | |
| 9-Nov | 1 | 0.1% | |
| 16-Nov | 17 | 1.4% | |
| 23-Nov | 8 | 0.7% | |
| 30-Nov | 10 | 0.9% | |
| 7-Dec | 11 | 0.9% | |
| 14-Dec | 21 | 1.5% | |
| 21-Dec | 35 | 2.3% | |
| 28-Dec | 47 | 2.4% | |
| 2014 | 4-Jan | 127 | 3.9% |
| 11-Jan | 173 | 3.8% | |
| 18-Jan | 195 | 5.5% | |
| 25-Jan | 169 | 5.9% | |
| 1-Feb | 201 | 8.4% | |
| 8-Feb | 150 | 6.1% | |
| 15-Feb | 138 | 6.1% | |
| 22-Feb | 135 | 6.2% | |
| 1-Mar | 130 | 7.6% | |
| 8-Mar | 157 | 8.4% | |
| 15-Mar | 107 | 6.2% | |
| 22-Mar | 88 | 5.3% | |
| 29-Mar | 62 | 3.7% | |
| 5-Apr | 79 | 4.6% | |
| 12-Apr | 98 | 5.6% | |
| 19-Apr | 64 | 4.3% | |
| 26-Apr | 55 | 3.3% | |
| 3-May | 50 | 3.1% | |
| 10-May | 32 | 2.1% | |
| 17-May | 34 | 2.2% | |
| 24-May | 23 | 1.9% | |
| 31-May | 12 | 1.0% | |
| 7-Jun | 9 | 0.8% | |
| 14-Jun | 10 | 0.9% | |
| 21-Jun | 9 | 0.9% | |
| 28-Jun | 7 | 0.7% | |
| 5-Jul | 4 | 0.5% | |
| 12-Jul | 2 | 0.2% | |
| 19-Jul | 10 | 1.2% | |
| 26-Jul | 4 | 0.6% | |
| 2-Aug | 4 | 0.5% | |
| 9-Aug | 1 | 0.2% | |
| 16-Aug | 2 | 0.3% | |
| 23-Aug | 0 | 0.0% | |
| 30-Aug | 2 | 0.2% | |
| 6-Sep | 2 | 0.2% | |
| 13-Sep | 0 | 0.0% | |
| 20-Sep | 3 | 0.2% | |
| 27-Sep | 1 | 0.1% | |
| 4-Oct | 10 | 0.6% | |
| 11-Oct | 0 | 0.0% | |
| 18-Oct | 3 | 0.2% | |
| 25-Oct | 6 | 0.4% | |
| 1-Nov | 3 | 0.2% | |
| 8-Nov | 8 | 0.5% | |
| 15-Nov | 13 | 0.9% | |
| 22-Nov | 7 | 0.5% | |
| 29-Nov | 20 | 1.1% | |
| 6-Dec | 15 | 0.8% | |
| 13-Dec | 42 | 1.8% | |
| 20-Dec | 55 | 1.9% | |
| 27-Dec | 34 | 2.8% | |
| 2015 | 3-Jan | 92 | 3.1% |
| 10-Jan | 110 | 2.8% | |
| 17-Jan | 146 | 4.2% | |
| 24-Jan | 143 | 5.7% | |
| 31-Jan | 201 | 7.7% | |
| 7-Feb | 193 | 7.3% | |
| 14-Feb | 181 | 7.4% | |
| 21-Feb | 174 | 8.3% | |
| 28-Feb | 171 | 7.5% | |
| 7-Mar | 172 | 7.9% | |
| 14-Mar | 136 | 6.3% | |
| 21-Mar | 78 | 4.0% | |
| 28-Mar | 93 | 5.2% | |
| 4-Apr | 56 | 4.1% | |
| 11-Apr | 63 | 3.9% | |
| 18-Apr | 65 | 3.9% | |
| 25-Apr | 52 | 3.3% | |
| 2-May | 43 | 2.9% | |
| 9-May | 22 | 1.6% | |
| 16-May | 22 | 1.9% | |
| 23-May | 19 | 1.7% | |
| 30-May | 13 | 1.2% | |
| 6-Jun | 8 | 0.8% | |
| 13-Jun | 17 | 1.5% | |
| 20-Jun | 6 | 0.7% | |
| 27-Jun | 5 | 0.6% | |
| 4-Jul | 4 | 0.5% | |
| 11-Jul | 4 | 0.6% | |
| 18-Jul | 3 | 0.4% | |
| 25-Jul | 3 | 0.4% | |
| 1-Aug | 2 | 0.3% | |
| 8-Aug | 1 | 0.1% | |
| 15-Aug | 5 | 0.7% | |
| 22-Aug | 2 | 0.2% | |
| 29-Aug | 1 | 0.1% | |
| 5-Sep | 4 | 0.5% | |
| 12-Sep | 1 | 0.1% | |
| 19-Sep | 3 | 0.3% | |
| 26-Sep | 2 | 0.2% | |
| 3-Oct | 8 | 0.7% | |
| 10-Oct | 7 | 0.5% | |
| 17-Oct | 2 | 0.1% | |
| 24-Oct | 8 | 0.5% | |
| 31-Oct | 4 | 0.3% | |
| 7-Nov | 9 | 0.6% | |
| 14-Nov | 9 | 0.6% | |
| 21-Nov | 7 | 0.5% | |
| 28-Nov | 6 | 0.4% | |
| 5-Dec | 22 | 1.5% | |
| 12-Dec | 28 | 1.7% | |
| 19-Dec | 25 | 1.5% | |
| 26-Dec | 27 | 2.1% | |
| 2016 | 2-Jan | 44 | 2.8% |
| 9-Jan | 78 | 3.5% | |
| 16-Jan | 65 | 3.0% | |
| 23-Jan | 101 | 4.3% | |
| 30-Jan | 94 | 3.8% | |
| 6-Feb | 130 | 4.6% | |
| 13-Feb | 105 | 3.5% | |
| 20-Feb | 140 | 4.4% | |
| 27-Feb | 149 | 4.2% | |
| 5-Mar | 194 | 5.1% | |
| 12-Mar | 153 | 4.3% | |
| 19-Mar | 150 | 4.3% | |
| 26-Mar | 142 | 4.8% | |
| 2-Apr | 119 | 4.5% | |
| 9-Apr | 122 | 4.7% | |
| 16-Apr | 76 | 3.5% | |
| 23-Apr | 85 | 4.5% | |
| 30-Apr | 75 | 4.1% | |
| 7-May | 69 | 4.0% | |
| 14-May | 60 | 3.7% | |
| 21-May | 47 | 3.3% | |
| 28-May | 25 | 2.1% | |
| 4-Jun | 26 | 2.1% | |
| 11-Jun | 22 | 1.9% | |
| 18-Jun | 10 | 0.9% | |
| 25-Jun | 16 | 1.6% | |
| 2-Jul | 18 | 1.8% | |
| 9-Jul | 13 | 1.3% | |
| 16-Jul | 12 | 1.2% | |
| 23-Jul | 14 | 1.3% | |
| 30-Jul | 13 | 1.3% | |
| 6-Aug | 6 | 0.7% | |
| 13-Aug | 8 | 0.9% | |
| 20-Aug | 8 | 0.7% | |
| 27-Aug | 8 | 0.8% | |
| 3-Sep | 5 | 0.4% | |
| 10-Sep | 4 | 0.4% | |
| 17-Sep | 7 | 0.6% | |
| 24-Sep | 21 | 1.4% | |
| 1-Oct | 10 | 0.7% | |
| 8-Oct | 18 | 1.1% | |
| 15-Oct | 11 | 0.7% | |
| 22-Oct | 20 | 1.2% | |
| 29-Oct | 40 | 2.4% | |
| 5-Nov | 48 | 2.6% | |
| 12-Nov | 68 | 2.7% | |
| 19-Nov | 91 | 3.3% | |
| 26-Nov | 90 | 3.3% | |
| 3-Dec | 134 | 4.3% | |
| 10-Dec | 178 | 5.2% | |
| 17-Dec | 220 | 6.0% | |
| 24-Dec | 274 | 6.7% | |
| 31-Dec | 276 | 6.7% | |
| 2017 | 7-Jan | 416 | 7.4% |
| 14-Jan | 506 | 7.9% | |
| 21-Jan | 445 | 7.8% | |
| 28-Jan | 375 | 7.3% | |
| 4-Feb | 281 | 6.4% | |
| 11-Feb | 381 | 8.4% | |
| 18-Feb | 335 | 8.0% | |
| 25-Feb | 255 | 6.8% | |
| 4-Mar | 306 | 7.6% | |
| 11-Mar | 282 | 8.3% | |
| 18-Mar | 269 | 8.0% | |
| 25-Mar | 228 | 7.0% | |
| 1-Apr | 242 | 8.2% | |
| 8-Apr | 237 | 7.8% | |
| 15-Apr | 141 | 5.5% | |
| 22-Apr | 127 | 5.0% | |
| 29-Apr | 90 | 3.5% | |
| 6-May | 73 | 3.0% | |
| 13-May | 40 | 1.8% | |
| 20-May | 55 | 2.5% | |
| 27-May | 50 | 2.4% | |
| 3-Jun | 35 | 1.8% | |
| 10-Jun | 17 | 1.0% | |
| 17-Jun | 21 | 1.3% | |
| 24-Jun | 12 | 0.9% | |
| 1-Jul | 4 | 0.4% | |
| 8-Jul | 5 | 0.4% | |
| 15-Jul | 7 | 0.6% | |
| 22-Jul | 2 | 0.2% | |
| 29-Jul | 4 | 0.4% | |
| 5-Aug | 6 | 0.6% | |
| 12-Aug | 10 | 0.9% | |
| 19-Aug | 4 | 0.4% | |
| 26-Aug | 3 | 0.3% | |
| 2-Sep | 9 | 0.8% | |
| 9-Sep | 2 | 0.2% | |
| 16-Sep | 5 | 0.4% | |
| 23-Sep | 8 | 0.6% | |
| 30-Sep | 9 | 0.6% | |
| 7-Oct | 10 | 0.6% | |
| 14-Oct | 9 | 0.5% | |
| 21-Oct | 7 | 0.4% | |
| 28-Oct | 11 | 0.6% | |
| 4-Nov | 6 | 0.3% | |
| 11-Nov | 11 | 0.5% | |
| 18-Nov | 19 | 0.9% | |
| 25-Nov | 29 | 1.2% | |
| 2-Dec | 60 | 2.3% | |
| 9-Dec | 83 | 3.0% | |
| 16-Dec | 121 | 3.7% | |
| 23-Dec | 179 | 4.8% | |
| 30-Dec | 224 | 6.5% | |
| 2018 | 6-Jan | 316 | 7.8% |
| 13-Jan | 265 | 7.7% | |
| 20-Jan | 286 | 7.9% | |
| 27-Jan | 257 | 7.9% | |
| 3-Feb | 278 | 8.5% | |
| 10-Feb | 254 | 7.8% | |
| 17-Feb | 216 | 6.9% | |
| 24-Feb | 204 | 7.1% | |
| 3-Mar | 203 | 7.1% | |
| 10-Mar | 196 | 7.1% | |
| 17-Mar | 148 | 5.7% | |
| 24-Mar | 144 | 6.0% | |
| 31-Mar | 82 | 3.7% | |
| 7-Apr | 86 | 3.8% | |
| 14-Apr | 73 | 3.2% | |
| 21-Apr | 68 | 3.5% | |
| 28-Apr | 44 | 2.5% | |
| 5-May | 42 | 2.4% | |
| 12-May | 23 | 1.6% | |
| 19-May | 29 | 2.0% | |
| 26-May | 15 | 1.1% | |
| 2-Jun | 7 | 0.6% | |
| 9-Jun | 6 | 0.5% | |
| 16-Jun | 12 | 1.0% | |
| 23-Jun | 11 | 0.9% | |
| 30-Jun | 5 | 0.5% | |
| 7-Jul | 3 | 0.3% | |
| 14-Jul | 3 | 0.3% | |
| 21-Jul | 5 | 0.5% | |
| 28-Jul | 3 | 0.3% | |
| 4-Aug | 5 | 0.5% | |
| 11-Aug | 4 | 0.4% | |
| 18-Aug | 2 | 0.2% | |
| 25-Aug | 5 | 0.5% | |
| 1-Sep | 4 | 0.4% | |
| 8-Sep | 2 | 0.2% | |
| 15-Sep | 2 | 0.2% | |
| 22-Sep | 3 | 0.2% | |
| 29-Sep | 9 | 0.6% | |
| 6-Oct | 8 | 0.4% | |
| 13-Oct | 7 | 0.4% | |
| 20-Oct | 7 | 0.3% | |
| 27-Oct | 10 | 0.5% | |
| 3-Nov | 20 | 0.9% | |
| 10-Nov | 16 | 0.7% | |
| 17-Nov | 26 | 1.1% | |
| 24-Nov | 38 | 1.4% | |
| 1-Dec | 62 | 2.0% | |
| 8-Dec | 74 | 2.2% | |
| 15-Dec | 116 | 3.3% | |
| 22-Dec | 141 | 3.8% | |
| 29-Dec | 166 | 5.2% | |
| 2019 | 5-Jan | 180 | 5.0% |
| 12-Jan | 198 | 6.0% | |
| 19-Jan | 200 | 7.1% | |
| 26-Jan | 195 | 7.2% | |
| 2-Feb | 207 | 8.2% | |
| 9-Feb | 202 | 8.6% | |
| 16-Feb | 171 | 7.7% | |
| 23-Feb | 176 | 7.6% | |
| 2-Mar | 190 | 8.0% | |
| 9-Mar | 190 | 8.1% | |
| 16-Mar | 153 | 6.8% | |
| 23-Mar | 162 | 6.7% | |
| 30-Mar | 135 | 5.8% | |
| 6-Apr | 94 | 4.0% | |
| 13-Apr | 126 | 5.1% | |
| 20-Apr | 99 | 4.7% | |
| 27-Apr | 73 | 3.5% | |
| 4-May | 62 | 3.2% | |
| 11-May | 62 | 3.1% | |
| 18-May | 56 | 2.8% | |
| 25-May | 23 | 1.4% | |
| 1-Jun | 9 | 0.6% | |
| 8-Jun | 20 | 1.3% | |
| 15-Jun | 19 | 1.3% | |
| 22-Jun | 21 | 1.4% | |
| 29-Jun | 8 | 0.6% | |
| 6-Jul | 11 | 0.9% | |
| 13-Jul | 5 | 0.4% | |
| 20-Jul | 13 | 1.0% | |
| 27-Jul | 3 | 0.3% | |
| 3-Aug | 3 | 0.3% | |
| 10-Aug | 1 | 0.1% | |
| 17-Aug | 3 | 0.2% | |
| 24-Aug | 5 | 0.4% | |
| 31-Aug | 5 | 0.5% | |
| 7-Sep | 3 | 0.2% | |
| 14-Sep | 3 | 0.2% | |
| 21-Sep | 1 | 0.1% | |
| 28-Sep | 3 | 0.2% | |
| 5-Oct | 4 | 0.2% | |
| 12-Oct | 4 | 0.2% | |
| 19-Oct | 6 | 0.3% | |
| 26-Oct | 8 | 0.4% | |
| 2-Nov | 11 | 0.6% | |
| 9-Nov | 16 | 0.6% | |
| 16-Nov | 18 | 0.7% | |
| 23-Nov | 17 | 0.6% | |
| 30-Nov | 22 | 0.8% | |
| 7-Dec | 49 | 1.6% | |
| 14-Dec | 55 | 1.7% | |
| 21-Dec | 88 | 2.4% | |
| 28-Dec | 107 | 3.0% | |
| 2020 | 4-Jan | 128 | 2.7% |
| 11-Jan | 116 | 2.4% | |
| 18-Jan | 135 | 3.3% | |
| 25-Jan | 121 | 2.7% | |
| 1-Feb | 156 | 3.4% | |
| 8-Feb | 128 | 3.0% | |
| 15-Feb | 122 | 3.2% | |
| 22-Feb | 147 | 4.1% | |
| 29-Feb | 137 | 3.3% | |
| 7-Mar | 198 | 3.9% | |
| 14-Mar | 308 | 5.4% | |
| 21-Mar | 247 | 4.7% | |
| 28-Mar | 195 | 3.0% | |
| 4-Apr | 123 | 2.2% | |
| 11-Apr | 111 | 1.8% | |
| 18-Apr | 79 | 1.0% | |
| 25-Apr | 43 | 0.5% | |
| 2-May | 38 | 0.4% | |
| 9-May | 20 | 0.3% | |
| 16-May | 12 | 0.2% | |
| 23-May | 7 | 0.1% | |
| 30-May | 11 | 0.2% |
Figure 2: Ten-year average weekly detections and average percent of coronavirus tests positive for endemic coronaviruses in CanadaFigure 2 footnote a
Text description: Figure 2
| Week | 10 year mean % positive | 10 year mean detections | 95% confidence interval of mean detections (error bars) | Upper 95th percentile (percent positive) | Lower 95th percentile (percent positive) |
|---|---|---|---|---|---|
| 35 | 0.41% | 3.4 | 1.548247 | 1.00% | -0.18% |
| 36 | 0.28% | 2.3 | 0.878711 | 0.97% | -0.40% |
| 37 | 0.28% | 2.7 | 1.271713 | 0.73% | -0.18% |
| 38 | 0.52% | 5.8 | 3.798489 | 1.80% | -0.76% |
| 39 | 0.44% | 5.4 | 2.132671 | 0.98% | -0.10% |
| 40 | 0.52% | 6.9 | 2.873203 | 1.00% | 0.03% |
| 41 | 0.38% | 5.1 | 2.045324 | 0.88% | -0.11% |
| 42 | 0.56% | 7.7 | 3.291923 | 1.44% | -0.32% |
| 43 | 0.77% | 10.6 | 6.430355 | 2.22% | -0.69% |
| 44 | 1.05% | 14.9 | 8.021259 | 3.54% | -1.43% |
| 45 | 1.06% | 17.5 | 11.04297 | 2.91% | -0.78% |
| 46 | 1.65% | 27.8 | 14.62716 | 4.34% | -1.05% |
| 47 | 1.57% | 27.8 | 14.87973 | 4.56% | -1.42% |
| 48 | 2.25% | 42.7 | 22.05295 | 5.34% | -0.85% |
| 49 | 2.72% | 56.0 | 29.26457 | 6.01% | -0.56% |
| 50 | 3.20% | 73.8 | 36.9481 | 6.31% | 0.09% |
| 51 | 3.74% | 96.3 | 47.21931 | 6.79% | 0.69% |
| 52 | 4.30% | 113.8 | 49.34113 | 7.49% | 1.12% |
| 1 | 4.88% | 160.1 | 68.08862 | 8.24% | 1.53% |
| 2 | 5.25% | 180.4 | 75.49765 | 8.89% | 1.60% |
| 3 | 5.91% | 177.4 | 67.59302 | 8.91% | 2.92% |
| 4 | 5.92% | 171.1 | 54.45276 | 9.43% | 2.41% |
| 5 | 6.09% | 172.6 | 42.67162 | 9.85% | 2.34% |
| 6 | 6.04% | 165.1 | 55.94278 | 10.08% | 1.99% |
| 7 | 5.86% | 153.7 | 46.00787 | 9.42% | 2.30% |
| 8 | 5.73% | 145.5 | 35.67592 | 8.71% | 2.76% |
| 9 | 5.88% | 154.2 | 44.27246 | 9.69% | 2.08% |
| 10 | 5.78% | 152.3 | 40.74939 | 9.69% | 1.88% |
| 11 | 5.49% | 123.6 | 40.57975 | 8.35% | 2.63% |
| 12 | 5.36% | 114.3 | 36.44182 | 7.81% | 2.91% |
| 13 | 4.88% | 95.8 | 38.88561 | 8.04% | 1.71% |
| 14 | 4.56% | 90.0 | 37.86259 | 7.68% | 1.43% |
| 15 | 4.10% | 76.8 | 23.80772 | 6.47% | 1.73% |
| 16 | 3.79% | 64.7 | 21.53429 | 6.13% | 1.44% |
| 17 | 3.10% | 51.2 | 14.8015 | 4.67% | 1.52% |
| 18 | 2.62% | 41.1 | 14.43051 | 4.48% | 0.75% |
| 19 | 2.19% | 31.0 | 12.03483 | 3.86% | 0.52% |
| 20 | 2.38% | 33.1 | 10.04334 | 3.97% | 0.79% |
| 21 | 1.67% | 20.0 | 8.165791 | 3.06% | 0.28% |
| 22 | 1.12% | 13.1 | 6.463476 | 2.35% | -0.11% |
| 23 | 1.12% | 12.7 | 3.919928 | 2.02% | 0.21% |
| 24 | 1.01% | 10.7 | 3.56511 | 1.39% | 0.63% |
| 25 | 0.96% | 9.2 | 4.094816 | 1.86% | 0.06% |
| 26 | 0.79% | 7.1 | 2.692735 | 1.73% | -0.15% |
| 27 | 0.68% | 5.8 | 2.237413 | 1.33% | 0.04% |
| 28 | 0.46% | 4.0 | 2.220865 | 1.13% | -0.21% |
| 29 | 0.74% | 6.4 | 2.987728 | 1.74% | -0.27% |
| 30 | 0.50% | 4.0 | 2.133739 | 1.18% | -0.18% |
| 31 | 0.42% | 3.4 | 1.415064 | 1.09% | -0.26% |
| 32 | 0.45% | 3.4 | 2.223237 | 1.14% | -0.25% |
| 33 | 0.34% | 2.9 | 1.358058 | 0.82% | -0.14% |
| 34 | 0.43% | 3.4 | 1.573741 | 1.15% | -0.29% |
The laboratory detection of endemic coronaviruses demonstrated several differences from the seasonal epidemics of other viruses.
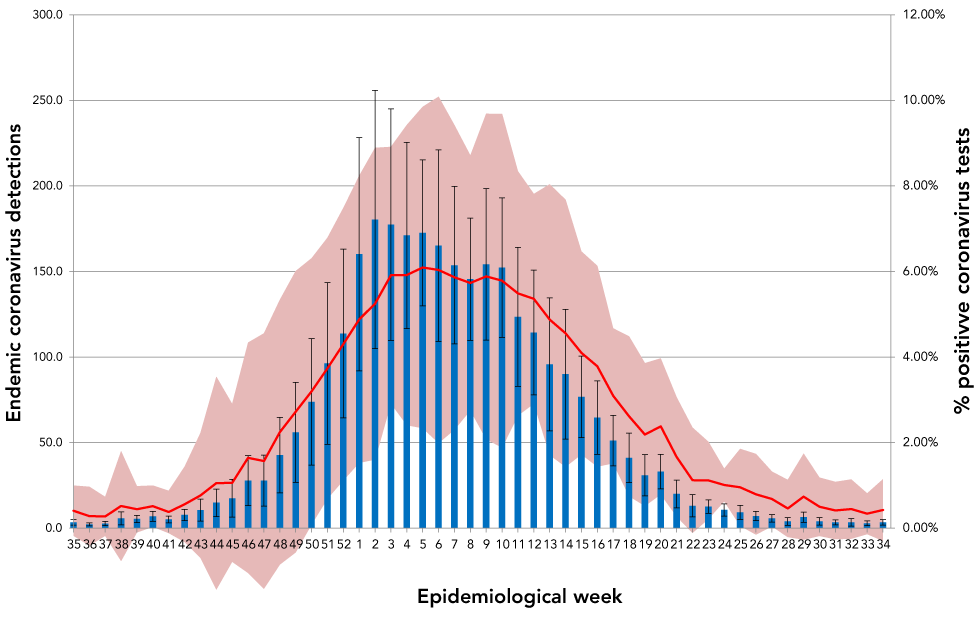
Influenza A and B
In Canada, the ten-year average influenza A season started around week 44 (early November). While this is roughly the same time as the coronavirus season, the influenza A season peaked considerably earlier than the coronavirus season.
The influenza B season typically occurred later than Influenza A, with the 10-year average starting around week 48 (late November), peaking around week 15 (early April) and ending around week 25 (mid-June). While the peak was somewhat later than coronaviruses, substantial overlap exists between the seasonal endemic coronavirus season and the influenza B season (Figure 3).
Figure 3: The 10-year average activity of influenza A, influenza B and endemic coronaviruses by epidemiological week
Text description: Figure 3
| Epidemiological week | Influenza A % peak activity | Influenza B % peak activity | Endemic coronavirus % peak activity |
|---|---|---|---|
| 35 | 3% | 1% | 7% |
| 36 | 3% | 2% | 5% |
| 37 | 3% | 1% | 5% |
| 38 | 4% | 1% | 9% |
| 39 | 5% | 2% | 7% |
| 40 | 5% | 1% | 8% |
| 41 | 5% | 1% | 6% |
| 42 | 7% | 2% | 9% |
| 43 | 9% | 3% | 13% |
| 44 | 12% | 3% | 17% |
| 45 | 16% | 5% | 17% |
| 46 | 21% | 7% | 27% |
| 47 | 27% | 9% | 26% |
| 48 | 37% | 13% | 37% |
| 49 | 48% | 17% | 45% |
| 50 | 63% | 26% | 52% |
| 51 | 80% | 33% | 61% |
| 52 | 100% | 37% | 71% |
| 1 | 89% | 39% | 80% |
| 2 | 91% | 40% | 86% |
| 3 | 84% | 47% | 97% |
| 4 | 76% | 56% | 97% |
| 5 | 75% | 67% | 100% |
| 6 | 71% | 77% | 99% |
| 7 | 68% | 79% | 96% |
| 8 | 66% | 80% | 94% |
| 9 | 67% | 80% | 97% |
| 10 | 62% | 82% | 95% |
| 11 | 54% | 92% | 90% |
| 12 | 48% | 97% | 88% |
| 13 | 43% | 98% | 80% |
| 14 | 36% | 94% | 75% |
| 15 | 31% | 100% | 67% |
| 16 | 24% | 99% | 62% |
| 17 | 20% | 91% | 51% |
| 18 | 15% | 80% | 43% |
| 19 | 12% | 71% | 36% |
| 20 | 10% | 57% | 39% |
| 21 | 7% | 46% | 27% |
| 22 | 6% | 31% | 18% |
| 23 | 4% | 19% | 18% |
| 24 | 4% | 14% | 17% |
| 25 | 4% | 10% | 16% |
| 26 | 4% | 7% | 13% |
| 27 | 4% | 5% | 11% |
| 28 | 3% | 3% | 8% |
| 29 | 3% | 2% | 12% |
| 30 | 3% | 1% | 8% |
| 31 | 3% | 2% | 7% |
| 32 | 2% | 1% | 7% |
| 33 | 3% | 2% | 6% |
| 34 | 3% | 1% | 7% |
Respiratory syncytial virus and human metapneumovirus
There was almost perfect overlap of the Canadian RSV and endemic coronavirus seasons (Figure 4). Both seasonal coronavirus and RSV seasons started around week 42 human metapneumovirus also had seasonalities that overlapped somewhat with coronaviruses and RSV, peaking eight weeks later than RSV and nine weeks later than endemic coronaviruses.
Figure 4: The 10-year average activityFigure 4 footnote a of respiratory syncytial virus, human metapneumovirus and endemic coronaviruses by epidemiological week
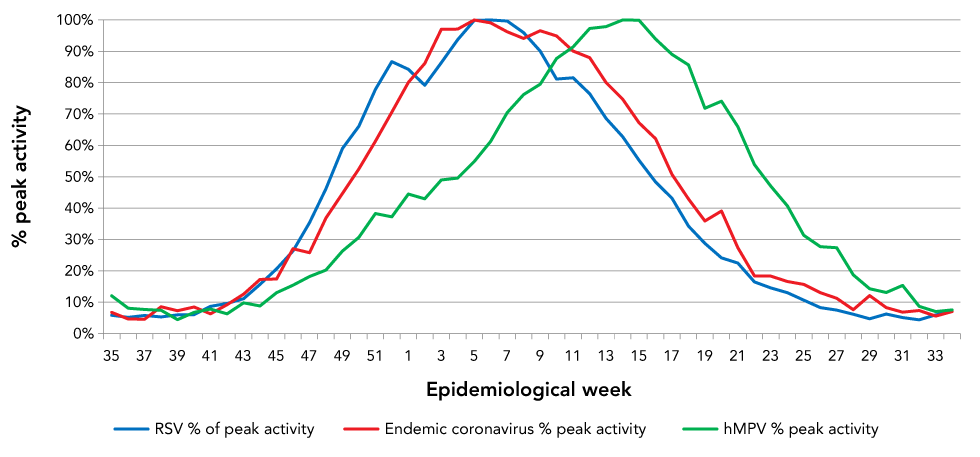
Text description: Figure 4
| Epidemiological week | RSV % of peak activity | hMPV % peak activity | Endemic coronavirus % peak activity |
|---|---|---|---|
| 35 | 6% | 12% | 7% |
| 36 | 5% | 8% | 5% |
| 37 | 6% | 8% | 5% |
| 38 | 5% | 7% | 9% |
| 39 | 6% | 4% | 7% |
| 40 | 6% | 7% | 8% |
| 41 | 9% | 8% | 6% |
| 42 | 10% | 6% | 9% |
| 43 | 11% | 10% | 13% |
| 44 | 16% | 9% | 17% |
| 45 | 21% | 13% | 17% |
| 46 | 26% | 15% | 27% |
| 47 | 35% | 18% | 26% |
| 48 | 46% | 20% | 37% |
| 49 | 59% | 26% | 45% |
| 50 | 66% | 31% | 52% |
| 51 | 78% | 38% | 61% |
| 52 | 87% | 37% | 71% |
| 1 | 84% | 44% | 80% |
| 2 | 79% | 43% | 86% |
| 3 | 86% | 49% | 97% |
| 4 | 94% | 50% | 97% |
| 5 | 100% | 55% | 100% |
| 6 | 100% | 61% | 99% |
| 7 | 100% | 70% | 96% |
| 8 | 96% | 76% | 94% |
| 9 | 90% | 80% | 97% |
| 10 | 81% | 88% | 95% |
| 11 | 82% | 91% | 90% |
| 12 | 76% | 97% | 88% |
| 13 | 69% | 98% | 80% |
| 14 | 63% | 100% | 75% |
| 15 | 55% | 100% | 67% |
| 16 | 48% | 94% | 62% |
| 17 | 43% | 89% | 51% |
| 18 | 34% | 86% | 43% |
| 19 | 29% | 72% | 36% |
| 20 | 24% | 74% | 39% |
| 21 | 22% | 66% | 27% |
| 22 | 16% | 54% | 18% |
| 23 | 15% | 47% | 18% |
| 24 | 13% | 41% | 17% |
| 25 | 11% | 31% | 16% |
| 26 | 8% | 28% | 13% |
| 27 | 7% | 27% | 11% |
| 28 | 6% | 19% | 8% |
| 29 | 5% | 14% | 12% |
| 30 | 6% | 13% | 8% |
| 31 | 5% | 15% | 7% |
| 32 | 4% | 9% | 7% |
| 33 | 6% | 7% | 6% |
| 34 | 7% | 8% | 7% |
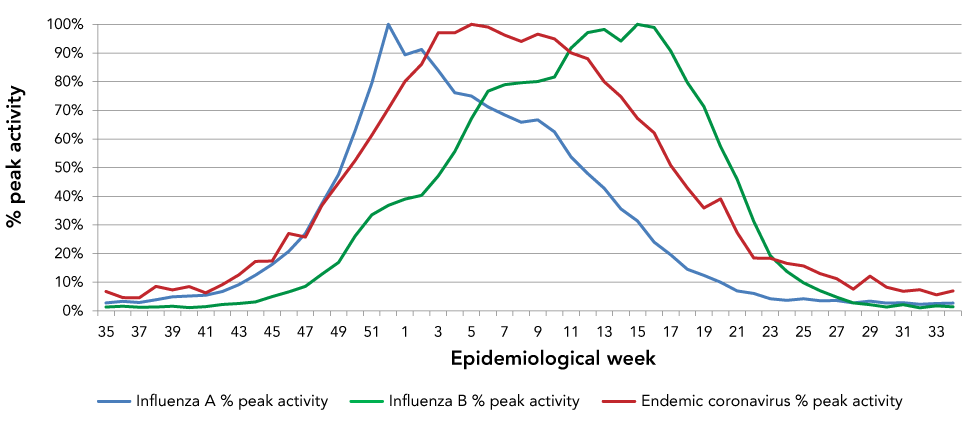
Rhinovirus/enterovirus and parainfluenza viruses
Contrasting sharply with the seasonal pattern of coronaviruses, rhinovirus/enterovirus and parainfluenza viruses had a pronounced bimodal seasonal pattern with the nadir occurring at the peak of the coronavirus season (Figure 5). Should SARS-CoV-2 adopt a similar seasonal pattern to other endemic coronaviruses, one would expect minimal activity of rhinovirus and parainfluenza virus during peak coronavirus activity.
Figure 5: The 10-year average activity of parainfluenza virus, rhinovirus/enterovirus and endemic coronaviruses by epidemiological week
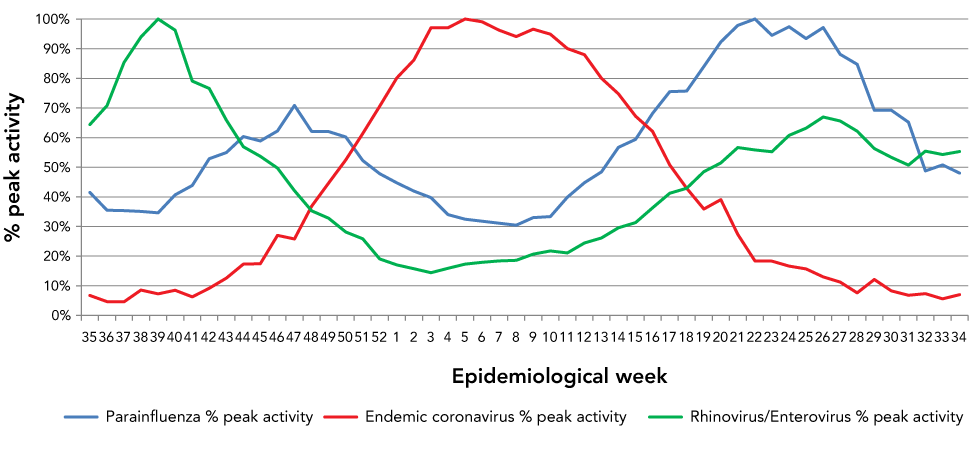
Text description: Figure 5
| Epidemiological week | Parainfluenza % peak activity | Rhinovirus/Enterovirus % peak activity | Endemic coronavirus % peak activity |
|---|---|---|---|
| 35 | 41% | 64% | 7% |
| 36 | 35% | 71% | 5% |
| 37 | 35% | 85% | 5% |
| 38 | 35% | 94% | 9% |
| 39 | 35% | 100% | 7% |
| 40 | 41% | 96% | 8% |
| 41 | 44% | 79% | 6% |
| 42 | 53% | 77% | 9% |
| 43 | 55% | 66% | 13% |
| 44 | 60% | 57% | 17% |
| 45 | 59% | 54% | 17% |
| 46 | 62% | 50% | 27% |
| 47 | 71% | 42% | 26% |
| 48 | 62% | 35% | 37% |
| 49 | 62% | 33% | 45% |
| 50 | 60% | 28% | 52% |
| 51 | 52% | 26% | 61% |
| 52 | 48% | 19% | 71% |
| 1 | 45% | 17% | 80% |
| 2 | 42% | 16% | 86% |
| 3 | 40% | 14% | 97% |
| 4 | 34% | 16% | 97% |
| 5 | 32% | 17% | 100% |
| 6 | 32% | 18% | 99% |
| 7 | 31% | 18% | 96% |
| 8 | 30% | 19% | 94% |
| 9 | 33% | 21% | 97% |
| 10 | 33% | 22% | 95% |
| 11 | 40% | 21% | 90% |
| 12 | 45% | 24% | 88% |
| 13 | 48% | 26% | 80% |
| 14 | 57% | 30% | 75% |
| 15 | 59% | 31% | 67% |
| 16 | 68% | 36% | 62% |
| 17 | 75% | 41% | 51% |
| 18 | 76% | 43% | 43% |
| 19 | 84% | 48% | 36% |
| 20 | 92% | 51% | 39% |
| 21 | 98% | 57% | 27% |
| 22 | 100% | 56% | 18% |
| 23 | 94% | 55% | 18% |
| 24 | 97% | 61% | 17% |
| 25 | 93% | 63% | 16% |
| 26 | 97% | 67% | 13% |
| 27 | 88% | 66% | 11% |
| 28 | 85% | 62% | 8% |
| 29 | 69% | 56% | 12% |
| 30 | 69% | 53% | 8% |
| 31 | 65% | 51% | 7% |
| 32 | 49% | 55% | 7% |
| 33 | 51% | 54% | 6% |
| 34 | 48% | 55% | 7% |
Prevalence of viral illness
Figure 6 demonstrates the proprotion of tests positive for endemic coronavirus, RSV, influenza A or influenza B in reporting Canadian laboratories by epidemiological week. Co-circulation of multiple viruses between late-December and early March produced an extented period where more than 40% of samples were positive for at least one respiratory virus, suggesting a substantial burden of respiratory viral disease during this period.
Figure 6: The 10-year averageof the proprotion of tests positive for endemic coronavirus, respiratory syncytial virus, influenza A or influenza B in reporting Canadian laboratories by epidemiological week
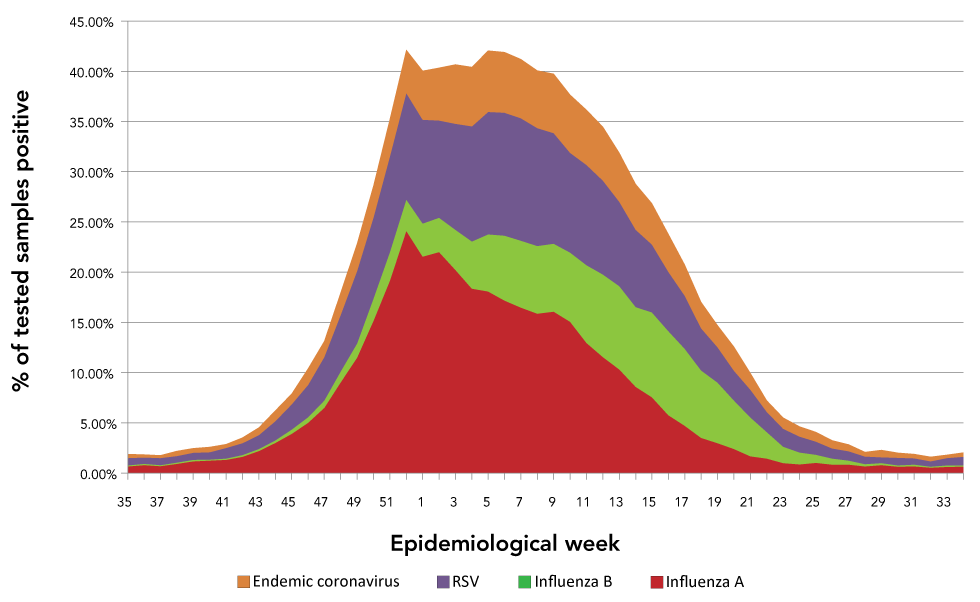
Text description: Figure 6
| Week | Influenza A | Influenza B | RSV | Endemic coronavirus | Percent of samples positive for influenza, RSV or coronavirus |
|---|---|---|---|---|---|
| 35 | 0.67% | 0.11% | 0.71% | 0.41% | 1.91% |
| 36 | 0.80% | 0.13% | 0.63% | 0.28% | 1.85% |
| 37 | 0.70% | 0.11% | 0.70% | 0.28% | 1.79% |
| 38 | 0.94% | 0.11% | 0.64% | 0.52% | 2.21% |
| 39 | 1.18% | 0.14% | 0.72% | 0.44% | 2.48% |
| 40 | 1.25% | 0.09% | 0.74% | 0.52% | 2.60% |
| 41 | 1.32% | 0.13% | 1.06% | 0.38% | 2.89% |
| 42 | 1.62% | 0.19% | 1.17% | 0.56% | 3.54% |
| 43 | 2.20% | 0.22% | 1.36% | 0.77% | 4.54% |
| 44 | 3.00% | 0.26% | 1.91% | 1.05% | 6.23% |
| 45 | 3.91% | 0.42% | 2.52% | 1.06% | 7.92% |
| 46 | 5.01% | 0.56% | 3.22% | 1.65% | 10.43% |
| 47 | 6.51% | 0.72% | 4.32% | 1.57% | 13.13% |
| 48 | 9.03% | 1.08% | 5.64% | 2.25% | 17.99% |
| 49 | 11.49% | 1.43% | 7.21% | 2.72% | 22.85% |
| 50 | 15.17% | 2.20% | 8.08% | 3.20% | 28.65% |
| 51 | 19.18% | 2.83% | 9.52% | 3.74% | 35.26% |
| 52 | 24.11% | 3.11% | 10.60% | 4.30% | 42.12% |
| 1 | 21.56% | 3.29% | 10.30% | 4.88% | 40.04% |
| 2 | 22.01% | 3.40% | 9.68% | 5.25% | 40.34% |
| 3 | 20.23% | 3.97% | 10.56% | 5.91% | 40.68% |
| 4 | 18.36% | 4.69% | 11.46% | 5.92% | 40.43% |
| 5 | 18.09% | 5.67% | 12.21% | 6.09% | 42.05% |
| 6 | 17.18% | 6.47% | 12.22% | 6.04% | 41.91% |
| 7 | 16.49% | 6.66% | 12.18% | 5.86% | 41.19% |
| 8 | 15.88% | 6.72% | 11.73% | 5.73% | 40.06% |
| 9 | 16.08% | 6.76% | 11.01% | 5.88% | 39.73% |
| 10 | 15.06% | 6.89% | 9.92% | 5.78% | 37.65% |
| 11 | 12.96% | 7.74% | 9.97% | 5.49% | 36.16% |
| 12 | 11.56% | 8.20% | 9.35% | 5.36% | 34.47% |
| 13 | 10.32% | 8.29% | 8.39% | 4.88% | 31.88% |
| 14 | 8.58% | 7.95% | 7.68% | 4.56% | 28.76% |
| 15 | 7.57% | 8.44% | 6.75% | 4.10% | 26.85% |
| 16 | 5.78% | 8.35% | 5.91% | 3.79% | 23.83% |
| 17 | 4.72% | 7.66% | 5.28% | 3.10% | 20.76% |
| 18 | 3.51% | 6.72% | 4.18% | 2.62% | 17.03% |
| 19 | 2.99% | 6.02% | 3.52% | 2.19% | 14.71% |
| 20 | 2.41% | 4.84% | 2.95% | 2.38% | 12.57% |
| 21 | 1.68% | 3.88% | 2.74% | 1.67% | 9.97% |
| 22 | 1.46% | 2.63% | 2.01% | 1.12% | 7.23% |
| 23 | 1.01% | 1.62% | 1.78% | 1.12% | 5.53% |
| 24 | 0.88% | 1.16% | 1.60% | 1.01% | 4.66% |
| 25 | 1.01% | 0.82% | 1.30% | 0.96% | 4.10% |
| 26 | 0.86% | 0.59% | 1.01% | 0.79% | 3.25% |
| 27 | 0.86% | 0.40% | 0.91% | 0.68% | 2.86% |
| 28 | 0.67% | 0.23% | 0.76% | 0.46% | 2.12% |
| 29 | 0.81% | 0.18% | 0.58% | 0.74% | 2.31% |
| 30 | 0.66% | 0.11% | 0.76% | 0.50% | 2.03% |
| 31 | 0.68% | 0.18% | 0.62% | 0.42% | 1.90% |
| 32 | 0.56% | 0.09% | 0.53% | 0.45% | 1.63% |
| 33 | 0.62% | 0.15% | 0.73% | 0.34% | 1.84% |
| 34 | 0.65% | 0.12% | 0.86% | 0.43% | 2.05% |
Discussion
Circulating endemic coronaviruses (NL63, 229E, HKU1 and OC43) have established a seasonal pattern of late-winter peak activity in Canada. While the laboratory assays used for these data did not discriminate between coronavirus species, and the seasonality described here represented a composite season for the four endemic coronaviruses, these data clearly demonstrate that the overall pattern of the four endemic coronaviruses together show seasonality of circulation. Our data suggest that substantial overlap between clinically important respiratory viruses would be expected to occur if SARS-CoV-2 established a seasonal pattern similar to the existing endemic coronaviruses. For influenza A, the peak percent-positive occurred in week 52 (end of December), approximately five weeks before coronaviruses. A distinguishing feature of influenza A is the explosive nature of the early part of the epidemic, with an onset-to-peak time of approximately eight weeks. This contrasts with the slow increase in coronavirus detections; taking 14 weeks from onset to peak. This is partly explained by the shorter incubation period of influenza A; however, the percent-positive influenza A detections declined relatively slowly, and the influenza A season was not typically over until week 20 (early May). Thus, considerable overlap between the annual influenza A epidemic and coronavirus seasonal epidemics would be expected due to this trailing decline in influenza A cases. Likewise, while the peak of influenza B activity occurred later than seasonal coronavirus activity, substantial overlap is expected and the known burden of disease of influenza B in the elderly is likely to be compounded by co-circulation of SARS-CoV-2. While SARS-CoV-2 may be clinically less relevant in the paediatric population, co-circulation of RSV and SARS-CoV-2 could significantly impact paediatric healthcare workers and adults caring for children with COVID-19. The need to isolate hospitalized children with RSV bronchiolitis as presumed cases of COVID-19 pending diagnostic testing could also strain infection control measures.
If, as we hypothesize, SARS-CoV-2 eventually establishes a seasonal pattern similar to currently endemic coronaviruses, then planning for this added burden to the respiratory season is necessary, particularly because the coronavirus season overlaps with the influenza and RSV seasons. The most concerning implication of SARS-CoV-2 establishing seasonality similar to other coronaviruses is the additional burden expected on a healthcare system already strained by common viral respiratory tract infections. This strain may be seen as shortages of regular hospital beds, isolation and critical care beds, staff (in part due to staff absenteeism due to illness), drugs and more. In addition, staffing, laboratory resources and reagent supply chains may be taxed by increased testing, with resulting increased turnaround time or test service disruptions. These stresses may ultimately result in delayed or missed diagnosis of COVID-19 and other respiratory illnesses leading to clinicians being less comfortable making a clinical diagnosis when COVID-19 is in the differential diagnosis. If SARS-CoV-2 adopts a seasonal pattern similar to other coronaviruses, co-circulation of RSV, influenza A, influenza B and SARS-CoV-2 may be considerable between January and March, leading to a significant burden of respiratory disease during this period. Historically, before the emergence of SARS-CoV-2, more than 40% of samples tested in Canadian laboratories were already positive for RSV, influenza A, influenza B or seasonal coronaviruses between early January and early March (Figure 6), revealing a pre-existing and significant burden of disease. The addition of SARS-CoV-2 to the endemic coronavirus seasonal pattern would likely increase the respiratory virus disease burden during this period.
Within a specific healthcare geographical area, a seasonal SARS-CoV-2 may peak at the same time as RSV, resulting in considerable burden of disease in the paediatric care settings. While the majority of cases of both these illnesses are relatively mild in paediatric patients, one could nevertheless anticipate increased strain on paediatric health care facilities resulting from the small proportion of more severe cases and possibility of increased severity as a co-infection, including increased presentations for bronchiolitis and viral pneumoniaFootnote 6Footnote 7.
The potential co-occurrence of influenza A, influenza B and SARS-CoV-2 is potentially devastating to the older population, who often have comorbidities that are disproportionately affected by all of three of these illnesses. The mitigation of the impact of seasonal SARS-CoV-2 epidemiology should therefore be a priority for long-term care and assisted living facilities.
Lastly, the co-circulation of multiple viruses during this period of time would be expected to cause significant absenteeism in young and middle-aged adults, given possible requirements for isolation and testing of patients to exclude SARS-CoV-2 infection from workplaces and schools.
Another potential implication of SARS-CoV-2 adopting a seasonal pattern is the need for an appropriate diagnostic test utilization and streamlining strategy. Use of single target (simplex) nucleic acid tests are inefficient in terms of regent and labour utilization in laboratories. For this reason, multiplexed tests that target co-circulating pathogens should be developed so that clinicians can accurately differentiate symptomatic patients in order to implement appropriate therapy and institute appropriate infection or disease control measures. Given the possibility of co-occurring seasonal epidemics, priority should be given to development of multiplex assays for influenza A, influenza B, RSV and SARS-CoV-2 to simplify testing and to reduce labour and material costs. The benefit of additional multiplexing (rhinovirus, parainfluenza virus) is more questionable given the added cost and the relatively low activity of these viruses during peak influenza, RSV and coronavirus activities. Furthermore, influenza, RSV and SARS-CoV-2 are all priority pathogens that have a greater healthcare impact and benefit from diagnosis and differentiation in the healthcare settings for therapeutic (e.g. oseltamivir for influenza) and infection control purposes (isolation). Parainfluenza, rhinovirus and enterovirus are low priority pathogens due to limited virulence and limited burden to healthcare. Despite the efficiencies associated with multiplexing nucleic acid amplification assays, there is likely still a role for SARS-CoV-2 simplex assay in the evaluation and tracing of asymptomatic individuals and contacts of COVID-19 cases directed by public health authorities, where detection of influenza and RSV are of no benefit.
Limitations
While comprehensive, these data have several limitations. They do not take into account differences in testing algorithms or populations for these respiratory viruses that will vary from province to province, season to season and year to year. The number of tests performed is not uniform across the population of Canada, with some provinces or territories over-represented by a higher rate of testing and others under-represented. Because of these limitations, positive proportion of tests rather than absolute case counts should primarily be used as an indicator of seasonality. However, given the uniformity of the findings and consistency with other published reports, this limitation is unlikely to affect the interpretation of respiratory virus seasonality data. Another limitation is that we cannot with any certainty predict if and when SARS-CoV-2 will establish a seasonal pattern of infection. We hypothesize this will occur due to comparable biology of the viruses, effective person-to-person transmission, significant host susceptibility and global prevalence. These factors may, however, be dramatically altered by human interventions such as public health measures, vaccinations and, eventually, treatment. It is also impossible to determine if and how SARS-CoV-2 virulence will change over time. Currently, unlike influenza, endemic coronaviruses have minimal impact on disease burden in hospitals and healthcare settings due to limited virulence. Our assumptions on additional burden with co-circulation of influenza and RSV assume that SARS-CoV-2 maintains relatively high virulence compared with the currently endemic coronaviruses.
Conclusion
Like SARS-CoV-2, endemic coronaviruses that infect humans have common zoonotic origins and have established seasonal epidemic patterns in human populations that coincide with influenza A, influenza B and RSV. While it remains unclear if SARS-CoV-2 will establish a similar seasonal pattern, the virus is clearly established in the human population and eventual seasonality should be assumed to be a strong possibility given the well-established pattern of seasonality in commonly circulating endemic coronaviruses. Preparation for seasonal outbreaks of SARS-CoV-2 and other respiratory viruses could include appropriate staff and bed management in healthcare facilities and other essential services as well as anticipation of increased absenteeism in all workplaces, particularly in the first three months of the calendar year. Within laboratories, development of combined tests and associated protocols for commonly co-circulating viruses should be prioritized to optimize the efficiency of diagnostic and surveillance testing.
Authors' statement
- PLW — Conceived the study idea, analyzed and interpreted the data and drafted and edited the manuscript
- JB — Provided critical, scientific and editorial review and edits of the manuscript
- RC — Provided critical, scientific and editorial review of the manuscript
- PVC — Provided critical, scientific and editorial review and edits of the manuscript
Competing interests
None declared.
Acknowledgements
We wish to acknowledge the contributions of the Public Health Agency of Canada Surveillance and Epidemiology Division (FluWatch) and their contributing National Laboratory Network for the publically accessible databases and personal assistance that made this work possible.
Funding
No funding received for this work. The databases used in this study are maintained and funded by the Government of Canada.
References
- Footnote 1
-
Li Q, Guan X, Wu P, Wang X, Zhou L, Tong Y, Ren R, Leung KS, Lau EH, Wong JY, Xing X, Xiang N, Wu Y, Li C, Chen Q, Li D, Liu T, Zhao J, Liu M, Tu W, Chen C, Jin L, Yang R, Wang Q, Zhou S, Wang R, Liu H, Luo Y, Liu Y, Shao G, Li H, Tao Z, Yang Y, Deng Z, Liu B, Ma Z, Zhang Y, Shi G, Lam TT, Wu JT, Gao GF, Cowling BJ, Yang B, Leung GM, Feng Z. Early Transmission Dynamics in Wuhan, China, of Novel Coronavirus-Infected Pneumonia. N Engl J Med 2020;382(13):1199-207. https://doi.org/10.1056/NEJMoa2001316
- Footnote 2
-
Ye ZW, Yuan S, Yuen KS, Fung SY, Chan CP, Jin DY. Zoonotic origins of human coronaviruses. Int J Biol Sci 2020;16(10):1686-97. https://doi.org/10.7150/ijbs.45472
- Footnote 3
-
Vijgen L, Keyaerts E, Moës E, Thoelen I, Wollants E, Lemey P, Vandamme AM, Van Ranst M. Complete genomic sequence of human coronavirus OC43: molecular clock analysis suggests a relatively recent zoonotic coronavirus transmission event. J Virol 2005;79(3):1595-604. https://doi.org/10.1128/JVI.79.3.1595-1604.2005
- Footnote 4
-
Lau SK, Lee P, Tsang AK, Yip CC, Tse H, Lee RA, So LY, Lau YL, Chan KH, Woo PC, Yuen KY. Molecular epidemiology of human coronavirus OC43 reveals evolution of different genotypes over time and recent emergence of a novel genotype due to natural recombination. J Virol 2011;85(21):11325-37. https://doi.org/10.1128/JVI.05512-11
- Footnote 5
-
Hendley JO, Fishburne HB, Gwaltney JM Jr. Coronavirus infections in working adults. Eight-year study with 229 E and OC 43. Am Rev Respir Dis 1972;105(5):805-11.
- Footnote 6
-
Su S, Wong G, Shi W, Liu J, Lai AC, Zhou J, Liu W, Bi Y, Gao GF. Epidemiology, Genetic Recombination, and Pathogenesis of Coronaviruses. Trends Microbiol 2016;24(6):490-502. https://doi.org/10.1016/j.tim.2016.03.003
- Footnote 7
-
Ma X, Liu S, Chen L, Zhuang L, Zhang J, Xin Y. The clinical characteristics of pediatric inpatients with SARS-CoV-2 infection: A meta-analysis and systematic review. J Med Virol. Forthcoming 2020. https://doi.org/10.1002/jmv.26208
- Footnote 8
-
Smith DK, Seales S, Budzik C. Respiratory Syncytial Virus Bronchiolitis in Children. Am Fam Physician 2017;95(2):94-9.
