
FluWatch Mid-Season Report 2021–2022

 Download this article as a PDF
 Published by: The Public Health Agency of Canada
Issue: Volume 48-1, January 2022: COVID-19 Mortality and Social Inequalities
Date published: January 2022
ISSN: 1481-8531
Submit a manuscript
About CCDR
Browse
Volume 48-1, January 2022: COVID-19 Mortality and Social Inequalities
Surveillance
National FluWatch mid-season report, 2021–2022: Sporadic influenza activity returns
Christina Bancej1, Abbas Rahal1, Liza Lee1, Steven Buckrell1, Kara Schmidt1, Nathalie Bastien2
Affiliations
1 Centre for Immunization and Respiratory Infectious Diseases, Public Health Agency of Canada, Ottawa, ON
2 National Microbiology Laboratory, Public Health Agency of Canada, Winnipeg, MB
Correspondence
Suggested citation
Bancej C, Rahal A, Lee L, Buckrell S, Schmidt K, Bastien N. National FluWatch mid-season report, 2021–2022: Sporadic influenza activity returns. Can Commun Dis Rep 2022;48(1):39–45. https://doi.org/10.14745/ccdr.v48i01a06
Keywords: influenza, surveillance, Canada, human/epidemiology, human/virology, seasons, influenza A virus, influenza B virus, non-pharmaceutical interventions
Abstract
Surveillance for Canada’s 2021–2022 seasonal influenza epidemic began in epidemiological week 35 (the week starting August 29, 2021) during the ongoing coronavirus disease 2019 (COVID-19) global public health emergency.
In the 2021–2022 surveillance season to date, there has been a return of persistent sporadic influenza activity, and the first influenza-associated hospitalizations since mid-2020 have been reported. However, as of week 52 (week ending 01/01/2022) activity has remained sporadic, and no influenza-confirmed outbreaks or epidemic activity have been detected. There has been a delay or absence in several traditional seasonal influenza milestones, including the declared start of the influenza season, marked by a threshold of 5% positivity, which historically has occurred on average in week 47. The 429 sporadic detections reported in Canada to date have occurred in 31 regions across seven provinces/territories. Nearly half (n=155/335, 46.3%) of reported cases have been in the paediatric (younger than 19 years) population. Three-quarters of the cases were influenza A detections (n=323/429, 75.3%). Of the subtyped influenza A detections, A(H3N2) predominated (n=83/86, 96.5%). Of the 12 viruses characterized by the National Microbiology Laboratory, 11 were seasonal strains. Among the seasonal strains characterized, only one was antigenically similar to the strains recommended for the 2021–2022 Northern Hemisphere vaccine, though all were sensitive to the antivirals, oseltamivir and zanamivir.
Until very recently, seasonal influenza epidemics had not been reported since March 2020. Evidence on the re-emergence of seasonal influenza strains in Canada following the A(H1N1)pdm09 pandemic shows that influenza A(H3N2) and B epidemics ceased through the 2009–2010 season and second wave of A(H1N1)pdm09, but then re-emerged in subsequent seasons to predominate causing epidemics of higher intensity than in the pre-pandemic seasons. When and where seasonal influenza epidemic activity resumes cannot be predicted, but model-based estimates and historical post-pandemic patterns of intensified epidemics warrant continued vigilance through the usual season and for out-of-season re-emergence. In addition, ongoing population preparedness measures, such as annual influenza vaccination to mitigate the intensity and burden of future seasonal influenza epidemic waves, should continue.
Introduction
The global public health response to the coronavirus disease 2019 (COVID-19) pandemic has suppressed seasonal influenza epidemic activity since March 2020 and now continues to contain seasonal influenza epidemics into the period of the usual 2021–2022 Northern Hemisphere seasonFootnote 1Footnote 2Footnote 3Footnote 4Footnote 5Footnote 6.
Canada’s 2019–2020 influenza season was truncated by public health measures aimed at reducing severe acute respiratory syndrome coronavirus 2 (SARS-CoV-2) transmission, and has remained at interseasonal levels sinceFootnote 1Footnote 7Footnote 8Footnote 9. Throughout the usual Northern Hemisphere 2020–2021 season, and despite increased influenza testing, a mere 69 laboratory-confirmed influenza detections, and no laboratory-confirmed influenza outbreaks or hospitalizations, were recorded in Canada by participating provinces and territories (P/T)Footnote 10.
Globally, reports of localized influenza outbreaks have been scarce throughout the pandemic period, with regional outbreaks of A(H3N2) limited to South and Southeast Asia, B/Victoria epidemics in China, and A(H1N1) in West AfricaFootnote 11Footnote 12Footnote 13. However, with increased easing of COVID-19 public health measures, there appears to have been a rise in both verified and unverified reports of localized influenza outbreaks during the 2021–2022 Northern Hemisphere surveillance periodFootnote 14Footnote 15.
Surveillance in Canada for the 2021–2022 influenza season began August 29, 2021 (epidemiological week 35-2021)Footnote 6. This report describes FluWatch surveillance for the re-emergence of sporadic, localized and epidemic seasonal activity in Canada, in the context of easing global and domestic public health measures during the first 18 weeks of the 2021–2022 national influenza season (August 29, 2021 to January 1, 2022 [epidemiological weeks 35 to 52]).
Methods
Design
The FluWatch program is a national composite surveillance system consisting of virological surveillance, influenza and influenza-like illnesses (ILI) activity level surveillance, syndromic surveillance, outbreak surveillance, severe outcome surveillance and vaccine monitoring in Canada. Annually, ongoing influenza surveillance occurs from epidemiological week 35 to 34 of the following year. With the exception of vaccine coverage and effectiveness, which are assessed at mid-season and season end, the FluWatch network of labs, hospitals, doctor's offices, P/T ministries of health and individual Canadians reports data into FluWatch weekly for cases and events occurring during the preceding epidemiological week.
Definitions and data sources
Aggregate laboratory detections are reported to FluWatch by P/T public health laboratories and hospitals that comprise the Respiratory Virus Detections Surveillance System. Number of tests, number of positive tests and the percentage of tests positive for influenza and other respiratory viruses are calculated. Depending on the province, reverse transcription polymerase chain reaction (RT-PCR) tests were conducted on patient specimens from outpatient ILI cases (most reporting P/Ts restricted outpatient testing to groups at increased risk of influenza complications), emergency department acute respiratory infection cases and/or hospitalized severe acute respiratory illness cases, as well as from outbreaks.
Case-level data on laboratory-confirmed influenza detections were supplied on a sub-set of influenza positive cases from aggregate laboratory detections.
For historical time-series of influenza seasons from 2007–2008 onwards, the dominant influenza A strain was assigned as the influenza A subtype(s) comprising 40% or more of the subtyped influenza A. Prior to 2009–2010 sub-typing data were available only for the sample of surveillance specimens characterized antigenically or genetically by the National Microbiology Laboratory (NML).
Influenza/ILI activity levels were reported to FluWatch based on assessments by P/T epidemiologists. Activity levels are classified as follows: 1) no activity (no laboratory-confirmed influenza detections in the reporting week; however, sporadically occurring ILI may be reported); 2) sporadic (sporadically occurring ILI and laboratory-confirmed influenza detection(s) with no outbreaks detected within the influenza surveillance region); 3) localized (increased ILI and laboratory-confirmed influenza detection(s) and outbreaks in schools, hospitals, residential institutions and/or other types of facilities occurring in less than 50% of the influenza surveillance region); and 4) widespread (evidence of increased ILI and laboratory-confirmed influenza detection(s) and outbreaks in schools, hospitals, residential institutions and/or other types of facilities occurring in greater than or equal to 50% of the influenza surveillance region).
Laboratory-confirmed influenza outbreaks were reported to FluWatch by P/T. All P/Ts reported laboratory-confirmed influenza outbreaks that occurred in hospitals and long-term care facilities. Laboratory-confirmed influenza outbreaks in other settings, including remote/isolated communities, workplaces, schools/universities or correctional facilities, were reported by some P/Ts. An outbreak was considered influenza-confirmed if two or more cases of ILI are reported in the setting during a seven-day period with at least one case laboratory-confirmed as influenza.
For severe outcomes surveillance, P/T Ministries of Health from Alberta (AB), Saskatchewan (SK), Manitoba (MB), Prince Edward Island (PE), Newfoundland and Labrador (NL), Nova Scotia (NS), New Brunswick (NB), Yukon Territories (YT) and Northwest Territories (NT) reported hospitalizations, intensive care unit admissions and deaths associated with laboratory-confirmed influenza to FluWatch. Two sentinel networks, the Canadian Immunization Monitoring Program ACTive (paediatric) and the Canadian Immunization Research Network – Serious Outcomes Surveillance Network (adult), reported influenza-associated laboratory-confirmed paediatric and adult hospitalizations, intensive care unit admissions and deaths, as well as additional case-level enhanced surveillance data, from sentinel sites in various P/Ts to FluWatch.
For virus characterization, NML received influenza isolates from P/Ts, sampled at various points in the season, for strain characterization, antiviral resistance testing. The NML also conducted partial genome sequencing of the hemagglutinin gene of some of the isolates.
Statistical methods
Weekly data were input via a portal on the Canadian Network for Public Health Intelligence or directly integrated in SAS V9.4. Data cleaning, aggregation and estimation of rates and proportions were conducted in SAS V9.4. Data visualization for spatial/geographic analysis was conducted using ArcGIS and descriptive statistics and temporal trends were estimated in SAS V9.4 and visualized in Excel.
Results
From August 29, 2021 to January 1, 2022 (weeks 35 to 52), there were persistent and increasing reports of sporadic influenza activity. This sporadic activity occurred in 31 regions across seven P/Ts (British Columbia [BC], AB, MB, Ontario [ON], Québec [QC], NB, NS) (Figure 1).
Figure 1: Number of regions reporting sporadic, localized or widespread influenza activity, by epidemiological week, Canada, weeks 35-2021 to 52-2021Table 1 footnote a
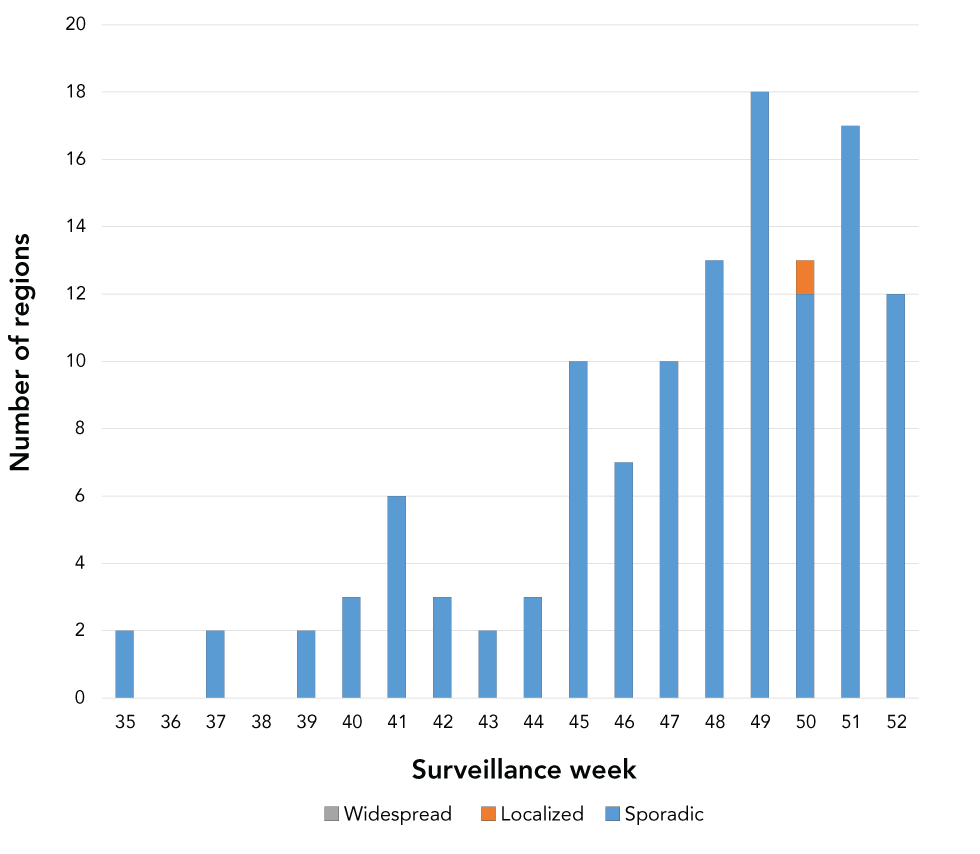
Text description: Figure 1
| Week | Sporadic | Localized | Widespread |
|---|---|---|---|
| 35 | 2 | 0 | 0 |
| 36 | 0 | 0 | 0 |
| 37 | 2 | 0 | 0 |
| 38 | 0 | 0 | 0 |
| 39 | 2 | 0 | 0 |
| 40 | 3 | 0 | 0 |
| 41 | 6 | 0 | 0 |
| 42 | 3 | 0 | 0 |
| 43 | 2 | 0 | 0 |
| 44 | 3 | 0 | 0 |
| 45 | 10 | 0 | 0 |
| 46 | 7 | 0 | 0 |
| 47 | 10 | 0 | 0 |
| 48 | 13 | 0 | 0 |
| 49 | 18 | 0 | 0 |
| 50 | 12 | 1 | 0 |
| 51 | 17 | 0 | 0 |
| 52 | 12 | 0 | 0 |
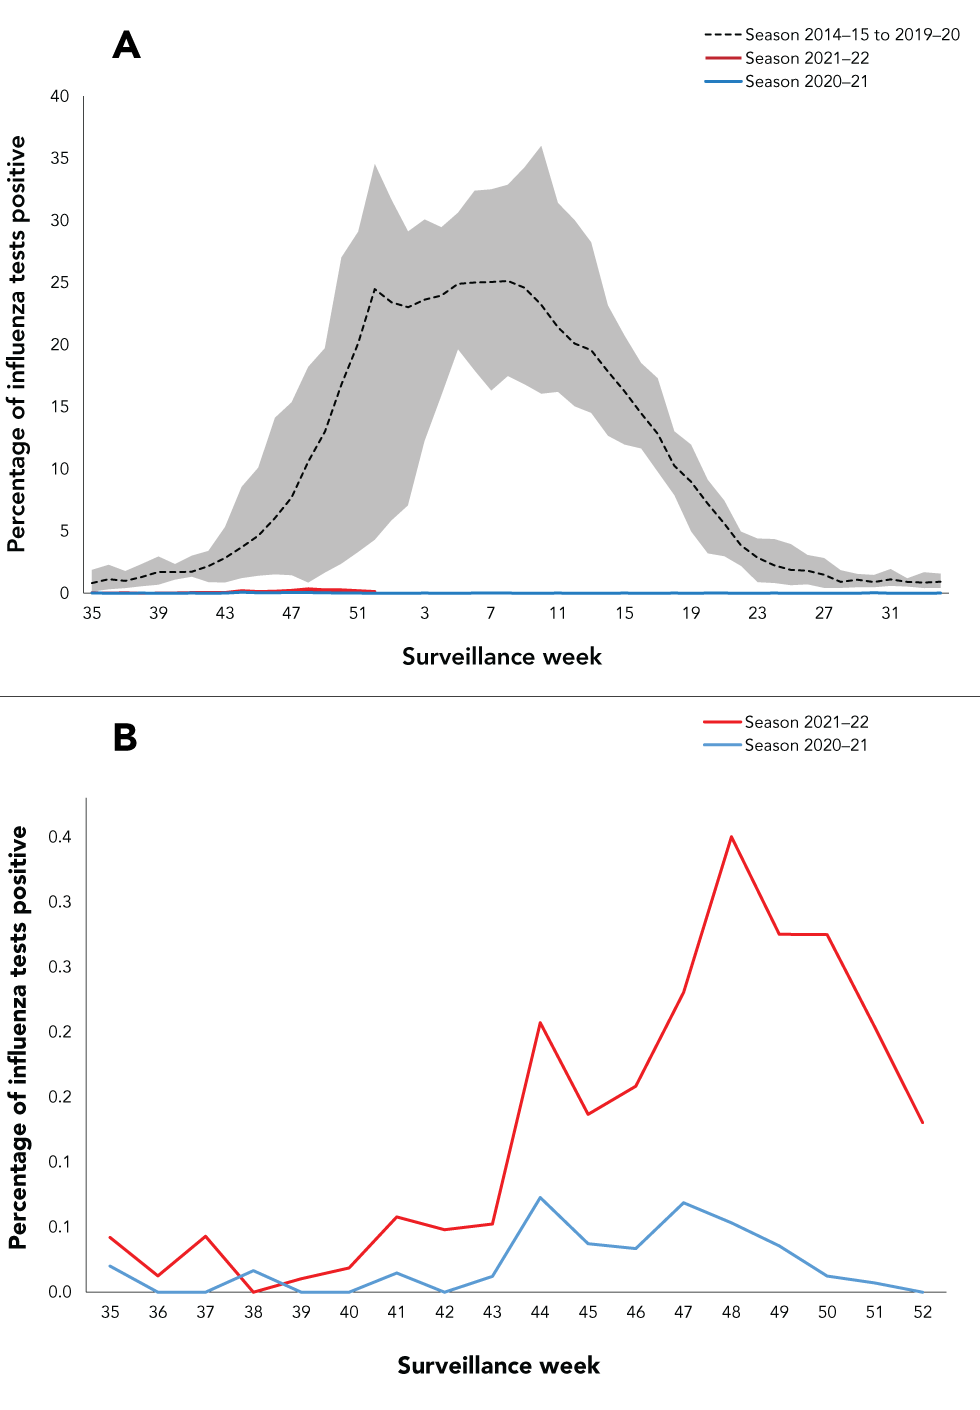
The first influenza cases for the 2021–2022 season were detected at the start of the surveillance period in week 35 and sporadic influenza detections have persisted and slowly increased in number through to week 49. However, the percent positivity had not reached the threshold of 5% necessary to declare the start of the seasonal influenza epidemic, remaining below 0.5% this season to date (Figure 2). A sharp drop in influenza cases began and persisted through weeks 50 to 52, concurrent with the rise of the SARS-CoV-2 Omicron variant and re-institution of intensified public health measures.
Figure 2: Percentage of influenza tests positive, by report week, Canada, 2021–2022 influenza season to date (weeks 35 to 52) compared with historical average and minimum-maximum (seasons 2014–2015 to 2019–2020)
Text description: Figure 2
| Province | A(H1)pdm09 | A(H3) | A(Unsubtyped) | Influenza B | Total |
|---|---|---|---|---|---|
| Alberta | 0 | 7 | 25 | 2 | 34 |
| British Columbia | 0 | 34 | 113 | 79 | 226 |
| Manitoba | 1 | 8 | 3 | 0 | 12 |
| New Brunswick | 0 | 0 | 6 | 0 | 6 |
| Newfoundland and Labrador | 0 | 0 | 0 | 0 | 0 |
| Nova Scotia | 0 | 1 | 10 | 4 | 15 |
| Northwest Territories | 0 | 0 | 0 | 0 | 0 |
| Nunavut | 0 | 0 | 0 | 0 | 0 |
| Ontario | 2 | 30 | 28 | 0 | 60 |
| Prince Edward Island | 0 | 0 | 0 | 0 | 0 |
| Québec | 0 | 1 | 46 | 14 | 61 |
| Saskatchewan | 0 | 1 | 3 | 0 | 4 |
| Yukon Territory | 0 | 1 | 3 | 7 | 11 |
Data are from week 35-2021 to week 52-2021.
A majority of the 429 sporadic influenza detections to date have been reported by BC, followed by QC and ON. Two provinces (NL PE) and two territories (NT, Nunavut) have yet to report any influenza detections this season and one province (SK) detected only travel-related cases. Influenza A comprised three-quarters of detections, with influenza A detected in higher numbers in all P/Ts (with A(H3N2) the predominant subtype detected) (Figure 3).
Figure 3: Spatial distribution of (sporadic) influenza detections (n=429) by influenza type/subtype, Canada, weeks 35-2021 to 52-2021
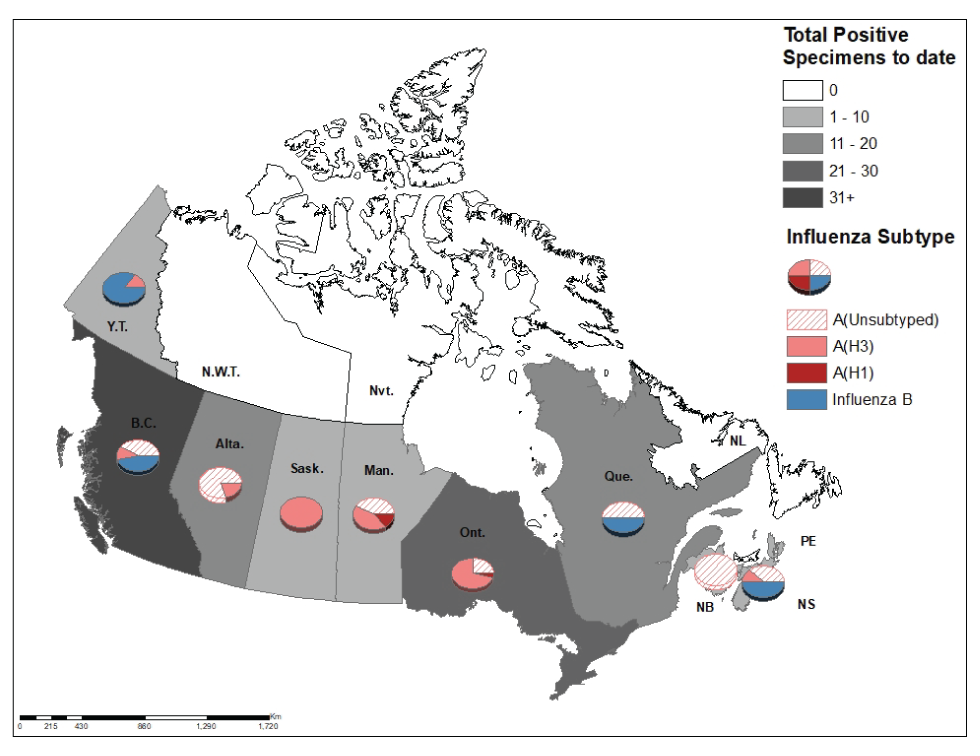
Text description: Figure 3
In Figure 3A and 3B the x-axis shows epidemiological weeks 35 to 34. The y-axis shows the percentage of tests positive for influenza (Figure 3A: scale from 0% to 40%, Figure 3B: 0.0% to 0.4%). The dotted line represents the average; the shaded area represents the minimum and the maximum for the seasons 2014–2015 to 2019–2020; and the dashed blue line represents the percentage of tests positive for influenza for the season 2020–2021. The red line represents the percentage of tests positive for influenza for the current season 2021–2022 (weeks 35 to 49). Historically, the average percent positivity ranged from 0.11% to 35.99% in comparison to 2021–2022 where the percent positivity ranged from 0.00% to 0.34%.
In the 2021–2022 season to date, influenza remained at interseasonal levels in Canada (Figure 2A and 2B); however, activity is currently increasing, with n=96/429 (22.4%) of the detections being recorded in the two most recent epidemiological week(s). The first influenza hospitalizations and intensive care unit admissions reported since mid-2020 have occurred, with the first reports beginning in week 43; however, activity remains sporadic and no influenza-associated outbreaks or epidemic activity have been detected.
Reported cases have been predominately (n=155/335, 46.3%) in the paediatric (younger than 19 years) population.
The majority of detections thus far have been influenza A detections (n=323/429, 75.3%). Of the subtyped influenza A detections, A(H3N2) has predominated (n=83/86, 96.5%). Among the 11 seasonal viruses characterized by the NML (two A(H1N1)pdm09, nine A(H3N2)), only one was antigenically similar to the vaccine strains, and all were sensitive to the antivirals, oseltamivir and zanamivir. One sporadic detection, subsequently identified as a swine influenza variant A(H1N2)v, was reported in week 41-2021 but could not be further characterized.
During the influenza A(H1N1)pdm09 pandemic in Canada, detections of non-pandemic influenza strains (influenza A(H3N2), influenza A(H1N1) [the pre-pandemic circulating influenza] and influenza B) were all suppressed through the 2009–2010 season and second wave of A(H1N1)pdm09. Influenza B percent positivity ranged from 0.0% to 0.21% and non-pandemic influenza A strains were virtually absent during the period of the 2009 H1N1 pandemic. Influenza A(H3N2) re-emerged during the 2010–2011 and 2011–2012 seasons, with more severe epidemics than pre-pandemic. It also caused notably severe epidemics in the 2012–2013 and the two seasons that followed with the 2014–2015 (increased average activity peaking at 34% positive) and 2016–2017 (increased average activity peaking at 26.8% positive) seasons being particularly intense A(H3N2) seasons. Influenza B also re-emerged in 2010–2011, but with a less severe epidemic, followed by a more severe one in 2011–2012 when it co-circulated and co-dominated with A(H3N2) (Figure 4).
Figure 4: Seasonal epidemics of influenza by type or subtype before, during and following the 2009 H1N1 pandemic, Canada, weeks 35-2007 to 52-2021
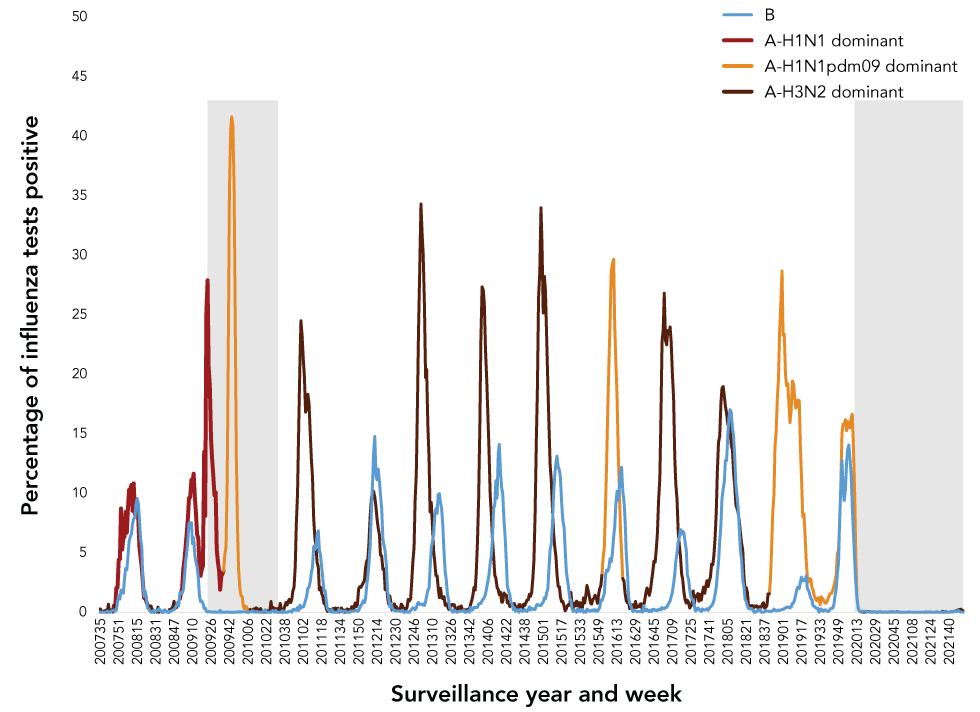
Text description: Figure 4
The x-axis shows epidemiological years and weeks 2007-35 to 2021-49. The y-axis shows the percentage of tests positive for influenza (scale from 0% to 50%). The blue line represents influenza B, the graduated color line represents influenza A, with the lightest color indicating A(H1N1)pdm09 predominant seasons, the darker color indicating A(H1N1) predominant seasons and the darkest color indicating A(H3N2) predominant seasons. The grey shaded area denotes the period of the 2009 H1N1 pandemic (June 11, 2009 to August 11, 2010), and of the COVID-19 pandemic (March 11, 2020 and ongoing as of time of publication), as declared by the World Health Organization.
Non-pandemic influenza strains were suppressed during the A(H1N1)pdm09 pandemic period. Influenza B percent positivity ranged from 0.0% to 0.21% and non-pandemic influenza A strains were virtually absent during the period of the 2009 H1N1 pandemic. Non-pandemic strains then re-emerged in subsequent seasons to cause influenza A(H3N2) and B epidemics of greater intensity than during the pre-pandemic seasons, with the 2014–2015 (increased average activity peaking at 34% positive) and 2016–2017(increased average activity peaking at 26.8% positive) seasons particularly intense A(H3N2) seasons.
Discussion
Canada saw a return and continuation of sporadic activity through most weeks of the 2021–2022 season to date (weeks 35-2021 to 52-2021). Activity remained sporadic throughout this period with only one region reporting localized activity in week 50 and no laboratory-confirmed influenza outbreaks reported. As of week 52-2021, activity remained below the epidemic threshold. The sporadic detections were a mix of influenza A and B, with influenza A(H3N2) predominating.
Similarly, in the global context, most countries continued to report lower than typical influenza activity with fewer than normal detections and very few localized outbreaksFootnote 11Footnote 12Footnote 13, through the typical early part of the Northern Hemisphere influenza season. Until December 2021, no epidemic activity had been reported anywhere since April 2020Footnote 5Footnote 6. Recent surveillance reports from December 2021 from the European Centre for Disease Prevention and Control and United States Centers for Disease Control and Prevention indicated the start and intensification of seasonal epidemic activity in several parts of the Northern HemisphereFootnote 18Footnote 19. Detections reported to the Global Influenza Surveillance and Response System (GISRS) and isolates reported to the Global Initiative on Sharing All Influenza Data (GISAID) remain a fraction of what they were pre-pandemic. Decreased genetic diversity in circulating influenza viruses has been reported with a virtual absence of influenza B/YamagataFootnote 11. A high proportion of sporadic detections globally, which have been characterized, showed antigenic differences from the recommended vaccine strainsFootnote 20Footnote 21.
Case level information on the sporadic detections to date in Canada showed some differences in pattern as compared with those observed during recent seasonal influenza epidemics that occurred prior to the COVID-19 pandemic. Burden is typically highest in seniors, but sporadic detections to date have been largely in the paediatric and younger adult population. Influenza A(H1N1)pdm09 and B detections tend to occur disproportionately in children, while A(H3N2) are disproportionate in seniors, but to date, A(H3N2) infections predominated and were disproportionately seen in children and younger adults. However, it is too soon to discern any emerging patterns or possible reasons for these findings given the lack of community transmission.
A key question concerns when activity will increase beyond sporadic detections and seasonal influenza epidemics re-emerge in Canada. As long as public health measures reduce influenza transmission by 30% or more, community circulation of influenza is likely to remain suppressedFootnote 22. Reduced international travel reduces the risk of re-introduction of seasonal strains from pockets where they are circulating and domestic policy measures aimed at reducing transmission of SARS-CoV-2 and its emerging variants, including those recently implemented against the SARS-CoV-2 Omicron variant, are likely to maintain or re-establish reductions in influenza transmission as wellFootnote 11Footnote 23.
Another key question concerns the likely impact or severity of seasonal influenza epidemics when they re-emerge. Modelling published ahead of the 2020–2021 Northern Hemisphere influenza season demonstrated that while timing of re-emergence is unpredictable, more intense and severe epidemics of influenza and other seasonal respiratory viruses such as respiratory syncytial virus (RSV) are likely to occur when circulation and transmission resumes owing to lower population immunity against the non-pandemic pathogens and strains, especially in the youngFootnote 24. The surveillance findings presented here, as well as modelling studies found more severe influenza A(H3N2) and B epidemics, occurred in the years following the 2009 H1N1 pandemicFootnote 25Footnote 26. Though the pandemic pathogens differ and the stringency and duration of public health measures greater with the COVID-19 pandemic, the experience following the emergence of influenza A(H1N1)pdm09 may give some insight into the behavior of endemic viruses after a period of suppression as well as into the performance of medical countermeasures. Vaccine strain selection against influenza has been challenging during the COVID-19 pandemic due in part to the low global influenza circulation and the resultant limited availability of candidate vaccine virusesFootnote 27. National influenza centres, in Canada as well as globally, have reported a relatively high proportion of isolates detected that are antigenically different from the vaccine strains and vaccine effectiveness has not been assessed since the 2019–2020 Northern Hemisphere seasonFootnote 28.
There remains the possibility that when seasonal influenza epidemics resume, they will occur during a period of endemic co-circulation with SARS-CoV-2. Co-circulation and co-infection with influenza and SARS-CoV-2 have been documented, and evidence points to more severe synergistic effects in patients infected with both viruses than among those with single infections with either virus Footnote 29Footnote 30. The challenges of co-circulation of influenza and SARS-CoV-2, two high burden pathogens, in the context of a strained healthcare system and new and more stringent infection prevention and control measures for management of respiratory infectious disease cases requires integrated planning approaches.
Canada may not experience a typical influenza season yet again in 2021–2022 due to more limited opportunities for introduction and local transmission/circulation. Another season of suppressed seasonal influenza activity keeps open the possibility of out-of-season circulation and continues to increase the population at risk, especially new cohorts of children younger than five years old as well as seniors who are at a disproportionate risk of influenza A(H3N2) infection, hospitalization and death. The threat of influenza remains persistent, and it is essential for countries to be vigilant for the emergence of non-seasonal influenza viruses of pandemic potential and re-emergence of seasonal influenza for the 2021–2022 Northern Hemisphere influenza season and beyondFootnote 31Footnote 32.
Authors’ statement
The FluWatch team in the Centre for Immunization and Respiratory Infectious Diseases developed the first draft collaboratively; all authors contributed to the conceptualization, writing and revision of the manuscript.
Competing interests
None.
Acknowledgements
Many thanks to all those across Canada who contribute to influenza surveillance.
Funding
FluWatch surveillance is funded by the Public Health Agency of Canada.
