
A/C Study cross-sectional investigation of HIV among ACB people

 Download this article as a PDF
Published by: The Public Health Agency of Canada
Issue: Volume 48-10, October 2022: Equity, Diversity and Inclusion in Public Health
Date published: October 2022
ISSN: 1481-8531
Submit a manuscript
About CCDR
Browse
Volume 48-10, October 2022: Equity, Diversity and Inclusion in Public Health
Survey Report
A cross-sectional investigation of HIV prevalence and risk factors among African, Caribbean and Black people in Ontario: The A/C Study
Lawrence Mbuagbaw1,2,3,4, Winston Husbands5,6, Shamara Baidoobonso7, Daeria Lawson1, Muna Aden8, Josephine Etowa9, LaRon Nelson5,10, Wangari Tharao8
Affiliations
1 Department of Health Research Methods, Evidence, and Impact, McMaster University, Hamilton, ON
2 Biostatistics Unit, The Research Institute, St Joseph’s Healthcare, Hamilton, ON
3 Centre for the Development of Best practices in Health (CDBPH), Yaoundé Central Hospital, Yaoundé, Cameroon
4 Department of Global Health, Stellenbosch University, Cape Town, South Africa
5 Ontario HIV Treatment Network, Toronto, ON
6 Dalla Lana School of Public Health, University of Toronto, Toronto, ON
7 Department of Community Health and Epidemiology, Dalhousie University, Halifax, NS
8 Women’s Health in Women’s Hands Community Health Centre, Toronto, ON
9 Faculty of Health Sciences, University of Ottawa, Ottawa, ON
10 School of Nursing, Yale University, New Haven, CT, United States
Correspondence
Suggested citation
Mbuagbaw L, Husbands W, Baidoobonso S, Lawson DO, Aden M, Etowa J, Nelson L, Tharao WE. A cross-sectional investigation of HIV prevalence and risk factors among African, Caribbean and Black people in Ontario: The A/C Study. Can Commun Dis Rep 2022;48(10):429–37. https://doi.org/10.14745/ccdr.v48i10a03
Keywords: HIV, high-risk populations, African Caribbean and Black, healthcare resource use, Canada
Abstract
Background: The human immunodeficiency virus (HIV) epidemic has disproportionately affected African, Caribbean and Black (ACB) communities in Canada. We investigated the prevalence and factors associated with HIV infection among ACB people in Ontario.
Methods: A cross-sectional survey of first- and second-generation ACB people aged 15–64 years in Toronto and Ottawa (Ontario, Canada). We collected sociodemographic information, self-reported HIV status and offered dried blood spot (DBS) testing to determine the prevalence of HIV infection. Factors associated with HIV infection were investigated using regression models.
Results: A total of 1,380 people were interviewed and 834 (60.4%) tested for HIV. The HIV prevalence was 7.5% overall (95% confidence interval [CI] 7.1–8.0) and 6.6% (95% CI 6.1–7.1) in the adult population (15–49 years). Higher age (adjusted odds ratio [aOR] 2.8; 95% CI 2.77–2.82), birth outside of Canada (aOR 4.7; 95% CI 1.50–14.71), French language (aOR 9.83; 95% CI 5.19–18.61), unemployment (aOR 1.85; 95% CI 1.62–2.11), part-time employment (aOR 4.64; 95% CI 4.32–4.99), substance use during sex (aOR 1.66; 95% CI 1.47–1.88) and homosexual (aOR 19.68; 95% CI 7.64–50.71) and bisexual orientation (aOR 2.82; 95% CI 1.19–6.65) were associated with a positive HIV test. Those with a high school (aOR 0.01; 95% CI 0.01–0.02), college (aOR 0.00; 95% CI 0.00–0.01) or university education (aOR 0.00; 95% CI 0.00–0.01), more adequate housing (aOR 0.85; 95% CI 0.82–0.88), a higher social capital score (aOR 0.61; 95% CI 0.49–0.74) and a history of sexually transmitted infections (aOR 0.40; 95% CI 0.18–0.91) were less likely to have a positive HIV test.
Conclusion: Human immunodeficiency virus infection is linked to sociodemographic, socioeconomic, and behavioural factors among ACB people in Ontario.
Introduction
African, Caribbean and Black (ACB) people in Canada experience disproportionately high vulnerability to human immunodeficiency virus (HIV) due to intersecting social determinants that limit their ability to achieve optimal health outcomesFootnote 1. This is further aggravated by HIV-related stigma and discrimination towards communities affected by HIVFootnote 2 Footnote 3. In Canada, ACB people constitute 2.5% of the population but 16% of people living with HIVFootnote 4. In the province of Ontario, ACB people constitute only 5% of the population but represent 25% of all new infectionsFootnote 4. Despite these figures, there is limited information on the HIV epidemic among ACB communities living in Canada, and there are currently no official estimates for HIV prevalence in ACB communities. Provincial surveillance data for HIV did not include ethnicity until recentlyFootnote 5 Footnote 6, which may be a contributing factor. Despite being close to 40 years into the HIV epidemic, there are no racialized data on ACB people in Canada. As such, there is no agreed upon prevalence estimate for ACB people in Canada. Further, other systemic and structural factors may limit the capacity and resources to conduct research on ACB people, such as experiences of stigma and racial discriminationFootnote 2 Footnote 3, alongside linguistic barriersFootnote 7 and migration-related issuesFootnote 8.
Given that 52% of Canada’s ACB population (over half a million people) live in OntarioFootnote 9, investigations to better understand their vulnerability to HIV infection are beneficial at the national level, including for Canada’s planned response to reduce the burden and impact of sexually transmitted and blood-borne infectionsFootnote 10
The purpose of this study (the A/C Study) is to inform policy and practice in Ontario, Canada regarding HIV care for ACB people by investigating the underlying factors that augment HIV risk and vulnerability of ACB people. In this paper, we report on the prevalence of HIV and factors associated with HIV infection.
Methods
We conducted a cross-sectional survey of ACB people in Toronto and Ottawa in Ontario, Canada from January to December 2019. The A/C Study was approved by the relevant Ethics Boards and the full protocol for the A/C Study is published elsewhereFootnote 11. Our study is reported according to the “Strengthening the Reporting of Observational Studies in Epidemiology” (STROBE) guidelinesFootnote 12. Participants provided consent for the questionnaire, dried blood spot (DBS) and data linkage to administrative databases.
Eligibility
African, Caribbean and Black people were eligible to participate if they met the following criteria: were living in Toronto or Ottawa and their surrounding municipalities; were born in a Caribbean or Sub-Saharan African country or had a parent born in any of those countries; were 15 to 64 years old at the time of the survey; could communicate in English or French; and provided informed consent. The inclusion of youth as young as 15 years allowed us to capture their unique experiences and special safeguards were put in place, including counsellors and linkage to careFootnote 11.
Sampling
Our sample size estimation was informed by census and survey data on the distributions of ACB populations from the Caribbean and Africa in Toronto and OttawaFootnote 13 Footnote 14, a presumed 2% prevalence of HIV among first and second-generation ACB people and the Wilson confidence interval approach with continuity correctionFootnote 15. This generated a sample size of 1,500, with 1,000 and 500 participants in Toronto and Ottawa, respectively.
Recruitment
Trained peer recruiters approached potentially eligible ACB people (social networks, events and venues populated by ACB people) to ask if they were interested in participating in the study.
Data collection
We obtained written informed consent for the interview and for collection of a DBS sample. Participants could consent for the interview alone or the interview and the DBS, but not the DBS alone.
The questionnaire was administered in French or English and included the following: socio-demographic information, sexual behaviour, substance use, blood donation, access to and use of health systems and services, and HIV testing, care and treatment. Further details on development and contents of the questionnaire can be found in the published protocolFootnote 11. A DBS sample was collected from all participants who consented to this part of the study; samples were tested by the Public Health Agency of Canada for antibodies against HIV. An honorarium of 40 CAD was offered to each participant. Participants were also offered a point-of-care HIV test.
Statistical analysis
The primary outcome was the result of a DBS HIV test (positive/negative). Participant characteristics analyzed were age group, city, language in which the survey was completed, sex, gender identity, sexual orientation, place of birth, level of education, employment, ability to meet basic needs, housing situation, ever tested for sexually transmitted infections (STIs), self-reported HIV status and social capital index scoreFootnote 16. The social capital index score was estimated from levels of agreement or disagreement on individuals’ perceptions about their neighbourhoodFootnote 16.
We summarized continuous data with means and standard deviations, or medians (quartile 1; quartile 3). Categorical data was described using counts and percentages. We compared our sample to the 2016 Canadian Census profileFootnote 17, and weighted the data to match the age, sex, and city distribution of Black people in the Census. The prevalence of HIV was estimated as the proportion of people with a positive HIV test among those tested. We applied the coefficient of variation (CV)—as used by Statistics Canada—to determine which values were acceptable to report from small subgroupsFootnote 18.
The factors associated with HIV infection were assessed using generalized linear models (GLM), adjusted for relevant covariates. Covariates were entered into separate models as blocks comprised of demographic (age [the six age groups were treated as ordinal], gender identity, level of education, place of birth, language, city), socioeconomic (employment status, ability to meet basic needs, housing situation, social capital index score) and sexual behaviour variables (age at first intercourse, substance use during sex, transactional sex, sexual orientation, ever had an STI test). We used robust standard errors to account for clustering within cities (Toronto and Ottawa). Only statistically significant covariates (p<0.05) were entered into the full model. Model fit was assessed using the Akaike Information Criterion (AIC) by comparing full models to partial models (a lower AIC indicates a better fit). Multicollinearity was assessed using the variance inflation factor (VIF) with a VIF>25 suggestive of multicollinearity. The type 1 error rate was set at 5%. Adjusted odds ratios (aOR) and 95% confidence intervals (CIs) are reported. Data were analyzed using Stata version 16.0.
Results
Participant characteristics
We included a total of 1,380 people 15–64 years of age. More people were recruited from Toronto (n=854/61.9%), took the survey in English (n=1,276/92.5%) and were female (n=853/63.4%). Most participants reported ever being tested for STIs (n=762/63.8%) and HIV (n=950/74.6%), with most self-reporting their HIV status as negative (n=848/91.9%). Only 834 (60.4%) participants agreed to take the DBS. A full sociodemographic profile of the participants is shown in Table 1.
| Variable | Positive test (n=67) |
Negative test (n=767) |
Not tested (n=546) |
Total (n=1,380) |
||||
|---|---|---|---|---|---|---|---|---|
| n | % | n | % | n | % | n | % | |
| Age (years)Footnote a | ||||||||
| 15–19 | 3 | 4.6 | 93 | 12.3 | 61 | 11.7 | 157 | 11.7 |
| 20–29 | 4 | 6.2 | 263 | 34.7 | 159 | 30.5 | 426 | 31.7 |
| 30–39 | 18 | 27.7 | 193 | 25.4 | 127 | 24.4 | 338 | 25.1 |
| 40–49 | 22 | 33.8 | 148 | 19.5 | 116 | 22.3 | 286 | 21.3 |
| 50–59 | 16 | 24.6 | 49 | 6.5 | 43 | 8.3 | 108 | 8.0 |
| 60–64 | 2 | 3.1 | 13 | 1.7 | 15 | 2.9 | 30 | 2.2 |
| City | ||||||||
| Toronto | 38 | 56.7 | 457 | 59.6 | 359 | 65.8 | 854 | 61.9 |
| Ottawa | 29 | 43.3 | 310 | 40.4 | 187 | 34.2 | 526 | 38.1 |
| Language | ||||||||
| English | 51 | 76.1 | 729 | 95.0 | 496 | 90.8 | 1,276 | 92.5 |
| French | 16 | 23.9 | 38 | 5.0 | 50 | 9.2 | 104 | 7.5 |
| SexFootnote a | ||||||||
| Male | 26 | 40.6 | 279 | 36.9 | 186 | 35.5 | 491 | 36.5 |
| Female | 38 | 59.4 | 477 | 63.0 | 338 | 64.5 | 853 | 63.4 |
| Intersex | 0 | 0.0 | 1 | 0.1 | 0 | 0.0 | 1 | 0.1 |
| Gender identityFootnote a | ||||||||
| Man | 22 | 34.9 | 276 | 36.5 | 183 | 34.9 | 481 | 35.8 |
| Woman | 39 | 61.9 | 468 | 61.8 | 335 | 63.9 | 842 | 62.6 |
| Trans persons | 0 | 0.0 | 2 | 0.3 | 4 | 0.8 | 6 | 0.4 |
| Non-binary persons | 2 | 3.2 | 11 | 1.5 | 2 | 0.4 | 15 | 1.1 |
| Sexual orientation | ||||||||
| Heterosexual | 44 | 74.6 | 619 | 85.4 | 421 | 87.7 | 1,084 | 85.8 |
| Homosexual | 9 | 15.3 | 26 | 3.6 | 24 | 5.0 | 59 | 4.7 |
| Bisexual | 4 | 6.8 | 56 | 7.7 | 27 | 5.6 | 87 | 6.9 |
| Other | 2 | 3.4 | 24 | 3.3 | 8 | 1.7 | 34 | 2.7 |
| Born in CanadaFootnote a | ||||||||
| Yes | 3 | 4.7 | 183 | 24.4 | 112 | 21.5 | 298 | 22.3 |
| EducationFootnote a | ||||||||
| University | 4 | 6.6 | 10 | 1.3 | 16 | 3.1 | 30 | 2.3 |
| College | 15 | 24.6 | 174 | 23.1 | 120 | 23.3 | 309 | 23.3 |
| High school | 14 | 23.0 | 136 | 18.1 | 99 | 19.3 | 249 | 18.8 |
| Less than high school | 28 | 45.9 | 432 | 57.4 | 279 | 54.3 | 739 | 55.7 |
| Employment | ||||||||
| Unemployed | 46 | 68.7 | 331 | 43.2 | 264 | 48.4 | 641 | 46.4 |
| Part-time | 12 | 17.9 | 147 | 19.2 | 103 | 18.9 | 262 | 19.0 |
| Full-time | 9 | 13.4 | 289 | 37.7 | 179 | 32.8 | 477 | 34.6 |
| Ability to meet basic needsFootnote b | ||||||||
| Not at all difficult | 8 | 12.7 | 201 | 28.4 | 106 | 21.9 | 315 | 25.1 |
| A little difficult | 18 | 28.6 | 221 | 31.2 | 155 | 32.0 | 394 | 31.4 |
| Fairly difficult | 19 | 30.2 | 152 | 21.5 | 122 | 25.2 | 293 | 23.3 |
| Very difficult | 18 | 28.6 | 134 | 18.9 | 102 | 21.0 | 254 | 20.2 |
| Housing situationFootnote b | ||||||||
| Not adequate | 15 | 25.4 | 120 | 16.7 | 95 | 19.8 | 230 | 18.3 |
| Barely adequate | 8 | 13.6 | 85 | 11.8 | 63 | 13.1 | 156 | 12.4 |
| Fairly adequate | 21 | 35.6 | 276 | 38.4 | 196 | 40.7 | 493 | 39.2 |
| Very adequate | 15 | 25.4 | 238 | 33.1 | 127 | 26.4 | 380 | 30.2 |
| Ever tested for STIFootnote a | ||||||||
| Yes | 43 | 72.9 | 443 | 63.6 | 276 | 62.9 | 762 | 63.8 |
| Self-reported HIV statusFootnote a | ||||||||
| HIV+ | 47 | 82.5 | 4 | 0.8 | 24 | 7.0 | 75 | 8.1 |
| HIV- | 10 | 17.5 | 520 | 99.2 | 318 | 93.0 | 848 | 91.9 |
|
||||||||
Prevalence of HIV infection
After weighting the sample according to age, sex and city of residence of the ACB people in Ontario, the prevalence was 7.5% (95% CI 7.1–8.0). The prevalence of HIV in the adult population (15–49 years) was 6.6% (95% CI 6.1–7.1). The prevalence in selected subgroups is shown in Figure 1.
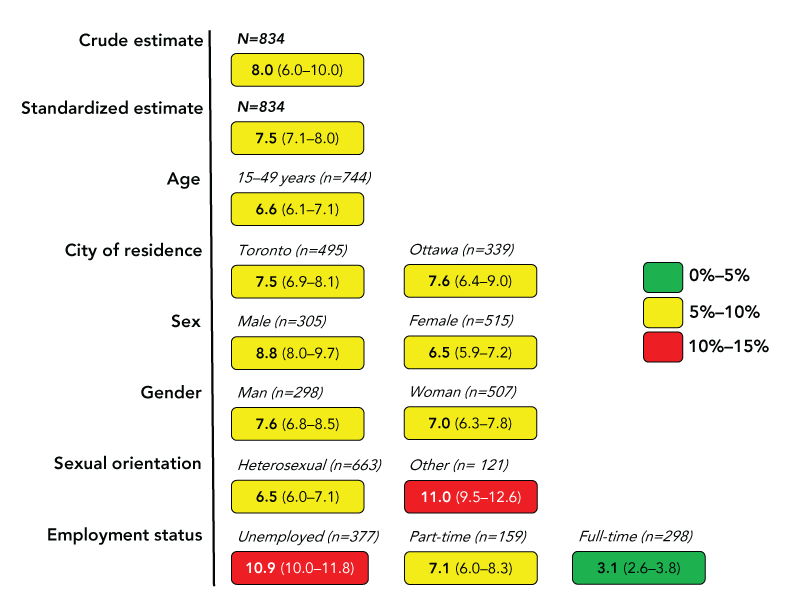
Figure 1 - Text description
This figure illustrates the prevalence (%) of human immunodeficiency virus in subgroups of African, Caribbean, and Black people surveyed in two Canadian cities in 2019. The crude estimate is 8.0 (6.0–10.0) and the standardized estimate is 7.5 (7.1–8.0).
The estimate for each subgroup is as follows:
- 6.6 (6.1–7.1) for 15–49 years of age
- 7.5 (6.9–8.1) for Toronto
- 7.6 (6.4–9.0) for Ottawa
- 8.8 (8.0–9.7) for males (sex)
- 6.5 (5.9–7.2) and for females (sex)
- 7.6 (6.8–8.5) for men (gender)
- 7.0 (6.3–7.8) for women (gender)
- 6.5 (6.0–7.1) for heterosexual orientation
- 11.0 (9.5–12.6) for other sexual orientations
- 10.9 (10.0–11.8) for unemployed
- 7.1 (96.0–8.3) for part-time employed
- 3.1 (2.6–3.8) for full-time employed
In total, 834 participants were included to generate the crude and standardized estimates. The number of participants that contributed to each subgroup is as follows: 744 for the 15–49 years of age subgroup; 495 for Toronto and 339 for Ottawa; 305 males and 515 females; 298 men and 507 women; 663 for heterosexual orientation and 121 for other sexual orientations; 377 unemployed, 159 part-time employed, and 298 full-time employed.
Factors associated with HIV infection
In the demographic model, older people (aOR 1.86; 95% CI 1.58–2.18), people with non-binary gender identities (aOR 5.20; 95% CI 1.18–7.28; compared to men), people born outside of Canada (aOR 3.19; 95% CI 1.88–5.40) and people who completed the survey in French (aOR 8.11; 95% CI 2.34–28.14) were more likely to have a positive HIV test. Women (aOR 0.58; 95% CI 0.58–0.59) compared to men, and people with a high school education (aOR 0.15; 95% CI 0.05–0.46), college (aOR 0.08; 95% CI 0.07–0.08) or university (aOR 0.05; 95% CI 0.04–0.07) compared to people with less than high school education were less likely to have a positive test.
In the socioeconomic model, people who were unemployed (aOR 2.38; 95% CI 2.17–2.62) or only part-time employed (aOR 1.35; 95% CI 1.04–1.76) were more likely to have a positive HIV test. People with better housing situations (aOR 0.71; 95% CI 0.69–0.74) and with a higher social capital index score (aOR 0.55; 95% CI 0.51–0.60) were less likely to have a positive test.
In the behavioural model, people who identified as homosexual (aOR 8.63; 95% CI 5.86–12.72) and bisexual (aOR 2.45; 95% CI 1.25–4.8) were more likely to have a positive HIV test than those who identified as heterosexual. People with a higher age at first intercourse (aOR 0.91; 95% CI 0.88–0.95), people who reported substance use during sex (aOR 0.51; 95% CI 0.39–0.66), people who reported more sexual partners (aOR 0.78; 95% 0.74–0.82), and people who had ever had an STI test (aOR 0.51; 95% CI 0.27–0.94) were less likely to have a positive test.
In the full model (including demographic, socioeconomic and behavioural factors), older people (aOR 2.8; 95% CI 2.77–2.82), people born outside of Canada (aOR 4.7; 95% CI 1.5–14.71), people who completed the survey in French (aOR 9.83; 95% CI 5.19–18.61), people who were unemployed (aOR 1.85; 95% CI 1.62–2.11) or part-time employed (aOR 4.64; 95% CI 4.32–4.99), people who reported substance use during sex (aOR 1.66; 95% CI 1.47–1.88) and people who identified as homosexual (aOR 19.68; 95% CI 7.64–50.71) or bisexual (aOR 2.82; 95% CI 1.19–6.65) were more likely to have a positive HIV test. In contrast, people with a high school (aOR 0.01; 95% CI 0.01–0.02), college (aOR 0.00; 95% CI 0.00–0.01) or university education (aOR 0.00; 95% CI 0.00–0.01), compared to people with less than high school education, people who reported a more adequate housing situation (aOR 0.85; 95% CI 0.82–0.88), people with a higher social capital index score (aOR 0.61; 95% CI 0.49–0.74) and people who reported ever having an STI test (aOR 0.40; 95% CI 0.18–0.91) were less likely to have a positive test. The results of the models are shown in Table 2.
| Partial models | Full model (n=348) AIC 4.105 |
||||||
|---|---|---|---|---|---|---|---|
| Block | Variable | aOR | p-value | aOR | p-value | ||
| n | 95% CI | n | 95% CI | ||||
Demographic |
Age | 1.86 | 1.58–2.18 | <0.001 | 2.8 | 2.77–2.82 | <0.001 |
| Gender identity | |||||||
| Man | 1 | 1 | N/A | 1 | 1 | N/A | |
| Woman | 0.58 | 0.58–0.59 | <0.001 | 1.16 | 0.83–1.62 | 0.393 | |
| Other | 5.20 | 1.18–7.28 | <0.001 | OmittedFootnote a |
N/A | ||
| Level of education | |||||||
| Less than high school | 1 | 1 | N/A | 1 | 1 | N/A | |
| High school | 0.15 | 0.05–0.46 | 0.001 | 0.01 | 0.01–0.02 | <0.001 | |
| College | 0.08 | 0.07–0.08 | <0.001 | 0.00 | 0.00–0.01 | <0.001 | |
| University | 0.05 | 0.04–0.07 | <0.001 | 0.00 | 0.00–0.00 | <0.001 | |
| Place of birth | |||||||
| Canada | 1 | 1 | N/A | 1 | 1 | N/A | |
| Other | 3.19 | 1.88–5.4 | <0.001 | 4.7 | 1.5–14.71 | 0.008 | |
| Language | |||||||
| English | 1 | 1 | N/A | 1 | 1 | N/A | |
| French | 8.11 | 2.34–28.14 | 0.001 | 9.83 | 5.19–18.61 | <0.001 | |
| City | |||||||
| Toronto | 1 | 1 | N/A | Not included in model |
|||
| Ottawa | 0.79 | 0.62–1.01 | 0.064 | Not included in model |
|||
| Economic (n=731) AIC 6.175 |
Employment | ||||||
| Unemployed | 2.38 | 2.17–2.62 | <0.001 | 1.85 | 1.62–2.11 | <0.001 | |
| Part-time | 1.35 | 1.04–1.76 | 0.024 | 4.64 | 4.32–4.99 | <0.001 | |
| Full-time | 1 | 1 | N/A | 1 | 1 | N/A | |
| Ability to meet basic needs | 0.89 | 0.73–1.08 | 0.223 | Not included in model |
|||
| Housing situation | 0.71 | 0.69–0.74 | <0.001 | 0.85 | 0.82–0.88 | <0.001 | |
| Social capital score | 0.55 | 0.51–0.60 | <0.001 | 0.61 | 0.49–0.74 | <0.001 | |
Behavioural |
Age at first intercourse | 0.91 | 0.88–0.95 | <0.001 | 0.99 | 0.92–1.07 | 0.797 |
| Substance use during sex | |||||||
| No | 1 | 1 | N/A | 1 | 1 | N/A | |
| Yes | 0.51 | 0.39–0.66 | <0.001 | 1.66 | 1.47–1.88 | <0.001 | |
| Number of sexual partners | 0.78 | 0.74–0.82 | <0.001 | 0.80 | 0.69–0.93 | 0.004 | |
| Transactional sex encounters | 1.17 | 0.47–2.91 | 0.741 | Not included in model |
|||
| Sexual orientation | |||||||
| Heterosexual | 1 | 1 | N/A | 1 | 1 | N/A | |
| Homosexual | 8.63 | 5.86–12.72 | <0.001 | 19.68 | 7.64–50.71 | <0.001 | |
| Bisexual | 2.45 | 1.25–4.8 | 0.009 | 2.82 | 1.19–6.65 | 0.018 | |
| Other | 1.02 | 0.03–32.11 | 0.992 | 6.92 | 0.53–89.73 | 0.139 | |
| Ever had an STI test | |||||||
| No | 1 | 1 | N/A | 1 | 1 | N/A | |
| Yes | 0.51 | 0.27–0.94 | 0.032 | 0.40 | 0.18–0.91 | 0.030 | |
|
|||||||
Discussion
In this study the overall adult prevalence of HIV infection was 6.6% (95% CI 6.1–7.1) and varied among subgroups; thus confirming the role of sociodemographic, socioeconomic and behavioural factors in HIV vulnerability. These findings were further highlighted in the multivariable analysis in which we identified age, education, place of birth, language, employment, housing, social capital, sexual orientation and STI testing behaviours to be associated with HIV infection.
This work highlights several key issues. First, 82.5% of people with a positive test self reported their positive HIV status; i.e., they were aware of their status. Awareness of HIV-positive status is the first of the UNAIDS 95-95-95 targets for 2030 Footnote 19, and this work confirms concerns that even if countries meet these targets on the national level, vulnerable sub populations may not. African, Caribbean and Black people in Ontario are 12.5% shy of the 2030 target. However, individuals may underreport their HIV-positive status for fear of stigma and discrimination, as shown in other studies Footnote 20.
In addition to factors that have been described in the literature, we found additional factors that may explain ACB people's vulnerability to HIV or the nefarious consequences of HIV infection. We found that people who reported a lower social capital were more likely to have HIV, suggesting that family and community supports can play a role in enhancing resilience among ACB people. These mechanisms may work by buffering systemic disadvantages that predispose individuals to HIV Footnote 21, but also by promoting preventive behaviours.
African, Caribbean and Black people who were not born in Canada were more likely to have a positive HIV test. It is possible that those who were not born in Canada immigrated from countries with a high underlying prevalence of HIV. Also, we must consider that Black immigrants, irrespective of baseline risk, have other vulnerabilities related to income and employment that increase their risk of HIV, including culture shock, socioeconomic and racial disadvantage of immigrants Footnote 22.
People who completed the survey in French were also more likely to have a positive test. These individuals constitute an ethnic and linguistic minority in Ontario, and as a result may face additional socioeconomic barriers due to their language and migrant status. A scoping review on access to HIV care for Francophones in majority English-speaking provinces highlighted difficulties faced by healthcare professionals in providing care to French-speaking clients Footnote 7.
Increasing age was associated with a higher likelihood of a positive test. This finding is similar to national trends, which show an increasing prevalence in HIV from 15–19 years age group up to the 30–39 years age group, and then a steady decline Footnote 23. In our study, the 50–59 years age group had the highest HIV prevalence. It is possible that the older people have been living with HIV for longer, and have experienced other factors (e.g. advances in understanding about prevention and public health efforts in recent decades) that may increase longevity in people with HIV.
Previous STI testing was associated with lower HIV risk. We postulate that people who have a history of an STI test may have a better appreciation of their risk for STIs including HIV. Moreover, having an STI increases the risk of HIV infection Footnote 24; therefore, testing for and treating STIs would be expected to reduce HIV risk.
Overall, our findings corroborate previous research highlighting the need for information, testing and treatment services for ACB people Footnote 25, and a disconnect between perceived and actual risk for HIV infection Footnote 26. Even though we have discussed these factors separately, they do not exist in a vacuum and likely interact in complex ways to create vulnerability to HIV. While this study was conducted among ACB people, the findings may be true for other racialized or equity-seeking groups of people in Canada and serve to further our understanding of vulnerability to HIV.
Study limitations
This study is not without limitations. First, the planned sample size of 1,500 was not met; however, the sample size of 1,500 was based on an assumed prevalence of HIV of 2%. Given that the prevalence was higher, a smaller sample size would suffice. Second, this is a cross-sectional study, which precludes inferences about causality or the temporal nature of the associations reported here. Third, inaccuracies and non-response to certain questions were inevitable, leading to potential recall bias and social desirability bias. More so, despite weighting, the people who opted to take a DBS test may not be representative of the ACB population, and selection bias may be present. Fourth, the language in which participants chose to complete the questionnaire might not be a true reflection of their primary language of communication.
Study strengths
This study was led by ACB researchers, in line with the principles of autonomy and self-determination in community-led research, and ensured that those participants, recruiters and other community members were treated respectfully in a culturally appropriate manner. Our approach to knowledge translation prioritized the community and has been implemented so far through community presentations and a community report in French and English Footnote 27 Footnote 28. This is the largest study of ACB people in Canada, with estimates of HIV prevalence by subgroups. Further details on the A/C Study can be accessed online.
Conclusion
African, Caribbean and Black people in Ontario are at a high risk of HIV infection and this risk is linked to sociodemographic, socioeconomic, and behavioural factors. Interventions to improve the social and economic wellbeing of ACB people by removing structural barriers to information, HIV testing, pre and post-exposure prophylaxis and other resources that curb transmission of HIV are needed. An ACB cohort study or linkage to administrative databases would be an ideal way to measure long-term trends in HIV risk, access to health services and health outcomes.
Authors' statement
LM — Writing–original draft
DOL — Writing–original draft; formal analysis; review and editing
LM — Design study; develop data collection instruments
WET — Design study; develop data collection instruments; review and editing
WH — Design study; develop data collection instruments; review and editing
LEN — Design study; develop data collection instruments; review and editing
JE — Design study; develop data collection instruments; review and editing
SB — Analysis review; review and editing
All authors reviewed and approved the final draft.
The content and view expressed in this article are those of the authors and do not necessarily reflect those of the Government of Canada.
Competing interests
None.
Acknowledgements
We acknowledge the support of the Public Health Agency of Canada’s National HIV and Retrovirology Laboratories for performing the dried blood spot testing; the community members, interviewers, study coordinators, community organizations (Women’s Health in Women’s Hands, Black Creek Community Health Centre, Somerset West Community Health Centre, Canadians of African Descent Health Organization, AIDS committee of Ottawa, African Canadian Association of Ottawa, TAIBU Community Health Centre, Africans in Partnership Against AIDS, African and Black Diaspora Global Network, Black Health Alliance, Bruce House, Regent Park Community Health Centre), partner institutions and participants who contributed their valuable time to this research. Also, we thank the numerous collaborators, colleagues and partners who were involved in earlier stages of this project.
Funding
This work is supported by an award/grant from The Ontario HIV Treatment Network (OHTN).
This study was supported by the Canadian Institutes of Health Research through an Operating Grant in the HIV/AIDS Community Based Research (CBR) Program.
