
Invasive pneumococcal disease in Canada, 2020

 Download this article as a PDF
Published by: The Public Health Agency of Canada
Issue: Volume 48-9, September 2022: Invasive Diseases Surveillance in Canada
Date published: September 2022
ISSN: 1481-8531
Submit a manuscript
About CCDR
Browse
Volume 48-9, September 2022: Invasive Diseases Surveillance in Canada
Surveillance
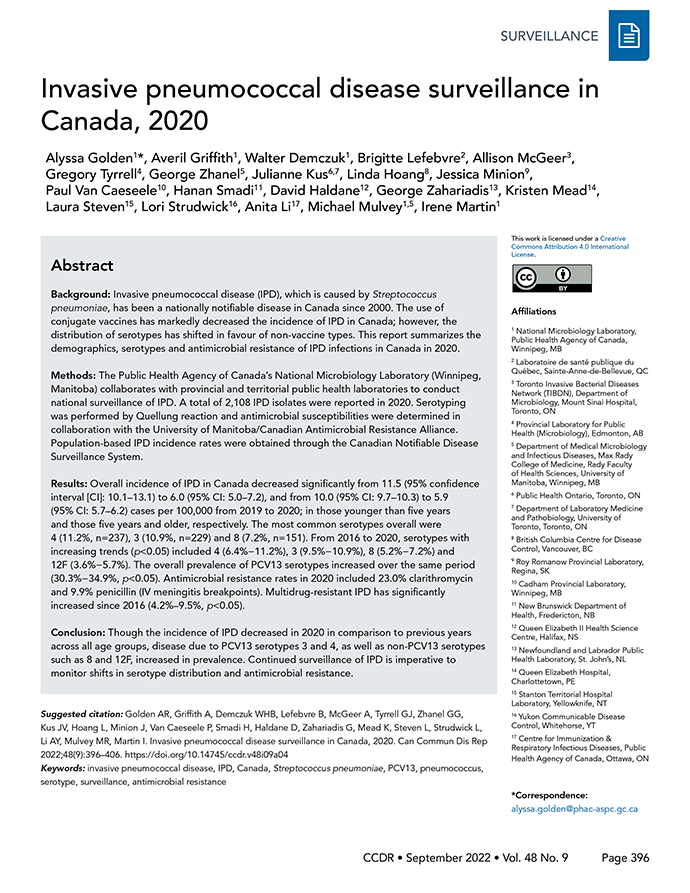
Invasive pneumococcal disease surveillance in Canada, 2020
Alyssa Golden1, Averil Griffith1, Walter Demczuk1, Brigitte Lefebvre2, Allison McGeer3, Gregory Tyrrell4, George Zhanel5, Julianne Kus6,7, Linda Hoang8, Jessica Minion9, Paul Van Caeseele10, Hanan Smadi11, David Haldane12, George Zahariadis13, Kristen Mead14, Laura Steven15, Lori Strudwick16, Anita Li17, Michael Mulvey1,5, Irene Martin1
Affiliations
1 National Microbiology Laboratory, Public Health Agency of Canada, Winnipeg, MB
2 Laboratoire de santé publique du Québec, Sainte-Anne-de-Bellevue, QC
3 Toronto Invasive Bacterial Diseases Network (TIBDN), Department of Microbiology, Mount Sinai Hospital, Toronto, ON
4 Provincial Laboratory for Public Health (Microbiology), Edmonton, AB
5 Department of Medical Microbiology and Infectious Diseases, Max Rady College of Medicine, Rady Faculty of Health Sciences, University of Manitoba, Winnipeg, MB
6 Public Health Ontario, Toronto, ON
7 Department of Laboratory Medicine and Pathobiology, University of Toronto, Toronto, ON
8 British Columbia Centre for Disease Control, Vancouver, BC
9 Roy Romanow Provincial Laboratory, Regina, SK
10 Cadham Provincial Laboratory, Winnipeg, MB
11 New Brunswick Department of Health, Fredericton, NB
12 Queen Elizabeth II Health Science Centre, Halifax, NS
13 Newfoundland and Labrador Public Health Laboratory, St. John's, NL
14 Queen Elizabeth Hospital, Charlottetown, PE
15 Stanton Territorial Hospital Laboratory, Yellowknife, NT
16 Yukon Communicable Disease Control, Whitehorse, YT
17 Centre for Immunization & Respiratory Infectious Diseases, Public Health Agency of Canada, Ottawa, ON
Correspondence
Suggested citation
Golden AR, Griffith A, Demczuk WHB, Lefebvre B, McGeer A, Tyrrell GJ, Zhanel GG, Kus JV, Hoang L, Minion J, Van Caeseele P, Smadi H, Haldane D, Zahariadis G, Mead K, Steven L, Strudwick L, Li AY, Mulvey MR, Martin I. Invasive pneumococcal disease surveillance in Canada, 2020. Can Commun Dis Rep 2022;48(9):396–406. https://doi.org/10.14745/ccdr.v48i09a04
Keywords: invasive pneumococcal disease, IPD, Canada, Streptococcus pneumoniae, PCV13, pneumococcus, serotype, surveillance, antimicrobial resistance
Abstract
Background: Invasive pneumococcal disease (IPD), which is caused by Streptococcus pneumoniae, has been a nationally notifiable disease in Canada since 2000. The use of conjugate vaccines has markedly decreased the incidence of IPD in Canada; however, the distribution of serotypes has shifted in favour of non-vaccine types. This report summarizes the demographics, serotypes and antimicrobial resistance of IPD infections in Canada in 2020.
Methods: The Public Health Agency of Canada's National Microbiology Laboratory (Winnipeg, Manitoba) collaborates with provincial and territorial public health laboratories to conduct national surveillance of IPD. A total of 2,108 IPD isolates were reported in 2020. Serotyping was performed by Quellung reaction and antimicrobial susceptibilities were determined in collaboration with the University of Manitoba/Canadian Antimicrobial Resistance Alliance. Population-based IPD incidence rates were obtained through the Canadian Notifiable Disease Surveillance System.
Results: Overall incidence of IPD in Canada decreased significantly from 11.5 (95% confidence interval [CI]: 10.1–13.1) to 6.0 (95% CI: 5.0–7.2), and from 10.0 (95% CI: 9.7–10.3) to 5.9 (95% CI: 5.7–6.2) cases per 100,000 from 2019 to 2020; in those younger than five years and those five years and older, respectively. The most common serotypes overall were 4 (11.2%, n=237), 3 (10.9%, n=229) and 8 (7.2%, n=151). From 2016 to 2020, serotypes with increasing trends (p<0.05) included 4 (6.4%−11.2%), 3 (9.5%−10.9%), 8 (5.2%−7.2%) and 12F (3.6%−5.7%). The overall prevalence of PCV13 serotypes increased over the same period (30.3%−34.9%, p<0.05). Antimicrobial resistance rates in 2020 included 23.0% clarithromycin and 9.9% penicillin (IV meningitis breakpoints). Multidrug-resistant IPD has significantly increased since 2016 (4.2%–9.5%, p<0.05).
Conclusion: Though the incidence of IPD decreased in 2020 in comparison to previous years across all age groups, disease due to PCV13 serotypes 3 and 4, as well as non-PCV13 serotypes such as 8 and 12F, increased in prevalence. Continued surveillance of IPD is imperative to monitor shifts in serotype distribution and antimicrobial resistance.
Introduction
Invasive pneumococcal disease (IPD) causes severe infections such as meningitis and bacteraemia, with children and the elderly being at greatest risk for infectionFootnote 1. Of the approximately 100 distinct pneumococcal serotypes currently recognized, the majority of disease worldwide is caused by only a few serotypesFootnote 1Footnote 2. Vaccination has proven effective in reducing the incidence of IPD. A 7-valent pneumococcal conjugate vaccine (PCV7), consisting of serotypes 4, 6B, 9V, 14, 18C, 19F and 23F, was introduced in all Canadian provincial and territorial vaccination programs between 2002 and 2006Footnote 3. Though PCV7 use led to a dramatic decrease in incidence of disease caused by the constituent serotypesFootnote 3Footnote 4Footnote 5, a subsequent increase in non-PCV7 serotype infections occurred, including serotypes 7F and 19AFootnote 3Footnote 6. In 2009, a 10-valent pneumococcal conjugate vaccine (PCV10) program (consisting of all PCV7 serotypes plus serotypes 1, 5 and 7F) was implemented in Québec, Ontario, Yukon and Newfoundland and Labrador. The 13-valent pneumococcal conjugate vaccine (PCV13, consisting of all PCV10 serotypes plus serotypes 3, 6A and 19A) was recommended for use in Canada in 2010 and introduced by all provinces and territories during 2010 and 2011, though specific immunization schedules vary by jurisdictionFootnote 5Footnote 7Footnote 8. In 2018, Québec replaced PCV13 with PCV10 for paediatric IPD immunization; subsequently Québec introduced a mixed schedule in late 2020: two doses of PCV10 (two and four months of age); and one dose of PCV13 (one year old). A 23-valent pneumococcal polysaccharide vaccine (PPV23 which includes all PCV13 serotypes except 6A, plus serotypes 2, 8, 9N, 10A, 11A, 12F, 15B/C, 17F, 20, 22F and 33F) has been available for use in Canada since 1989, particularly in older adults and children over two years of age at high risk of IPDFootnote 7Footnote 9.
Surveillance of the distribution of Streptococcus pneumoniae serotypes is important to monitor serotype replacement and inform future vaccine composition. Several higher valency pneumococcal conjugate vaccines (PCVs) are in development. These incorporate emerging serotypes, including PCV15 (consisting of all PCV13 serotypes plus serotypes 22F and 33F) and PCV20 (all PCV15 serotypes plus serotypes 8, 10A, 11A, 12F and 15BC) Footnote 10Footnote 11. The objective of this annual surveillance report is to provide a summary of the serotypes and antimicrobial resistance associated with IPD in Canada in 2020.
Methods
Surveillance program
Surveillance of IPD in Canada consists of a passive laboratory-based system where all invasive isolates from all provincial/territorial public health laboratories are serotyped by the National Microbiology Laboratory (NML), Winnipeg; the Laboratoire de santé publique du Québec (LSPQ); or the Provincial Laboratory for Public Health, Edmonton, Alberta (ProvLab Alberta). In 2019, surveillance of IPD in Québec was expanded to all invasive strains. A total of 2,108 IPD isolates were reported in 2020, including 1,408 submitted to NML by provincial and territorial public health laboratories; as well as data for 426 and 274 IPD isolates serotyped by LSPQ and ProvLab Alberta, respectively (Table 1). Sterile clinical isolation sites include blood, cerebrospinal fluid, peritoneal, pericardial or joint fluid, internal body sites and deep tissue including surgical or biopsy samples. Although S. pneumoniae isolated from the pleural cavity does not currently meet the national case definition for invasive disease, these isolates are included for the analyses in this report as S. pneumoniae isolated from pleural fluid is widely considered as invasive in other jurisdictionsFootnote 3.
| Province | Age groups (years) | Not given | Total | |||||
|---|---|---|---|---|---|---|---|---|
| Younger than 2 | 2–4 | 5–14 | 15–49 | 50–64 | 65 or older | |||
| British ColumbiaTable 1 footnote a | 2 | 3 | 6 | 88 | 115 | 74 | 1 | 289 |
| Alberta | 7 | 3 | 0 | 115 | 80 | 68 | 1 | 274 |
| Saskatchewan | 3 | 2 | 1 | 41 | 41 | 21 | 2 | 111 |
| Manitoba | 6 | 3 | 2 | 79 | 48 | 29 | 0 | 167 |
| Ontario | 26 | 13 | 8 | 150 | 229 | 246 | 4 | 676 |
| Québec | 38 | 14 | 9 | 71 | 117 | 225 | 1 | 475Table 1 footnote b |
| AtlanticTable 1 footnote c | 0 | 0 | 2 | 14 | 21 | 51 | 6 | 94 |
| NorthernTable 1 footnote d | 0 | 0 | 1 | 9 | 8 | 4 | 0 | 22 |
| Total | 82 | 38 | 29 | 567 | 659 | 718 | 15 | 2,108 |
Preliminary population-based incidence of disease data for 2020 were obtained through the Canadian Notifiable Disease Surveillance System (CNDSS). Population data for incidence rates were obtained from Statistics Canada's July 1st annual population estimates.
Isolate testing
All IPD isolates were screened using bile solubility and optochin disc susceptibility (Oxoid)Footnote 12. Serotyping of IPD at NML, LSPQ and ProvLab Alberta was performed by the Quellung reaction using pool, group, type and factor commercial antisera (SSI Diagnostica; Statens Serum Institute, Copenhagen, Denmark)Footnote 13. Isolates for which a Quellung reaction was not observed were confirmed as S. pneumoniae by rpoB gene sequencing Footnote 14Footnote 15. For this study serotypes 15B and 15C were grouped together as 15B/C because of reported reversible switching between them in vivo during infection, making it difficult to precisely differentiate between the two typesFootnote 16Footnote 17.
In 2011, the NML began a collaboration with the University of Manitoba/Canadian Antimicrobial Resistance Alliance to provide antimicrobial susceptibility testing for S. pneumoniae isolates submitted to NML. All IPD isolates (n=1,022) submitted to NML for serotyping by the provincial public health laboratories of Saskatchewan, Manitoba, Ontario, Québec, Nova Scotia, Prince Edward Island, Newfoundland and Labrador and six of seven health regions in New Brunswick were included in the study. Tested antimicrobials included penicillin, amoxicillin/clavulanate, ceftriaxone, chloramphenicol, clarithromycin, clindamycin, doxycycline, imipenem, meropenem, levofloxacin, trimethoprim/sulfamethoxazole, linezolid and vancomycin. Minimum inhibitory concentrations were determined by the Clinical and Laboratory Standards Institute (CLSI) broth microdilution method using 96-well custom designed microtitre plates prepared by Canadian Antimicrobial Resistance AllianceFootnote 18. Minimum inhibitory concentration interpretive standards were defined according to CLSI breakpointsFootnote 19. Multidrug resistance (MDR) was defined as resistance to three or more classes of antimicrobials. Antimicrobial susceptibility testing results from other laboratories are not included in this report.
Data analysis
Data submitted with bacterial isolates included patient age, sex, clinical source, province and date of collection. Multiple isolates with the same serotype and collected from the same patient within 14 days were counted once with the most invasive isolation site assigned. Meningitis related isolates were regarded as most invasive, followed by blood and then other sterile sites. The laboratory data were aggregated by age into younger than two, 2–4, 5–14, 15–49 and 50–64 years and 65 years and older age groups and regionally into Western (British Columbia, Alberta, Saskatchewan, Manitoba), Central (Ontario and Québec), Eastern (New Brunswick, Nova Scotia, Prince Edward Island, Newfoundland and Labrador) and Northern (Yukon Territories, Northwest Territories and Nunavut) regions of Canada. Statistical significance of trends was assessed using the Cochran-Armitage test for trend, with a p-value of <0.05 considered significant.
Results
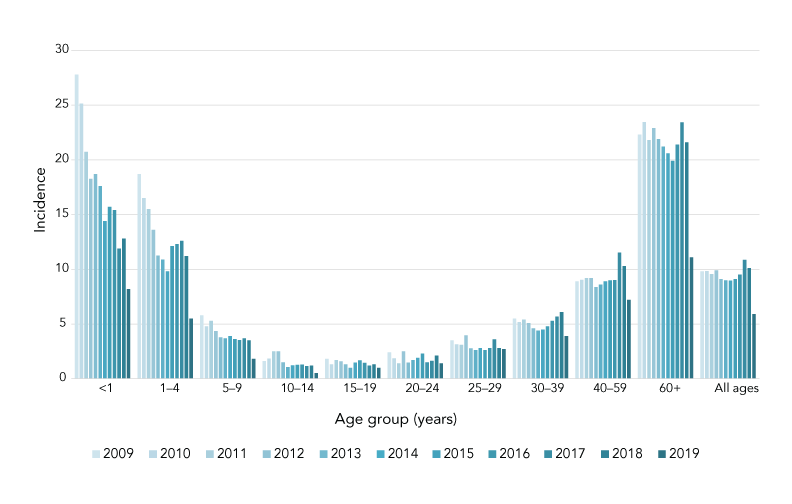
Prior to 2020, the overall IPD incidence rates in Canada have remained stable since 2009. In 2020 the national incidence rate was 5.9 cases per 100,000 population (95% CI: 5.7–6.2); this was a significant decrease compared to 10.1 cases per 100,000 population in 2019 (95% CI: 9.8–10.4) (Figure 1; Supplemental material Table S1). Though IPD incidence declined across all age groups from 2019 to 2020, the largest absolute decline in incidence was seen in seniors aged 60 years and older. It remained around 20 cases per 100,000 population between 2009 and 2019 but declined from 21.6 cases per 100,000 population in 2019 (95% CI: 20.6–22.6) to 11.1 cases per 100,000 population in 2020 (95% CI: 10.4–11.8).
Figure 1: Annual incidence of invasive pneumococcal disease cases per 100,000 population in Canada by age group, 2010–2020
Text description: Figure 1
This figure is a bar graph displaying the incidence of invasive pneumococcal disease cases per 100,000 population in Canada from 2009 to 2020, by age group.
| Age group | 2009 | 2010 | 2011 | 2012 | 2013 | 2014 | 2015 | 2016 | 2017 | 2018 | 2019 | 2020 |
|---|---|---|---|---|---|---|---|---|---|---|---|---|
| <1 | 27.8 | 25.1 | 20.7 | 18.3 | 18.7 | 17.6 | 14.4 | 15.7 | 15.4 | 11.9 | 12.8 | 8.2 |
| 1–4 | 18.7 | 16.5 | 15.5 | 13.6 | 11.2 | 10.9 | 9.8 | 12.1 | 12.3 | 12.6 | 11.2 | 5.5 |
| 5–9 | 5.8 | 4.8 | 5.3 | 4.3 | 3.8 | 3.7 | 3.9 | 3.6 | 3.5 | 3.7 | 3.5 | 1.8 |
| 10–14 | 1.6 | 1.8 | 2.5 | 2.5 | 1.5 | 1.1 | 1.2 | 1.3 | 1.3 | 1.2 | 1.2 | 0.5 |
| 15–19 | 1.8 | 1.3 | 1.7 | 1.6 | 1.3 | 1.0 | 1.5 | 1.7 | 1.4 | 1.2 | 1.3 | 1.0 |
| 20–24 | 2.4 | 1.9 | 1.4 | 2.5 | 1.5 | 1.7 | 1.9 | 2.3 | 1.5 | 1.6 | 2.1 | 1.4 |
| 25–29 | 3.5 | 3.1 | 3.1 | 4.0 | 2.8 | 2.6 | 2.8 | 2.6 | 2.8 | 3.6 | 2.8 | 2.7 |
| 30–39 | 5.5 | 5.2 | 5.4 | 5.1 | 4.6 | 4.4 | 4.5 | 4.8 | 5.3 | 5.7 | 6.1 | 3.9 |
| 40–59 | 8.9 | 9.0 | 9.2 | 9.2 | 8.4 | 8.6 | 8.9 | 9.0 | 9.0 | 11.5 | 10.3 | 7.2 |
| 60+ | 22.3 | 23.4 | 21.8 | 22.9 | 21.9 | 21.2 | 20.6 | 19.9 | 21.4 | 23.4 | 21.6 | 11.1 |
| All ages | 9.8 | 9.8 | 9.6 | 9.9 | 9.1 | 9.0 | 9.0 | 9.1 | 9.5 | 10.9 | 10.1 | 5.9 |
Of the 2,108 IPD isolates serotyped in 2020, 2,098 had patient ages. Infants younger than two years of age accounted for 3.9% (n=82), toddlers aged 2–4 years for 1.8% (n=38), children aged 5–14 years for 1.4% (n=29), adults aged 15–49 years for 26.9% (n=567), older adults aged 50–64 years for 31.3% (n=659) and seniors aged 65 years and older for 34.1% (n=718). Sex information was specified for 2,066 isolates of which 58.2% (n=1,203) were from male patients. Blood was the most frequent clinical isolation site accounting for 92.3% (n=1,945) of all isolates collected in 2020. Additional information on serotypes by specimen source can be found in Figures S1 to S4.
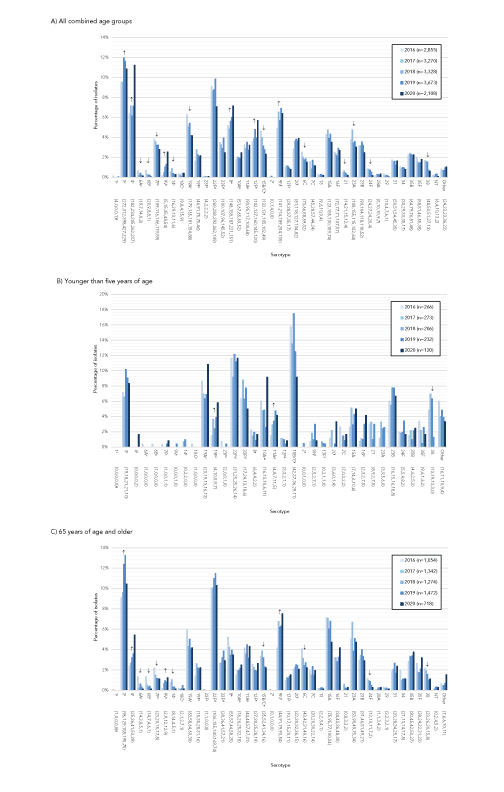
The most commonly collected serotypes overall in 2020 were 4 (11.2%, n=237), 3 (10.9%, n=229), 8 (7.2%, n=151), 22F (7.1%, n=149), 9N (6.4%, n=135) and 12F (5.7%, n=120). Serotypes that demonstrated significant increasing trends in prevalence from 2016 to 2020 (Figure 2; A) include PCV13 serotypes 4 (6.4%−11.2%, p<0.001), 3 (9.5%−10.9%, p=0.004) and 9V (0.2%−2.6%, p<0.001), as well as PPV23 serotype 9N (4.9%−6.4%, p=0.02) and PCV20/PPV23 serotypes 8 (5.2%−7.2%, p<0.001) and 12F (3.6%−5.7%, p=0.002). Vaccine serotypes that significantly decreased in prevalence from 2016 to 2020 include 6A, 6B, 7F, 14, 15B/C and 19A (p≤0.04).
Figure 2: Invasive Streptococcus pneumoniae serotype prevalence trends by age, 2016–2020Figure 2 footnote aFigure 2 footnote b
Text description: Figure 2
Figure A: This figure is a bar graph displaying the percentage of Streptococcus pneumoniae serotypes from all age groups from 2016 to 2020, based on the total number of isolates tested annually.
| Serotype | 2016 (n=2,855) |
2017 (n=3,270) |
2018 (n=3,328) |
2019 (n=3,673) |
2020 (n=2,108) |
|---|---|---|---|---|---|
| 1Figure 2 footnote c (4,0,0,0,1)Figure 2 footnote g | 0.1% | 0.0% | 0.0% | 0.0% | 0.0% |
| 3Figure 2 footnote c (272,312,398,427,229) | 9.5% | 9.5% | 12.0% | 11.6% | 10.9% |
| 4Figure 2 footnote c (182,234,205,262,237) | 6.4% | 7.2% | 6.2% | 7.1% | 11.2% |
| 6AFigure 2 footnote c (19,7,14,8,3) | 0.7% | 0.2% | 0.4% | 0.2% | 0.1% |
| 6BFigure 2 footnote c (20,9,8,8,1) | 0.7% | 0.3% | 0.2% | 0.2% | 0.0% |
| 7FFigure 2 footnote c (109,116,106,119,59) | 3.8% | 3.5% | 3.2% | 3.2% | 2.8% |
| 9VFigure 2 footnote c (5,15,35,48,54) | 0.2% | 0.5% | 1.1% | 1.3% | 2.6% |
| 14Figure 2 footnote c (16,29,13,11,6) | 0.6% | 0.9% | 0.4% | 0.3% | 0.3% |
| 18CFigure 2 footnote c (9,8,4,15,9) | 0.3% | 0.2% | 0.1% | 0.4% | 0.4% |
| 19AFigure 2 footnote c (179,165,181,154,88) | 6.3% | 5.0% | 5.4% | 4.2% | 4.2% |
| 19FFigure 2 footnote c (46,91,75,75,46) | 1.6% | 2.8% | 2.3% | 2.0% | 2.2% |
| 23FFigure 2 footnote c (4,2,2,2,2) | 0.1% | 0.1% | 0.1% | 0.1% | 0.1% |
| 22FFigure 2 footnote d (260,283,292,362,149) | 9.1% | 8.7% | 8.8% | 9.9% | 7.1% |
| 33FFigure 2 footnote d (100,107,96,145,52) | 3.5% | 3.3% | 2.9% | 3.9% | 2.5% |
| 8Figure 2 footnote e (148,158,187,221,151) | 5.2% | 4.8% | 5.6% | 6.0% | 7.2% |
| 10AFigure 2 footnote e (51,67,65,69,52) | 1.8% | 2.0% | 2.0% | 1.9% | 2.5% |
| 11AFigure 2 footnote e (93,95,117,100,68) | 3.3% | 2.9% | 3.5% | 2.7% | 3.2% |
| 12FFigure 2 footnote e (102,127,160,145,120) | 3.6% | 3.9% | 4.8% | 3.9% | 5.7% |
| 15B/CFigure 2 footnote e (132,131,105,102,49) | 4.6% | 4.0% | 3.2% | 2.8% | 2.3% |
| 2Figure 2 footnote f (0,1,4,0,0) | 0.0% | 0.0% | 0.1% | 0.0% | 0.0% |
| 9NFigure 2 footnote f (141,214,189,254,135) | 4.9% | 6.5% | 5.7% | 6.9% | 6.4% |
| 17FFigure 2 footnote f (29,38,37,35,17) | 1.0% | 1.2% | 1.1% | 1.0% | 0.8% |
| 20Figure 2 footnote f (81,118,127,134,82) | 2.8% | 3.6% | 3.8% | 3.6% | 3.9% |
| 6C (73,66,58,69,32) | 2.6% | 2.0% | 1.7% | 1.9% | 1.5% |
| 7C (45,28,57,44,24) | 1.6% | 0.9% | 1.7% | 1.2% | 1.1% |
| 13 (9,6,10,9,4) | 0.3% | 0.2% | 0.3% | 0.2% | 0.2% |
| 15A (123,155,130,159,74) | 4.3% | 4.7% | 3.9% | 4.3% | 3.5% |
| 16F (72,77,71,107,57) | 2.5% | 2.4% | 2.1% | 2.9% | 2.7% |
| 21 (14,21,15,12,4) | 0.5% | 0.6% | 0.5% | 0.3% | 0.2% |
| 23A (108,155,115,132,64) | 3.8% | 4.7% | 3.5% | 3.6% | 3.0% |
| 23B (90,104,118,118,52) | 3.2% | 3.2% | 3.5% | 3.2% | 2.5% |
| 24F (24,27,24,20,4) | 0.8% | 0.8% | 0.7% | 0.5% | 0.2% |
| 28A (5,10,10,9,7) | 0.2% | 0.3% | 0.3% | 0.2% | 0.3% |
| 29 (10,4,7,6,1) | 0.4% | 0.1% | 0.2% | 0.2% | 0.0% |
| 31 (50,51,54,45,35) | 1.8% | 1.6% | 1.6% | 1.2% | 1.7% |
| 34 (30,29,33,35,17) | 1.1% | 0.9% | 1.0% | 1.0% | 0.8% |
| 35B (64,79,76,81,48) | 2.2% | 2.4% | 2.3% | 2.2% | 2.3% |
| 35F (58,51,46,55,38) | 2.0% | 1.6% | 1.4% | 1.5% | 1.8% |
| 38 (48,53,51,27,13) | 1.7% | 1.6% | 1.5% | 0.7% | 0.6% |
| NT (6,4,10,13,2) | 0.2% | 0.1% | 0.3% | 0.4% | 0.1% |
| Other (24,23,23,36,22) | 0.8% | 0.7% | 0.7% | 1.0% | 1.0% |
Figure B: This figure is a bar graph displaying the percentage of Streptococcus pneumoniae serotypes from children younger than five years of age from 2016 to 2020, based on the total number of isolates tested annually.
| Serotype | 2016 (n=266) |
2017 (n=273) |
2018 (n=206) |
2019 (n=232) |
2020 (n=120) |
|---|---|---|---|---|---|
| 1Figure 2 footnote c (0,0,0,0,0)Figure 2 footnote g | 0.0% | 0.0% | 0.0% | 0.0% | 0.0% |
| 3Figure 2 footnote c (19,18,21,21,10) | 7.1% | 6.6% | 10.2% | 9.1% | 8.3% |
| 4Figure 2 footnote c (0,0,0,0,2) | 0.0% | 0.0% | 0.0% | 0.0% | 1.7% |
| 6AFigure 2 footnote c (1,0,0,0,0) | 0.4% | 0.0% | 0.0% | 0.0% | 0.0% |
| 6BFigure 2 footnote c (1,0,0,0,0) | 0.4% | 0.0% | 0.0% | 0.0% | 0.0% |
| 7FFigure 2 footnote c (1,0,0,1,1) | 0.4% | 0.0% | 0.0% | 0.4% | 0.8% |
| 9VFigure 2 footnote c (0,0,0,1,0) | 0.0% | 0.0% | 0.0% | 0.4% | 0.0% |
| 14Figure 2 footnote c (0,2,2,0,0) | 0.0% | 0.7% | 1.0% | 0.0% | 0.0% |
| 18CFigure 2 footnote c (1,0,0,0,0) | 0.4% | 0.0% | 0.0% | 0.0% | 0.0% |
| 19AFigure 2 footnote c (23,19,13,16,13) | 8.6% | 7.0% | 6.3% | 6.9% | 10.8% |
| 19FFigure 2 footnote c (4,10,5,9,7) | 1.5% | 3.7% | 2.4% | 3.9% | 5.8% |
| 23FFigure 2 footnote c (2,0,0,1,0) | 0.8% | 0.0% | 0.0% | 0.4% | 0.0% |
| 22FFigure 2 footnote d (31,25,25,26,14) | 11.7% | 9.2% | 12.1% | 11.2% | 11.7% |
| 33FFigure 2 footnote d (17,24,13,18,6) | 6.4% | 8.8% | 6.3% | 7.8% | 5.0% |
| 8Figure 2 footnote e (6,4,4,2,2) | 2.3% | 1.5% | 1.9% | 0.9% | 1.7% |
| 10AFigure 2 footnote e (16,13,10,6,11) | 6.0% | 4.8% | 4.9% | 2.6% | 9.2% |
| 11AFigure 2 footnote e (4,8,7,11,5) | 1.5% | 2.9% | 3.4% | 4.7% | 4.2% |
| 12FFigure 2 footnote e (3,3,2,1,1) | 1.1% | 1.1% | 1.0% | 0.4% | 0.8% |
| 15B/CFigure 2 footnote e (42,37,36,29,11) | 15.8% | 13.6% | 17.5% | 12.5% | 9.2% |
| 2Figure 2 footnote f (0,0,1,0,0) | 0.0% | 0.0% | 0.5% | 0.0% | 0.0% |
| 9NFigure 2 footnote f (2,5,2,7,1) | 0.8% | 1.8% | 1.0% | 3.0% | 0.8% |
| 17FFigure 2 footnote f (0,2,1,1,0) | 0.0% | 0.7% | 0.5% | 0.4% | 0.0% |
| 20Figure 2 footnote f (3,6,0,1,4) | 1.1% | 2.2% | 0.0% | 0.4% | 3.3% |
| 7C (7,0,3,2,2) | 2.6% | 0.0% | 1.5% | 0.9% | 1.7% |
| 15A (7,14,6,10,6) | 2.6% | 5.1% | 2.9% | 4.3% | 5.0% |
| 16F (2,3,2,7,5) | 0.8% | 1.1% | 1.0% | 3.0% | 4.2% |
| 21 (8,9,2,7,0) | 3.0% | 3.3% | 1.0% | 3.0% | 0.0% |
| 23A (3,9,5,6,0) | 1.1% | 3.3% | 2.4% | 2.6% | 0.0% |
| 23B (16,15,16,18,8) | 6.0% | 5.5% | 7.8% | 7.8% | 6.7% |
| 24F (5,5,4,8,2) | 1.9% | 1.8% | 1.9% | 3.4% | 1.7% |
| 35B (4,6,2,5,3) | 1.5% | 2.2% | 1.0% | 2.2% | 2.5% |
| 35F (9,6,1,6,2) | 3.4% | 2.2% | 0.5% | 2.6% | 1.7% |
| 38 (13,19,13,3,0) | 4.9% | 7.0% | 6.3% | 1.3% | 0.0% |
| Other (16,11,10,9,4) | 6.0% | 4.0% | 4.9% | 3.9% | 3.3% |
Figure C: This figure is a bar graph displaying the percentage of Streptococcus pneumoniae serotypes from adults 65 year of age and older from 2016 to 2020, based on the total number of isolates tested annually.
| Serotype | 2016 (n=1,054) |
2017 (n=1,342) |
2018 (n=1,274) |
2019 (n=1,472) |
2020 (n=718) |
|---|---|---|---|---|---|
| 1Figure 2 footnote c (1,0,0,0,0)Figure 2 footnote g | 0.1% | 0.0% | 0.0% | 0.0% | 0.0% |
| 3Figure 2 footnote c (96,129,158,195,75) | 9.1% | 9.6% | 12.4% | 13.2% | 10.4% |
| 4Figure 2 footnote c (25,36,41,53,39) | 2.4% | 2.7% | 3.2% | 3.6% | 5.4% |
| 6AFigure 2 footnote c (14,3,8,5,1) | 1.3% | 0.2% | 0.6% | 0.3% | 0.1% |
| 6BFigure 2 footnote c (14,7,4,6,1) | 1.3% | 0.5% | 0.3% | 0.4% | 0.1% |
| 7FFigure 2 footnote c (23,20,15,17,8) | 2.2% | 1.5% | 1.2% | 1.2% | 1.1% |
| 9VFigure 2 footnote c (2,9,12,12,9) | 0.2% | 0.7% | 0.9% | 0.8% | 1.3% |
| 14Figure 2 footnote c (8,14,4,5,1) | 0.8% | 1.0% | 0.3% | 0.3% | 0.1% |
| 18CFigure 2 footnote c (2,1,2,7,1) | 0.2% | 0.1% | 0.2% | 0.5% | 0.1% |
| 19AFigure 2 footnote c (63,58,64,60,30) | 6.0% | 4.3% | 5.0% | 4.1% | 4.2% |
| 19FFigure 2 footnote c (15,35,28,31,16) | 1.4% | 2.6% | 2.2% | 2.1% | 2.2% |
| 23FFigure 2 footnote c (1,1,0,0,0) | 0.1% | 0.1% | 0.0% | 0.0% | 0.0% |
| 22FFigure 2 footnote d (106,135,140,169,74) | 10.1% | 10.1% | 11.0% | 11.5% | 10.3% |
| 33FFigure 2 footnote d (28,36,41,57,21) | 2.7% | 2.7% | 3.2% | 3.9% | 2.9% |
| 8Figure 2 footnote e (55,57,44,58,25) | 5.2% | 4.2% | 3.5% | 3.9% | 3.5% |
| 10AFigure 2 footnote e (16,26,25,32,18) | 1.5% | 1.9% | 2.0% | 2.2% | 2.5% |
| 11AFigure 2 footnote e (44,48,57,47,31) | 4.2% | 3.6% | 4.5% | 3.2% | 4.3% |
| 12FFigure 2 footnote e (27,30,25,28,19) | 2.6% | 2.2% | 2.0% | 1.9% | 2.6% |
| 15B/CFigure 2 footnote e (35,52,41,34,16) | 3.3% | 3.9% | 3.2% | 2.3% | 2.2% |
| 2Figure 2 footnote f (0,1,0,0,0) | 0.0% | 0.1% | 0.0% | 0.0% | 0.0% |
| 9NFigure 2 footnote f (44,91,79,93,54) | 4.2% | 6.8% | 6.2% | 6.3% | 7.5% |
| 17FFigure 2 footnote f (10,17,15,20,11) | 0.9% | 1.3% | 1.2% | 1.4% | 1.5% |
| 20Figure 2 footnote f (22,30,32,36,15) | 2.1% | 2.2% | 2.5% | 2.4% | 2.1% |
| 6C (43,42,31,40,16) | 4.1% | 3.1% | 2.4% | 2.7% | 2.2% |
| 7C (20,20,30,22,14) | 1.9% | 1.5% | 2.4% | 1.5% | 1.9% |
| 13 (2,2,3,4,1) | 0.2% | 0.1% | 0.2% | 0.3% | 0.1% |
| 15A (75,95,77,100,34) | 7.1% | 7.1% | 6.0% | 6.8% | 4.7% |
| 16F (34,43,36,48,30) | 3.2% | 3.2% | 2.8% | 3.3% | 4.2% |
| 21 (0,8,3,3,2) | 0.0% | 0.6% | 0.2% | 0.2% | 0.3% |
| 23A (53,90,49,75,34) | 5.0% | 6.7% | 3.8% | 5.1% | 4.7% |
| 23B (31,46,51,49,21) | 2.9% | 3.4% | 4.0% | 3.3% | 2.9% |
| 24F (12,13,11,7,2) | 1.1% | 1.0% | 0.9% | 0.5% | 0.3% |
| 28A (1,1,3,4,2) | 0.1% | 0.1% | 0.2% | 0.3% | 0.3% |
| 29 (3,2,3,2,1) | 0.3% | 0.1% | 0.2% | 0.1% | 0.1% |
| 31 (20,28,34,25,17) | 1.9% | 2.1% | 2.7% | 1.7% | 2.4% |
| 34 (21,13,14,17,8) | 2.0% | 1.0% | 1.1% | 1.2% | 1.1% |
| 35B (30,45,42,50,27) | 2.8% | 3.4% | 3.3% | 3.4% | 3.8% |
| 35F (28,24,22,31,23) | 2.7% | 1.8% | 1.7% | 2.1% | 3.2% |
| 38 (23,26,20,15,8) | 2.2% | 1.9% | 1.6% | 1.0% | 1.1% |
| NT (0,2,4,5,2) | 0.0% | 0.1% | 0.3% | 0.3% | 0.3% |
| Other (7,6,6,10,11) | 0.7% | 0.4% | 0.5% | 0.7% | 1.5% |
The most common serotypes in children younger than two years of age during 2020 included 19A, 15B/C and 22F, all at 12.2% (n=10), while the most common for children 2–4 years old were serotypes 3 (15.8%, n=6), 10A (13.2%, n=5) and 22F (10.5%, n=4). Serotypes 3 (17.2%, n=5), 8 (13.8%, n=4) and 10A (13.8%, n=4) were the most common in those 5–14 years old. Serotype 4 was the most prevalent serotype in those 15–49 years old (20.8%, n=118) followed by serotypes 8 (11.1%, n=63) and 12F (10.9%, n=62). Serotypes 3 (12.6%, n=83) and 4 (11.4%, n=75) were the most common in those 50–64 years old, while serotypes 3 (10.4%, n=75) and 22F (10.3%, n=74) were dominant in adults over 65 years of age (Figure S10 and Figure S11).
From 2016 to 2020 in children younger than five years of age, significant increases of serotypes 19F (1.5%−5.8%, p=0.04) and 11A (1.5−4.2%, p=0.04) were observed (Figure 2; B). The proportion of serotype 4 isolates increased significantly in adults 15–49 years of age (14.6%−20.8%, p<0.05) (Figure S8) and those 65 years of age and older (2.4%−5.4%, p<0.001) (Figure 2; C). Significant increases of serotype 8 were noted for adults 15–49 years (7.6%−11.1%, p=0.02) and 50–64 years (4.2%−8.6%, p<0.001) (Figure S10 and Figure S11). The 15–49 years of age group saw a significant increase of serotype 12F (6.5%−10.9%, p=0.02), while the 65 years and older age group also demonstrated increases of serotypes 3 (9.1%−10.4%, p=0.007) and 9N (4.2%−7.5%, p=0.02). The PCV13 vaccine serotype 9V increased significantly in all adult age groups (p≤0.01), whereas previously common vaccine serotypes 19A and 7F decreased significantly from 2016 to 2020 in the 50–64 years (7.7%−3.8%, p<0.001) and 65 years and older (2.2%−1.1%, p=0.03) groups, respectively.
Serotypes prevalent in Western Canada during 2020 included 4 (18.2%, n=153), 12F (9.2%, n=77), 3 (8.6%, n=72) and 8 (8.2%, n=69). In Central regions, serotype 3 continued to be the most prevalent (13.0%, n=150), followed by 22F (8.0%, n=92) and 9N (6.8%, n=78). Serotypes 9N (10.6%, n=10) and 22F (10.6%, n=10) were predominant in Eastern Canada. Northern Canada had very few isolates overall, but 63.6% (n=14) were serotype 4 (Figures S12 to S16).
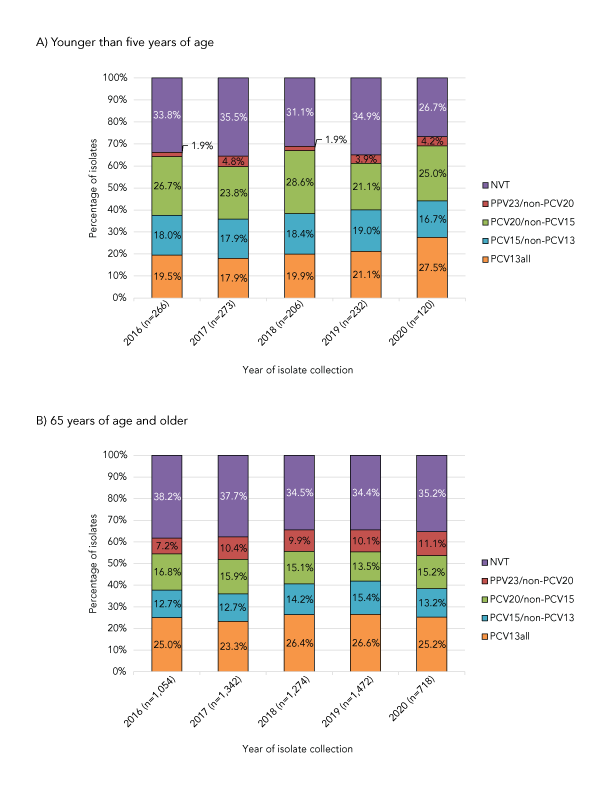
Serotypes belonging to the currently recommended PCV13 formulation have significantly increased in prevalence overall from 2016 to 2020 (30.3%−34.9%, p=0.0034). There were no significant changes in prevalence in child age groups (Figure 3; A). However an increase from 38.7% to 46.9% was observed in the 15–49 years age group (p=0.02). Proportions of PCV15-specific and PCV20-specific serotypes have not significantly changed from 2016 to 2020 among the age groups. The proportion of PPV23 unique serotypes increased in the older than or 65 years age group (7.2%−11.1%, p=0.02) (Figure 3; B) and the number of non-vaccine serotypes (NVTs) overall has decreased from 2016 to 2020 (29.9%−23.6%, p<0.001) (Figures S17 to S21 and Tables S2 to S7).
Figure 3: Invasive Streptococcus pneumoniae serotype trends by vaccine and ageFigure 3 footnote a, 2016–2020
Text description: Figure 3
Figure A: This figure is a stacked bar graph displaying the percentage of Streptococcus pneumoniae isolates collected from each vaccine category (PCV13, PCV15/non-PCV13, PCV20/non-PCV15, PPV23/non-PCV20 and non-vaccine types) for children younger than five years of age, from 2016 to 2020.
Vaccine |
Year of isolate collection | ||||
|---|---|---|---|---|---|
| 2016 (N=266) |
2017 (N=273) |
2018 (N=206) |
2019 (N=232) |
2020 (N=120) |
|
| PCV13all | 19.5% | 17.9% | 19.9% | 21.1% | 27.5% |
| PCV15/non-PCV13 | 18.0% | 17.9% | 18.4% | 19.0% | 16.7% |
| PCV20/non-PCV15 | 26.7% | 23.8% | 28.6% | 21.1% | 25.0% |
| PPV23/non-PCV20 | 1.9% | 4.8% | 1.9% | 3.9% | 4.2% |
| NVT | 33.8% | 35.5% | 31.1% | 34.9% | 26.7% |
Figure B: This figure is a stacked bar graph displaying the percentage of Streptococcus pneumoniae isolates collected from each vaccine category (PCV13, PCV15/non-PCV13, PCV20/non-PCV15, PPV23/non-PCV20 and non-vaccine types) for adults 65 years of age and older, from 2016 to 2020.
Vaccine |
Year of isolate collection | ||||
|---|---|---|---|---|---|
| 2016 (N=1,054) |
2017 (N=1,342) |
2018 (N=1,274) |
2019 (N=1,472) |
2020 (N=718) |
|
| PCV13all | 25.0% | 23.3% | 26.4% | 26.6% | 25.2% |
| PCV15/non-PCV13 | 12.7% | 12.7% | 14.2% | 15.4% | 13.2% |
| PCV20/non-PCV15 | 16.8% | 15.9% | 15.1% | 13.5% | 15.2% |
| PPV23/non-PCV20 | 7.2% | 10.4% | 9.9% | 10.1% | 11.1% |
| NVT | 38.2% | 37.7% | 34.5% | 34.4% | 35.2% |
Antimicrobial susceptibility testing was performed on 1,022 S. pneumoniae isolates collected in 2020 (Table 2, Figure S22). The highest rate of resistance during 2020 was observed for clarithromycin at 23.0% (n=235); a decrease from 25.0% (n=453) reported in 2019, though the decrease from 2016 to 2020 was not statistically significant. Penicillin resistance decreased over the 2016 to 2020 timespan, from 12.2% (n=136) to 9.9% (n=101) (p=0.003). Other antimicrobial resistance rates for 2020 included doxycycline at 11.4% (n=117), trimethoprim-sulfamethoxazole at 11.1% (n=113), clindamycin at 7.0% (n=72) and chloramphenicol at 4.1% (n=42). All isolates were susceptible to linezolid and vancomycin. Resistance rates for specific serotypes in 2020 are listed in Table 3.
Antimicrobial |
Year | |||||||||
|---|---|---|---|---|---|---|---|---|---|---|
| 2016 | 2017 | 2018 | 2019 | 2020 | ||||||
| % | n | % | n | % | n | % | n | % | n | |
| AMC | 0.1% | 1 | 0.4% | 5 | 1.2% | 22 | 0.4% | 7 | 1.4% | 14 |
| PEN | 12.2% | 136 | 15.0% | 169 | 11.2% | 199 | 10.7% | 194 | 9.9% | 101 |
| AXO | 0.4% | 4 | 0.7% | 8 | 0.7% | 13 | 0.2% | 4 | 0.4% | 4 |
| IMI | 0.3% | 3 | 1.3% | 15 | 1.4% | 25 | 0.2% | 4 | 1.2% | 12 |
| MER | 0.7% | 8 | 1.6% | 18 | 2.0% | 36 | 0.9% | 17 | 2.0% | 20 |
| LEV | 0.3% | 3 | 0.4% | 5 | 0.3% | 5 | 0.6% | 10 | 0.1% | 1 |
| CLA | 21.5% | 240 | 25.8% | 291 | 25.9% | 462 | 25.0% | 453 | 23.0% | 235 |
| CLI | 4.2% | 47 | 7.9% | 89 | 6.8% | 122 | 7.3% | 133 | 7.0% | 72 |
| CHL | 1.2% | 13 | 2.0% | 23 | 5.6% | 100 | 3.1% | 57 | 4.1% | 42 |
| DOX | 8.5% | 95 | 10.7% | 121 | 8.5% | 151 | 10.5% | 191 | 11.4% | 117 |
| SXT | 8.8% | 98 | 10.6% | 120 | 7.7% | 137 | 9.5% | 172 | 11.1% | 113 |
| Total tested | – | 1,114 | – | 1,130 | – | 1,784 | – | 1,815 | – | 1,022 |
| Serotype | Percent resistanceTable 3 footnote a | ||||||||||
|---|---|---|---|---|---|---|---|---|---|---|---|
| PEN | AXO | IMI | MER | LEV | CLA | CLI | CHL | DOX | SXT | MDR | |
| 3Table 3 footnote b (n=112) | – | – | – | – | – | 8.9 | 3.6 | 8.9 | 10.7 | 3.6 | 3.6 |
| 4Table 3 footnote b (n=133) | 0.8 | – | – | – | – | 14.3 | 10.5 | 10.5 | 13.5 | 0.75 | 11.3 |
| 6ATable 3 footnote b (n=2) | 100 | – | – | – | – | 100 | – | – | – | – | – |
| 7FTable 3 footnote b (n=24) | – | – | – | – | – | – | – | – | – | – | – |
| 9VTable 3 footnote b (n=7) | 14.3 | – | – | – | – | 14.3 | – | – | 14.3 | 14.3 | 14.3 |
| 14Table 3 footnote b (n=5) | 60.0 | – | 20.0 | 20.0 | – | 100 | 80.0 | 20.0 | 20.0 | 80.0 | 80.0 |
| 18CTable 3 footnote b (n=9) | 11.1 | – | – | – | – | 11.1 | – | – | 11.1 | 11.1 | 11.1 |
| 19ATable 3 footnote b (n=35) | 37.1 | 5.7 | 25.7 | 28.6 | – | 60.0 | 31.4 | – | 34.3 | 34.3 | 34.3 |
| 19FTable 3 footnote b (n=22) | 18.2 | 4.5 | 4.5 | 9.1 | – | 27.3 | 22.7 | – | 27.3 | 13.6 | 27.3 |
| 23FTable 3 footnote b (n=1) | – | – | – | – | – | – | – | – | – | – | – |
| 22FTable 3 footnote c (n=64) | 1.6 | 1.6 | 1.6 | 1.6 | – | 50.0 | 3.1 | 1.6 | 4.7 | 6.3 | 4.7 |
| 33FTable 3 footnote c (n=32) | – | – | – | – | – | 84.4 | 6.3 | – | 9.4 | 71.9 | 6.3 |
| 8Table 3 footnote d (n=85) | 1.2 | – | – | – | – | – | – | – | – | 1.2 | – |
| 10ATable 3 footnote d (n=22) | – | – | – | – | – | 22.7 | – | – | – | – | – |
| 11ATable 3 footnote d (n=33) | 6.1 | – | – | – | – | 39.4 | 3.0 | – | 3.0 | 9.1 | 3.0 |
| 12FTable 3 footnote d (n=54) | 1.9 | – | – | – | – | 51.9 | 1.9 | 25.9 | 35.2 | 35.2 | 25.9 |
| 15B/CTable 3 footnote d,Table 3 footnote e (n=27) | 3.7 | – | – | – | – | 14.8 | – | – | 3.7 | 3.7 | – |
| 9NTable 3 footnote f (n=71) | 2.8 | – | – | – | – | 2.8 | 1.4 | – | 4.2 | 2.8 | 2.8 |
| 17FTable 3 footnote f (n=10) | – | – | – | – | – | – | – | – | – | – | – |
| 20Table 3 footnote f (n=45) | – | – | – | – | – | 4.4 | 2.2 | – | 6.7 | 6.7 | 2.2 |
| 6C (n=16) | 12.5 | – | – | – | – | 25.0 | – | – | – | 18.8 | – |
| 7C (n=14) | 7.1 | – | – | – | – | – | – | 7.1 | 7.1 | 57.1 | 7.1 |
| 9A (n=2) | – | – | – | – | – | – | – | – | – | – | – |
| 9L (n=1) | – | – | – | – | – | – | – | – | – | – | – |
| 10B (n=1) | – | – | – | – | – | – | – | – | – | – | – |
| 13 (n=3) | – | – | – | – | – | 100 | 33.3 | – | 66.7 | 66.7 | 66.7 |
| 15A (n=27) | 74.1 | – | – | 3.7 | – | 77.8 | 66.7 | – | 77.8 | 3.7 | 66.7 |
| 16F (n=25) | – | – | – | – | – | – | – | – | – | – | – |
| 21 (n=2) | – | – | – | – | – | – | – | – | – | – | – |
| 23A (n=28) | 42.9 | – | – | – | – | 32.1 | 17.9 | – | 17.9 | 3.6 | 14.3 |
| 23B (n=21) | 57.1 | – | – | – | – | – | – | – | – | 14.3 | – |
| 24F (n=1) | – | – | – | – | – | – | – | – | – | 100 | – |
| 28A (n=4) | – | – | – | – | – | – | – | 25.0 | 25.0 | – | – |
| 29 (n=1) | – | – | – | – | – | – | – | – | – | – | – |
| 31 (n=19) | 5.3 | – | – | – | – | 10.5 | 5.3 | – | – | – | – |
| 34 (n=12) | – | – | – | – | – | 8.3 | 8.3 | – | 8.3 | 41.7 | 8.3 |
| 35B (n=28) | 64.3 | – | – | 17.9 | 3.6 | 53.6 | – | – | 3.6 | 17.9 | 14.3 |
| 35D (n=2) | 50 | – | – | – | – | 50 | – | – | – | 50 | – |
| 35F (n=15) | – | – | – | – | – | – | – | – | – | – | – |
| 38 (n=5) | – | – | – | – | – | – | – | – | – | – | – |
| 45 (n=1) | 100 | – | – | – | – | 100 | – | – | 100 | 100 | 100 |
| NT (n=1) | – | – | – | – | – | – | – | – | – | – | – |
| All (n=1,022) | 9.9 | 0.4 | 1.2 | 2.0 | 0.1 | 23.0 | 7.0 | 4.1 | 11.4 | 11.1 | 9.5 |
Multidrug resistant IPD increased from 4.2% (n=47) of the isolates tested in 2016 to 9.5% (n=97) in 2020 (p<0.001) (Figure 4, Table S8). Of the serotypes where 10 or more isolates were collected in 2020, the highest rates of MDR were identified in 15A (66.7%, n=18), 19A (34.3%, n=12), 19F (27.3%, n=6) and 12F (25.9%, n=14) (Table 3, Figure S23). The most common MDR pattern for serotypes 15A and 19F was macrolide-clindamycin-tetracycline (n=16 and n=13, respectively). Multidrug resistant serotype 19A isolates were most commonly resistant to five antimicrobial classes (β-lactam, macrolide, clindamycin, tetracycline and trimethoprim/sulfamethoxazole; n=9), while the most common MDR pattern for serotype 12F was tetracycline-trimethoprim/sulfamethoxazole-chloramphenicol (n=13) (Table S9).
Figure 4: Annual trend of multidrug resistance of invasive Streptococcus pneumoniae, 2016–2020
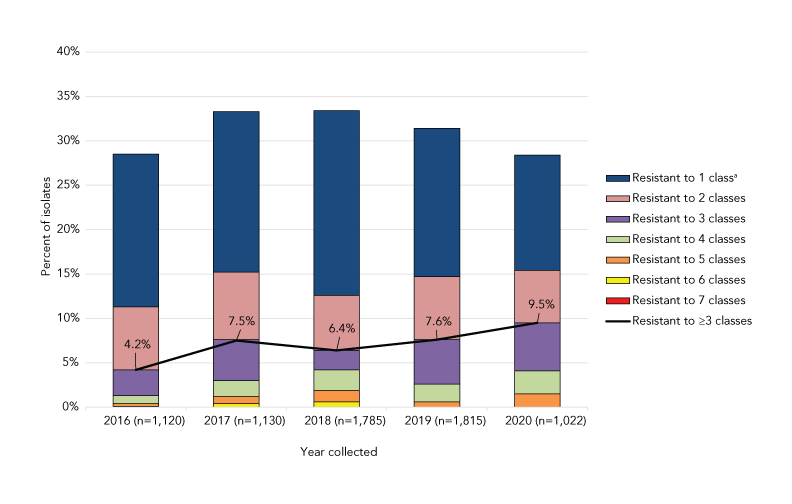
Text description: Figure 4
This figure is a combination line and stacked bar graph. The bars depict the percentage of Streptococcus pneumoniae isolates collected from 2016 to 2020 that are resistant to between one and seven classes of antimicrobials. The line depicts the rate of multidrug resistant Streptococcus pneumoniae from 2016 to 2020.
| Year collected | Resistant to ≥3 classes | Resistant to 7 classes | Resistant to 6 classes | Resistant to 5 classes | Resistant to 4 classes | Resistant to 3 classes | Resistant to 2 classes | Resistant to 1 classFigure 4 footnote a |
|---|---|---|---|---|---|---|---|---|
| 2016 (n=1,120) |
4.2% | 0.0% | 0.1% | 0.3% | 0.9% | 2.9% | 7.1% | 17.2% |
| 2017 (n=1,130) |
7.5% | 0.0% | 0.4% | 0.8% | 1.8% | 4.6% | 7.6% | 18.1% |
| 2018 (n=1,785) |
6.4% | 0.0% | 0.6% | 1.3% | 2.3% | 2.2% | 6.2% | 20.8% |
| 2019 (n=1,815) |
7.6% | 0.0% | 0.0% | 0.6% | 2.0% | 5.0% | 7.1% | 16.7% |
| 2020 (n=1,022) |
9.5% | 0.0% | 0.0% | 1.5% | 2.6% | 5.4% | 5.9% | 13.0% |
Discussion
In 2020, the national incidence rate of IPD in Canada was 5.9 cases per 100,000 population; this was a dramatic decrease in the incidence of IPD in comparison with previous years. After the first case of coronavirus disease 2019 (COVID-19) was recorded in Canada in late January 2020, the first national intervention strategies to prevent the spread of the virus were announced in March/April 2020, including border closures, isolation requirements, masking and work-from-home recommendations. Closures of schools, non-essential businesses and recreational activities followed at the discretion of provincial and territorial governmentsFootnote 20. Like severe acute respiratory syndrome coronavirus 2 (SARS-CoV-2), S. pneumoniae is transmitted via respiratory droplets; the same measures put in place to prevent the spread of COVID-19 likely also prevented significant transmission of S. pneumoniae, possibly accounting for the reduction of IPD cases. The Invasive Respiratory Infection Surveillance Initiative studied the incidence of respiratory-transmitted pathogens associated with invasive disease in the early months of the COVID-19 pandemic; 26 countries submitted data for IPDFootnote 21. The study noted that there was a marked decrease in IPD among all participating countries due to containment measures, though the stringency of said measures varied by country. The Invasive Respiratory Infection Surveillance Initiative also estimated that social changes caused by the pandemic resulted in an initial 38% decrease in the incidence of IPD, followed by an additional 13% average weekly reduction up to the end of May 2020 when the study concludedFootnote 21. Canada has gone through periods of both increased mobility and restrictive containment measures due to the various pandemic waves; therefore, it is expected that decreased IPD incidence will continue in the near future.
The PCV13 serotypes 3 and 4 continued to be significant sources of IPD in Canada during 2020. Serotype 3 was the second most common serotype collected in 2020 and continued to be a substantial cause of IPD in all age groups. Studies have noted poor immunogenicity of PCV13 against serotype 3, possibly due to the abundant capsule polysaccharide produced during growth that ultimately overwhelms any PCV13-generated protective responseFootnote 22Footnote 23. Early immunogenicity studies of the PCV15 formulation have noted a superior immune response to serotype 3 in comparison to PCV13, though it is currently unclear if this will translate to increased clinical effectivenessFootnote 24. Some real-world effectiveness data should be available in the near future; as of late 2021, the United States Advisory Committee on Immunization Practices now recommends using PCV15 (or PCV20) in PCV-naive adults 65 years or older, or older than 18 years with certain underlying conditionsFootnote 25. If PCV15 is administered, the Advisory Committee on Immunization Practices recommends that it be followed by PPSV23Footnote 25.
PCV13 serotype 4 overtook serotype 3 as the most predominant IPD serotype in 2020. Serotype 4 has been associated with IPD outbreaks in vulnerable groups of adults and is regionally biased in Western regions of Canada. A study of serotype 4 associated with shipyard outbreaks in Northern Europe found an emergent sequence type (ST801) to be responsible for disease across different countries, though there was significant diversityFootnote 26. Another study of serotype 4 in Alberta, Canada observed that this serotype was overrepresented in adults experiencing homelessness and those using illicit drugs. This study also noted genetic diversity within serotype 4, including an emergent sequence type (ST244) associated with the outbreakFootnote 27. Similarly, ST244 was found to be responsible for outbreaks of serotype 4 IPD in adults experiencing homelessness in the United StatesFootnote 28. Few serotype 4 isolates were identified in paediatric age groups (n=2) in 2020, where there is also wide uptake of PCV13Footnote 29. According to the 2019 childhood National Immunization Coverage Survey, uptake for pneumococcal conjugate vaccines was 84.4% among those younger than two years of ageFootnote 29.
Despite the COVID-19 pandemic topping the list of health crises in 2020, antimicrobial resistant pathogens still remain an imminent threat and a significant source of morbidity and mortality worldwide. In general, our surveillance of IPD isolates collected in 2020 noted relatively low rates of antimicrobial resistance. The only resistance rate of concern was that for clarithromycin (23.0%), which has been relatively stable since 2016. Of note is the decrease in penicillin resistance during the same period, which can be speculatively attributed to the PCV13-driven decrease in the overall prevalence of high penicillin-resistant and MDR serotype 19A, a finding observed in other countries such as PortugalFootnote 30. In contrast, serotype 19F has been included in all PCV formulations to date. However it has been increasing in prevalence in children younger than five years of age since 2016 (5.8% of isolates in 2020). This will be crucial to monitor going forward, as a steady increase of a common MDR serotype could have a significant impact on patient outcomes in the future.
Strengths and limitations
Caution should be exercised when interpreting the data presented in this report. Only a subset of laboratory isolates from each province may have been submitted for testing; therefore, this report does not reflect the true incidence or rates of disease in Canada. The representativeness of the proportions of isolates submitted to the NML for testing as compared to information submitted to CNDSS are presented in Table S10. Not all provinces and territories report line list data to CNDSS; therefore, only aggregated data were available at the national level. For this reason, CNDSS and NML laboratory data are presented differently in terms of age grouping. Age groups are consistent with literature and current immunization recommendations.
Conclusion
Although the incidence of IPD in Canada decreased significantly in 2020, likely in part due to the intervention strategies used to contain the SARS-CoV-2 virus, several PCV13 vaccine serotypes have increased in prevalence: serotypes 3 and 4 in adult age groups, and 19F in children younger than five years of age. Continued surveillance of IPD serotypes and antimicrobial resistance in Canada is important to monitor existing trends, identify new trends, and assess the effect of the COVID-19 pandemic on the pneumococcal serotype distribution in Canada.
Authors’ statement
- ARG — Formal analysis, data curation, visualization, writing–original draft, review and editing of final version
- AG — Formal analysis, validation, investigation, data curation, visualization, writing–review and editing
- WHBD — Formal analysis, validation, investigation, data curation, visualization, writing–review and editing
- BL — Resources, methodology, writing–review and editing
- AM — Resources, methodology, writing–review and editing
- GJT — Resources, methodology, writing–review and editing
- GGZ — Resources, methodology, writing–review and editing
- JVK — Resources, methodology, writing–review and editing
- LH — Resources, methodology, writing–review and editing
- JM — Resources, methodology, writing–review and editing
- PVC — Resources, methodology, writing–review and editing
- HS — Resources, methodology, writing–review and editing
- DH — Resources, methodology, writing–review and editing
- GZ — Resources, methodology, writing–review and editing
- KM — Resources, methodology, writing–review and editing
- LS — Resources, methodology, writing–review and editing
- LS — Resources, methodology, writing–review and editing
- AYL — Writing–review and editing
- MRM — Methodology, writing–review and editing
- IM — Conceptualization, validation, methodology, supervision, project administration, writing–review and editing
Competing interests
None.
Acknowledgements
We thank A Yuen, R Mallari, and G Severini from the Streptococcus and STI Unit at NML for their laboratory technical assistance, and the staff of provincial and public health laboratories in Canada for participating in the national laboratory surveillance program.
Funding
This project was supported by internal funding from the Public Health Agency of Canada.
Supplementary material
These documents can be accessed on the Supplemental material file.
Table S1: Annual incidence of invasive pneumococcal disease cases per 100,000 population in Canada by age group, 2010–2020
Figure S1: Clinical isolation site of invasive Streptococcus pneumoniae isolates collected in 2020, by age
Figure S2: Percentage of invasive Streptococcus pneumoniae isolates from blood in 2020, by serotype
Figure S3: Percentage of invasive Streptococcus pneumoniae isolates from cerebrospinal fluid in 2020, by serotype
Figure S4: Percentage of invasive Streptococcus pneumoniae isolates from other sterile sites in 2020, by serotype
Figure S5: Prevalence of invasive Streptococcus pneumoniae serotypes in those younger than two years old, 2016–2020
Figure S6: Prevalence of invasive Streptococcus pneumoniae serotypes in those 2–4 years old, 2016–2020
Figure S7: Prevalence of invasive Streptococcus pneumoniae serotypes in those 5–14 years old, 2016–2020
Figure S8: Prevalence of invasive Streptococcus pneumoniae serotypes in those 15–49 years old, 2016–2020
Figure S9: Prevalence of invasive Streptococcus pneumoniae serotypes in those 50–64 years old, 2016–2020
Figure S10: Prevalence of invasive Streptococcus pneumoniae serotypes isolated in 2020 for those younger than two, 2–4 and 5–14 years old
Figure S11: Prevalence of invasive Streptococcus pneumoniae serotypes isolated in 2020 for those 15–49 and 50–64 years and 65 years and older
Figure S12: Number of invasive Streptococcus pneumoniae isolates collected in 2020, by region and serotype
Figure S13: Prevalence of the ten most common invasive Streptococcus pneumoniae serotypes collected from Western Canada in 2020
Figure S14: Prevalence of the ten most common invasive Streptococcus pneumoniae serotypes collected from Central Canada in 2020
Figure S15: Prevalence of the ten most common invasive Streptococcus pneumoniae serotypes collected from Eastern Canada in 2020
Figure S16: Prevalence of invasive Streptococcus pneumoniae serotypes collected from Northern Canada, 2020
Figure S17: Proportion of invasive pneumococcal disease isolates by vaccine for those younger than two years old, 2016–2020
Figure S18: Proportion of invasive pneumococcal disease isolates by vaccine for those 2–4 years old, 2016–2020
Figure S19: Proportion of invasive pneumococcal disease isolates by vaccine for those 5–14 years old, 2016–2020
Figure S20: Proportion of invasive pneumococcal disease isolates by vaccine for those 15–49 years old, 2016–2020
Figure S21: Proportion of invasive pneumococcal disease isolates by vaccine for those 50–64 years old, 2016–2020
Table S2: Proportion of vaccine serotypes for those younger than two years old, 2016–2020
Table S3: Proportion of vaccine serotypes for those 2–4 years old, 2016–2020
Table S4: Proportion of vaccine serotypes for those 5–14 years old, 2016–2020
Table S5: Proportion of vaccine serotypes for those 15–49 years old, 2016–2020
Table S6: Proportion of vaccine serotypes for those 50–64 years old, 2016–2020
Table S7: Proportion of vaccine serotypes for those 65 years and older, 2016–2020
Figure S22: Antimicrobial resistance trends of invasive Streptococcus pneumoniae isolates, 2016–2020
Figure S23: Invasive Streptococcus pneumoniae serotypes by resistance to different antimicrobial classes, 2020
Table S8: Multidrug resistance of invasive Streptococcus pneumoniae isolates, 2016–2020
Table S9: Multidrug resistance profiles of invasive Streptococcus pneumoniae serotypes in 2020
Table S10: Number of invasive Streptococcus pneumoniae isolates serotyped by the National Microbiology Laboratory (NML) in comparison to the total number of cases reported to Canadian Notifiable Diseases Surveillance System (CNDSS), 2020
