
Influenza case definitions for use in real-world research

 Download this article as a PDF
Published by: The Public Health Agency of Canada
Issue: Volume 48-9, September 2022: Invasive Diseases Surveillance in Canada
Date published: September 2022
ISSN: 1481-8531
Submit a manuscript
About CCDR
Browse
Volume 48-9, September 2022: Invasive Diseases Surveillance in Canada
Rapid Communication
Evaluation of influenza case definitions for use in real-world evidence research
Pamela Doyon-Plourde1,2, Élise Fortin1,3, Caroline Quach1,2,4,5
Affiliations
1 Department of Microbiology, Infectious Diseases, and Immunology, Faculty of Medicine, University of Montréal, Montréal, QC
2 Research Institute–CHU Sainte-Justine, Montréal, QC
3 Institut national de santé publique du Québec, Montréal, QC
4 Clinical Department of Laboratory Medicine, CHU Sainte-Justine, Montréal, QC
5 Infection Prevention & Control, CHU Sainte-Justine, Montréal, QC
Correspondence
Suggested citation
Doyon-Plourde P, Fortin É, Quach C. Evaluation of influenza case definitions for use in real-world evidence research. Can Commun Dis Rep 2022;48(9):392–5. https://doi.org/10.14745/ccdr.v48i09a03
Keywords: influenza, influenza-like-illness, laboratory-confirmed influenza, real-world data, surveillance
Abstract
Background: Laboratory confirmation of influenza is not routinely done in practice. With the advent of big data, it is tempting to use healthcare administrative databases for influenza vaccine effectiveness studies, which often rely on clinical diagnosis codes. The objective of this article is to compare influenza incidence curves using international case definitions derived from clinical diagnostic codes with influenza surveillance data from the United States (US) Centers for Disease Control and Prevention (CDC).
Methods: This case series describes influenza incidence by CDC week, defined using International Classification of Disease diagnostic codes over four influenza seasons (2015–2016 to 2018–2019) in a cohort of US individuals three years of age and older who consulted at least once per year between 2015 and 2019. Results were compared to the number of influenza-positive specimens or outpatient visits for influenza-like illness obtained from the CDC flu surveillance data.
Results: The incidence curves of influenza-related medical encounters were very similar to the CDC’s surveillance data for laboratory-confirmed influenza. Conversely, the number of influenza-like illness encounters was high when influenza viruses started to circulate, leading to a discrepancy with CDC-reported data.
Conclusion: A specific case definition should be prioritized when data for laboratory-confirmed influenza are not available, as a broader case definition would conservatively bias influenza vaccine effectiveness toward the null.
Introduction
Although a vaccine-preventable disease, influenza causes annually approximately three to five million cases of severe illness and 290,000 to 650,000 deaths worldwideFootnote 1. Due to the high mutation rate of influenza viruses, vaccine formulations are updated annually, requiring constant surveillance of influenza worldwide. Influenza vaccine effectiveness (IVE) has been studied extensively, producing estimates that vary widely. This can be explained by several factors, including study design and influenza case definitionFootnote 2.
Evaluation of IVE is commonly conducted using a test-negative design that compares vaccination rates in individuals with a positive test for laboratory-confirmed influenza (LCI) to those with a negative test. This is considered the gold standard for IVE study, but requires proper recruitment into a cohort, which is resource intensive. It may thus be tempting, with the advent of big data, to use healthcare administrative databases for IVE studies. As laboratory confirmation of influenza-like illness (ILI) is not routinely done, one must rely on clinical diagnosis codes as an alternate case definition for real-world evidence research on influenza.
Over the years, several influenza case definitions have been proposed with varying levels of sensitivity and specificityFootnote 3. The choice of case definitions depends on several factors such as data sources, study population and the purpose of the surveillance: high sensitivity may be suitable for early detection of disease outbreak whereas higher specificity may be required for vaccine effectiveness studies. International Classification of Diseases (ICD) diagnostic codes specific to influenza are easily retrieved from electronic medical records (EMR); however, EMR data must be able to accurately and comprehensively capture cases, especially when clinical diagnostic codes are used for identification of influenza.
The study aims to determine if alternate influenza case definitions correlate with standard case definitions used for surveillance, by comparing influenza incidence curves using case definitions derived from clinical diagnostic codes to the United States (US) Centers for Disease Control and Prevention (CDC) flu surveillance data.
Methods
This case series describes influenza incidence by CDC week, defined using ICD diagnostic codes, over four influenza seasons (from 2015–2016 to 2018–2019) in a cohort of US individuals three years of age and older who consulted at least once per year between 2015 and 2019. Study data were derived from an integrated dataset including linked primary care EMRs from Veradigm Health Insights database, supplemented with pharmacy and medical claims data from Komodo Health Inc., New York, New York. Data sources and linkage processes have been described previouslyFootnote 4.
We used the case definitions developed by the US Armed Forces Health Surveillance Center (AFHSC) for specific and sensitive surveillance of influenzaFootnote 5. The primary outcome was a record of influenza-related medical encounter in a hospital or primary care setting, defined by ICD codes specific to influenza (AFHSC code set B)Footnote 5. As the AFHSC code set B definition was developed for specific influenza surveillance, results were compared to the number of influenza-positive specimens from the CDC flu surveillance dataFootnote 5Footnote 6. The secondary outcome was an ILI encounter using a sensitive case definition (AFHSC code set A)Footnote 5. Results were compared to the number of outpatient visits for ILI from the CDC flu surveillance data as AFHSC code set A was developed to identify ILI casesFootnote 5Footnote 6. The incidence date was the date of the first encounter meeting the outcome definition during the influenza seasons (from CDC week 40 to CDC week 20 of the following year). A qualitative analysis of incidence curves was conducted to assess if alternate influenza case definitions derived from clinical diagnostic codes correlated with standard influenza case definitions used by the CDC long-established nationally representative surveillance systemFootnote 7.
Results
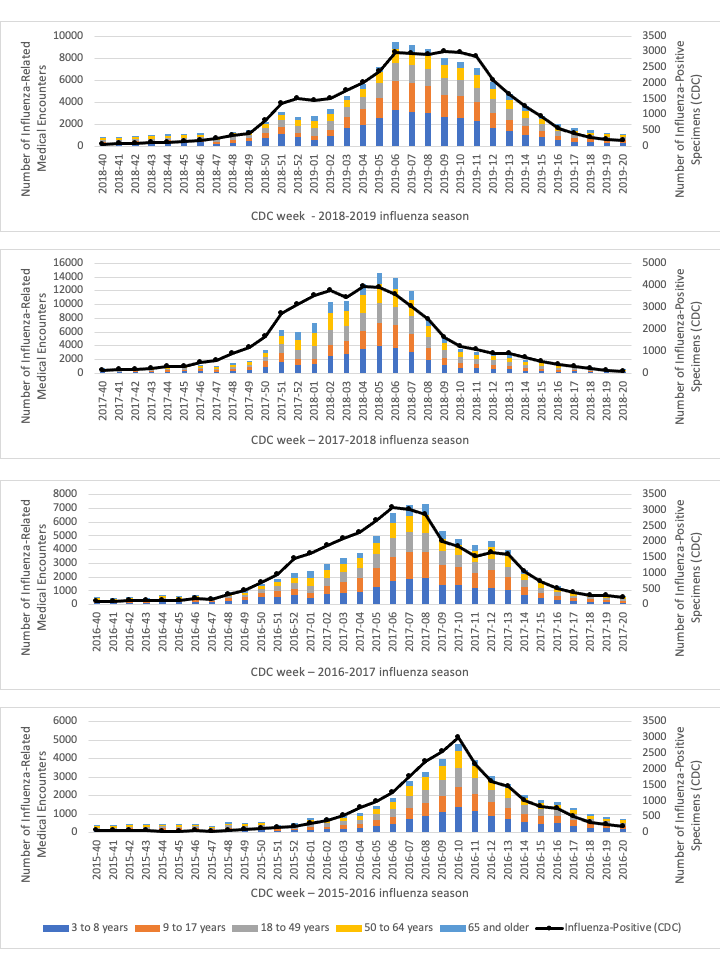
Incidence curves of influenza-related medical encounters derived from ICD codes specific to influenza, using AFHSC code set B, compared to the incidence of influenza-positive specimens reported by the CDC flu surveillance data over four influenza seasons are shown in Figure 1. Incidence curves of influenza-related medical encounters were very similar to the CDC’s surveillance data for LCI over the four influenza seasons. At the beginning of each season, numbers of influenza-related medical encounters were low and gradually increased, reaching a peak between CDC weeks 05 and 10, as seen with the CDC’s surveillance data. Levels then decreased for the remainder of each season, following a pattern similar to the number of influenza-positive specimens.
Figure 1: Distribution of influenza-related medical encountersFigure 1 footnote a in the study cohort by age groups overlapped with the incidence of influenza-positive specimens reported by public health laboratories over four influenza seasonsFigure 1 footnote b
Text description: Figure 1
| CDC week | Influenza season | |||||||
|---|---|---|---|---|---|---|---|---|
| 2018–2019 | 2017–2018 | 2016–2017 | 2015–2016 | |||||
| Influenza-related medical encounters | Influenza-positive specimens (CDC) | Influenza-related medical encounters | Influenza-positive specimens (CDC) | Influenza-related medical encounters | Influenza-positive specimens (CDC) | Influenza-related medical encounters | Influenza-positive specimens (CDC) | |
| 40 | 871 | 66 | 667 | 144 | 543 | 100 | 371 | 79 |
| 41 | 859 | 81 | 655 | 164 | 485 | 101 | 389 | 58 |
| 42 | 950 | 93 | 699 | 175 | 543 | 138 | 450 | 66 |
| 43 | 982 | 122 | 758 | 229 | 447 | 147 | 440 | 56 |
| 44 | 1,089 | 110 | 924 | 301 | 727 | 142 | 453 | 44 |
| 45 | 1,131 | 158 | 1,030 | 336 | 625 | 148 | 438 | 51 |
| 46 | 1,155 | 174 | 1,196 | 509 | 734 | 195 | 476 | 64 |
| 47 | 837 | 247 | 999 | 567 | 556 | 177 | 321 | 50 |
| 48 | 1,321 | 354 | 1,479 | 915 | 939 | 314 | 551 | 80 |
| 49 | 1,456 | 416 | 1,859 | 1,177 | 990 | 446 | 525 | 96 |
| 50 | 2,153 | 801 | 3,344 | 1,691 | 1,501 | 719 | 556 | 129 |
| 51 | 3,126 | 1,354 | 6,314 | 2,722 | 1,861 | 977 | 421 | 147 |
| 52 | 2,606 | 1,531 | 5,959 | 3,120 | 2,291 | 1,461 | 530 | 209 |
| 01 | 2,774 | 1,467 | 7,299 | 3,522 | 2,438 | 1,642 | 809 | 286 |
| 02 | 3,403 | 1,510 | 10,339 | 3,747 | 2,938 | 1,871 | 787 | 396 |
| 03 | 4,586 | 1,755 | 10,490 | 3,461 | 3,377 | 2,093 | 883 | 530 |
| 04 | 5,616 | 2,020 | 12,980 | 3,929 | 3,755 | 2,306 | 1,038 | 781 |
| 05 | 7,238 | 2,380 | 14,632 | 3,886 | 5,002 | 2,691 | 1,459 | 997 |
| 06 | 9,479 | 2,992 | 13,906 | 3,597 | 6,644 | 3,090 | 1,858 | 1,260 |
| 07 | 9,220 | 2,933 | 12,020 | 3,027 | 7,223 | 3,016 | 2,785 | 1,788 |
| 08 | 8,788 | 2,928 | 7,834 | 2,429 | 7,289 | 2,864 | 3,294 | 2,264 |
| 09 | 8,052 | 3,007 | 5,094 | 1,629 | 5,325 | 1,998 | 3,973 | 2,554 |
| 10 | 7,649 | 2,977 | 3,566 | 1,218 | 4,812 | 1,841 | 4,826 | 3,019 |
| 11 | 7,126 | 2,849 | 3,147 | 1,083 | 4,348 | 1,538 | 3,925 | 2,153 |
| 12 | 5,789 | 2,085 | 2,928 | 913 | 4,616 | 1,659 | 3,060 | 1,620 |
| 13 | 4,728 | 1,653 | 2,631 | 905 | 3,954 | 1,586 | 2,659 | 1,445 |
| 14 | 3,640 | 1,273 | 1,939 | 731 | 2,537 | 1,070 | 2,046 | 1,030 |
| 15 | 2,768 | 948 | 1,701 | 545 | 1,755 | 738 | 1,771 | 824 |
| 16 | 1,977 | 547 | 1,326 | 394 | 1,329 | 515 | 1,640 | 761 |
| 17 | 1,611 | 404 | 1,131 | 302 | 959 | 400 | 1,321 | 519 |
| 18 | 1,439 | 262 | 876 | 232 | 803 | 281 | 985 | 328 |
| 19 | 1,217 | 216 | 610 | 113 | 708 | 280 | 852 | 246 |
| 20 | 1,149 | 168 | 625 | 69 | 644 | 234 | 738 | 201 |
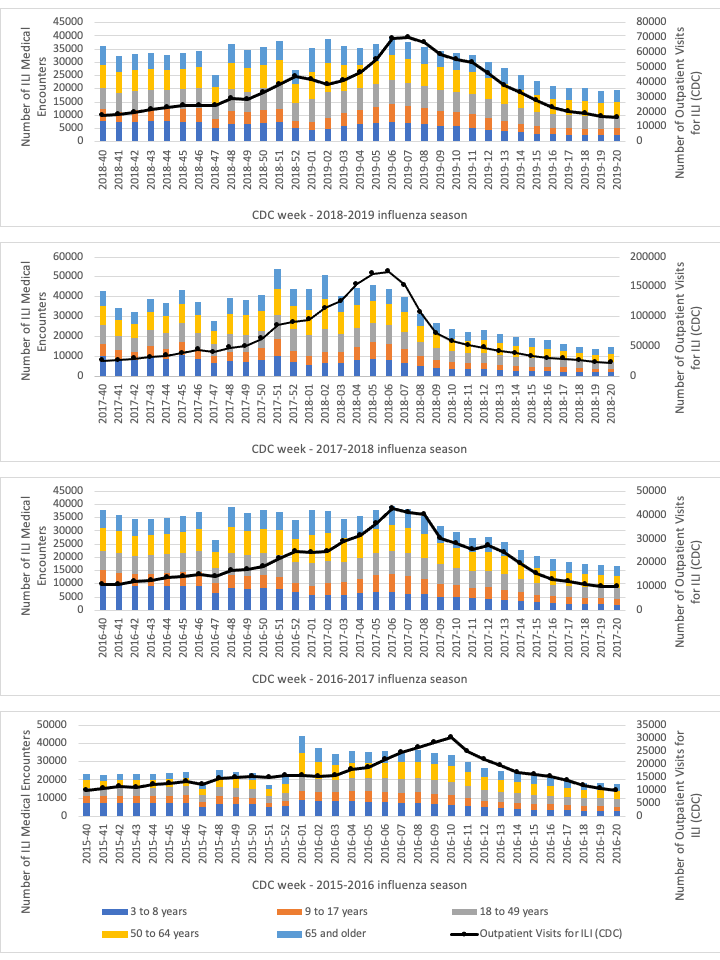
Incidence curves of ILI medical encounters derived from AFHSC code set A case definition for sensitive surveillance, compared to the incidence of outpatient visits for ILI reported by the CDC are shown in Figure 2. Incidence curves for ILI encounters did not follow the same pattern as ILI outpatient visits at the national level. Numbers of ILI medical encounters started and remained high over the first half of the season. Conversely, national levels gradually increased until a peak around CDC weeks 05 and 10 is observed, as for LCI reported by the CDC flu surveillance data. Afterward, both curves decreased for the remainder of each season.
Figure 2: Distribution of influenza-like illness medical encountersFigure 2 footnote a in the study cohort by age groups overlapped with the national incidence of outpatient visits for influenza-like illness reported by sentinel providers over four influenza seasonsFigure 2 footnote b
Text description: Figure 2
| CDC week | Influenza season | |||||||
|---|---|---|---|---|---|---|---|---|
| 2018–2019 | 2017–2018 | 2016–2017 | 2015–2016 | |||||
| ILI medical encounters | Outpatient visits for ILI (CDC) | ILI medical encounters | Outpatient visits for ILI (CDC) | ILI medical encounters | Outpatient visits for ILI (CDC) | ILI medical encounters | Outpatient visits for ILI (CDC) | |
| 40 | 36,305 | 17,975 | 42,876 | 25,678 | 37,865 | 10,864 | 23,214 | 10,049 |
| 41 | 32,448 | 18,652 | 34,382 | 26,534 | 36,137 | 10,997 | 22,782 | 10,715 |
| 42 | 33,347 | 19,948 | 32,499 | 28,638 | 34,365 | 11,926 | 23,042 | 11,584 |
| 43 | 33,513 | 21,634 | 38,629 | 31,664 | 34,494 | 12,648 | 23,087 | 11,164 |
| 44 | 32,825 | 23,169 | 37,006 | 34,138 | 34,812 | 13,790 | 23,426 | 12,423 |
| 45 | 33,627 | 24,085 | 43,276 | 38,114 | 35,533 | 14,258 | 23,651 | 12,676 |
| 46 | 34,321 | 24,419 | 37,220 | 43,784 | 37,160 | 15,160 | 24,616 | 13,484 |
| 47 | 25,330 | 24,635 | 27,740 | 39,632 | 26,751 | 14,208 | 17,475 | 12,158 |
| 48 | 36,956 | 29,096 | 39,492 | 47,504 | 38,955 | 16,605 | 25,475 | 14,617 |
| 49 | 34,876 | 28,377 | 38,210 | 49,910 | 36,947 | 16,961 | 24,661 | 14,986 |
| 50 | 35,784 | 33,113 | 40,632 | 63,004 | 37,919 | 18,463 | 24,032 | 15,396 |
| 51 | 38,269 | 38,260 | 53,873 | 85,564 | 37,307 | 21,565 | 17,389 | 14,839 |
| 52 | 27,169 | 44,012 | 43,946 | 90,510 | 34,152 | 24,900 | 22,716 | 15,679 |
| 01 | 35,430 | 42,135 | 43,903 | 94,538 | 38,091 | 24,178 | 44,283 | 15,654 |
| 02 | 38,801 | 38,815 | 50,931 | 113,522 | 37,603 | 24,897 | 37,398 | 15,517 |
| 03 | 36,197 | 41,199 | 40,372 | 126,072 | 34,632 | 28,781 | 34,336 | 15,661 |
| 04 | 35,537 | 46,241 | 44,456 | 154,652 | 35,772 | 31,265 | 35,956 | 18,143 |
| 05 | 37,104 | 55,264 | 45,859 | 171,970 | 37,864 | 36,517 | 35,642 | 18,944 |
| 06 | 39,529 | 69,732 | 43,788 | 175,650 | 39,360 | 42,890 | 35,778 | 21,774 |
| 07 | 37,703 | 70,056 | 39,609 | 152,420 | 38,404 | 41,035 | 36,024 | 24,681 |
| 08 | 35,868 | 66,461 | 31,164 | 106,050 | 35,721 | 40,124 | 36,798 | 26,423 |
| 09 | 34,482 | 58,802 | 26,833 | 72,128 | 31,886 | 30,183 | 34,980 | 28,468 |
| 10 | 33,382 | 55,431 | 23,586 | 58,266 | 29,440 | 28,060 | 34,042 | 30,481 |
| 11 | 32,798 | 53,177 | 22,266 | 51,876 | 27,461 | 25,484 | 30,114 | 24894 |
| 12 | 30,289 | 45,668 | 23,045 | 47,610 | 27,668 | 27,354 | 26,650 | 21,940 |
| 13 | 27,762 | 37,948 | 21,107 | 41,386 | 25,678 | 24,342 | 25,081 | 19,603 |
| 14 | 25,238 | 32,941 | 19,908 | 38,148 | 22,909 | 19,677 | 23,713 | 16,769 |
| 15 | 22,889 | 27,854 | 19,010 | 33,328 | 20,575 | 15,548 | 22,248 | 16,261 |
| 16 | 20,944 | 23,147 | 17,947 | 29,738 | 19,514 | 13,006 | 20,949 | 15,437 |
| 17 | 20,491 | 20,610 | 16,359 | 29,104 | 18,354 | 11,924 | 19,777 | 13,836 |
| 18 | 20,160 | 18,864 | 14,826 | 26,582 | 17,526 | 10,762 | 18,445 | 11,870 |
| 19 | 19,343 | 17,107 | 13,688 | 23,238 | 17,145 | 10,202 | 18,489 | 10,707 |
| 20 | 19,589 | 16,459 | 14,481 | 22,132 | 16,837 | 9,809 | 18,003 | 9,798 |
Discussion
We found that incidence curves of the CDC-reported LCI and influenza-related medical encounters obtained from EMRs overlapped well over the four influenza seasons studied (Figure 1); therefore, the AFHSC definition for specific influenza surveillance is a good proxy for LCI, when only clinical diagnostic codes are available to identify influenza-related medical encounters. In contrast, the number of ILI encounters was high when influenza viruses started to circulate, leading to a discrepancy with CDC-reported data for both LCI and outpatient visits for ILI. The case definition for ILI from the AFHSC was broad, and included ICD codes for fever, cough, otitis media, acute nasopharyngitis, acute sinusitis and pneumonia, thus including cases not related to influenza. Conversely, the CDC ILI definition was limited to fever and cough and/or sore throat without a known cause other than influenzaFootnote 7.
Other studies have investigated the use of clinical diagnostic codes for the identification of influenza casesFootnote 3Footnote 8. A multicenter validation study found that influenza-specific ICD codes were highly specific to the identification of LCI in children admitted to tertiary care pediatric facilities with 73% of LCI cases being identified by discharge diagnostic code specific to influenzaFootnote 8. Another validation study found that AFHSC code set B that only used codes with greater than 75% positivity for influenza led to very high specificity (96%) but moderate sensitivity (62%) in identifying LCIFootnote 3. Moreover, studies have shown that physicians can accurately diagnose influenza cases on the basis of clinical symptoms alone when the pre-test probability is high, such as when influenza viruses are circulating in the communityFootnote 9Footnote 10. Together, influenza-specific clinical case definition and knowledge of influenza seasonality can lead to accurate identification of influenza infection.
Limitations
The study is limited by its retrospective design and the lack of data on days from symptoms onset; a criteria commonly used in influenza case definition. Thus, previously validated outcome definitions that only required clinical diagnostic codes were used.
Conclusion
Our results suggest that it is more appropriate to use the influenza AFHSC standard case definition for specific surveillance rather than a broad ILI definition, when only clinical diagnostic codes are available for the evaluation of influenza, because its trends are more closely related to CDC-reported data. Although our work was oriented towards surveillance needs, we believe specific case definition should also be prioritized for IVE research when LCI are not available. A broader case definition could conservatively bias IVE towards the null by including cases unrelated to influenza, which cannot be prevented by influenza vaccination. This validation exercise should be repeated now that COVID-19 also cause ILIs.
Authors’ statement
- PDP — Writing–original draft, writing–review & editing, conceptualization, methodology, investigation, formal analysis, visualization, funding acquisition
- EF — Writing–review & editing, conceptualization, methodology, supervision
- CQ — Writing–review & editing, conceptualization, methodology, supervision
The content and view expressed in this article are those of the authors and do not necessarily reflect those of the Government of Canada.
Competing interests
None.
Acknowledgements
VHN Consulting, contracted by Seqirus Inc., provided support for data management.
C Boikos and D Dudman, employees of Seqirus Inc., provided editorial support in the preparation of the manuscript.
Funding
This work was funded through the MITACS-Accelerate Internship Program in collaboration with Seqirus Inc.
PDP is funded through the MITACS-Accelerate Internship Program. CQ is the Tier 1–Canada Research Chair in Infection Prevention.
