
Utility of the Peterborough Public Health COVID-19 rapid antigen test self-report tool

 Download this article as a PDF
Published by: The Public Health Agency of Canada
Issue: Volume 49-2/3, February/March 2023: Early Warning in Public Health
Date published: February/March 2023
ISSN: 1481-8531
Submit a manuscript
About CCDR
Browse
Volume 49-2/3, February/March 2023: Early Warning in Public Health
Surveillance
Utility of the Peterborough Public Health COVID-19 rapid antigen test self-report tool: Implications for COVID-19 surveillance
Erin Smith1,2, Carolyn Pigeau2, Jamal Ahmadian-Yazdi2,3, Mohamed Kharbouch2, Jane Hoffmeyer2, Thomas Piggott1,2,4
Affiliations
1 Department of Health Research Methods, Evidence, and Impact, McMaster University, Hamilton, ON
2 Peterborough Public Health, Peterborough, ON
3 Public Health and Preventive Medicine Residency Program, University of Ottawa, Ottawa, ON
4 Department of Family Medicine, Queens University, Kingston, ON
Correspondence
Suggested citation
Smith E, Pigeau C, Ahmadian-Yazdi J, Kharbouch M, Hoffmeyer J, Piggott T. Utility of the Peterborough Public Health COVID-19 rapid antigen test self-report tool: Implications for COVID-19 surveillance. Can Commun Dis Rep 2023;49(2/3):44–9. https://doi.org/10.14745/ccdr.v49i23a03
Keywords: COVID-19, rapid antigen test, PCR test, wastewater, evaluation, surveillance, Peterborough Public Health
Abstract
Background: The ongoing coronavirus disease 2019 (COVID-19) pandemic has necessitated novel testing strategies, including the use of rapid antigen tests (RATs). The widespread distribution of RATs to the public prompted Peterborough Public Health to launch a pilot RAT self-report tool to assess its utility in COVID-19 surveillance. The objective of this study is to investigate the utility of RAT using correlations between RAT self-report results and other indicators of COVID-19.
Methods: We investigated the association between RAT results, PCR test results and wastewater levels of nmN1N2 severe acute respiratory syndrome coronavirus 2 (SARS-CoV-2) genes (to infer COVID-19 levels) using Pearson's correlation coefficient. Percent positivity and count of positive tests for RATs and polymerase chain reaction (PCR) tests were analyzed.
Results: The PCR percent positivity and wastewater were weakly correlated (r=0.33, p=0.022), as were RAT percent positivity and wastewater nmN1N2 levels (r=0.33, p=0.002). The RAT percent positivity and PCR percent positivity were not significantly correlated (r=-0.035, p=0.75). Count of positive RATs and count of positive PCR tests were moderately correlated (r=0.59, p<0.001). Wastewater nmN1N2 levels were not significantly correlated with either count of positive RATs (r=0.019, p=0.864) or count of positive PCR tests (r=0.004, p=0.971).
Conclusion: Our results support the use of RAT self-reporting as a low-cost simple adjunctive COVID-19 surveillance tool, and suggest that its utility is greatest when considering an absolute count of positive RATs rather than percent positivity due to reporting bias towards positive tests. These results can help inform COVID-19 surveillance strategies of local public health units and encourage the use of a RAT self-report tool.
Introduction
The ongoing resource pressures in the coronavirus disease 2019 (COVID-19) pandemic have warranted the implementation of novel testing strategies. For example, limits to polymerase chain reaction (PCR) testing (i.e. available only for only high-risk individuals in late 2021) posed a new challenge for accurately monitoring COVID-19 case counts Footnote 1. Wastewater surveillance has proven useful in addressing surveillance gaps Footnote 2 Footnote 3 Footnote 4; however, limitations exist in the interpretation of wastewater data.
Self-administered rapid antigen tests (RATs) can detect the viral proteins that cause COVID-19 in as little as 15 minutes Footnote 5, and is an alternative method employed by the Government of Ontario to monitor the virus' spread. In December 2021, the Ontario government announced the distribution of RATs for elementary and secondary school students and staff Footnote 6, followed by the expansion of the RAT rollout to pharmacies and grocery stores in February 2022 Footnote 7. This program continues until present, with publicly funded and privately purchased RATs widely available. The provincial distribution of RATs prompted Peterborough Public Health (PPH) to launch a pilot surveillance project asking local residents to voluntarily and confidentially report their RAT results via an online self-report tool. The objective was to monitor an approximate percent positivity among those who reported their results using the online self-report tool to contribute to community COVID-19 surveillance.
Peterborough Public Health is the only public health unit globally that has launched a RAT self-report tool. The objective of this study is to investigate the utility of this tool using correlations between RAT self-report results and other indicators of COVID-19, specifically PCR test results and wastewater levels of COVID-19. This is the first study to investigate the utility of a RAT self-report tool, and the results will contribute robust evidence towards the role of RAT self-report results in COVID-19 surveillance.
Methods
Wastewater samples were collected and analyzed by Trent University in Peterborough. Wastewater levels of COVID-19 were measured in the region's primary municipal wastewater source, the City of Peterborough, using a normalized average of viral genes N1 and N2 (nmN1N2) Footnote 8.
The PCR test results were obtained from the Ontario Ministry of Health and Long-Term Care COVID-19 Testing Dashboard Footnote 9. The RAT results were obtained from the PPH online RAT self-report tool Footnote 10. The PCR and RAT results from Peterborough City and County were included in the analysis while only the wastewater data from the City of Peterborough were included.
This study did not require ethics approval as the data we analyzed is routinely collected by PPH for COVID-19 surveillance and is not reported on an individually identifiable basis.
Analysis
The relationship between RAT results, PCR results, and wastewater levels of COVID-19 was analyzed using Pearson's correlation. Both percent positivity as well as count of positive tests for RATs and PCR tests were analyzed. The data obtained for all three indicators were collected from December 17, 2021 to April 30, 2022; dates with missing data were excluded. All data were analyzed using R statistical software Footnote 11. The RAT, PCR test and wastewater data were screened for outliers and log-transformed to meet the assumption of a normal distribution for Pearson's correlation. A weak correlation was defined as a value between 0.2 and 0.39, while a moderate correlation was defined as between 0.4 and 0.59 Footnote 12.
Results
Descriptive results
From December 17, 2021 to April 30, 2022, 4,571 RAT self-report results were recorded and 2,138 responses were reported as positive. Figure 1 summarizes the count of positive and negative RATs, Figure 2 summarizes the percent positivity of PCR tests, RATs and wastewater nmN1N2 levels and Figure 3 summarizes the count of PCR tests, RATs and wastewater nmN1N2 levels.
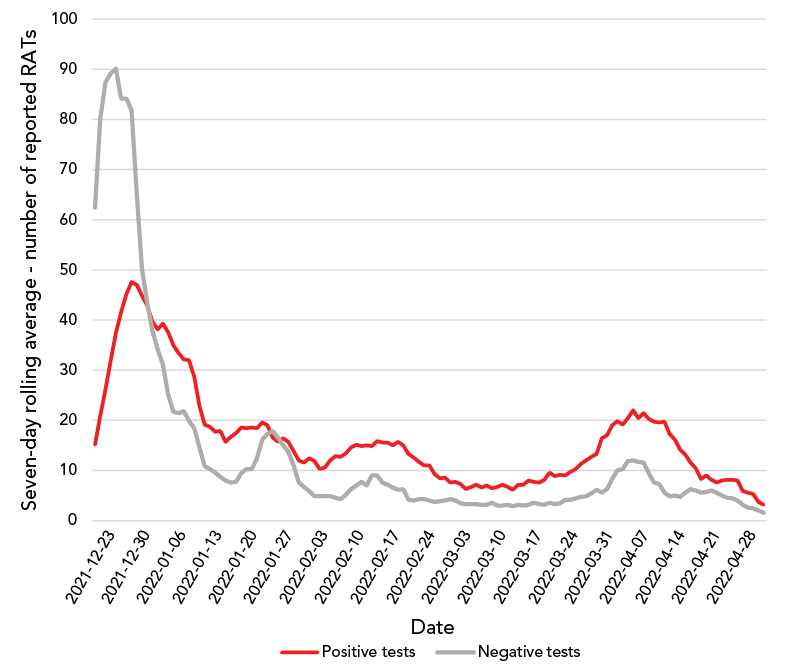
Figure 1 - Text description
| Date | Number of positive tests | Number of negative tests |
|---|---|---|
| 2021-12-17 | 3 | 33 |
| 2021-12-18 | 9 | 70 |
| 2021-12-19 | 1 | 49 |
| 2021-12-20 | 18 | 56 |
| 2021-12-21 | 20 | 85 |
| 2021-12-22 | 25 | 53 |
| 2021-12-23 | 30 | 91 |
| 2021-12-24 | 43 | 156 |
| 2021-12-25 | 46 | 122 |
| 2021-12-26 | 41 | 61 |
| 2021-12-27 | 57 | 63 |
| 2021-12-28 | 49 | 43 |
| 2021-12-29 | 50 | 53 |
| 2021-12-30 | 47 | 75 |
| 2021-12-31 | 39 | 38 |
| 2022-01-01 | 31 | 18 |
| 2022-01-02 | 27 | 14 |
| 2022-01-03 | 35 | 24 |
| 2022-01-04 | 38 | 17 |
| 2022-01-05 | 58 | 32 |
| 2022-01-06 | 35 | 33 |
| 2022-01-07 | 21 | 14 |
| 2022-01-08 | 20 | 16 |
| 2022-01-09 | 18 | 17 |
| 2022-01-10 | 34 | 10 |
| 2022-01-11 | 15 | 7 |
| 2022-01-12 | 17 | 5 |
| 2022-01-13 | 9 | 7 |
| 2022-01-14 | 18 | 10 |
| 2022-01-15 | 13 | 11 |
| 2022-01-16 | 19 | 11 |
| 2022-01-17 | 19 | 5 |
| 2022-01-18 | 22 | 4 |
| 2022-01-19 | 22 | 6 |
| 2022-01-20 | 17 | 19 |
| 2022-01-21 | 17 | 16 |
| 2022-01-22 | 14 | 11 |
| 2022-01-23 | 18 | 26 |
| 2022-01-24 | 27 | 31 |
| 2022-01-25 | 18 | 12 |
| 2022-01-26 | 5 | 10 |
| 2022-01-27 | 11 | 10 |
| 2022-01-28 | 22 | 5 |
| 2022-01-29 | 9 | 2 |
| 2022-01-30 | 5 | 7 |
| 2022-01-31 | 14 | 7 |
| 2022-02-01 | 15 | 6 |
| 2022-02-02 | 11 | 4 |
| 2022-02-03 | 7 | 3 |
| 2022-02-04 | 11 | 5 |
| 2022-02-05 | 11 | 2 |
| 2022-02-06 | 15 | 7 |
| 2022-02-07 | 20 | 5 |
| 2022-02-08 | 14 | 4 |
| 2022-02-09 | 16 | 10 |
| 2022-02-10 | 15 | 11 |
| 2022-02-11 | 15 | 10 |
| 2022-02-12 | 9 | 7 |
| 2022-02-13 | 16 | 2 |
| 2022-02-14 | 19 | 19 |
| 2022-02-15 | 21 | 4 |
| 2022-02-16 | 14 | 0 |
| 2022-02-17 | 15 | 8 |
| 2022-02-18 | 11 | 6 |
| 2022-02-19 | 14 | 4 |
| 2022-02-20 | 11 | 3 |
| 2022-02-21 | 7 | 4 |
| 2022-02-22 | 16 | 3 |
| 2022-02-23 | 8 | 2 |
| 2022-02-24 | 10 | 8 |
| 2022-02-25 | 11 | 4 |
| 2022-02-26 | 2 | 2 |
| 2022-02-27 | 5 | 4 |
| 2022-02-28 | 8 | 5 |
| 2022-03-01 | 9 | 5 |
| 2022-03-02 | 9 | 0 |
| 2022-03-03 | 7 | 4 |
| 2022-03-04 | 4 | 3 |
| 2022-03-05 | 5 | 2 |
| 2022-03-06 | 8 | 4 |
| 2022-03-07 | 4 | 4 |
| 2022-03-08 | 12 | 5 |
| 2022-03-09 | 5 | 3 |
| 2022-03-10 | 9 | 0 |
| 2022-03-11 | 7 | 3 |
| 2022-03-12 | 2 | 3 |
| 2022-03-13 | 4 | 2 |
| 2022-03-14 | 11 | 6 |
| 2022-03-15 | 12 | 4 |
| 2022-03-16 | 11 | 4 |
| 2022-03-17 | 7 | 3 |
| 2022-03-18 | 6 | 1 |
| 2022-03-19 | 6 | 2 |
| 2022-03-20 | 14 | 5 |
| 2022-03-21 | 6 | 4 |
| 2022-03-22 | 14 | 5 |
| 2022-03-23 | 10 | 9 |
| 2022-03-24 | 12 | 3 |
| 2022-03-25 | 10 | 3 |
| 2022-03-26 | 13 | 4 |
| 2022-03-27 | 19 | 6 |
| 2022-03-28 | 11 | 8 |
| 2022-03-29 | 18 | 10 |
| 2022-03-30 | 32 | 5 |
| 2022-03-31 | 16 | 8 |
| 2022-04-01 | 24 | 17 |
| 2022-04-02 | 19 | 16 |
| 2022-04-03 | 14 | 8 |
| 2022-04-04 | 20 | 19 |
| 2022-04-05 | 29 | 11 |
| 2022-04-06 | 21 | 3 |
| 2022-04-07 | 23 | 7 |
| 2022-04-08 | 16 | 2 |
| 2022-04-09 | 15 | 3 |
| 2022-04-10 | 13 | 6 |
| 2022-04-11 | 21 | 7 |
| 2022-04-12 | 12 | 6 |
| 2022-04-13 | 13 | 4 |
| 2022-04-14 | 9 | 5 |
| 2022-04-15 | 9 | 8 |
| 2022-04-16 | 4 | 8 |
| 2022-04-17 | 5 | 4 |
| 2022-04-18 | 6 | 4 |
| 2022-04-19 | 17 | 7 |
| 2022-04-20 | 7 | 6 |
| 2022-04-21 | 5 | 2 |
| 2022-04-22 | 12 | 4 |
| 2022-04-23 | 5 | 5 |
| 2022-04-24 | 5 | 3 |
| 2022-04-25 | 5 | 1 |
| 2022-04-26 | 2 | 1 |
| 2022-04-27 | 5 | 2 |
| 2022-04-28 | 3 | 1 |
| 2022-04-29 | 1 | 1 |
| 2022-04-30 | 1 | 2 |
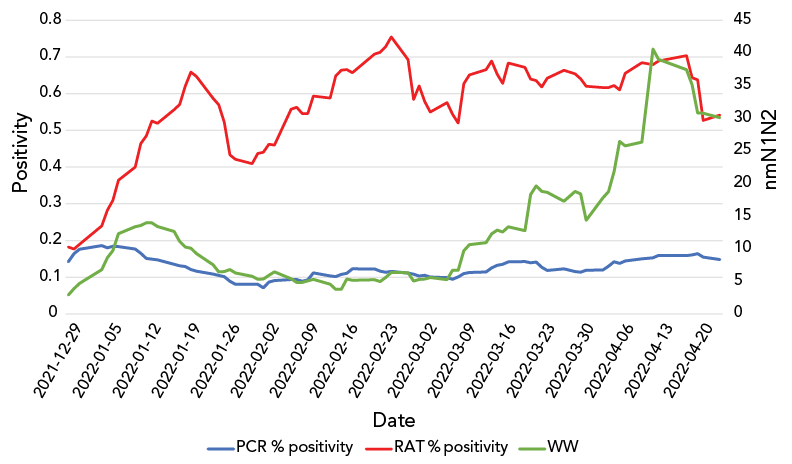
Figure 2 - Text description
| Date | PCR % positivity | WW | RAT % positivity |
|---|---|---|---|
| 2021-12-17 | 0.07540984 | 1.02 | 0.15384615 |
| 2021-12-20 | 0.12859885 | 2.04 | 0.09375 |
| 2021-12-21 | 0.10814815 | 1.62 | 0.09433962 |
| 2021-12-22 | 0.15905512 | 2.01 | 0.21495327 |
| 2021-12-23 | 0.15994437 | 2.34 | 0.29906542 |
| 2021-12-24 | 0.17429578 | 2.57 | 0.21621622 |
| 2021-12-29 | 0.19061876 | 8.75 | 0.20512821 |
| 2021-12-30 | 0.23067633 | 7.95 | 0.11428571 |
| 2021-12-31 | 0.21357285 | 7.68 | 0.18644068 |
| 2022-01-04 | 0.17585693 | 16.3 | 0.44444444 |
| 2022-01-05 | 0.11678832 | 14.68 | 0.50943396 |
| 2022-01-06 | 0.18947368 | 10.13 | 0.49019608 |
| 2022-01-07 | 0.16859122 | 20.72 | 0.6 |
| 2022-01-10 | 0.14348786 | 16.22 | 0.45454545 |
| 2022-01-11 | 0.15056818 | 9.19 | 0.5625 |
| 2022-01-12 | 0.11456311 | 10.68 | 0.33333333 |
| 2022-01-13 | 0.1622807 | 16.17 | 0.72727273 |
| 2022-01-14 | 0.10393258 | 10.77 | 0.46666667 |
| 2022-01-17 | 0.10489511 | 4.79 | 0.75 |
| 2022-01-18 | 0.13905325 | 9.97 | 0.7 |
| 2022-01-19 | 0.13095238 | 10.32 | 0.8 |
| 2022-01-20 | 0.09213483 | 7.88 | 0.83333333 |
| 2022-01-21 | 0.08494209 | 4.98 | 0.25 |
| 2022-01-24 | 0.10629921 | 4.15 | 0.30882353 |
| 2022-01-25 | 0.07886435 | 3.09 | 0.34782609 |
| 2022-01-26 | 0.08060453 | 5.12 | 0.41666667 |
| 2022-01-27 | 0.05069124 | 12.16 | 0.07692308 |
| 2022-01-28 | 0.07368421 | 6.62 | 0.71428571 |
| 2022-01-31 | 0.09363296 | 4.36 | 0.75 |
| 2022-02-01 | 0.08309456 | 1.85 | 0.44444444 |
| 2022-02-02 | 0.0390625 | 4.36 | 0.33333333 |
| 2022-02-03 | 0.18789809 | 7.09 | 0.5 |
| 2022-02-04 | 0.11111111 | 8.73 | 0.4 |
| 2022-02-07 | 0.06842105 | 4.82 | 0.76190476 |
| 2022-02-08 | 0.07342657 | 2.77 | 0.75 |
| 2022-02-09 | 0.0627451 | 4.34 | 0.63157895 |
| 2022-02-10 | 0.10869565 | 3.43 | 0.44444444 |
| 2022-02-11 | 0.17318436 | 6.04 | 0.66666667 |
| 2022-02-14 | 0.12849162 | 1.9 | 0.46153846 |
| 2022-02-15 | 0.09777778 | 3.17 | 0.81818182 |
| 2022-02-16 | 0.1119403 | 4.79 | 0.875 |
| 2022-02-17 | 0.09469697 | 13.91 | 0.76190476 |
| 2022-02-18 | 0.14765101 | 2.98 | 0.57142857 |
| 2022-02-22 | 0.10687023 | 3.98 | 0.8 |
| 2022-02-23 | 0.13058419 | 4.14 | 0.7 |
| 2022-02-24 | 0.10596027 | 6.33 | 0.57142857 |
| 2022-02-25 | 0.11585366 | 8.42 | 1 |
| 2022-02-28 | 0.07920792 | 4.65 | 0.44444444 |
| 2022-03-01 | 0.07352941 | 4.86 | 0 |
| 2022-03-02 | 0.1122449 | 4.68 | 0.83333333 |
| 2022-03-03 | 0.12195122 | 4.45 | 0.5 |
| 2022-03-04 | 0.09701493 | 5.77 | 0.5 |
| 2022-03-07 | 0.09415584 | 4.03 | 0.75 |
| 2022-03-08 | 0.08571429 | 18.64 | 0.77777778 |
| 2022-03-09 | 0.12244898 | 4.38 | 0.27777778 |
| 2022-03-10 | 0.13793103 | 25.88 | 0.75 |
| 2022-03-11 | 0.13333333 | 11.21 | 1 |
| 2022-03-14 | 0.13173653 | 6.66 | 0.6 |
| 2022-03-15 | 0.17307692 | 15.17 | 0.66666667 |
| 2022-03-16 | 0.14516129 | 8.02 | 0.5 |
| 2022-03-17 | 0.10526316 | 16.7 | 0.6 |
| 2022-03-18 | 0.16814159 | 9.9 | 0.66666667 |
| 2022-03-21 | 0.14379085 | 21.76 | 0.66666667 |
| 2022-03-22 | 0.11111111 | 49.81 | 0.77777778 |
| 2022-03-23 | 0.14457831 | 15.93 | 0.57142857 |
| 2022-03-24 | 0.075 | 9.35 | 0.54545455 |
| 2022-03-25 | 0.08333333 | 6.97 | 0.66666667 |
| 2022-03-28 | 0.13658537 | 7.13 | 0.75 |
| 2022-03-30 | 0.11507937 | 20.43 | 0.6 |
| 2022-03-31 | 0.13191489 | 19.18 | 0.57142857 |
| 2022-04-01 | 0.14835165 | 21.64 | 0.63636364 |
| 2022-04-04 | 0.14979757 | 39.8 | 0.54545455 |
| 2022-04-05 | 0.14634146 | 15.97 | 0.54545455 |
| 2022-04-06 | 0.16923077 | 28.47 | 0.70588235 |
| 2022-04-07 | 0.10465116 | 39.53 | 0.66666667 |
| 2022-04-08 | 0.16086957 | 15.68 | 0.91666667 |
| 2022-04-11 | 0.17307692 | 23.1 | 0.77272727 |
| 2022-04-13 | 0.16719243 | 121.43 | 0.6 |
| 2022-04-14 | 0.19753086 | 28.76 | 0.61538462 |
| 2022-04-19 | 0.1407767 | 4.91 | 0.64705882 |
| 2022-04-20 | 0.18367347 | 12.37 | 0.28571429 |
| 2022-04-21 | 0.12790698 | 9.26 | 0.625 |
| 2022-04-22 | 0.0952381 | 15.44 | 0.14285714 |
| 2022-04-25 | 0.12663756 | 18.32 | 0.875 |
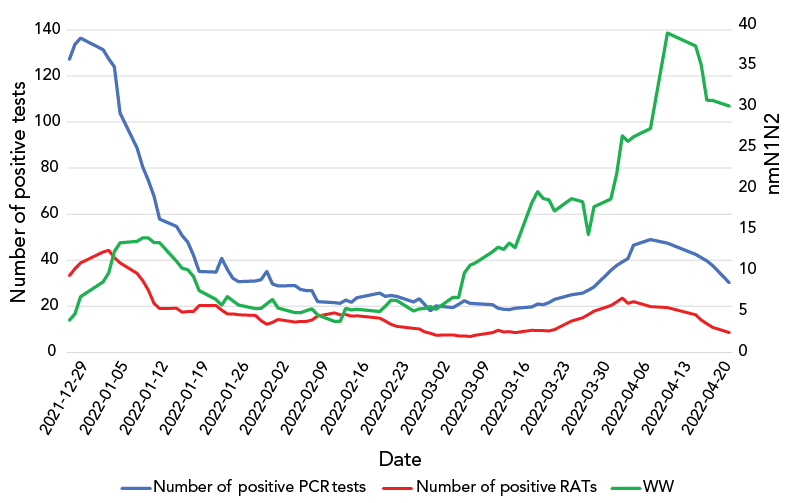
Figure 3 - Text description
| Date | Number of positive RAT | Number of positive PCR | nmN1N2 |
|---|---|---|---|
| 2021-12-20 | 18 | 76 | 2.04 |
| 2021-12-21 | 20 | 93 | 1.62 |
| 2021-12-22 | 25 | 118 | 2.01 |
| 2021-12-23 | 30 | 117 | 2.34 |
| 2021-12-24 | 43 | 102 | 2.57 |
| 2021-12-29 | 50 | 214 | 8.75 |
| 2021-12-30 | 47 | 170 | 7.95 |
| 2021-12-31 | 39 | 122 | 7.68 |
| 2022-01-04 | 38 | 112 | 16.3 |
| 2022-01-05 | 58 | 83 | 14.68 |
| 2022-01-06 | 35 | 89 | 10.13 |
| 2022-01-07 | 21 | 78 | 20.72 |
| 2022-01-10 | 34 | 73 | 16.22 |
| 2022-01-11 | 15 | 64 | 9.19 |
| 2022-01-12 | 17 | 64 | 10.68 |
| 2022-01-13 | 9 | 71 | 16.17 |
| 2022-01-14 | 18 | 36 | 10.77 |
| 2022-01-17 | 19 | 19 | 9.97 |
| 2022-01-18 | 22 | 56 | 4.79 |
| 2022-01-19 | 22 | 45 | 10.32 |
| 2022-01-20 | 17 | 44 | 7.88 |
| 2022-01-21 | 17 | 24 | 4.98 |
| 2022-01-24 | 27 | 22 | 4.15 |
| 2022-01-25 | 18 | 34 | 3.09 |
| 2022-01-26 | 5 | 61 | 5.12 |
| 2022-01-27 | 11 | 22 | 12.16 |
| 2022-01-28 | 22 | 18 | 6.62 |
| 2022-01-31 | 14 | 34 | 4.36 |
| 2022-02-01 | 15 | 26 | 1.85 |
| 2022-02-02 | 11 | 26 | 4.36 |
| 2022-02-03 | 7 | 59 | 7.09 |
| 2022-02-04 | 11 | 23 | 8.73 |
| 2022-02-07 | 20 | 16 | 4.82 |
| 2022-02-08 | 14 | 19 | 2.77 |
| 2022-02-09 | 16 | 22 | 4.34 |
| 2022-02-10 | 15 | 23 | 3.43 |
| 2022-02-11 | 15 | 26 | 6.04 |
| 2022-02-14 | 19 | 25 | 1.9 |
| 2022-02-15 | 21 | 20 | 3.17 |
| 2022-02-16 | 14 | 14 | 4.79 |
| 2022-02-17 | 15 | 29 | 13.91 |
| 2022-02-18 | 11 | 15 | 2.98 |
| 2022-02-22 | 16 | 37 | 3.98 |
| 2022-02-23 | 8 | 40 | 4.14 |
| 2022-02-24 | 10 | 15 | 6.33 |
| 2022-02-25 | 11 | 23 | 8.42 |
| 2022-02-28 | 8 | 11 | 4.65 |
| 2022-03-01 | 9 | 12 | 4.86 |
| 2022-03-02 | 9 | 25 | 4.68 |
| 2022-03-03 | 7 | 19 | 4.45 |
| 2022-03-04 | 4 | 21 | 5.77 |
| 2022-03-07 | 4 | 30 | 4.03 |
| 2022-03-08 | 12 | 18 | 18.64 |
| 2022-03-09 | 5 | 21 | 4.38 |
| 2022-03-10 | 9 | 23 | 25.88 |
| 2022-03-11 | 7 | 17 | 11.21 |
| 2022-03-14 | 11 | 18 | 6.66 |
| 2022-03-15 | 12 | 18 | 15.17 |
| 2022-03-16 | 11 | 19 | 8.02 |
| 2022-03-17 | 7 | 15 | 16.7 |
| 2022-03-18 | 6 | 20 | 9.9 |
| 2022-03-21 | 6 | 27 | 21.76 |
| 2022-03-22 | 14 | 21 | 49.81 |
| 2022-03-23 | 10 | 27 | 15.93 |
| 2022-03-24 | 12 | 16 | 9.35 |
| 2022-03-25 | 10 | 25 | 6.97 |
| 2022-03-28 | 11 | 25 | 7.13 |
| 2022-03-30 | 32 | 34 | 20.43 |
| 2022-03-31 | 16 | 32 | 19.18 |
| 2022-04-01 | 24 | 30 | 21.64 |
| 2022-04-04 | 20 | 37 | 39.8 |
| 2022-04-05 | 29 | 66 | 15.97 |
| 2022-04-06 | 21 | 40 | 28.47 |
| 2022-04-07 | 23 | 36 | 39.53 |
| 2022-04-08 | 16 | 44 | 15.68 |
| 2022-04-11 | 21 | 73 | 23.1 |
| 2022-04-14 | 9 | 47 | 28.76 |
| 2022-04-19 | 17 | 26 | 121.43 |
| 2022-04-20 | 7 | 32 | 4.91 |
| 2022-04-21 | 5 | 30 | 12.37 |
| 2022-04-22 | 12 | 26 | 9.26 |
| 2022-04-25 | 5 | 30 | 15.44 |
| 2022-04-27 | 5 | 20 | 18.32 |
Analytical results
The PCR percent positivity and wastewater levels were weakly correlated (r=0.33, p=0.022), as were RAT percent positivity and wastewater (r=0.33, p=0.002); these results were statistically significant. The RAT percent positivity and PCR percent positivity were not significantly correlated to each other (Table 1).
| Indicators of COVID-19 | RAT % positivity | PCR % positivity | Wastewater (nmN1N2) |
|---|---|---|---|
| RAT % positivity | 1.0 | N/A | N/A |
| PCR % positivity | -0.035 (p=0.75) | 1.0 | N/A |
| Wastewater (nmN1N2) | 0.33 (p=0.002) | 0.33 (p=0.022) | 1.0 |
| |||
Count of positive RATs and count of positive PCR tests were moderately correlated (r=0.59, p<0.001); this result was statistically significant. Wastewater was not significantly correlated to count of positive RATs or count of positive PCR tests (Table 2).
| Indicators of COVID-19 | Count of positive RAT | Count of positive PCR | Wastewater (nmN1N2) |
|---|---|---|---|
| Count of positive RAT | 1.0 | N/A | N/A |
| Count of positive PCR | 0.59 (p<0.001) | 1.0 | N/A |
| Wastewater (nmN1N2) | 0.019 (p=0.864) | 0.004 (p=0.971) | 1.0 |
|
|||
Discussion
Our study is the first to investigate the utility of a RAT self-report tool for COVID-19 surveillance. We found that both PCR percent positivity and RAT percent positivity were weakly correlated with wastewater levels of COVID-19, and that the count of positive RAT and count of positive PCR tests were moderately correlated. We did not find a significant correlation between PCR percent positivity and RAT percent positivity or the count of positive RATs and count of positive PCR tests with wastewater levels. A possible explanation for these results is that not everyone who contracts COVID-19 obtained a RAT or PCR test, as many cases were asymptomatic or testing access criteria had changed. In addition, a significant proportion of people with active COVID-19 infections shed the virus in their feces, sometimes before their symptoms start; this contrasts with the time lag associated with RAT and PCR testing Footnote 13. Previous studies have also indicated the incidence and persistence of viral shedding through feces even after a negative nasopharyngeal swab Footnote 14. These temporal differences, along with a lack of testing in some active cases, may offer explanation for why there was no significant correlation observed between the counts of positive PCR tests or RATs with wastewater levels.
Strengths and limitations
A key strength of our study is that we used data collected during the peak in cases during the Omicron wave in Ontario. Heightened public awareness of COVID-19 transmission as well as the launch of the PPH RAT self-report tool contributed to a high number of RAT self-report submissions and an overall robust dataset. An additional strength was our investigation of the utility of this RAT self-report tool compared with multiple indicators of COVID-19. This quantified the relative utility of the RAT self-report tool using correlations and suggested that, in a complex landscape of COVID-19 surveillance, RAT self-reporting may present a helpful adjunctive surveillance tool at a minimal cost and administrative burden to public health organizations.
The main limitations in our study are the biases in reporting COVID-19 cases through both PCR testing and the RAT self-report tool. As mentioned, the restrictions on PCR testing to only high-risk individuals in late 2021 likely resulted in a significant under-representation of actual COVID-19 cases in the PCR data that we analyzed. In addition, the voluntary nature of self-reporting a RAT result introduces inaccuracies, as the PPH self-report tool likely only captured a fraction of actual positive and negative RAT results. Intermittent efforts to raise awareness of RAT self-reporting may result in fluctuations when the baseline reporting rates we observed were fairly low. A second limitation relates to availability of RATs. The RATs will continue to be distributed free of charge for the foreseeable future. If free tests are no longer readily available, the likely respondents would be further restricted to those who could afford or choose to purchase RATs. The role of differential positive reporting bias in the RAT self-report data necessitated the analysis of absolute numbers of positive RATs and trends over time as opposed to traditional measures such as percent positivity. This ultimately informed the decision to base the PPH COVID-19 Risk Index indicator on RAT based on the number of positive reports and continues to be assessed for utility over time.
The use of Pearson's correlation coefficient in our analysis also presents limitations; for example, the exclusion of potential confounding variables Footnote 15. In the future, a more robust statistical analysis could be conducted that would account for extraneous variables.
A final limitation in our study is that although the RAT and PCR test results were collected from the entire county, the wastewater data we analyzed was collected only from the City of Peterborough. Although these samples may have differed from other areas in the county, the City of Peterborough represents the majority of the PPH population and can, therefore, be used as a proxy for the PPH region in a geographically small region such as ours.
Implications for policy
The weak correlation that we found between RAT percent positivity and wastewater, as well as PCR percent positivity and wastewater nmN1N2 levels, suggests that RAT percent positivity can be used in COVID-19 surveillance; however, the limitations of this surveillance method must be explored. Further assessment through additional waves of COVID-19 is needed to understand temporality in RAT self-reporting signals. For instance, corroborative information of RAT percent positivity, PCR percent positivity and increasing wastewater nmN1N2 levels may be useful in reporting on changes in community transmission risk. Indeed, this is the reason that PPH has incorporated RAT testing into its COVID-19 Community Risk Index Footnote 16.
The moderate correlation between count of positive RAT and count of positive PCR tests suggests that the utility of RAT self-report results is greatest when using the count of positive RATs compared to percent positivity as a tool for COVID-19. In the event of further changes to PCR testing eligibility continuing to decrease, maintaining access to RATs and RAT self-reporting could be a complementary surveillance tool. These results could provide evidence in favour of the use of RAT self-report results in COVID-19 surveillance and support the potential for public health units across Canada to develop local RAT self-report tools.
With this being said, multiple surveillance tools are required to obtain the most accurate picture of pandemic risk. For example, PPH has developed a COVID-19 Risk Index to inform community members about the current risk for COVID-19 transmission Footnote 16. Six indicators (case rate, hospitalizations, deaths, PCR test positivity, positive RAT count, wastewater surveillance) are weighted to present an overall risk level with accompanying risk guidance. A key consideration in the use of COVID-19 surveillance tools such as the PPH COVID-19 Risk Index is to ensure public awareness of the complexities of COVID-19 surveillance; for example, adequate communication around limitations to interpreting each indicator is necessary.
In addition, some limitations surrounding reporting bias might be effectively addressed through collaboration between the public funder of RATs and local public health agencies; for example, exploring the potential for linking RAT promotion, distribution and surveillance through a coordinated mechanism, such as including a QR code on the test package linking to a survey.
Implications for research
We identified reporting biases as a risk to the use of data from RAT self-reports, yet further research is required to determine how public health units can encourage community members to report their RAT results. Additionally, further research on alternative surveillance tools is important as we progress through the pandemic given decreased access to PCR testing and reliability of their results to measure COVID-19 infections in the community. Finally, additional research is warranted to investigate which indicators are the most sensitive to change. From a visual analysis of our data (Figure 3), wastewater was the most sensitive COVID-19 indicator as it was the first to increase—coinciding with the start of wave 6 (March–April 2022). The RAT results have the next greatest sensitivity, with PCR being the least sensitive as it was the last indicator to show an increase. Further research evaluation is required to assess the sensitivity of each indicator to enable the earliest detection of an increase in COVID-19.
Conclusion
The ongoing COVID-19 pandemic has necessitated the use of numerous indicators and testing strategies to approximate levels of COVID-19 infections. Our results provide evidence that may support the use of RAT self-reports in COVID-19 surveillance. The utility of RAT self-reports is likely greatest when considering count of positive RAT tests (when public availability of RATs is constant over time) rather than percent positivity due to reporting biases. The results from our study may inform the COVID-19 surveillance strategies of local public health units and encourage the use of a RAT self-reports as an adjunctive surveillance tool.
Authors' statement
ES — Analysis, writing, original draft, review, editing
CP — Analysis, review, editing, supervision
JAY — Analysis, review, editing
MK — Analysis, review, editing
JH — Study design and conception, review, editing, supervision
TP — Study design and conception, review, editing, supervision, funding
Competing interests
None declared.
Acknowledgements
We acknowledge residents of the Peterborough Public Health (PPH) region who reported rapid antigen test (RAT) results using the PPH online RAT self-report tool. We also thank Trent University and municipal partners for their efforts in collecting and analyzing wastewater samples.
Funding
This work was supported by Peterborough Public Health.
References
- Footnote 1
-
Government of Ontario. Updated Eligibility for PCR Testing and Case and Contact Management Guidance in Ontario. Toronto, ON: Government of Ontario; December 2021. [Accessed 2022 Sep 15]. https://news.ontario.ca/en/backgrounder/1001387/updated-eligibility-for-pcr-testing-and-case-and-contact-management-guidance-in-ontario
- Footnote 2
-
Farkas K, Hillary LS, Malham SK, McDonald JE, Jones DL. Wastewater and public health: the potential of wastewater surveillance for monitoring COVID-19. Curr Opin Environ Sci Health 2020;17:14–20. https://doi.org/10.1016/j.coesh.2020.06.001
- Footnote 3
-
McMahan CS, Self S, Rennert L, Kalbaugh C, Kriebel D, Graves D, Colby C, Deaver JA, Popat SC, Karanfil T, Freedman DL. COVID-19 wastewater epidemiology: a model to estimate infected populations. Lancet Planet Health 2021;5(12):e874–81. https://doi.org/10.1016/S2542-5196(21)00230-8
- Footnote 4
-
Shah S, Gwee SX, Ng JQ, Lau N, Koh J, Pang J. Wastewater surveillance to infer COVID-19 transmission: A systematic review. Sci Total Environ 2022;804:150060. https://doi.org/10.1016/j.scitotenv.2021.150060
- Footnote 5
-
Government of Ontario. COVID-19 testing and treatment. Toronto, ON: Government of Ontario. [Accessed 2022 Jul 11; updated 2023 Jan]. https://www.ontario.ca/page/covid-19-testing-and-treatment
- Footnote 6
-
Herhalt C. Ontario sending students home with five rapid COVID-19 tests for winter break. CTV News. [Updated 2021 Nov 18]. https://toronto.ctvnews.ca/ontario-sending-students-home-with-five-rapid-covid-19-antigen-tests-for-winter-break-1.5671232
- Footnote 7
-
Government of Ontario. Ontario Expanding Access to Free Rapid Tests for General Public. Toronto, ON: Government of Ontario; February 2022. [Accessed 2022 Sep 15]. https://news.ontario.ca/en/release/1001575/ontario-expanding-access-to-free-rapid-tests-for-general-public
- Footnote 8
-
Public Health Ontario. COVID-19 Wastewater Surveillance in Ontario. Toronto, ON: PHO. [Accessed 2023 Jan 17; updated 2023 Jan 26]. https://www.publichealthontario.ca/en/Data-and-Analysis/Infectious-Disease/COVID-19-Data-Surveillance/Wastewater
- Footnote 9
-
Government of Ontario. Capacity Planning and analytics Division. CPAD Visual Analytics Hub. Toronto, ON: Government of Ontario. [Accessed 2022 Sep 15]. https://vap.health.gov.on.ca/analytics.html
- Footnote 10
-
Peterborough Public Health. COVID-19 – Prevention. Peterborough, ON: PPH. [Accessed 2022 Sep 15; updated 2022 Sept 1]. https://www.peterboroughpublichealth.ca/novel-coronavirus-covid-19/covid-19-guidance-for-everyone/?highlight=rapid%20antigen%20test#4
- Footnote 11
-
Project R. The R Project for Statistical Computing, Vienna (AT): R Project. https://www.R-project.org/
- Footnote 12
-
The BMJ. Statistics at square one: Chapter 11: Correlation and regression. [Accessed 2023 Jan 14]. https://www.bmj.com/about-bmj/resources-readers/publications/statistics-square-one/11-correlation-and-regression
- Footnote 13
-
Centers for Disease Control and Prevention. National Wastewater Surveillance System (NWSS). A new public health tool to understand COVID-19 spread in a community. Atlanta, GA: CDC; December 2022. [Accessed 2022 Oct 20]. https://www.cdc.gov/healthywater/surveillance/wastewater-surveillance/wastewater-surveillance.html
- Footnote 14
-
Morone G, Palomba A, Iosa M, Caporaso T, De Angelis D, Venturiero V, Savo A, Coiro P, Carbone D, Gimigliano F, Iolascon G, Paolucci S. Incidence and Persistence of Viral Shedding in COVID-19 Post-acute Patients With Negativized Pharyngeal Swab: A Systematic Review. Front Med (Lausanne) 2020;7:562. https://doi.org/10.3389/fmed.2020.00562
- Footnote 15
-
Janse RJ, Hoekstra T, Jager KJ, Zoccali C, Tripepi G, Dekker FW, van Diepen M. Conducting correlation analysis: important limitations and pitfalls. Clin Kidney J 2021;14(11):2332–7. https://doi.org/10.1093/ckj/sfab085
- Footnote 16
-
Peterborough Public Health. Peterborough Region COVID-19 Respiratory Virus Risk Index. Peterborough, ON: PPH; January 25, 2023. [Accessed 2022 Oct 7]. https://app.powerbi.com/view?r=eyJrIjoiMDRhYWQ1NzktNjlkMi00YTQ2LWI0NDItOTQ0ZDU2MDk3YTllIiwidCI6IjQ4OTJlODVlLTM1NzEtNGUzNy1hZjU1LTE4NTU3MjA2NDBjOCJ9&pageName=ReportSectionb42f1cb240c9ad8780d8
