Wastewater surveillance for earlier detection of COVID-19 outbreaks in Ontario

 Download this article as a PDF
Published by: The Public Health Agency of Canada
Issue: Volume 49-2/3, February/March 2023: Early Warning in Public Health
Date published: February/March 2023
ISSN: 1481-8531
Submit a manuscript
About CCDR
Browse
Volume 49-2/3, February/March 2023: Early Warning in Public Health
Rapid Communication
Wastewater surveillance for earlier detection of seniors congregate living COVID-19 outbreaks in Peterborough, Ontario
Thomas Piggott1,2,3, Mohamed Kharbouch3, Michael Donaldson4,5, Carolyn Pigeau3, Donna Churipuy3, Gillian Pacey3, Christopher Kyle4,5
Affiliations
1 Department of Health Research Methods, Evidence, and Impact, McMaster University, Hamilton, ON
2 Department of Family Medicine, Queen's University, Kingston, ON
3 Peterborough Public Health, Peterborough, ON
4 Department of Forensic Science, Trent University, Peterborough, ON
5 Environmental and Life Sciences Graduate Program, Trent University, Peterborough, ON
Correspondence
Suggested citation
Piggott T, Kharbouch M, Donaldson ME, Pigeau C, Churipuy D, Pacey G, Kyle CJ. Wastewater surveillance for earlier detection of seniors congregate living COVID-19 outbreaks in Peterborough, Ontario. Can Commun Dis Rep 2023;49(2/3):35–43. https://doi.org/10.14745/ccdr.v49i23a02
Keywords: COVID-19, wastewater surveillance, congregate living facilities
Abstract
The coronavirus disease 2019 (COVID-19) pandemic has disproportionately affected seniors living in congregate living settings. The evolving surveillance context has led to novel use of wastewater surveillance to monitor levels of severe acute respiratory syndrome coronavirus 2 (SARS-CoV-2) in these settings. This study presents a pilot of upstream congregate living wastewater surveillance of SARS-CoV-2 for the detection of COVID-19 outbreaks and the effects of early public health interventions. We monitored localized wastewater SARS-CoV-2 levels from four congregate living settings March 15, 2021 to October 1, 2022 and correlated these levels with suspected and confirmed COVID-19 outbreaks determined by other methods. We identified five wastewater signals that correlated with confirmed outbreaks and three wastewater signals that did not correlate with subsequent outbreaks. In the five confirmed outbreaks, the wastewater signal was detected 2–10 days (median, five days) prior to confirmation of the outbreak by case testing. This pilot demonstrates upstream sampling for SARS-CoV-2 in wastewater may effectively detect outbreaks prior to their detection through symptomatic case testing and could support a balanced approach to outbreak response in congregate living settings, leading to increased wellbeing of these residents.
Introduction
The coronavirus disease 2019 (COVID-19) pandemic has disproportionately affected seniors—particularly those living in congregate care homes Footnote 1 Footnote 2. Congregate care settings, such as retirement and long-term care homes, carry a greater risk of spread of communicable diseases such as COVID-19, due to the close contact proximity of residents, and a greater risk of burden of outbreaks due to a higher proportion of residents with risk factors for severe disease, including medical comorbidities and age Footnote 2.
Wastewater surveillance for severe acute respiratory syndrome coronavirus 2 (SARS-CoV-2) has become a mainstay of surveillance and has proven to be tremendously important in informing the continued COVID-19 pandemic response as the pandemic has evolved and availability of individual level testing has decreased. Wastewater surveillance has informed policy decisions on public health measures and public health risk communication pertaining to current transmission levels. Congregate living settings continue to be a high-risk location for outbreaks of COVID-19, even after the advent of COVID-19 vaccinations Footnote 3. Detection and early intervention, with other outbreak control measures, continue to be important to decrease morbidity and mortality of COVID-19 outbreaks in congregate living settings. Wastewater surveillance in congregate living settings for seniors has been proposed in both published protocols and articles Footnote 4 Footnote 5 Footnote 6 Footnote 7 Footnote 8; however, no research to date has evaluated wastewater surveillance at an institution level in congregate living settings for seniors and compared these data with available COVID-19 case and outbreak information.
In the Peterborough Public Health region, wastewater surveillance for SARS-CoV-2 has been conducted in collaboration with Peterborough Public Health and Trent University through the Ministry of the Environment, Conservation and Parks funding program Footnote 9. Wastewater surveillance began in the region in January 2021 at nine sampling sites and progressed to include 18 sampling sites.
Peterborough Public Health follows provincial (Ontario) COVID-19 outbreak guidance. At the time of the outbreaks included in this article (March 15, 2021–October 1, 2022), the definition of a probable case was one with both compatible symptoms and an epi-link, and a confirmed case required laboratory testing confirmation Footnote 10. In congregate living settings, including in the retirement homes as we discuss here, the suspect outbreak definition for this period was one positive molecular test or rapid antigen test (RAT) in a resident Footnote 11. A confirmed outbreak was defined as two or more residents and/or staff/visitors with positive polymerase chain reaction (PCR) test or RAT in a 10 day period Footnote 11.
Due to the burden experienced by congregate living facilities, a pilot of upstream wastewater collection for congregate living settings was initiated in collaboration with the homes. The purpose of this study was to assess the utility of upstream wastewater sampling at congregate living settings to detect and track outbreaks of COVID-19. As these data were collected as part of routine surveillance and all facilities have been anonymized. The study did not require research ethics board approval.
This article presents an outbreak summary and rapid communication on the experience of Peterborough Public Health and the use of congregate living facility wastewater data for COVID-19 surveillance.
Current situation
The four congregate living settings were selected among the various such sites in the region on a convenience basis due to willingness to participate, facility size and logistical feasibility. The total number of sites included was driven by budgetary constraints. Logistical considerations included ease of sampling a unique wastewater site (e.g. one site was deemed not feasible due to an inability to isolate a sampling location independent of other effluent sources). Sampling location was chosen in such a way that the sewage system was confirmed to be unique to the facility. Sites were selected in collaboration between Peterborough Public health, Trent University and local congregate living setting operators.
Sampling was initiated on March 15, 2021, at three congregate living sites, and a fourth site was added on May 14, 2021. The wastewater sampling frequency was at least three times per week during the pilot period, but often increased to five times per week when SARS-CoV-2 levels were elevated.
The public health unit epidemiological team worked with Trent University researchers to identify key case studies that constituted all wastewater signals and/or confirmed outbreaks that had occurred at any of the congregate living settings included in the pilot from the period of March 15, 2021 until October 1, 2022. Each case study was plotted in a traditional epi curve bar chart denoting confirmed and probable cases, and both normalized and non-normalized N1 N2 copies per millimetres were plotted by line graph. In keeping with provincial case definitions in Ontario, confirmed cases were diagnosed by nasopharyngeal swab PCR test for COVID-19 and probable cases were defined as RAT positive and symptomatic (not all cases elected to undergo PCR after a positive RAT). The date of wastewater signal detection was defined as any increase above one copy per millimetres by PCR testing.
We assessed case-level data, including the date of symptom onset and date of diagnosis, in relation to the facility's wastewater signal, to assess temporality of a wastewater signal for early detection and monitoring progression of COVID-19 outbreaks in congregate living facilities. We assessed the dominant community variant from the simple majority of samples in the corresponding period of the outbreak from Public Health Ontario SARS-CoV-2 Genomic Surveillance in Ontario Reports Footnote 12. The primary outcome measure was defined as the "date delta", which is the difference (in days) between the date of wastewater signal detection and the date of a confirmed outbreak. A negative date delta signifies that the wastewater signal preceded the confirmation of the outbreak in that facility.
"Preventive" outbreak guidance was developed by the Peterborough Public Health Infectious Diseases team and Medical Officer of Health drawing from current outbreak control guidance in Ontario and in consultation with Public Health Ontario. The preventive outbreak guidance is available in Appendix. This guidance was elective for congregate care settings and was intended to be less burdensome on residents than traditional outbreak measures; however, it was hoped that these measures would decrease early transmission and thus lessen or avert the outbreaks. Public health nurses/inspectors from the infectious disease team began issuing preventive outbreak guidance to congregate living setting operators participating in the pilot beginning in September 2022.
Assessment
There were five confirmed outbreaks at these four congregate living settings during the pilot period. Additionally, there were three instances of detection wastewater signals that did not ultimately lead to confirmed outbreaks. Table 1 presents all wastewater detections/confirmed outbreaks during the pilot period.
| Congregate living setting number and outbreak letter | Dominant community variant | Confirmed outbreak detection date | Wastewater surveillance date | Date preventive guidance issued | Date delta | Number of confirmed cases | Number of probable cases |
|---|---|---|---|---|---|---|---|
| 1a (Figure 1) | Omicron BA.1 | Jan 8, 2022 | Dec 29, 2021 | N/A | -10 | 70 | 4 |
| 1b (Figure 2) | Omicron BA.5 | N/A | Aug 24, 2022 | Aug 31, 2022 | N/A | 0 | 0 |
| 2a (Figure 3) | Omicron BA.5 | N/A | Aug 5, 2022 | Aug 16, 2022 | N/A | 0 | 0 |
| 2b (Figure 4) | Omicron BA.5 | Sept 12, 2022 | Sept 7, 2022 | Sept 12, 2022 | -5 | 17 | 9 |
| 3a (Figure 5) | Omicron BA.5 | Sept 6, 2022 | Sept 4, 2022 | Sept 6, 2022 | -2 | 6 | 22 |
| 4a (Figure 6) | Omicron BA.1 | N/A | Feb 7, 2022 | N/A | N/A | 0 | 0 |
| 4b (Figure 7) | Omicron BA.2 | Mar 31, 2022 | Mar 25, 2022 | N/A | -6 | 8 | 1 |
| 4c (Figure 8) | Omicron BA.5 | Sept 21, 2022 | Sept 18, 2022 | Sept 21, 2022 | -3 | 44 | 5 |
|
|||||||
Figures 1 to 8 present epi curves for all wastewater detections and confirmed outbreaks. We present the data from two outbreaks, where evidence from the wastewater did or may have influenced early detection and public health action. We report a negative date delta for all five confirmed outbreaks ranging from -10 to -2 (median, -5). Notably, the date delta decreased with the progression of Omicron sub-variants implicated in community transmission at the time of outbreak detection. Outbreaks during BA.1/2 transmission had a longer date delta (-6, -10, respectively) than outbreaks during BA.4/5 transmission (-2, -3, respectively).
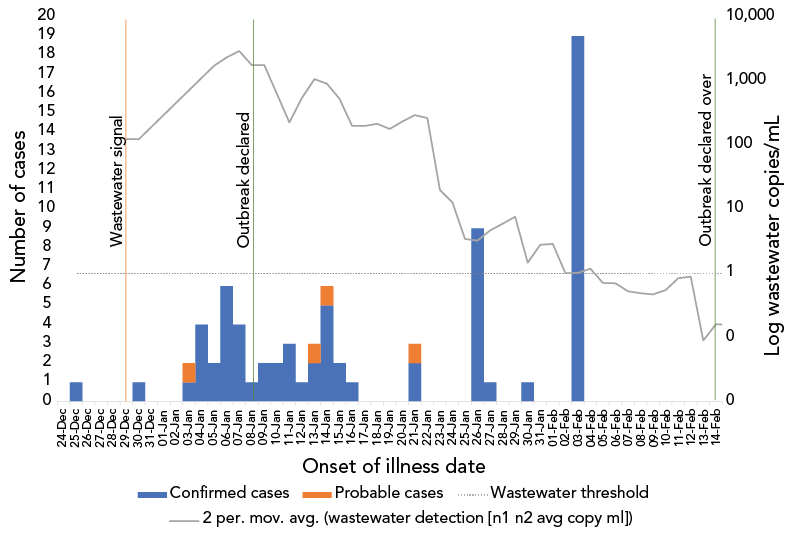
Figure 1 - Text description
| Onset date | Confirmed cases | Probable cases | Wastewater detection (n1 n2 avg copy ml) |
Wastewater detection (n1 n2 avg normalized) |
Wastewater threshold |
|---|---|---|---|---|---|
| 24-Dec | 0 | 0 | 0 | 0 | 1 |
| 25-Dec | 1 | 0 | 0 | 0 | 1 |
| 26-Dec | 0 | 0 | 0 | 0 | 1 |
| 27-Dec | 0 | 0 | 0 | 0 | 1 |
| 28-Dec | 0 | 0 | 0 | 0 | 1 |
| 29-Dec | 0 | 0 | 123.89 | 1,486.43 | 1 |
| 30-Dec | 1 | 0 | 0 | 0 | 1 |
| 31-Dec | 0 | 0 | 0 | 0 | 1 |
| 01-Jan | 0 | 0 | 0 | 0 | 1 |
| 02-Jan | 0 | 0 | 0 | 0 | 1 |
| 03-Jan | 1 | 1 | 0 | 0 | 1 |
| 04-Jan | 4 | 0 | 0 | 0 | 1 |
| 05-Jan | 2 | 0 | 1,728.29 | 1,346.94 | 1 |
| 06-Jan | 6 | 0 | 2,930.59 | 1,780.43 | 1 |
| 07-Jan | 4 | 0 | 0 | 0 | 1 |
| 08-Jan | 1 | 0 | 1,769.31 | 1,507.54 | 1 |
| 09-Jan | 2 | 0 | 0 | 0 | 1 |
| 10-Jan | 2 | 0 | 0 | 0 | 1 |
| 11-Jan | 3 | 0 | 225.88 | 728.85 | 1 |
| 12-Jan | 1 | 0 | 862.52 | 207.55 | 1 |
| 13-Jan | 2 | 1 | 1,279.57 | 1,600.59 | 1 |
| 14-Jan | 5 | 1 | 527.29 | 63.17 | 1 |
| 15-Jan | 2 | 0 | 0 | 0 | 1 |
| 16-Jan | 1 | 0 | 198.7 | 106.17 | 1 |
| 17-Jan | 0 | 0 | 0 | 0 | 1 |
| 18-Jan | 0 | 0 | 215.2 | 3.42 | 1 |
| 19-Jan | 0 | 0 | 142.06 | 736.91 | 1 |
| 20-Jan | 0 | 0 | 323.74 | 316.9 | 1 |
| 21-Jan | 2 | 1 | 263.85 | 134.13 | 1 |
| 22-Jan | 0 | 0 | 0 | 0 | 1 |
| 23-Jan | 0 | 0 | 20.05 | 14.11 | 1 |
| 24-Jan | 0 | 0 | 5.48 | 1.18 | 1 |
| 25-Jan | 0 | 0 | 1.41 | 0.05 | 1 |
| 26-Jan | 9 | 0 | 5.08 | 0.46 | 1 |
| 27-Jan | 1 | 0 | 4.26 | 0.38 | 1 |
| 28-Jan | 0 | 0 | 7.63 | 0.06 | 1 |
| 29-Jan | 0 | 0 | 0 | 0 | 1 |
| 30-Jan | 1 | 0 | 1.47 | 0.42 | 1 |
| 31-Jan | 0 | 0 | 4.11 | 0.04 | 1 |
| 01-Feb | 0 | 0 | 1.65 | 0.03 | 1 |
| 02-Feb | 0 | 0 | 0.37 | 0.03 | 1 |
| 03-Feb | 19 | 0 | 1.66 | 0.73 | 1 |
| 04-Feb | 0 | 0 | 0.71 | 0 | 1 |
| 05-Feb | 0 | 0 | 0 | 0 | 1 |
| 06-Feb | 0 | 0 | 0.7 | 0 | 1 |
| 07-Feb | 0 | 0 | 0.35 | 0 | 1 |
| 08-Feb | 0 | 0 | 0.63 | 0 | 1 |
| 09-Feb | 0 | 0 | 0.31 | 0 | 0 |
| 10-Feb | 0 | 0 | 0.79 | 0 | 0 |
| 11-Feb | 0 | 0 | 0.89 | 0 | 0 |
| 12-Feb | 0 | 0 | 0 | 0 | 0 |
| 13-Feb | 0 | 0 | 0.09 | 0 | 0 |
| 14-Feb | 0 | 0 | 0.23 | 0 | 0 |
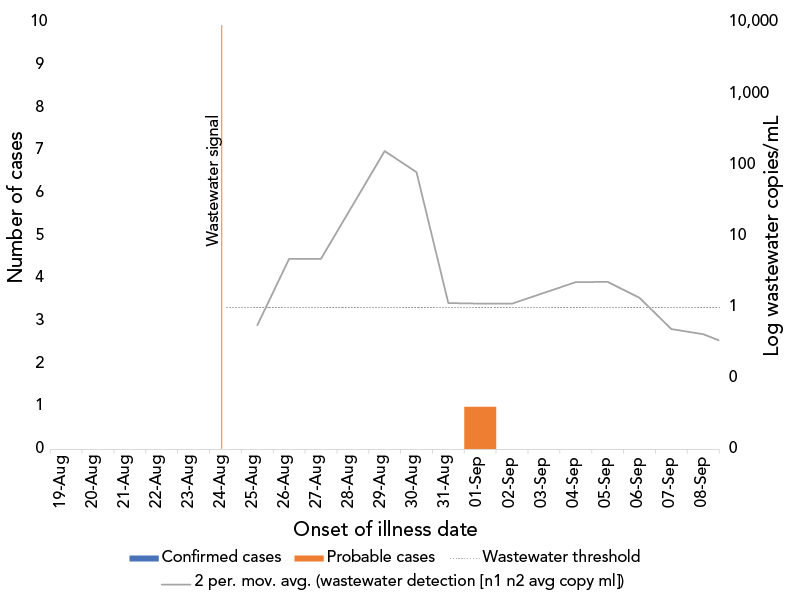
Figure 2 - Text description
| Onset date | Confirmed cases | Probable cases | Wastewater detection (n1 n2 avg copy ml) | Wastewater threshold | Wastewater detection (n1 n2 avg normalized) |
|---|---|---|---|---|---|
| 19-Aug | 0 | 0 | 0 | 1 | 0 |
| 20-Aug | 0 | 0 | 0 | 1 | 0 |
| 21-Aug | 0 | 0 | 0 | 1 | 0 |
| 22-Aug | 0 | 0 | 0 | 1 | 0 |
| 23-Aug | 0 | 0 | 0 | 1 | 0 |
| 24-Aug | 0 | 0 | 0.56 | 1 | 0.02 |
| 25-Aug | 0 | 0 | 0 | 1 | 0 |
| 26-Aug | 0 | 0 | 4.82 | 1 | 0.01 |
| 27-Aug | 0 | 0 | 0 | 1 | 0 |
| 28-Aug | 0 | 0 | 0 | 1 | 0 |
| 29-Aug | 0 | 0 | 158.59 | 1 | 0.2 |
| 30-Aug | 0 | 0 | 1.15 | 1 | 0 |
| 31-Aug | 0 | 0 | 0 | 1 | 0 |
| 01-Sep | 0 | 1 | 1.13 | 1 | 0 |
| 02-Sep | 0 | 0 | 0 | 1 | 0 |
| 03-Sep | 0 | 0 | 0 | 1 | 0 |
| 04-Sep | 0 | 0 | 2.27 | 1 | 0 |
| 05-Sep | 0 | 0 | 2.3 | 1 | 0 |
| 06-Sep | 0 | 0 | 0.43 | 1 | 0 |
| 07-Sep | 0 | 0 | 0.56 | 1 | 0 |
| 08-Sep | 0 | 0 | 0.28 | 1 | 0 |
| 09-Sep | 0 | 0 | 0 | 1 | 0 |
| 10-Sep | 0 | 0 | 0 | 1 | 0 |
| 11-Sep | 0 | 0 | 0 | 1 | 0 |
| 12-Sep | 0 | 0 | 0 | 1 | 0 |
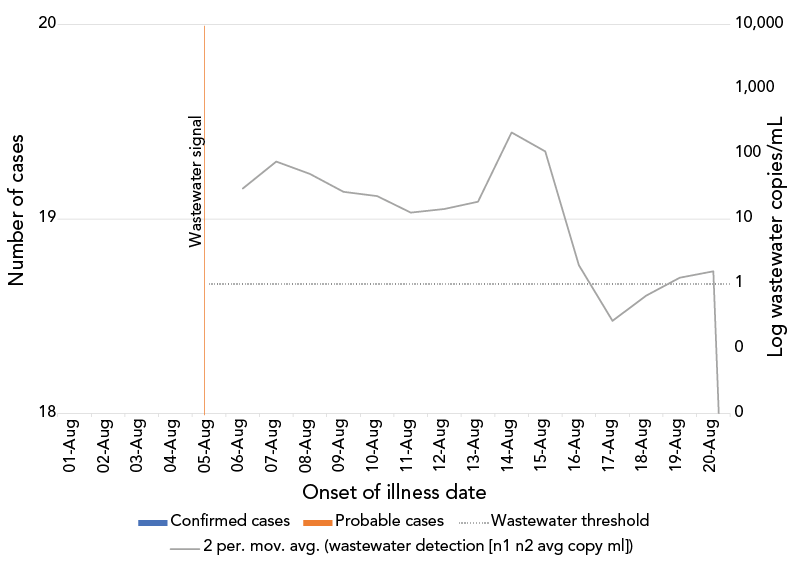
Figure 3 - Text description
| Onset date | Confirmed cases | Probable cases | Wastewater detection (n1 n2 avg copy ml) |
Wastewater threshold |
|---|---|---|---|---|
| 31-Jul | 0 | 0 | 0 | 1 |
| 01-Aug | 0 | 0 | 0.22 | 1 |
| 02-Aug | 0 | 0 | 0 | 1 |
| 03-Aug | 0 | 0 | 0 | 1 |
| 04-Aug | 0 | 0 | 0.17 | 1 |
| 05-Aug | 0 | 0 | 29.58 | 1 |
| 06-Aug | 0 | 0 | 0 | 1 |
| 07-Aug | 0 | 0 | 77.26 | 1 |
| 08-Aug | 0 | 0 | 22.48 | 1 |
| 09-Aug | 0 | 0 | 30.27 | 1 |
| 10-Aug | 0 | 0 | 15.09 | 1 |
| 11-Aug | 0 | 0 | 10.14 | 1 |
| 12-Aug | 0 | 0 | 18.57 | 1 |
| 13-Aug | 0 | 0 | 0 | 1 |
| 14-Aug | 0 | 0 | 217.65 | 1 |
| 15-Aug | 0 | 0 | 3.75 | 1 |
| 16-Aug | 0 | 0 | 0.15 | 1 |
| 17-Aug | 0 | 0 | 0.39 | 1 |
| 18-Aug | 0 | 0 | 0.93 | 1 |
| 19-Aug | 0 | 0 | 1.57 | 1 |
| 20-Aug | 0 | 0 | 0 | 1 |
| 21-Aug | 0 | 0 | 0 | 1 |
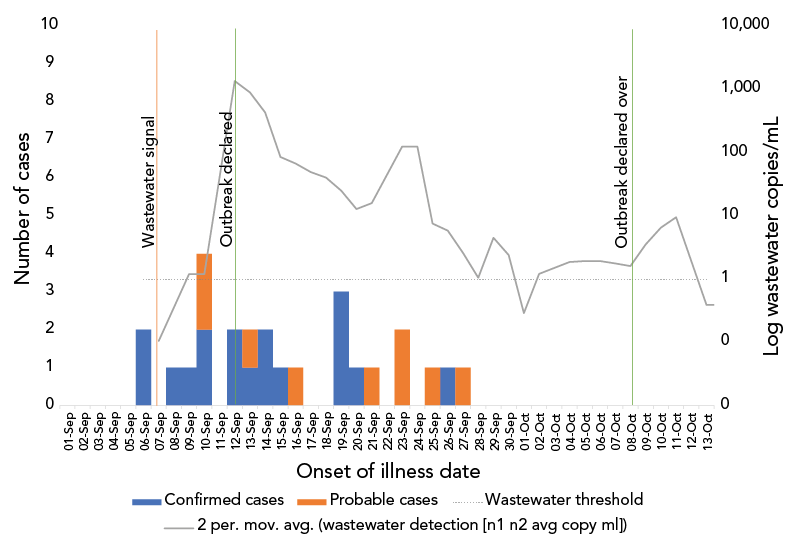
Figure 4 - Text description
| Onset date | Confirmed cases | Probable cases | Wastewater detection (n1 n2 avg copy ml) | Wastewater threshold | Wastewater detection (n1 n2 avg normalized) |
|---|---|---|---|---|---|
| 19-Aug | 0 | 0 | 0 | 1 | 0 |
| 20-Aug | 0 | 0 | 0 | 1 | 0 |
| 21-Aug | 0 | 0 | 0 | 1 | 0 |
| 22-Aug | 0 | 0 | 0 | 1 | 0 |
| 23-Aug | 0 | 0 | 0 | 1 | 0 |
| 24-Aug | 0 | 0 | 0.56 | 1 | 0.02 |
| 25-Aug | 0 | 0 | 0 | 1 | 0 |
| 26-Aug | 0 | 0 | 4.82 | 1 | 0.01 |
| 27-Aug | 0 | 0 | 0 | 1 | 0 |
| 28-Aug | 0 | 0 | 0 | 1 | 0 |
| 29-Aug | 0 | 0 | 158.59 | 1 | 0.2 |
| 30-Aug | 0 | 0 | 1.15 | 1 | 0 |
| 31-Aug | 0 | 0 | 0 | 1 | 0 |
| 01-Sep | 0 | 1 | 1.13 | 1 | 0 |
| 02-Sep | 0 | 0 | 0 | 1 | 0 |
| 03-Sep | 0 | 0 | 0 | 1 | 0 |
| 04-Sep | 0 | 0 | 2.27 | 1 | 0 |
| 05-Sep | 0 | 0 | 2.3 | 1 | 0 |
| 06-Sep | 0 | 0 | 0.43 | 1 | 0 |
| 07-Sep | 0 | 0 | 0.56 | 1 | 0 |
| 08-Sep | 0 | 0 | 0.28 | 1 | 0 |
| 09-Sep | 0 | 0 | 0 | 1 | 0 |
| 10-Sep | 0 | 0 | 0 | 1 | 0 |
| 11-Sep | 0 | 0 | 0 | 1 | 0 |
| 12-Sep | 0 | 0 | 0 | 1 | 0 |
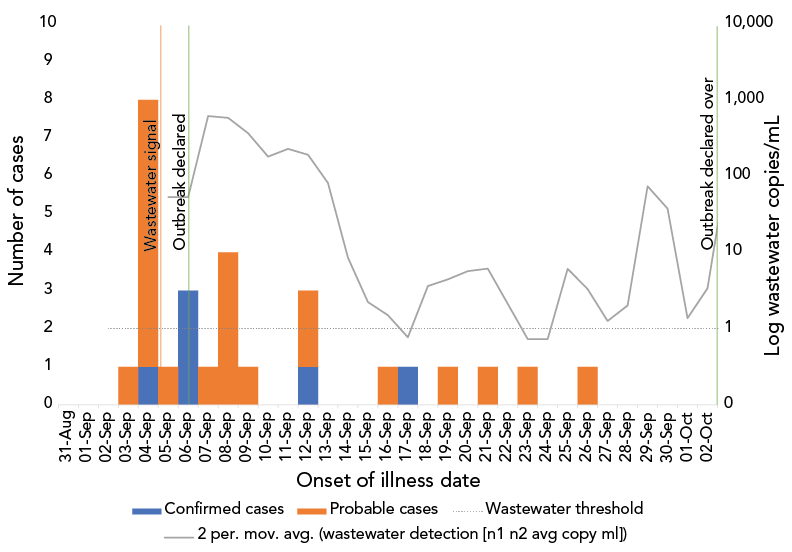
Figure 5 - Text description
| Onset date | Confirmed cases | Probable cases | Wastewater detection (n1 n2 avg copy ml) | Wastewater detection (n1 n2 avg normalized) | Wastewater threshold |
|---|---|---|---|---|---|
| 31-Aug | 0 | 0 | 0 | 0 | 1 |
| 01-Sep | 0 | 0 | 0 | 0 | 1 |
| 02-Sep | 0 | 0 | 0 | 0 | 1 |
| 03-Sep | 0 | 1 | 0 | 0 | 1 |
| 04-Sep | 1 | 7 | 0 | 0 | 1 |
| 05-Sep | 0 | 1 | 53.3 | 19.93 | 1 |
| Outbreak declared date | |||||
| 06-Sep | 3 | 0 | 0 | 0 | 1 |
| 07-Sep | 0 | 1 | 614.77 | 287.21 | 1 |
| 08-Sep | 0 | 4 | 550.76 | 182.02 | 1 |
| 09-Sep | 0 | 1 | 180.41 | 55.85 | 1 |
| 10-Sep | 0 | 0 | 0 | 0 | 1 |
| 11-Sep | 0 | 0 | 227.87 | 20.76 | 1 |
| 12-Sep | 1 | 2 | 154.11 | 6.24 | 1 |
| 13-Sep | 0 | 0 | 8.55 | 24.62 | 1 |
| 14-Sep | 0 | 0 | 0 | 0 | 1 |
| 15-Sep | 0 | 0 | 2.23 | 2.1 | 1 |
| 16-Sep | 0 | 1 | 0.77 | 0.04 | 1 |
| 17-Sep | 1 | 0 | 0 | 0 | 1 |
| 18-Sep | 0 | 0 | 3.62 | 0.76 | 1 |
| 19-Sep | 0 | 1 | 5.23 | 2 | 1 |
| 20-Sep | 0 | 0 | 6.13 | 1.62 | 1 |
| 21-Sep | 0 | 1 | 0 | 0 | 1 |
| 22-Sep | 0 | 0 | 0 | 0 | 1 |
| 23-Sep | 0 | 1 | 0.73 | 0.3 | 1 |
| 24-Sep | 0 | 0 | 0 | 0 | 1 |
| 25-Sep | 0 | 0 | 6.09 | 4.03 | 1 |
| 26-Sep | 0 | 1 | 0.51 | 0.12 | 1 |
| 27-Sep | 0 | 0 | 2.01 | 0 | 1 |
| 28-Sep | 0 | 0 | 0 | 0 | 1 |
| 29-Sep | 0 | 0 | 73.71 | 0 | 1 |
| 30-Sep | 0 | 0 | 1.37 | 0 | 1 |
| 01-Oct | 0 | 0 | 0 | 0 | 1 |
| 02-Oct | 0 | 0 | 3.38 | 0 | 1 |
| 03-Oct | 0 | 0 | 271.11 | 0 | 1 |
| 04-Oct | 0 | 0 | 0 | 0 | 1 |
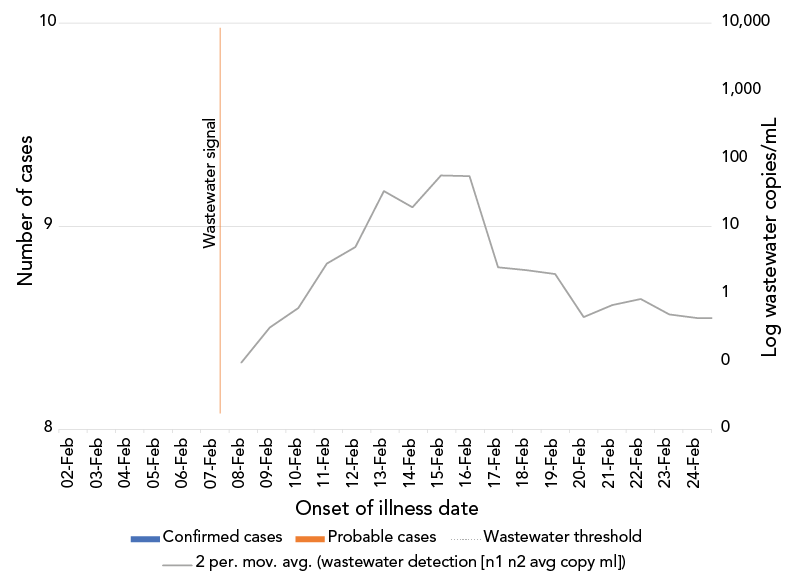
Figure 6 - Text description
| Onset date | Confirmed cases | Probable cases | Wastewater detection (n1 n2 avg copy ml) | Wastewater detection (n1 n2 avg normalized) | Wastewater threshold |
|---|---|---|---|---|---|
| 02-Feb | 0 | 0 | 0.2 | 0 | 1 |
| 03-Feb | 0 | 0 | 0 | 0 | 1 |
| 04-Feb | 0 | 0 | 0.24 | 0 | 1 |
| 05-Feb | 0 | 0 | 0 | 0 | 1 |
| 06-Feb | 0 | 0 | 0.22 | 0 | 1 |
| 07-Feb | 0 | 0 | 0.09 | 0.01 | 1 |
| 08-Feb | 0 | 0 | 0.09 | 0.02 | 1 |
| 09-Feb | 0 | 0 | 0.5 | 0.15 | 1 |
| 10-Feb | 0 | 0 | 0.64 | 0.21 | 1 |
| 11-Feb | 0 | 0 | 4.48 | 1.24 | 1 |
| 12-Feb | 0 | 0 | 0 | 0 | 1 |
| 13-Feb | 0 | 0 | 29.75 | 5.2 | 1 |
| 14-Feb | 0 | 0 | 4.65 | 0.71 | 1 |
| 15-Feb | 0 | 0 | 96.28 | 20.02 | 1 |
| 16-Feb | 0 | 0 | 2.22 | 1.17 | 1 |
| 17-Feb | 0 | 0 | 2.3 | 0.06 | 1 |
| 18-Feb | 0 | 0 | 1.8 | 0 | 1 |
| 19-Feb | 0 | 0 | 0 | 0 | 1 |
| 20-Feb | 0 | 0 | 0.42 | 0 | 1 |
| 21-Feb | 0 | 0 | 0.84 | 0 | 1 |
| 22-Feb | 0 | 0 | 0.71 | 0 | 1 |
| 23-Feb | 0 | 0 | 0.21 | 0 | 1 |
| 24-Feb | 0 | 0 | 0.6 | 0 | 1 |
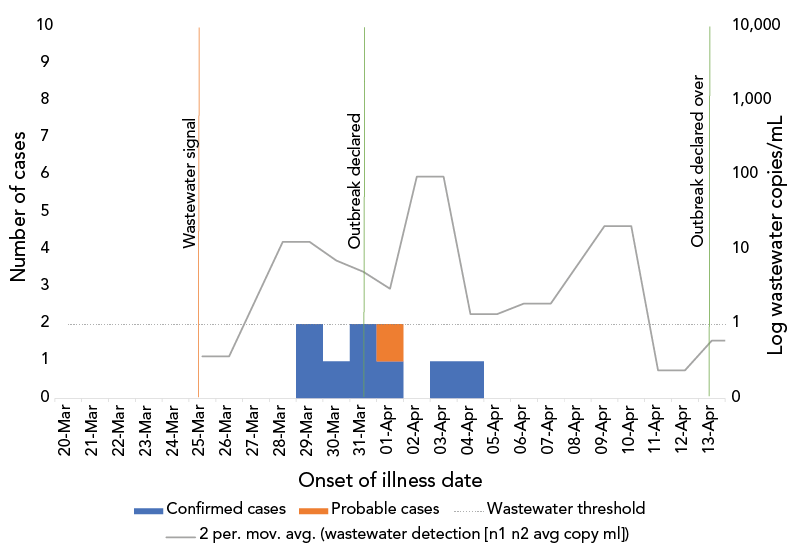
Figure 7 - Text description
| Onset date | Confirmed cases | Probable cases | Wastewater detection (n1 n2 avg copy ml) | Wastewater detection (n1 n2 avg normalized) | Wastewater threshold |
|---|---|---|---|---|---|
| 20-Mar | 0 | 0 | 0 | 0 | 1 |
| 21-Mar | 0 | 0 | 0 | 0 | 1 |
| 22-Mar | 0 | 0 | 0 | 0 | 1 |
| 23-Mar | 0 | 0 | 0 | 0 | 1 |
| 24-Mar | 0 | 0 | 0 | 0 | 1 |
| Signal detected | |||||
| 25-Mar | 0 | 0 | 0.37 | 0.29 | 1 |
| 26-Mar | 0 | 0 | 0 | 0 | 1 |
| 27-Mar | 0 | 0 | 0 | 0 | 1 |
| 28-Mar | 0 | 0 | 12.81 | 2.78 | 1 |
| 29-Mar | 2 | 0 | 0 | 0 | 1 |
| 30-Mar | 1 | 0 | 7.17 | 2.87 | 1 |
| Outbreak declared date | |||||
| 31-Mar | 2 | 0 | 3 | 1.71 | 1 |
| 01-Apr | 1 | 1 | 0 | 0 | 1 |
| 02-Apr | 0 | 0 | 96.28 | 20.02 | 1 |
| 03-Apr | 1 | 0 | 0 | 0 | 1 |
| 04-Apr | 1 | 0 | 1.37 | 0.06 | 1 |
| 05-Apr | 0 | 0 | 0 | 0 | 1 |
| 06-Apr | 0 | 0 | 1.9 | 0.37 | 1 |
| 07-Apr | 0 | 0 | 0 | 0 | 1 |
| 08-Apr | 0 | 0 | 0 | 0 | 1 |
| 09-Apr | 0 | 0 | 20.87 | 1.41 | 1 |
| 10-Apr | 0 | 0 | 0 | 0 | 1 |
| 11-Apr | 0 | 0 | 0.24 | 0.02 | 1 |
| 12-Apr | 0 | 0 | 0 | 0 | 1 |
| Outbreak declared over | |||||
| 13-Apr | 0 | 0 | 0.6 | 0.05 | 1 |
| 14-Apr | 0 | 0 | 0 | 0 | 1 |
| 15-Apr | 0 | 0 | 0 | 0 | 1 |
| 16-Apr | 0 | 0 | 7.46 | 4.4 | 1 |
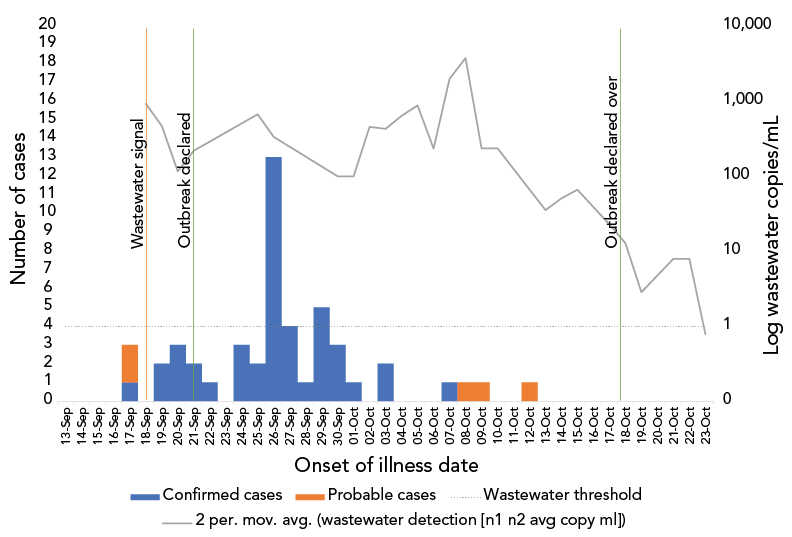
Figure 8 - Text description
| Onset date | Confirmed cases | Probable cases | Wastewater detection (n1 n2 avg copy ml) | Wastewater detection (n1 n2 avg normalized) | Wastewater threshold |
|---|---|---|---|---|---|
| 13-Sep | 0 | 0 | 0 | 0 | 1 |
| 14-Sep | 0 | 0 | 0 | 0 | 1 |
| 15-Sep | 0 | 0 | 0 | 0 | 1 |
| 16-Sep | 0 | 0 | 0 | 0 | 1 |
| 17-Sep | 1 | 2 | 0 | 0 | 1 |
| Signal detected | |||||
| 18-Sep | 0 | 0 | 915.74 | 26.96 | 1 |
| 19-Sep | 2 | 0 | 13.42 | 1.92 | 1 |
| 20-Sep | 3 | 0 | 216.32 | 25.69 | 1 |
| Outbreak declared date | |||||
| 21-Sep | 2 | 0 | 0 | 0 | 1 |
| 22-Sep | 1 | 0 | 0 | 0 | 1 |
| 23-Sep | 0 | 0 | 0 | 0 | 1 |
| 24-Sep | 3 | 0 | 0 | 0 | 1 |
| 25-Sep | 2 | 0 | 661.89 | 55.53 | 1 |
| 26-Sep | 13 | 0 | 0 | 0 | 1 |
| 27-Sep | 4 | 0 | 0 | 0 | 1 |
| 28-Sep | 1 | 0 | 0 | 0 | 1 |
| 29-Sep | 5 | 0 | 0 | 0 | 1 |
| 30-Sep | 3 | 0 | 98.8 | 8.46 | 1 |
| 01-Oct | 1 | 0 | 0 | 0 | 1 |
| 02-Oct | 0 | 0 | 450.55 | 43.87 | 1 |
| 03-Oct | 2 | 0 | 395.49 | 124.87 | 1 |
| 04-Oct | 0 | 0 | 868.05 | 81.16 | 1 |
| 05-Oct | 0 | 0 | 0 | 0 | 1 |
| 06-Oct | 0 | 0 | 230.93 | 45.62 | 1 |
| 07-Oct | 1 | 0 | 3705.41 | 557.73 | 1 |
| 08-Oct | 0 | 1 | 0 | 0 | 1 |
| 09-Oct | 0 | 1 | 233.22 | 36.77 | 1 |
| 10-Oct | 0 | 0 | 0 | 0 | 1 |
| 11-Oct | 0 | 0 | 0 | 0 | 1 |
| 12-Oct | 0 | 1 | 0 | 0 | 1 |
| 13-Oct | 0 | 0 | 35.07 | 12.87 | 1 |
| 14-Oct | 0 | 0 | 65.51 | 0 | 1 |
| 15-Oct | 0 | 0 | 0 | 0 | 1 |
| 16-Oct | 0 | 0 | 0 | 0 | 1 |
| 17-Oct | 0 | 0 | 22.59 | 0 | 1 |
| Outbreak declared over | |||||
| 18-Oct | 0 | 0 | 2.83 | 0 | 1 |
| 19-Oct | 0 | 0 | 0 | 0 | 1 |
| 20-Oct | 0 | 0 | 0 | 0 | 1 |
| 21-Oct | 0 | 0 | 7.87 | 0 | 1 |
| 22-Oct | 0 | 0 | 0 | 0 | 1 |
| 23-Oct | 0 | 0 | 0.78 | 0 | 1 |
Retirement Home Outbreak #1a (see Figure 1) experienced an outbreak of relatively long duration, lasting 37 days, from January 8 to February 14, 2022. As the outbreak progressed, the wastewater surveillance proved useful in identifying when transmission had lessened and the outbreak was over, though cohort testing detected asymptomatic cases who were likely infected and not detected earlier in the outbreak. On January 26, 2022 and February 3, 2022, facility-wide testing was completed as part of an intensive case finding surveillance exercise. On January 26, nine new individuals were identified as COVID-19 positive without a history of symptoms, and on February 3, nineteen new individuals were identified as positive. These cases presented a challenge in interpretation to the outbreak team—were these previously asymptomatic cases or early infections? However, in contextualizing with symptoms (most were asymptomatic) and the wastewater signal (which had lessened substantially), we were able to place greater confidence that these cases were previously undetected and not continued outbreak transmission. Relying on the wastewater signal, Peterborough Public Health was, therefore, able to declare the outbreak over earlier than we otherwise may have, based solely on the number of PCR-test confirmed cases. This resulted in a return to socialization, resident services and thus a better quality of life for the residents.
Figures 2, 3, 6 demonstrate instances where a wastewater signal was detected, but no confirmed outbreak was ultimately declared; this could have been due to a lack of testing conducted or asymptomatic or pauci-symptomatic cases in residents, staff or visitors who were never diagnosed.
Figure 4 demonstrates an outbreak where a wastewater signal was identified in retrospect five days before a confirmed case and an outbreak was declared, however, due to delays in lab reporting the preventive guidance and checklist (Supplemental material) was shared the same date as an outbreak was subsequently declared.
Figure 5 demonstrates an outbreak in the period of Omicron BA.5 transmission, where the confirmation was just two days after, in retrospect a wastewater signal was detected. This is similar to Figure 8, which also demonstrates a BA.5 outbreak with only three days between a wastewater signal and a declared outbreak.
In contrast, Figure 7 demonstrates an outbreak where the wastewater signal was detected eight days prior to the confirmation of an outbreak.
Implications
This pilot study presents compelling evidence that wastewater sampling in congregate living settings could support early identification of SARS-CoV-2 and mitigation of COVID-19 outbreak spread. The possible utility of early wastewater SARS-CoV-2 detection and intervention was demonstrated in this pilot. This is the first study to comprehensively assess person-level testing and outbreak data in relation to wastewater surveillance in the congregate living setting for seniors.
The utility of early detection and intervention may have decreased with the advent of more rapidly transmissible variants because these variants may also demonstrate different viral kinetics, which would impact gastrointestinal shedding and thus wastewater detection. We did track variants of concern within a subset of the processed samples, which demonstrated differing variants than dominant when analyzed at the provincial-level. This may be useful where variants have different transmissibility or immune-escape characteristics to direct local public health action.
Given the decreases in individual testing efforts, wastewater surveillance initiatives such as this continue to hold importance for tracking the continued COVID-19 pandemic and emerging variants. Wastewater surveillance has garnered significant interest during the COVID-19 pandemic. This activity is relatively cost-effective in relation to individual-level testing for monitoring of transmission levels of COVID-19 at the community level Footnote 13 Footnote 14.
Much of the modifiable non-pharmacological interventions recommended to reduce transmission through the COVID-19 pandemic (e.g. masking, cessation of social activities or isolation of infectious individuals) can be linked to reductions in community transmission levels. In addition, social isolation in congregate living settings due to outbreak response measures has been significant Footnote 15. Therefore, a balanced approach in responding to outbreaks, advocating for structural improvements such as ventilation improvements is important, and to date has been inadequate Footnote 16.
The use of upstream wastewater sampling of congregate living settings—and the resultant targeted early interventions to mitigate or arrest the transmission of COVID-19—warrants further consideration as part of the ongoing response to the COVID-19 pandemic. Further research should also assess the possible implications of "false positive" signal detection: the signals that do not result in a declared outbreak in this setting likely represent asymptomatic or pauci-symptomatic cases in staff/visitors/residents, which do not result in further transmission. Preventive actions in scenarios where transmission does not ultimately occur may lead to potential unintended consequences. Additionally, further research is required to assess whether the signal detection and implementation of preventive outbreak guidance is able to change the trajectory of outbreak transmission.
Conclusion
The potential for upstream wastewater sampling in congregate settings can be expanded beyond SARS-CoV-2 detection to a spectrum of other respiratory pathogens Footnote 11, which are experiencing a resurgence that threatens these populations. We have recently incorporated screening for influenza and respiratory syncytial virus into wastewater testing to explore the utility of this technique beyond COVID-19.
Authors' statement
TP — Conceptualization, data curation, formal analysis, investigation, methodology, project administration, resources, supervision, software, validation, visualization, roles/writing original draft, writing–review and editing
MK — Formal analysis, investigation, methodology, software, validation, roles/writing original draft, writing–review and editing
MED — Lab data analysis, lab methodology, data mining, lab quality control
CP — Formal analysis, investigation, methodology, software, validation, writing–review and editing
DC — Formal analysis, investigation, methodology, writing–review and editing
GP — Formal analysis, investigation, methodology, writing–review and editing
CJK — Conceptualization, data curation, formal analysis, investigation, methodology, project administration, resources, supervision, software, validation, visualization, roles/writing original draft, writing–review and editing
Competing interests
TP, MK, CP, DC, GP are employed by Peterborough Public Health, and have no other interests to declare.
Acknowledgements
We would like to acknowledge the funding from the Ministry of the Environment, Conservation and Parks Ontario Wastewater Surveillance Initiative, Trent University, and Peterborough Public Health for support for this project. We would also like to thank the four congregate care homes and local municipalities who collaborated for the wastewater surveillance program. Finally, we would like to thank field staff that worked diligently throughout the pandemic including braving inclement weather to collect samples and continue to provide valuable information for the congregate care homes and our communities.
Funding
Funding (CK, MED) for the wastewater surveillance pilot was provided through the Ministry of the Environment, Conservation and Parks Ontario's Wastewater Surveillance Initiative.
Supplemental material
These documents can be accessed on the Supplemental material file.
Wastewater COVID-19 Early Detection Control Measures Checklist for Institutions
References
- Footnote 1
-
Ma H, Yiu KC, Baral SD, Fahim C, Moloney G, Darvin D, Landsman D, Chan AK, Straus S, Mishra S. COVID-19 Cases Among Congregate Care Facility Staff by Neighborhood of Residence and Social and Structural Determinants: observational Study. JMIR Public Health Surveill 2022;8(10):e34927. https://doi.org/10.2196/34927
- Footnote 2
-
Public Health Agency of Canada. Infection prevention and control for COVID-19: Interim guidance for long-term care homes. Ottawa, ON: PHAC; updated 2021. https://www.canada.ca/en/public-health/services/diseases/2019-novel-coronavirus-infection/prevent-control-covid-19-long-term-care-homes.html
- Footnote 3
-
Sabet F, Gauthier B, Siddiqui M, Wilmer A, Prystajecky N, Rydings P, Andrews M, Pollock S. COVID-19 outbreak in a long-term care facility in Kelowna, British Columbia after rollout of COVID-19 vaccine in March 2021. Can Commun Dis Rep 2021;47(12):543–52. https://doi.org/10.14745/ccdr.v47i12a05
- Footnote 4
-
Davó L, Seguí R, Botija P, Beltrán MJ, Albert E, Torres I, López-Fernández PÁ, Ortí R, Maestre JF, Sánchez G, Navarro D. Early detection of SARS-CoV-2 infection cases or outbreaks at nursing homes by targeted wastewater tracking. Clin Microbiol Infect 2021;27(7):1061–3. https://doi.org/10.1016/j.cmi.2021.02.003
- Footnote 5
-
Lee BE, Sikora C, Faulder D, Risling E, Little LA, Qiu Y, Gao T, Bulat R, Craik S, Hrudey SE, Ohinmaa A, Estabrooks CA, Gingras AC, Charlton C, Kim J, Wood H, Robinson A, Kanji JN, Zelyas N, O'Brien SF, Drews S, Pang XL. Early warning and rapid public health response to prevent COVID-19 outbreaks in long-term care facilities (LTCF) by monitoring SARS-CoV-2 RNA in LTCF site-specific sewage samples and assessment of antibodies response in this population: prospective study protocol. BMJ Open 2021;11(8):e052282. https://doi.org/10.1136/bmjopen-2021-052282
- Footnote 6
-
Colosi LM, Barry KE, Kotay SM, Porter MD, Poulter MD, Ratliff C, Simmons W, Steinberg LI, Wilson DD, Morse R, Zmick P, Mathers AJ. Development of Wastewater Pooled Surveillance of Severe Acute Respiratory Syndrome Coronavirus 2 (SARS-CoV-2) from Congregate Living Settings. Appl Environ Microbiol 2021;87(13):e0043321. https://doi.org/10.1128/AEM.00433-21
- Footnote 7
-
Science Table. COVID-19 Advisory for Ontario. Epidemiology: Public Health & Implementation. COVID-19 and Ontario's Long-Term Care Homes. https://covid19-sciencetable.ca/sciencebrief/covid-19-and-ontarios-long-term-care-homes/
- Footnote 8
-
Fisman DN, Bogoch I, Lapointe-Shaw L, McCready J, Tuite AR. Risk Factors Associated With Mortality Among Residents With Coronavirus Disease 2019 (COVID-19) in Long-term Care Facilities in Ontario, Canada. JAMA Netw Open 2020;3(7):e2015957. https://doi.org/10.1001/jamanetworkopen.2020.15957
- Footnote 9
-
Trent University. Trent University and Peterborough Public Heath Join Provincial COVID-19 Wastewater Surveillance Initiative. Peterborough, ON: Trent U; 2021. https://www.trentu.ca/news/story/29763
- Footnote 10
-
Ministry of Health (Ontario). Ontario Public Health Standards: Requirements for Programs, Services and Accountability. Infectious Disease Protocol. Appendix 1: Case Definitions and Disease-Specific Information. Toronto, ON: MOH; 2022. https://health.gov.on.ca/en/pro/programs/publichealth/coronavirus/docs/2019_case_definition.pdf
- Footnote 11
-
Ministry of Health (Ontario). COVID-19 Guidance: Long-Term Care Homes, Retirement Homes, and Other Congregate Living Settings for Public Health Units. Toronto, ON: MOH; 2022. https://www.health.gov.on.ca/en/pro/programs/publichealth/coronavirus/docs/LTCH_RH_guidance_PHU.pdf
- Footnote 12
-
Public Health Ontario. Weekly Epidemiological Summary. SARS-CoV-2 Genomic Surveillance in Ontario. Public Health Ontario: Toronto, ON: PHO; 2022. https://www.publichealthontario.ca/-/media/documents/ncov/epi/covid-19-sars-cov2-whole-genome-sequencing-epi-summary.pdf
- Footnote 13
-
Safford HR, Shapiro K, Bischel HN. Opinion: wastewater analysis can be a powerful public health tool-if it's done sensibly. Proc Natl Acad Sci USA 2022;119(6):e2119600119. https://doi.org/10.1073/pnas.2119600119
- Footnote 14
-
Ali S, Gudina EK, Gize A, Aliy A, Adankie BT, Tsegaye W, Hundie GB, Muleta MB, Chibssa TR, Belaineh R, Negessu D, Shegu D, Froeschl G, Wieser A. Community Wastewater-Based Surveillance Can Be a Cost-Effective Approach to Track COVID-19 Outbreak in Low-Resource Settings: Feasibility Assessment for Ethiopia Context. Int J Environ Res Public Health 2022;19(14):8515. https://doi.org/10.3390/ijerph19148515
- Footnote 15
-
Abbasi J. Social Isolation-the Other COVID-19 Threat in Nursing Homes. JAMA 2020 Aug;324(7):619–20. https://doi.org/10.1001/jama.2020.13484
- Footnote 16
-
Katz AS, Li T, James L, Siegel J, O'Campo P. Systematically omitting indoor air quality: sub-standard guidance for shelters, group homes and long-term care during the COVID-19 pandemic. medRxiv, 2022.01.26.22269908. https://doi.org/10.1101/2022.01.26.22269908
Appendix: Peterborough Public Health Wastewater Surveillance Guidance for Retirement Homes
Wastewater Surveillance Guidance for Congregate Living Settings
This guidance document is meant to provide participating congregate living settings (CLS), including retirement homes or other CLS, with the rationale and benefits of wastewater surveillance (especially in high-risk settings), the importance of implementing control measures to mitigate outbreaks and the role of both Peterborough Public Health and the CLS participating in this program.
Background
Wastewater (also known as sewage) surveillance involves the sampling and analysis of wastewater to monitor the prevalence of certain viruses and diseases within communities. The use of wastewater surveillance for coronavirus disease 2019 (COVID-19) has the potential to provide an early warning system of the presence of COVID-19 in a source population, with some studies observing a signal 2–14 days prior to clinical detection (Public Health Ontario, 2021). COVID-19 is detected in wastewater because severe acute respiratory syndrome coronavirus 2 (SARS-CoV-2) (the virus that causes COVID-19) is shed in the feces of some infected individuals, who are either asymptomatic, pre-symptomatic, symptomatic, or recovering from COVID-19 (it is known that peak viral shedding occurs before the onset of symptoms). Wastewater surveillance involves the collection of untreated wastewater samples which are then processed to detect the virus (Public Health Ontario, 2021).
Rationale and benefits of wastewater surveillance
Wastewater surveillance is a non-invasive, anonymous method of obtaining samples within a specific geographic area (Public Health Ontario, 2021). Wastewater surveillance is an important detection method to monitor trends in COVID-19 in Ontario and in our local community. Locally, we use the Peterborough Public Health Local COVID-19 Risk Index to assess current risk based on a number of factors including COVID-19 detection in wastewater. Using wastewater data can provide a 'signal' of community spread in an area, and with a standard and timely response using control measures, this data may help prevent or mitigate outbreaks and the subsequent risk of infection for residents in retirement homes.
How the program works
- Local wastewater is monitored by the research team at Trent University, under the direction of Dr. Christopher Kyle. When two subsequent detections of COVID-19 occur at a CLS, it is reported to Peterborough Public Health and directly to the affected facility.
- Low, moderate and high detections in the wastewater will initiate a response by an Infectious Disease Program Public Health Nurse (PHN) at Peterborough Public Health.
- Quantifying these detections depends on a number of factors; however, as a general guide the following ranges are used:
- Low <5 cp/ml
- Moderate 5–15 cp/ml
- High >15 cp/ml
- Very High >100 cp/ml
- Quantifying these detections depends on a number of factors; however, as a general guide the following ranges are used:
- If a facility is already in outbreak when the detection is observed, the wastewater detection levels may be used to support decision-making regarding control measures.
- The assigned PHN will connect with the home to confirm they are aware of the detection.
- Control measures (please see control measures checklist in Supplemental material) will be reviewed with the facility and implemented as appropriate.
- If, upon further testing, cases are identified and an outbreak is declared additional control measures may be recommended.
- Control measures will continue until the wastewater signal has returned to no detection, outbreak has been declared over and/or at the discretion of Peterborough Public Health in the case of ongoing detection without evidence of cases.
Role of the congregate living setting
This program involves a strong collaboration between Peterborough Public Health and the CLS. The role of the CLS in this surveillance program is to receive and monitor wastewater surveillance reports and implement all necessary control measures at the first indication of the virus being detected in the facility. Peterborough Public Health will support the facility by connecting with the home and providing guidance on implementing the control measures as well as outbreak management if necessary. By working together to implement control measures in the facility as quickly as possible, we can better protect residents and mitigate facility outbreaks.
We thank you for your continued efforts and dedication to keeping our communities safe.
Further reading
- Wastewater Surveillance of COVID-19 (publichealthontario.ca)
- PHO Rounds: Wastewater Surveillance of COVID-19: Potential Applications, Challenges, and Experiences in Ontario (publichealthontario.ca)
- Interim Infection Prevention and Control Measures based on COVID-19 Transmission Risks in Health Care Settings (publichealthontario.ca)
- Trent University and Peterborough Public Heath Join Provincial COVID-19 Wastewater Surveillance Initiative - News - Trent University
- Wastewater Signal - Peterborough Region COVID-19 Tracker
