
Invasive group A streptococcal disease surveillance in Canada, 2021–2022

 Download this article as a PDF (460 KB)
Published by: The Public Health Agency of Canada
Issue: Volume 50–5, May 2024: CCDR 50th Anniversary
Date published: May 2024
ISSN: 1481-8531
Submit a manuscript
About CCDR
Browse
Volume 50-5, May 2024: CCDR 50th Anniversary
Surveillance
Invasive group A streptococcal disease surveillance in Canada, 2021–2022
Alyssa R Golden1, Averil Griffith1, Gregory J Tyrrell2, Julianne V Kus3,4, Allison McGeer5, Marc-Christian Domingo6, Linda Hoang7, Jessica Minion8, Paul Van Caeseele9, Hanan Smadi10, David Haldane11, Yang Yu12, Xiaofeng Ding13, Laura Steven14, Jan McFadzen15, Courtney Primeau16, Kristyn Franklin16, Irene Martin1
Affiliations
1 National Microbiology Laboratory, Public Health Agency of Canada, Winnipeg, MB
2 Provincial Laboratory for Public Health, Edmonton, AB
3 Public Health Ontario, Toronto, ON
4 Department of Laboratory Medicine and Pathobiology, University of Toronto, Toronto, ON
5 Toronto Invasive Bacterial Diseases Network (TIBDN), Department of Microbiology, Mount Sinai Hospital, Toronto, ON
6 Laboratoire de santé publique du Québec, Institut national de santé publique du Québec, Sainte-Anne-de-Bellevue, QC
7 British Columbia Centre for Disease Control, Vancouver, BC
8 Roy Romanow Provincial Laboratory, Regina, SK
9 Cadham Provincial Laboratory, Winnipeg, MB
10 New Brunswick Department of Health, Fredericton, NB
11 Queen Elizabeth II Health Science Centre, Halifax, NS
12 Newfoundland and Labrador Public Health Laboratory, St. John's, NL
13 Queen Elizabeth Hospital, Charlottetown, PE
14 Stanton Territorial Hospital Laboratory, Yellowknife, NT
15 Yukon Communicable Disease Control, Whitehorse, YT
16 Centre for Emerging and Respiratory Infections and Pandemic Preparedness, Public Health Agency of Canada, Ottawa, ON
Correspondence
Suggested citation
Golden AR, Griffith A, Tyrrell G, Kus JV, McGreer A, Domingo MC, Hoan L, Minion J, Van Caeseele P, Smadi H, Haldane D, Yu Y, Ding X, Steven L, McFadzen J, Primeau C, Franklin K, Martin I. Invasive group A streptococcal disease surveillance in Canada, 2021–2022. Can Commun Dis Rep 2024;50(5):135–43. https://doi.org/10.14745/ccdr.v50i05a03
Keywords: iGAS, Streptococcus pyogenes, Canada, emm, surveillance, antimicrobial resistance, group A Streptococcus
Abstract
Background: Invasive group A streptococcal (iGAS, Streptococcus pyogenes) disease has been a nationally notifiable disease in Canada since 2000. This report summarizes the demographics, emm types, and antimicrobial resistance of iGAS isolates collected in Canada in 2021 and 2022.
Methods: The Public Health Agency of Canada's National Microbiology Laboratory collaborates with provincial and territorial public health laboratories to conduct national surveillance of invasive S. pyogenes. Emm typing was performed using the Centers for Disease Control and Prevention emm sequencing protocol or extracted from whole-genome sequencing data. Antimicrobial susceptibilities were determined using Kirby-Bauer disk diffusion according to Clinical and Laboratory Standards Institute guidelines or predicted from whole-genome sequencing data based on the presence of resistance determinants.
Results: Overall, the incidence of iGAS disease in Canada was 5.56 cases per 100,000 population in 2021, decreasing from the peak of 8.6 cases per 100,000 population in 2018. A total of 2,630 iGAS isolates were collected during 2022, representing an increase from 2021 (n=2,179). In particular, there was a large increase in isolates collected from October to December 2022. The most predominant emm type overall in 2021 and 2022 was emm49, at 21.5% (n=468) and 16.9% (n=444), respectively, representing a significant increase in prevalence since 2018 (p<0.0001). The former most prevalent type, emm1, increased from 0.5% (n=10) in 2021 to 4.8% (n=125) in 2022; similarly, emm12 increased from 1.0% (n=22) in 2021 to 5.8% (n=151) in 2022. These two types together accounted for almost 25% of isolates collected in late 2022 (October to December). Antimicrobial resistance rates in 2021 and 2022 included: 14.9%/14.1% erythromycin resistance, 4.8%/3.0% clindamycin resistance, and <1% chloramphenicol resistance.
Conclusion: The increase of iGAS isolates collected in Canada is an important public health concern. Continued surveillance of iGAS is critical to monitor expanding emm types and antimicrobial resistance patterns.
Introduction
Invasive group A Streptococcus (iGAS, Streptococcus pyogenes) is responsible for a wide range of human diseases, the most serious of which include bacteraemia, streptococcal toxic shock syndrome, necrotizing fasciitis, and endocarditis Footnote 1. In Canada, the overall incidence of iGAS infections has steadily increased since becoming a notifiable disease in 2000, peaking at a rate of 8.61 cases per 100,000 population in 2018 Footnote 2. In 2020, Canada reported decreased submissions of iGAS isolates, attributed to the containment measures put in place to control the SARS-CoV-2 pandemic (COVID-19) Footnote 2. There was also a significant shift in the emm types most commonly associated with disease in Canada, shifting from the formerly prevalent emm1 toward emm49 and emm76 Footnote 2.
In late 2022, the World Health Organization (WHO) reported that several countries in Europe had been observing increased cases of iGAS and scarlet fever, predominantly in children Footnote 3, starting off a season of increased focus on iGAS in many countries. As COVID-19 pandemic restrictions have loosened and person-to-person disease transmission has intensified, it is increasingly important to monitor the prevalence of both iGAS disease and associated emm types and antimicrobial resistance. This report provides a summary of iGAS isolates collected in Canada in 2021 and 2022.
Methods
Surveillance program
As previously described, surveillance of iGAS in Canada consists of a passive, laboratory-based system where invasive S. pyogenes isolates from all provincial and territorial public health laboratories (except Alberta) are forwarded to the National Microbiology Laboratory (NML) in Winnipeg for further testing Footnote 2. In 2021, a total of 2,179 iGAS isolates were reported, including 1,787 submitted directly to NML by provincial and territorial public health laboratories, as well as data for a further 392 isolates collected and tested by the Provincial Laboratory for Public Health in Edmonton, Alberta (ProvLab Alberta); in 2022, a total of 2,630 iGAS isolates were reported, including 2,108 submitted directly and data for 522 tested by ProvLab Alberta (Table 1). Sterile clinical isolation sites include blood, cerebrospinal fluid, deep tissue, biopsy and surgical samples, bone, and any clinical sources associated with necrotizing fasciitis or toxic shock syndrome.
| Province | Age group (years) | Not given | Total | |||||
|---|---|---|---|---|---|---|---|---|
| <2 | 2–4 | 5–14 | 15–49 | 50–64 | ≥65 | |||
| 2021 | ||||||||
| British Columbia | 2 | 1 | 2 | 153 | 125 | 76 | 0 | 359 |
| Alberta | 7 | 5 | 8 | 199 | 123 | 47 | 3 | 392 |
| Saskatchewan | 4 | 2 | 2 | 83 | 33 | 13 | 1 | 138 |
| Manitoba | 5 | 7 | 2 | 91 | 49 | 35 | 0 | 189 |
| Ontario | 9 | 1 | 8 | 352 | 227 | 176 | 7 | 780 |
| Québec | 7 | 5 | 3 | 90 | 73 | 57 | 2 | 237 |
| AtlanticTable 1 footnote a | 0 | 1 | 0 | 32 | 20 | 8 | 1 | 62 |
| NorthernTable 1 footnote b | 2 | 1 | 1 | 4 | 11 | 3 | 0 | 22 |
| Canada | 36 | 23 | 26 | 1,004 | 661 | 415 | 14 | 2,179 |
| 2022 | ||||||||
| British Columbia | 6 | 4 | 7 | 151 | 147 | 109 | 1 | 425 |
| Alberta | 13 | 6 | 21 | 276 | 126 | 80 | 0 | 522 |
| Saskatchewan | 6 | 2 | 3 | 63 | 30 | 17 | 0 | 121 |
| Manitoba | 7 | 0 | 11 | 85 | 52 | 46 | 0 | 201 |
| Ontario | 8 | 13 | 23 | 315 | 258 | 282 | 6 | 905 |
| Québec | 15 | 12 | 27 | 134 | 87 | 90 | 0 | 365 |
| AtlanticTable 1 footnote a | 2 | 2 | 2 | 44 | 11 | 15 | 4 | 80 |
| NorthernTable 1 footnote b | 0 | 0 | 0 | 7 | 2 | 2 | 0 | 11 |
| Canada | 57 | 39 | 94 | 1,075 | 713 | 641 | 11 | 2,630 |
Population-based incidences of iGAS disease up to 2021 were obtained through the Canadian Notifiable Disease Surveillance System (CNDSS). Population data for incidence rates were obtained from Statistics Canada's July 1st, 2021, annual population estimates.
Isolate testing
Streptococcus pyogenes isolates were confirmed by a positive pyrrolidonyl-β-naphthylamide (PYR) reaction and susceptibility to bacitracin Footnote 4. From January 2021 to October 2022, emm typing was performed on all iGAS isolates submitted to NML and ProvLab Alberta using the Centers for Disease Control and Prevention (CDC)'s emm sequencing protocol available online. The sequences obtained were compared with the CDC emm database and results reported to the type level. Antimicrobial susceptibilities for iGAS during this time were determined using Kirby-Bauer disk diffusion for chloramphenicol (30 μg), erythromycin (15 μg), clindamycin (2 μg), penicillin (10 μg), and vancomycin (30 μg) according to Clinical and Laboratory Standards Institute (CLSI) guidelines Footnote 5. From November 2022 to December 2022, all iGAS isolates submitted to NML were whole-genome sequenced using the Illumina platform, with emm type identified directly using the WGS Analysis and Detection of Molecular Markers (WADE) pipeline. Antimicrobial resistance interpretation (susceptible, resistant) was also predicted using WADE, based on the presence/absence of resistance markers for: chloramphenicol (cat), macrolides/lincosamides (ermA, ermB, ermT, mefA/E) and β-lactams (pbp2x).
Supplementary testing was performed on all emm1 isolates submitted to NML in 2021–2022 to determine the prevalence of the novel M1UK lineage. The M1UK genotypes were determined by mapping whole-genome sequencing reads against reference strain MGAS5005 and identifying 27 characteristic genomic single nucleotide variants (SNVs), as previously described Footnote 6Footnote 7.
Data analysis
Demographic data submitted with bacterial isolates included patient age, sex, clinical source, province, and date of collection. Multiple isolates with the same emm type and collected from the same patient within 14 days were counted once with the most invasive isolation site assigned. Meningitis-related isolates were regarded as most invasive, followed by blood, then other sterile sites. The laboratory data were aggregated by age into <2, 2–4, 5–14, 15–49, 50–64 and ≥65-year-old age groups, and regionally into Western (British Columbia, Alberta, Saskatchewan, Manitoba), Central (Ontario, Québec), Eastern (New Brunswick, Nova Scotia, Prince Edward Island, Newfoundland and Labrador), and Northern (Yukon, Northwest Territories, Nunavut) regions of Canada. Statistical significance of trends was assessed using the Cochran-Armitage test of trend, with a p-value of <0.05 considered to be statistically significant.
Results
After peaking at 8.61 cases per 100,000 population in 2018, the overall incidence of iGAS disease in Canada decreased in 2020 and 2021. The overall incidence rate in 2021 was 5.56 cases per 100,000 population, which is the lowest overall incidence in Canada since 2015 (Figure 1, Appendix, Supplemental Table S1). There was an increase in the number of iGAS isolates submitted in 2022 (n=2,630) in comparison to 2021 (n=2,179). In particular, there was a large increase in isolates collected in the final quarter (Q4; October to December) of 2022 (Figure 2), the total of which was considerably higher than Q4 in 2018 and 2019 (pre-pandemic years). Of note during 2022-Q4 it was an increased number of isolates collected from children younger than 15 years of age, in comparison to previous quarters.
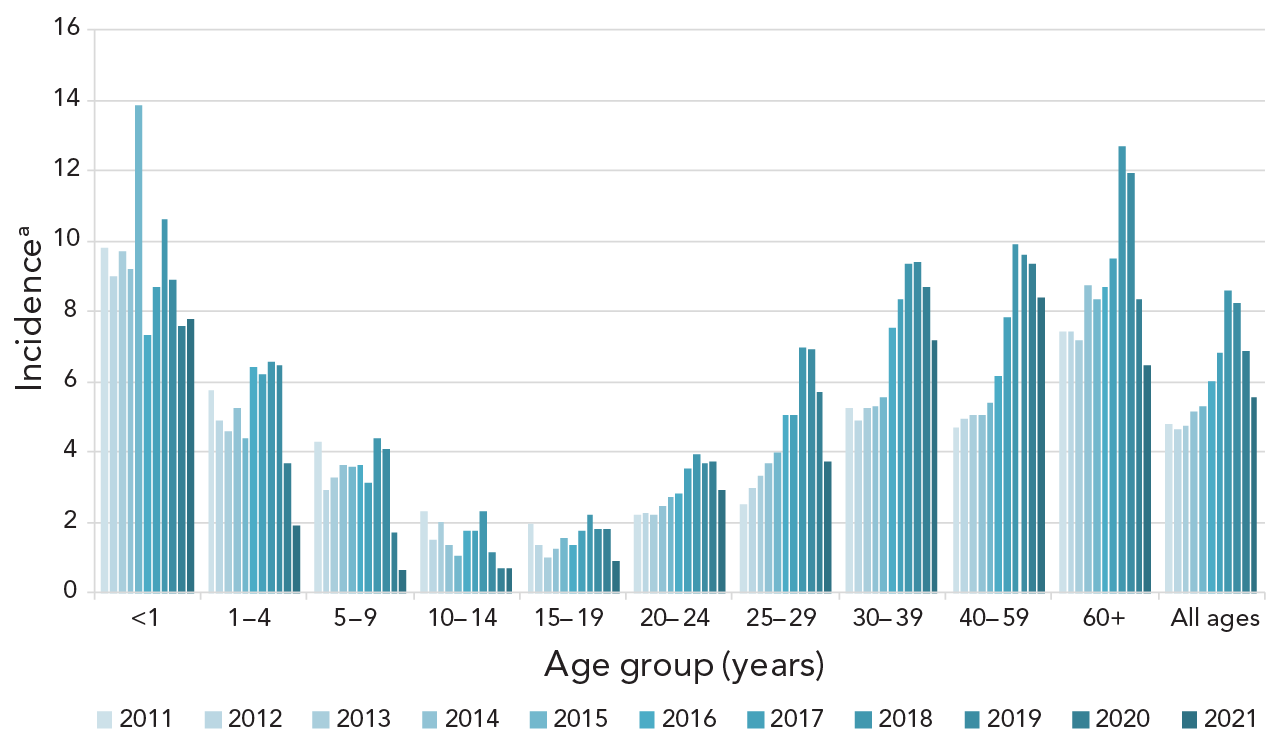
Figure 1 - Text description
This figure is a bar graph displaying the incidence of invasive Streptococcus pyogenes cases per 100,000 population in Canada from 2011 to 2021, by age group.
| Age group (years) |
2011 | 2012 | 2013 | 2014 | 2015 | 2016 | 2017 | 2018 | 2019 | 2020 | 2021 |
|---|---|---|---|---|---|---|---|---|---|---|---|
| <1 | 9.83 | 9.00 | 9.72 | 9.18 | 13.87 | 7.31 | 8.71 | 10.63 | 8.87 | 7.57 | 7.77 |
| 1–4 | 5.78 | 4.87 | 4.60 | 5.24 | 4.40 | 6.41 | 6.21 | 6.58 | 6.47 | 3.68 | 1.90 |
| 5–9 | 4.31 | 2.92 | 3.28 | 3.62 | 3.60 | 3.64 | 3.12 | 4.38 | 4.07 | 1.71 | 0.64 |
| 10–14 | 2.29 | 1.48 | 2.01 | 1.37 | 1.06 | 1.77 | 1.74 | 2.31 | 1.13 | 0.68 | 0.67 |
| 15–19 | 1.97 | 1.37 | 1.02 | 1.27 | 1.53 | 1.34 | 1.77 | 2.23 | 1.80 | 1.81 | 0.87 |
| 20–24 | 2.21 | 2.26 | 2.19 | 2.48 | 2.71 | 2.81 | 3.54 | 3.94 | 3.68 | 3.71 | 2.90 |
| 25–29 | 2.53 | 2.98 | 3.30 | 3.69 | 3.99 | 5.07 | 5.05 | 6.95 | 6.93 | 5.71 | 3.72 |
| 30–39 | 5.24 | 4.91 | 5.27 | 5.29 | 5.57 | 7.53 | 8.33 | 9.33 | 9.39 | 8.70 | 7.17 |
| 40–59 | 4.70 | 4.97 | 5.06 | 5.05 | 5.39 | 6.17 | 7.83 | 9.89 | 9.59 | 9.35 | 8.38 |
| 60+ | 7.45 | 7.42 | 7.19 | 8.72 | 8.36 | 8.70 | 9.48 | 12.69 | 11.95 | 8.35 | 6.44 |
| All ages | 4.78 | 4.66 | 4.75 | 5.17 | 5.30 | 6.00 | 6.82 | 8.61 | 8.23 | 6.85 | 5.56 |
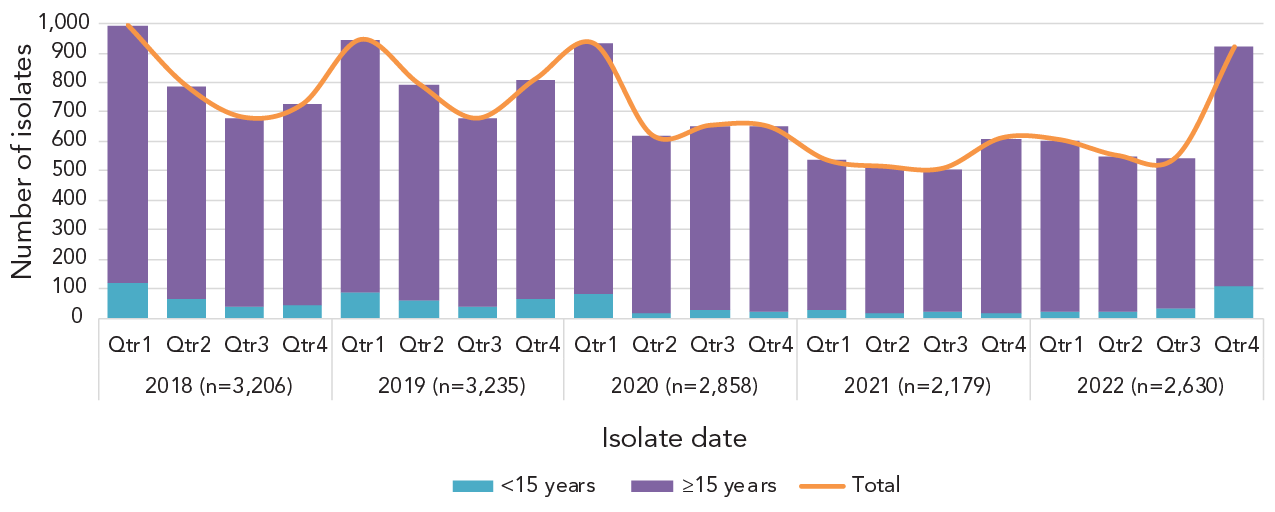
Figure 2 - Text description
This figure is a stacked bar graph displaying the number of invasive Streptococcus pyogenes isolates collected from patients less than 15 years of age and patients 15 years of age and older from 2018 to 2022, by quarter.
| Isolate date | Quarter | <15 years | ≥15 years | Total |
|---|---|---|---|---|
| 2018 (n=3,206) | Qtr1 | 120 | 874 | 994 |
| Qtr2 | 67 | 721 | 788 | |
| Qtr3 | 38 | 642 | 680 | |
| Qtr4 | 43 | 682 | 725 | |
2019 (n=3,235) |
Qtr1 | 88 | 857 | 945 |
| Qtr2 | 62 | 732 | 794 | |
| Qtr3 | 37 | 640 | 677 | |
| Qtr4 | 67 | 744 | 811 | |
| 2020 (n=2,858) | Qtr1 | 80 | 852 | 932 |
| Qtr2 | 18 | 602 | 620 | |
| Qtr3 | 25 | 628 | 653 | |
| Qtr4 | 24 | 625 | 649 | |
| 2021 (n=2,179) | Qtr1 | 27 | 508 | 535 |
| Qtr2 | 18 | 495 | 513 | |
| Qtr3 | 22 | 485 | 507 | |
| Qtr4 | 18 | 592 | 610 | |
2022 (n=2,630) |
Qtr1 | 24 | 580 | 604 |
| Qtr2 | 24 | 526 | 550 | |
| Qtr3 | 32 | 513 | 545 | |
| Qtr4 | 110 | 810 | 920 |
The overall proportion of iGAS isolates collected from pediatric age groups remained stable over the two years, with infants <2 years of age accounting for 1%–2% of isolates, toddlers aged 2–4 years for 1%–1.5%, and children aged 5–14 years for 1%–3%. Proportions for other age groups had more fluctuation. Patients aged 15–49 years represented 46.1% of isolates collected in 2021 and 40.9% of those collected in 2022; adults aged 50–64 years 30.3% and 27.1%; and seniors aged 65 years and older for 19.0% and 24.4%. Of the isolates for which sex information was available, isolates from male patients represented 61.8% and 61.7% of isolates in 2021 and 2022, respectively. Blood was the predominant clinical isolation site, accounting for 69.3% of isolates collected in 2021 and 70.5% in 2022. Additional information on specimen source by age and emm type can be found in Appendix, Figures S1–S5.
The most predominant emm type overall in 2021 and 2022 was emm49, at 21.5% (n=468) and 16.9% (n=444), respectively, representing a significant increase in prevalence since 2018 (from 3.1%, n=99; p<0.0001) (Figure 3). Other emm types that demonstrated significantly increasing trends from 2018 to 2022 include emm22 (0.9%–1.7%; p=0.025), emm41 (1.5%–3.4%; p<0.0001), emm59 (1.1%–4.2%; p<0.0001) emm80 (0.3%–4.0%; p<0.0001), emm82 (2.1%–8.9%; p<0.0001), emm83 (1.8%–4.6%; p<0.0001), emm91 (0.8%–1.8%; p<0.0001), and emm92 (2.0%–3.7%; p<0.0001). Other emm types demonstrated significantly decreasing trends (see Figure 3), such as emm1 from 17.1% (n=547) of all iGAS isolates collected in 2018 to 4.8% (n=125) in 2022 (p<0.0001). A percent prevalence of 4.8% in 2022 is a sharp increase from 2021, where emm1 only accounted for 0.5% (n=10) of isolates collected; this recent increase is statistically significant (p<0.0001). Of note, 49.0% (n=47) of emm1 isolates sequenced in 2022 were the novel M1UK lineage; in comparison, in 2015 (the year the first M1UK isolate was identified in Canada), only 2.6% (n=3) of sequenced emm1 isolates were M1UK. Another type of interest is emm12, which did not demonstrate a significant trend from 2018 to 2022; however, emm12 decreased significantly from 4.5% (n=145) in 2018 to 1.0% (n=22) in 2021 (p<0.0001), before significantly rising back up to 5.8% (n=151) in 2022 (p<0.0001). Counts of emm1 and emm12 saw a particular re-emergence in late 2022, together accounting for almost 25% of isolates collected in Q4 (Figure 4).
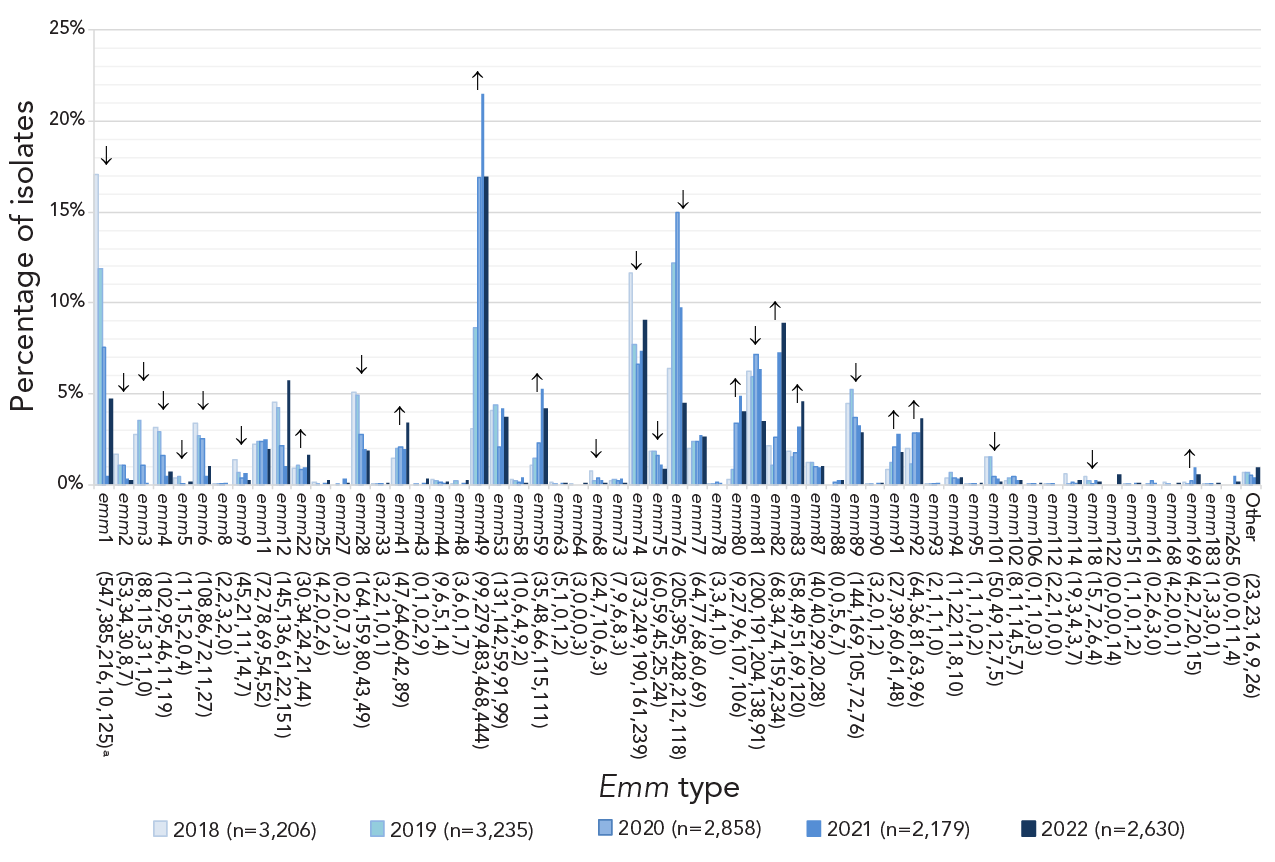
Figure 3 - Text description
This figure is a bar graph displaying the percentage of Streptococcus pyogenes emm types from all age groups from 2018 to 2022, based on the total number of isolates tested annually.
| emm type | 2018 (n=3,206) |
2019 (n=3,235) |
2020 (n=2,858) |
2021 (n=2,179) |
2022 (n=2,630) |
|---|---|---|---|---|---|
| emm 1 (547,385,216,10,125)a | 17.1% | 11.9% | 7.6% | 0.5% | 4.8% |
| emm 2 (53,34,30,8,7) | 1.7% | 1.1% | 1.0% | 0.4% | 0.3% |
| emm 3 (88,115,31,1,0) | 2.7% | 3.6% | 1.1% | 0.0% | 0.0% |
| emm 4 (102,95,46,11,19) | 3.2% | 2.9% | 1.6% | 0.5% | 0.7% |
| emm 5 (11,15,2,0,4) | 0.3% | 0.5% | 0.1% | 0.0% | 0.2% |
| emm 6 (108,86,72,11,27) | 3.4% | 2.7% | 2.5% | 0.5% | 1.0% |
| emm 8 (2,2,3,2,0) | 0.1% | 0.1% | 0.1% | 0.1% | 0.0% |
| emm 9 (45,21,11,14,7) | 1.4% | 0.6% | 0.4% | 0.6% | 0.3% |
| emm 11(72,78,69,54,52) | 2.2% | 2.4% | 2.4% | 2.5% | 2.0% |
| emm 12(145,136,61,22,151) | 4.5% | 4.2% | 2.1% | 1.0% | 5.8% |
| emm 22(30,34,24,21,44) | 0.9% | 1.1% | 0.8% | 1.0% | 1.7% |
| emm 25(4,2,0,2,6) | 0.1% | 0.1% | 0.0% | 0.1% | 0.2% |
| emm 27(0,2,0,7,3) | 0.0% | 0.1% | 0.0% | 0.3% | 0.1% |
| emm 28(164,159,80,43,49) | 5.1% | 4.9% | 2.8% | 2.0% | 1.9% |
| emm 33(3,2,1,0,1) | 0.1% | 0.1% | 0.0% | 0.0% | 0.0% |
| emm 41(47,64,60,42,89) | 1.5% | 2.0% | 2.1% | 1.9% | 3.4% |
| emm 43(0,1,0,2,9) | 0.0% | 0.0% | 0.0% | 0.1% | 0.3% |
| emm 44(9,6,5,1,4) | 0.3% | 0.2% | 0.2% | 0.0% | 0.2% |
| emm 48(3,6,0,1,7) | 0.1% | 0.2% | 0.0% | 0.0% | 0.3% |
| emm 49(99,279,483,468,444) | 3.1% | 8.6% | 16.9% | 21.5% | 16.9% |
| emm 53(131,142,59,91,99) | 4.1% | 4.4% | 2.1% | 4.2% | 3.8% |
| emm 58(10,6,4,9,2) | 0.3% | 0.2% | 0.1% | 0.4% | 0.1% |
| emm 59(35,48,66,115,111) | 1.1% | 1.5% | 2.3% | 5.3% | 4.2% |
| emm 63(5,1,0,1,2) | 0.2% | 0.0% | 0.0% | 0.0% | 0.1% |
| emm 64(3,0,0,0,3) | 0.1% | 0.0% | 0.0% | 0.0% | 0.1% |
| emm 68(24,7,10,6,3) | 0.7% | 0.2% | 0.3% | 0.3% | 0.1% |
| emm 73(7,9,6,8,3) | 0.2% | 0.3% | 0.2% | 0.4% | 0.1% |
| emm 74(373,249,190,161,239) | 11.6% | 7.7% | 6.6% | 7.4% | 9.1% |
| emm 75(60,59,45,25,24) | 1.9% | 1.8% | 1.6% | 1.1% | 0.9% |
| emm 76(205,395,428,212,118) | 6.4% | 12.2% | 15.0% | 9.7% | 4.5% |
| emm 77(64,77,68,60,69) | 2.0% | 2.4% | 2.4% | 2.8% | 2.6% |
| emm 78(3,3,4,1,0) | 0.1% | 0.1% | 0.1% | 0.0% | 0.0% |
| emm 80(9,27,96,107,106) | 0.3% | 0.8% | 3.4% | 4.9% | 4.0% |
| emm 81(200,191,204,138,91) | 6.2% | 5.9% | 7.1% | 6.3% | 3.5% |
| emm 82(68,34,74,159,234) | 2.1% | 1.1% | 2.6% | 7.3% | 8.9% |
| emm 83(58,49,51,69,120) | 1.8% | 1.5% | 1.8% | 3.2% | 4.6% |
| emm 87(40,40,29,20,28) | 1.2% | 1.2% | 1.0% | 0.9% | 1.1% |
| emm 88(0,0,5,6,7) | 0.0% | 0.0% | 0.2% | 0.3% | 0.3% |
| emm 89(144,169,105,72,76) | 4.5% | 5.2% | 3.7% | 3.3% | 2.9% |
| emm 90(3,2,0,1,2) | 0.1% | 0.1% | 0.0% | 0.0% | 0.1% |
| emm 91(27,39,60,61,48) | 0.8% | 1.2% | 2.1% | 2.8% | 1.8% |
| emm 92(64,36,81,63,96) | 2.0% | 1.1% | 2.8% | 2.9% | 3.7% |
| emm 93(2,1,1,1,0) | 0.1% | 0.0% | 0.0% | 0.0% | 0.0% |
| emm 94(11,22,11,8,10) | 0.3% | 0.7% | 0.4% | 0.4% | 0.4% |
| emm 95(1,1,1,0,2) | 0.0% | 0.0% | 0.0% | 0.0% | 0.1% |
| emm101(50,49,12,7,5) | 1.6% | 1.5% | 0.4% | 0.3% | 0.2% |
| emm102(8,11,14,5,7) | 0.2% | 0.3% | 0.5% | 0.2% | 0.3% |
| emm106(0,1,1,0,3) | 0.0% | 0.0% | 0.0% | 0.0% | 0.1% |
| emm112(2,2,1,0,0) | 0.1% | 0.1% | 0.0% | 0.0% | 0.0% |
| emm114(19,3,4,3,7) | 0.6% | 0.1% | 0.1% | 0.1% | 0.3% |
| emm118(15,7,2,6,4) | 0.5% | 0.2% | 0.1% | 0.3% | 0.2% |
| emm122(0,0,0,0,14) | 0.0% | 0.0% | 0.0% | 0.0% | 0.5% |
| emm151(1,1,0,1,2) | 0.0% | 0.0% | 0.0% | 0.0% | 0.1% |
| emm161(0,2,6,3,0) | 0.0% | 0.1% | 0.2% | 0.1% | 0.0% |
| emm168(4,2,0,0,1) | 0.1% | 0.1% | 0.0% | 0.0% | 0.0% |
| emm169(4,2,7,20,15) | 0.1% | 0.1% | 0.2% | 0.9% | 0.6% |
| emm183(1,3,3,0,1) | 0.0% | 0.1% | 0.1% | 0.0% | 0.0% |
| emm265(0,0,0,11,4) | 0.0% | 0.0% | 0.0% | 0.5% | 0.2% |
| Other (23,23,16,9,26) | 0.7% | 0.7% | 0.6% | 0.4% | 1.0% |
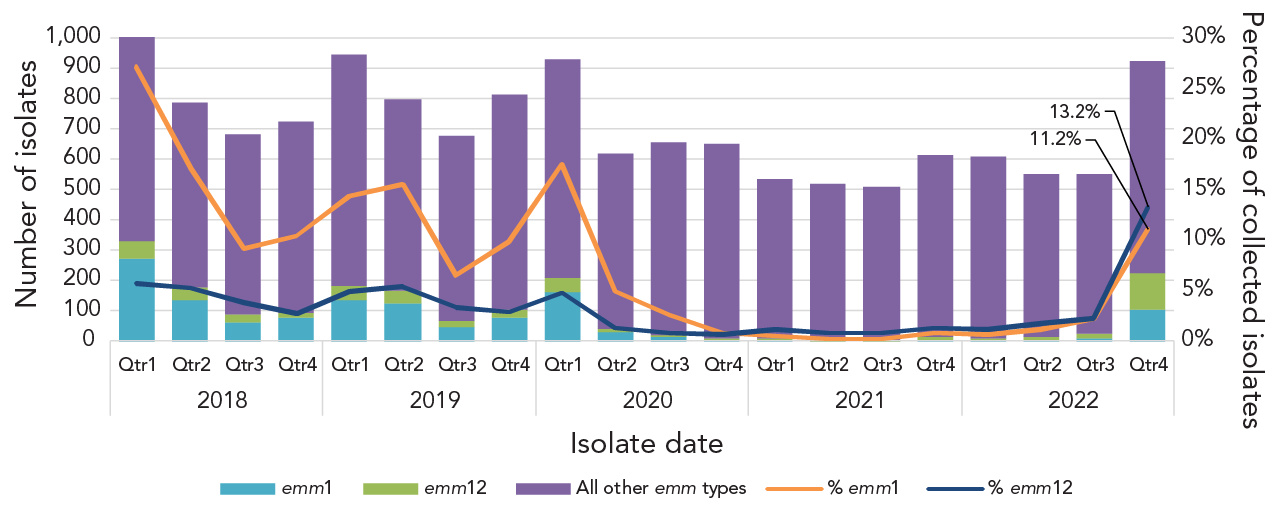
Figure 4 - Text description
This figure is a combination line and stacked bar graph. The bars depict the number of invasive Streptococcus pyogenes isolates collected quarterly from 2018 to 2022 that are emm1, emm12, or other emm types. The line depicts the quarterly percent prevalence of emm1 and emm12 2018 to 2022.
| Isolate date | Quarter | emm1 | emm12 | All other emm types | Total | % emm1 | % emm12 |
|---|---|---|---|---|---|---|---|
| 2018 | Qtr1 | 273 | 58 | 673 | 1,004 | 27.2% | 5.8% |
| Qtr2 | 135 | 41 | 614 | 790 | 17.1% | 5.2% | |
| Qtr3 | 63 | 26 | 596 | 685 | 9.2% | 3.8% | |
| Qtr4 | 76 | 20 | 631 | 727 | 10.5% | 2.8% | |
| 2019 | Qtr1 | 137 | 47 | 763 | 947 | 14.5% | 5.0% |
| Qtr2 | 124 | 43 | 629 | 796 | 15.6% | 5.4% | |
| Qtr3 | 44 | 23 | 611 | 678 | 6.5% | 3.4% | |
| Qtr4 | 80 | 23 | 711 | 814 | 9.8% | 2.8% | |
| 2020 | Qtr1 | 163 | 44 | 725 | 932 | 17.5% | 4.7% |
| Qtr2 | 31 | 8 | 583 | 622 | 5.0% | 1.3% | |
| Qtr3 | 17 | 5 | 634 | 656 | 2.6% | 0.8% | |
| Qtr4 | 5 | 4 | 641 | 650 | 0.8% | 0.6% | |
| 2021 | Qtr1 | 3 | 6 | 529 | 538 | 0.6% | 1.1% |
| Qtr2 | 1 | 4 | 513 | 518 | 0.2% | 0.8% | |
| Qtr3 | 1 | 4 | 504 | 509 | 0.2% | 0.8% | |
| Qtr4 | 5 | 8 | 601 | 614 | 0.8% | 1.3% | |
| 2022 | Qtr1 | 4 | 7 | 596 | 607 | 0.7% | 1.2% |
| Qtr2 | 6 | 10 | 536 | 552 | 1.1% | 1.8% | |
| Qtr3 | 12 | 12 | 525 | 549 | 2.2% | 2.2% | |
| Qtr4 | 103 | 122 | 697 | 922 | 11.2% | 13.2% |
In 2021, the most common emm type from children <15 years of age was emm49 (28.2%, n=24). Emm49 dropped to the third most common type in this age group in 2022, instead replaced by emm12 (25.8%, n=49) and emm1 (24.2%, n=46) (Appendix, Figure S6). In patients aged 15 years and older, emm49 (21.3%, n=442) and emm76 (10.0%, n=207) were most common in 2021. In 2022, emm49 (17.0%, n=412) was also the most common type in the age group, followed by emm74 (9.7%, n=236) and emm82 (9.5%, n=230) (Appendix, Figure S7).
Emm types associated with Western Canada (Figure 5) included emm49 (25.1%, n=271 in 2021; 15.3%, n=194 in 2022) and emm74 (13.5%, n=145 in 2021; 16.9%, n=214 in 2022). In Central Canada, emm49 (14.9%, n=152 in 2021; 17.2%, n=219 in 2022) and emm82 (13.4%, n=136 in 2021; 12.8%, n=162 in 2022) were predominant in both 2021 and 2022. Emm49 was the most common type isolated in Eastern Canada in both 2021 (56.5%, n=35) and 2022 (35.0%, n=28). Isolates from Northern Canada were highly represented by emm49 in 2021 at 45.5% (n=10), though only 22 isolates were submitted from this region. In 2022, only 11 isolates were submitted and there was no one common type (Appendix, Figures S8–S11).
Figure 5A: This figure is a stacked bar graph displaying the number of invasive Streptococcus pyogenes isolates collected from each Canadian region in 2021, by emm type.
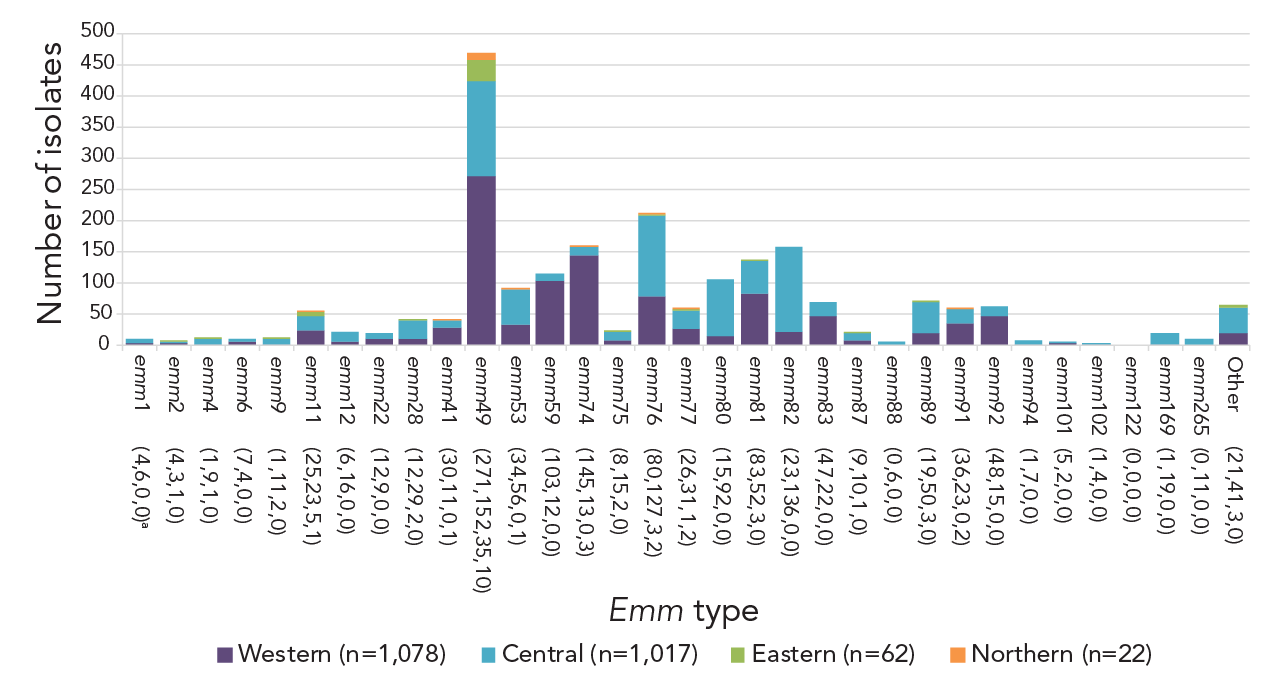
Figure 5A - Text description
| emm type | Western (n=1,078) |
Central (n=1,017) |
Eastern (n=62) |
Northern (n=22) |
|---|---|---|---|---|
| emm 1 (4,6,0,0)a | 4 | 6 | 0 | 0 |
| emm 2 (4,3,1,0) | 4 | 3 | 1 | 0 |
| emm 4 (1,9,1,0) | 1 | 9 | 1 | 0 |
| emm 6 (7,4,0,0) | 7 | 4 | 0 | 0 |
| emm 9 (1,11,2,0) | 1 | 11 | 2 | 0 |
| emm 11(25,23,5,1) | 25 | 23 | 5 | 1 |
| emm 12(6,16,0,0) | 6 | 16 | 0 | 0 |
| emm 22(12,9,0,0) | 12 | 9 | 0 | 0 |
| emm 28(12,29,2,0) | 12 | 29 | 2 | 0 |
| emm 41(30,11,0,1) | 30 | 11 | 0 | 1 |
| emm 49(271,152,35,10) | 271 | 152 | 35 | 10 |
| emm 53(34,56,0,1) | 34 | 56 | 0 | 1 |
| emm 59(103,12,0,0) | 103 | 12 | 0 | 0 |
| emm 74(145,13,0,3) | 145 | 13 | 0 | 3 |
| emm 75(8,15,2,0) | 8 | 15 | 2 | 0 |
| emm 76(80,127,3,2) | 80 | 127 | 3 | 2 |
| emm 77(26,31,1,2) | 26 | 31 | 1 | 2 |
| emm 80(15,92,0,0) | 15 | 92 | 0 | 0 |
| emm 81(83,52,3,0) | 83 | 52 | 3 | 0 |
| emm 82(23,136,0,0) | 23 | 136 | 0 | 0 |
| emm 83(47,22,0,0) | 47 | 22 | 0 | 0 |
| emm 87(9,10,1,0) | 9 | 10 | 1 | 0 |
| emm 88(0,6,0,0) | 0 | 6 | 0 | 0 |
| emm 89(19,50,3,0) | 19 | 50 | 3 | 0 |
| emm 91(36,23,0,2) | 36 | 23 | 0 | 2 |
| emm 92(48,15,0,0) | 48 | 15 | 0 | 0 |
| emm 94(1,7,0,0) | 1 | 7 | 0 | 0 |
| emm101(5,2,0,0) | 5 | 2 | 0 | 0 |
| emm102(1,4,0,0) | 1 | 4 | 0 | 0 |
| emm122(0,0,0,0) | 0 | 0 | 0 | 0 |
| emm169(1,19,0,0) | 1 | 19 | 0 | 0 |
| emm265(0,11,0,0) | 0 | 11 | 0 | 0 |
| Other (21,41,3,0) | 21 | 41 | 3 | 0 |
Figure 5B: This figure is a stacked bar graph displaying the number of invasive Streptococcus pyogenes isolates collected from each Canadian region in 2022, by emm type.
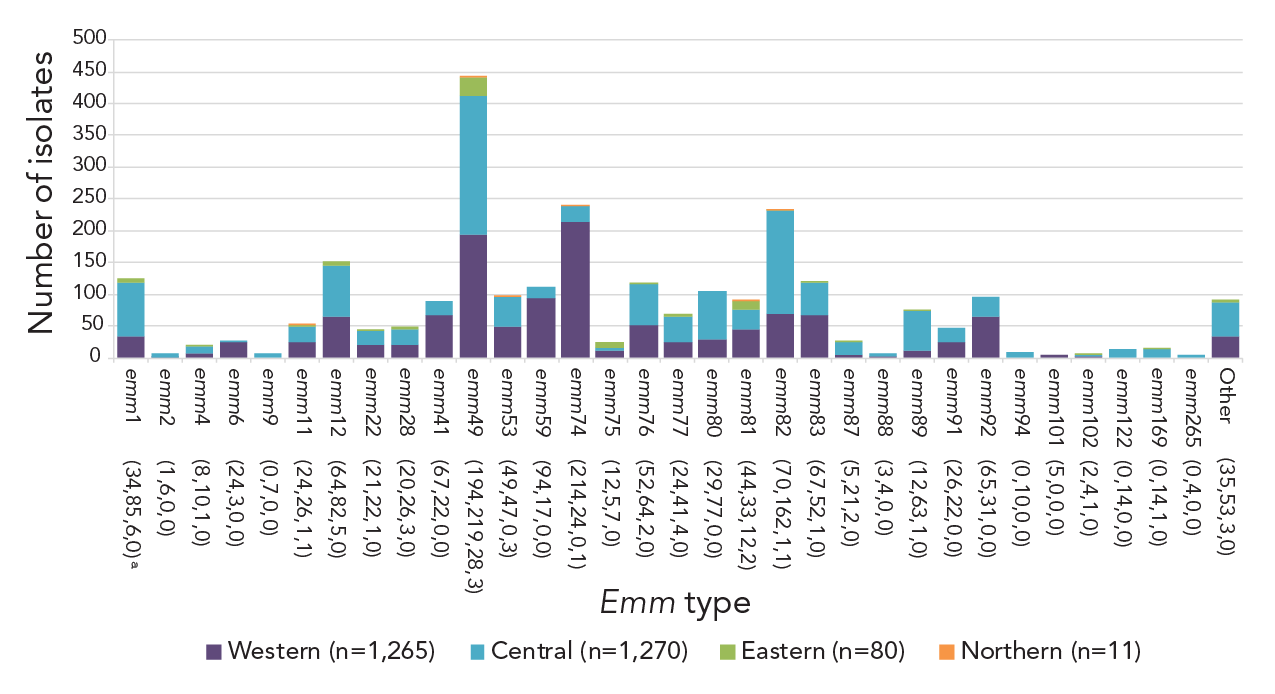
Figure 5B - Text description
| emm type | Western (n=1,265) |
Central (n=1,270) |
Eastern (n=80) |
Northern (n=11) |
|---|---|---|---|---|
| emm 1 (34,85,6,0)a | 34 | 85 | 6 | 0 |
| emm 2 (1,6,0,0) | 1 | 6 | 0 | 0 |
| emm 4 (8,10,1,0) | 8 | 10 | 1 | 0 |
| emm 6 (24,3,0,0) | 24 | 3 | 0 | 0 |
| emm 9 (0,7,0,0) | 0 | 7 | 0 | 0 |
| emm 11(24,26,1,1) | 24 | 26 | 1 | 1 |
| emm 12(64,82,5,0) | 64 | 82 | 5 | 0 |
| emm 22(21,22,1,0) | 21 | 22 | 1 | 0 |
| emm 28(20,26,3,0) | 20 | 26 | 3 | 0 |
| emm 41(67,22,0,0) | 67 | 22 | 0 | 0 |
| emm 49(194,219,28,3) | 194 | 219 | 28 | 3 |
| emm 53(49,47,0,3) | 49 | 47 | 0 | 3 |
| emm 59(94,17,0,0) | 94 | 17 | 0 | 0 |
| emm 74(214,24,0,1) | 214 | 24 | 0 | 1 |
| emm 75(12,5,7,0) | 12 | 5 | 7 | 0 |
| emm 76(52,64,2,0) | 52 | 64 | 2 | 0 |
| emm 77(24,41,4,0) | 24 | 41 | 4 | 0 |
| emm 80(29,77,0,0) | 29 | 77 | 0 | 0 |
| emm 81(44,33,12,2) | 44 | 33 | 12 | 2 |
| emm 82(70,162,1,1) | 70 | 162 | 1 | 1 |
| emm 83(67,52,1,0) | 67 | 52 | 1 | 0 |
| emm 87(5,21,2,0) | 5 | 21 | 2 | 0 |
| emm 88(3,4,0,0) | 3 | 4 | 0 | 0 |
| emm 89(12,63,1,0) | 12 | 63 | 1 | 0 |
| emm 91(26,22,0,0) | 26 | 22 | 0 | 0 |
| emm 92(65,31,0,0) | 65 | 31 | 0 | 0 |
| emm 94(0,10,0,0) | 0 | 10 | 0 | 0 |
| emm101(5,0,0,0) | 5 | 0 | 0 | 0 |
| emm102(2,4,1,0) | 2 | 4 | 1 | 0 |
| emm122(0,14,0,0) | 0 | 14 | 0 | 0 |
| emm169(0,14,1,0) | 0 | 14 | 1 | 0 |
| emm265(0,4,0,0) | 0 | 4 | 0 | 0 |
| Other (35,53,3,0) | 35 | 53 | 3 | 0 |
Upon request, NML provides assistance to provincial and territorial public health laboratories for iGAS outbreak/case cluster investigations (including non-invasive isolates from screening) and jurisdictional emm increases. During 2021, NML assisted in four outbreak investigations from various jurisdictions, including emm53 (n=3 cases), emm76 (n=45), emm77 (n=2) and one multi-emm type outbreak (emm49 and emm53, n=8). An increased number of requests were received in 2022, where NML assisted with a jurisdictional increase (emm49) and seven outbreak investigations, including emm1.3 (n=3), emm41.11 (n=7 and n=9), emm49 (n=4), emm89 (n=23 and n=4) and two multi-emm type outbreaks (emm49, emm53, emm76, emm77, emm83.1, emm91 and emm169.3, n=20; emm6.4, emm41.11, emm49, emm59, emm74, emm75 and emm83.1, n=26).
Antimicrobial resistance among iGAS isolates remained low in 2021–2022 (Figure 6, Appendix, Table S2). Erythromycin resistance increased significantly from 9.8% in 2018 to 14.1% in 2022 (p<0.0001), while chloramphenicol resistance decreased significantly from 1.2% to 0.3% (p<0.0001). Clindamycin resistance remained relatively stable over the study period (2.9%–4.8%). There was no resistance observed to penicillin or vancomycin. Emm types associated with erythromycin resistance and constitutive and inducible clindamycin resistance were similar in 2021 and 2022, including emm11 (88.9%/93.5% erythromycin resistance; 27.8%/22.6% constitutive clindamycin resistance; 66.7%/71.0% inducible clindamycin resistance); emm77 (92.3%/82.0%; 0%/0%; 92.3%/82.0%); emm83 (29.5%/42.7%; 4.9%/1.8%; 29.5%/42.7%) and emm92 (100%/95.5%; 0%/4.5%; 96.7%/69.3%) (Appendix, Figures S12–S13, Tables S3–S4).
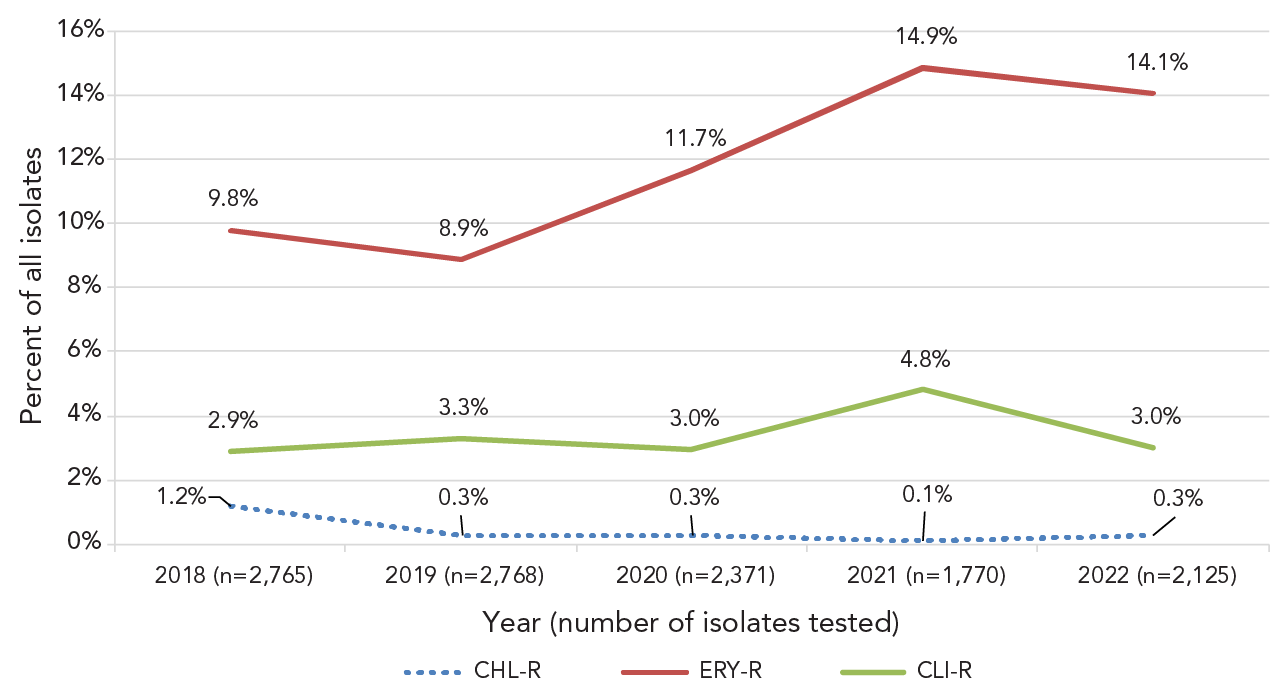
Figure 6 - Text description
This figure is a line graph displaying the percentage of all invasive Streptococcus pyogenes isolates determined to be clarithromycin-resistant, clindamycin-resistant and chloramphenicol-resistant each year, from 2018 to 2022.
| Isolates | 2018 (n=2,765) |
2019 (n=2,768) |
2020 (n=2,371) |
2021 (n=1,770) |
2022 (n=2,125) |
|---|---|---|---|---|---|
| CHL-R | 1.2% | 0.3% | 0.3% | 0.1% | 0.3% |
| ERY-R | 9.8% | 8.9% | 11.7% | 14.9% | 14.1% |
| CLI-R | 2.9% | 3.3% | 3.0% | 4.8% | 3.0% |
Discussion
In 2021, 2,127 cases of iGAS were reported to CNDSS, with a national incidence rate of 5.56 cases per 100,000 population, a considerably lower rate than the peak seen in 2018 (8.61 cases per 100,000 population). This low incidence in 2021 is consistent with the lower rate seen in 2020 (6.85 cases per 100,000 population) and can likely be attributed to indirect effects of the containment measures put in place in 2020 to prevent the spread of the SARS-CoV-2 pandemic virus (COVID-19). Numerous studies have observed that invasive bacterial disease activity due to pathogens transmitted by respiratory droplets (including S. pyogenes) decreased during this time Footnote 2Footnote 8Footnote 9Footnote 10.
Beginning in 2022, many countries began to see levels of iGAS disease increase once again. In December 2022, the WHO reported that five European countries had been observing increased cases of iGAS and scarlet fever, predominantly in children Footnote 3. Subsequently, the United States' CDC advised of increased paediatric iGAS disease in several states, including Colorado, Minnesota, and Texas Footnote 11Footnote 12Footnote 13, and the Pan American Health Organization (PAHO) published an informative note urging member countries to remain watchful for iGAS cases after several were identified in Uruguay Footnote 14. In Canada, there was an increase in the number of iGAS isolates submitted to NML in 2022 in comparison to 2021. Though the total yearly count did not exceed the highest totals collected pre-pandemic (years 2018 and 2019), there was a large increase in isolates collected in 2022-Q4, including in children. The WHO indicated that the increase in iGAS infections may be due to increased population mixing following a period of reduced circulation of GAS during the COVID-19 pandemic, and increased circulation of respiratory viruses Footnote 3; respiratory viruses and viral co-infections are associated with GAS infections and may increase the risk of invasive disease Footnote 3Footnote 15. Though our current study is unable to provide any Canadian data on viral co-infections with iGAS, several studies, including those in France, the United Kingdom, and the United States, reported increased rates of viral infection prior to or concurrent with iGAS infections Footnote 12Footnote 16Footnote 17. Associated viruses included influenza, respiratory syncytial virus, SARS-CoV-2 pandemic virus, human metapneumovirus, and rhinovirus Footnote 12Footnote 16Footnote 17.
Of note, countries reporting an increase in paediatric iGAS disease in late 2022 universally identified emm types 1 and 12 as the predominant cause of cases Footnote 12Footnote 13Footnote 18Footnote 19Footnote 20Footnote 21. In Canada, prevalence of emm1 was decreasing considerably going into the COVID-19 pandemic and was virtually non-existent in 2021 (0.5% of collected isolates). Though emm1 counts remained relatively low at the beginning of 2022, the prevalence did increase in Canada in Q4, as was seen in other countries. Almost half of emm1 isolates tested in 2022 were the M1UK lineage originally described by Lynskey et al., as associated with hyperproduction of the SpeA exotoxin Footnote 7. Belgium, Netherlands, and the United Kingdom have also noted high rates (~75%) of the M1UK lineage in 2022 Footnote 22Footnote 23Footnote 24. Emm12 has similarly been associated with toxigenic lineages; this type has previously been linked with outbreaks of scarlet fever, with associated lineages possessing exotoxin SpeC and superantigen SSA, as well as antimicrobial resistance Footnote 25. Prior to 2022, prevalence of emm12 was decreasing significantly in Canada. A large increase in prevalence in 2022-Q4 (just over 13% of all isolates collected), resulted in an increase to ~6% overall in 2022. Little antimicrobial resistance was seen in emm12 during that time. Studies in the United States (Colorado, Minnesota, Texas) also did not identify any resistance during their late 2022 increases of emm12 Footnote 12Footnote 13. In Portugal, the 2022 iGAS increase was characterized by emm12 isolates with high genomic diversity, with no expansion of a particular lineage Footnote 20. Further genomic characterization of emm12 isolates in Canada would be useful to identify toxin profiles and potential outbreak lineages.
The most common emm type collected in Canada since 2020 has been emm49. At the time of writing our previous annual report in 2020 Footnote 2, emm49 was not common in the literature as a frequent or emerging type. However, more recently, a study from the United States identified emm49 as increasingly associated with antimicrobial resistance. Li et al. have identified a macrolide and lincosamide-resistant sublineage of emm49 that has rapidly expanded in the state of Maryland to become the dominant lineage Footnote 26. A Spanish study also noted the emergence of emm49 in late 2022 after previously being rarely detected in the country. These isolates differed from the American lineage in that they demonstrated resistance to only tetracycline Footnote 21. Though antimicrobial resistance in emm49 was rarely detected in Canada in 2021 and 2022 (<2% erythromycin resistance), it will be important to monitor for the emergence of drug-resistant clones.
Streptococcus pyogenes remains susceptible to penicillin, the first-line antimicrobial treatment for iGAS infections, however, resistance to erythromycin (a second-line therapy) continues to increase in Canada. In 2021 and 2022, commonly collected emm types in Canada with high levels (>40%) of erythromycin resistance were similar to those reported in 2020, including emm11, emm77, emm83, and emm92 Footnote 2. Of these, emm83 and emm92 demonstrated significant increases over the 2018 to 2022 time period. Similar studies from other countries confirm that these emm types demonstrate resistance elsewhere, such as Spain (emm11, emm77) and the United States (emm11, emm83, emm92) Footnote 26Footnote 27. Of note is emm92, which was identified in West Virginia, United States, as an emm type with uniform resistance to macrolides/lincosamides that is disproportionately affecting patients with a history of intravenous drug use Footnote 28. In Canada, iGAS disease outbreaks often occur in at-risk groups, such as persons experiencing homelessness or those who abuse substances, closed populations such as long-term care facilities, and Indigenous communities Footnote 29Footnote 30; it will be of significant concern if drug-resistant emm92 continues to expand in Canada into vulnerable populations.
Limitations
Caution should be exercised when interpreting the data presented in this report, as the overall interpretation of the results is limited to only isolates available for testing. Only a subset of the laboratory isolates from each province may have been submitted for testing, therefore, this report does not reflect the true incidence or rates of disease in Canada. The representativeness of the proportions of isolates submitted to NML for testing as compared to the CNDSS are presented in Appendix, Table S5. Not all provinces and territories report line list data to CNDSS, which means that only aggregated data are available at the national level. Therefore, CNDSS data and NML laboratory data are presented differently in terms of age grouping.
Conclusion
Though the number of isolates collected was low in 2021, iGAS counts increased in 2022, particularly in the latter part of the year. Emm49 remained the most common type collected in Canada for 2021 and 2022; however, emm1 and emm12 began to rapidly increase in prevalence in the final quarter of 2022. As iGAS counts continue to rise following the COVID-19 pandemic, continued surveillance is imperative to monitor emm types and antimicrobial resistance in Canada. Enhancing surveillance to include linked epidemiological and laboratory data would improve our knowledge and interpretation of how iGAS emm types and antimicrobial resistance patterns affect at-risk groups in Canada.
Authors' statement
- ARG — Formal analysis, data curation, visualization, writing–original draft, review & editing of final version
- AG — Formal analysis, validation, investigation, data curation, visualization, writing–review & editing
- GJT — Resources, methodology, writing–review & editing
- JVK — Resources, methodology, writing–review & editing
- AM — Resources, methodology, writing–review & editing
- MCD — Resources, methodology, writing–review & editing
- LH — Resources, methodology, writing–review & editing
- JMinion — Resources, methodology, writing–review & editing
- PVC — Resources, methodology, writing–review & editing
- HS — Resources, methodology, writing–review & editing
- DH — Resources, methodology, writing–review & editing
- YY — Resources, methodology, writing–review & editing
- XD — Resources, methodology, writing–review & editing
- LS — Resources, methodology, writing–review & editing
- JMcFadzen — Resources, methodology, writing–review & editing
- CP — Writing–review & editing
- KF — Writing–review & editing
- IM — Conceptualization, validation, methodology, supervision, project administration, writing–review & editing
Competing interests
None.
Acknowledgements
We thank Angela Yuen and Rachel Hink from the Streptococcus and Sexually Transmitted Infections Unit at NML for their laboratory technical assistance, and the staff of provincial and public health laboratories in Canada for participating in the national laboratory surveillance program.
Funding
This project was supported by internal funding from the Public Health Agency of Canada.
Appendix
Supplemental figures and tables are available upon request to the author.
- Table S1: Annual incidence rates of invasive Streptococcus pyogenes in Canada by age group, 2011–2021
- Figure S1: Clinical isolation sites of Streptococcus pyogenes from children younger than 15 years of age in A) 2021 (n=85) and B) 2022 (n=190)
- Figure S2: Clinical isolation sites of Streptococcus pyogenes from patients 15 years of age or older in A) 2021 (n=2,094) and B) 2022 (n=2,436)
- Figure S3: Percentage of invasive Streptococcus pyogenes isolates from blood in 2021 (n=1,509) and 2022 (n=1,853), by emm type
- Figure S4: Percentage of invasive Streptococcus pyogenes isolates from other sterile sites in 2021 (n=664) and 2022 (n=769), by emm type
- Figure S5: Percentage of invasive Streptococcus pyogenes isolates from cerebrospinal fluid in 2021 (n=6) and 2022 (n=8), by emm type
- Figure S6: Prevalence of invasive Streptococcus pyogenes emm types isolated from patients less than 15 years old in 2021 (n=85) and 2022 (n=190)
- Figure S7: Prevalence of invasive Streptococcus pyogenes emm types isolated from patients 15 years and older in 2021 (n=2,080) and 2022 (n=2,425)
- Figure S8: Prevalence of the ten most common invasive Streptococcus pyogenes emm types collected from Western Canada in A) 2021 and B) 2022
- Figure S9: Prevalence of the ten most common invasive Streptococcus pyogenes emm types collected from Central Canada in A) 2021 and B) 2022
- Figure S10: Prevalence of the ten most common invasive Streptococcus pyogenes emm types collected from Eastern Canada in A) 2021 and B) 2022
- Figure S11: Prevalence of the ten most common invasive Streptococcus pyogenes emm types collected from Northern Canada in A) 2021 and B) 2022
- Table S2: Antimicrobial-resistant invasive Streptococcus pyogenes isolates by year, 2018–2022
- Figure S12: Percentage of macrolide and lincosamide resistant Streptococcus pyogenes isolates collected in 2021, by emm type
- Figure S13: Percentage of macrolide and lincosamide resistant Streptococcus pyogenes isolates collected in 2022, by emm type
- Table S3: Percentage of macrolide and lincosamide resistant Streptococcus pyogenes isolates collected in 2021, by emm type
- Table S4: Percentage of macrolide and lincosamide resistant Streptococcus pyogenes isolates collected in 2021, by emm type
- Table S5: Number of invasive Streptococcus pyogenes isolates types by the National Microbiology Laboratory (NML) in comparison to the total number of cases reported to the Canadian Notifiable Diseases Surveillance System (CNDSS) in 2021, by patient age group
