
Comparison of 13-, 15- and 20-valent pneumococcal conjugate vaccines in the paediatric Canadian population

 Download this article as a PDF (614 KB)
Published by: The Public Health Agency of Canada
Issue: Volume 51-2/3, February/March 2025: Health Economics in Public Health
Date published: February 2025
ISSN: 1481-8531
Submit a manuscript
About CCDR
Browse
Volume 51-2/3, February/March 2025: Health Economics in Public Health
Health Economics
Comparison of 13-, 15- and 20-valent pneumococcal conjugate vaccines in the paediatric Canadian population: A cost-utility analysis
Alison E Simmons1,2, Gebremedhin B Gebretekle1, Robert Pless1, Aleksandra Wierzbowski1, Matthew Tunis1, Ashleigh R Tuite1,2
Affiliations
1 Infectious Diseases and Vaccination Program Branch, Public Health Agency of Canada, Ottawa, ON
2 Dalla Lana School of Public Health, University of Toronto, Toronto, ON
Correspondence
Suggested citation
Simmons AE, Gebretekle GB, Pless R, Wierzbowski A, Tunis M, Tuite AR. Comparison of 13-, 15- and 20-valent pneumococcal conjugate vaccines in the paediatric Canadian population: A cost-utility analysis. Can Commun Dis Rep 2025;51(2/3):68–83. https://doi.org/10.14745/ccdr.v51i23a02
Keywords: pneumococcal disease, vaccination, cost-utility analysis, health economics, modelling
Abstract
Background: Two pneumococcal conjugate vaccines, covering 15 and 20 Streptococcus pneumoniae serotypes (Pneu-C-15 and Pneu-C-20, respectively), were recently approved for use in the Canadian paediatric population.
Objective: To assess the cost-effectiveness of Pneu-C-15 and Pneu-C-20 in unvaccinated infants initiating routine pneumococcal vaccination, compared to the currently used 13-valent conjugate vaccine (Pneu-C-13).
Methods: A static cohort model was used to estimate sequential incremental cost-effectiveness ratios (ICERs in 2022 Canadian dollars per quality-adjusted life year [QALY]) of Pneu-C-13, Pneu-C-15 and Pneu-C-20 in the paediatric population starting their primary series. Costs and outcomes were calculated over a 10-year time horizon at the program level and a lifetime time horizon at the individual level and discounted at a rate of 1.5% per year. We explored the impact of uncertainties in model parameters and assumptions in scenario and sensitivity analyses.
Results: Routine use of Pneu-C-20 and, to a lesser extent, Pneu-C-15 is projected to reduce pneumococcal disease burden, compared to Pneu-C-13. Based on product cost assumptions, sequential ICERs for Pneu-C-15 and Pneu-C-20 were $58,800 and $135,200 per QALY gained from the health system perspective and $18,272 and $93,416 per QALY gained from the societal perspective, excluding indirect effects. A reduction in serotype-attributable disease due to indirect vaccine effects of 5% or greater resulted in ICERs below $30,000 per QALY gained for Pneu-C-15 and Pneu-C-20, with the optimal strategy determined by the magnitude and time to reach a reduction in pneumococcal disease.
Conclusion: Both Pneu-C-15 and Pneu-C-20 are expected to increase QALYs in Canadian children compared to Pneu-C-13 and may be cost-effective interventions.
Introduction
Pneumococcal disease (PD), caused by Streptococcus pneumoniae, causes significant global morbidity and mortality, particularly in children, older adults and people with immunocompromising conditions. Although S. pneumoniae frequently colonizes the human nasopharynx without causing illness, it can cause severe invasive (e.g., meningitis and bacteremia) and, more commonly, non-invasive (e.g., pneumococcal community acquired pneumonia [pCAP] and acute otitis media [AOM]) disease Footnote 1. More than 100 distinct capsular types, or serotypes, of S. pneumoniae have been identified, but the majority of invasive pneumococcal disease (IPD) cases are attributed to a subset of these serotypes Footnote 2Footnote 3.
Infectious disease modelling is often used to support pneumococcal vaccine decisions due to complex serotype dynamics observed over years under previous vaccination schedules. In the early 2000s, the first pneumococcal conjugate vaccines (Pneu-C-7 and Pneu-C-10) were authorized for use in Canada and were provided in publicly funded immunization programs. In 2009, Pneu-C-13 vaccine received approval and in 2010, Canada’s National Advisory Committee on Immunization (NACI) recommended that healthy children receive 2+1 doses of Pneu-C-13 at two, four and 12–15 months of age or 3+1 doses of Pneu-C-13 at two, four, six and 12–18 months of age Footnote 4. The Pneu-C-13 vaccine consists of serotypes 1, 3, 4, 5, 6A, 6B, 7F, 9V, 14, 18C, 19A, 19F and 23F. Two pneumococcal conjugate vaccines, covering 15 and 20 S. pneumoniae serotypes, were authorized by Health Canada for use in paediatric populations on July 8, 2022 (Pneu-C-15) and July 21, 2023 (Pneu-C-20). The Pneu-C-15 vaccine includes Pneu-C-13 serotypes as well as serotypes 22F and 33F, and Pneu-C-20 includes Pneu-C-13 serotypes as well as serotypes 8, 10A, 11A, 12F, 15B, 22F and 33F Footnote 5Footnote 6.
Following the introduction of Pneu-C-13, the incidence of IPD caused by the 13 S. pneumoniae serotypes included in the vaccine decreased across all age groups Footnote 7Footnote 8Footnote 9; however, overall IPD incidence remained relatively unchanged across all age groups due to S. pneumoniae serotype replacement as well as persistence of some Pneu-C-13 serotypes Footnote 10Footnote 11. Between 2016 and 2020, a significant increase in IPD caused by serotypes 19F and 11A was observed among children younger than five years old in Canada Footnote 12. Serotype 19F is included in Pneu-C-13, Pneu-C-15 and Pneu-C-20, and serotype 11A is included only in Pneu-C-20.
Given the broader serotype coverage provided by Pneu-C-15 and Pneu-C-20, we conducted a model-based economic evaluation to assess the cost-effectiveness of their use in the Canadian paediatric population compared to the current standard of care.
Methods
We developed a static Markov cohort model to quantify the health impact of three paediatric pneumococcal vaccination strategies in previously unvaccinated infants. We compared 2+1 doses of Pneu-C-13 (current policy), Pneu-C-15 and Pneu-C-20. Streptococcus pneumoniae-associated health outcomes from the cohort model were used to inform a cost-utility analysis. Outcomes included the incidence of IPD, non-invasive pCAP and AOM, hospitalizations, deaths, costs, quality-adjusted life years (QALYs) and incremental cost-effectiveness ratios (ICERs). At the time of the analysis, NACI had not yet published recommendations for the use of Pneu-C-15 and Pneu-C-20 in the paediatric population. This economic analysis was conducted to support the development of NACI’s recommendations and additional details of the economic evidence considered are available online Footnote 13.
Model structure
Our model followed a multi-age, open population cohort over 10 years. Birth and death rates within the cohort were informed by Canadian population projections Footnote 14Footnote 15Footnote 16. Individuals were free of PD at model entry, but could develop IPD, pCAP and AOM over their lifetime (Figure 1, Table 1). A subset of individuals with IPD developed post-meningitis sequelae. We assumed IPD was treated in an inpatient setting, pCAP was treated in an inpatient or outpatient setting and AOM was treated in an outpatient setting. Incidence, costs and health consequences of AOM were restricted to individuals younger than 10 years of age Footnote 17.
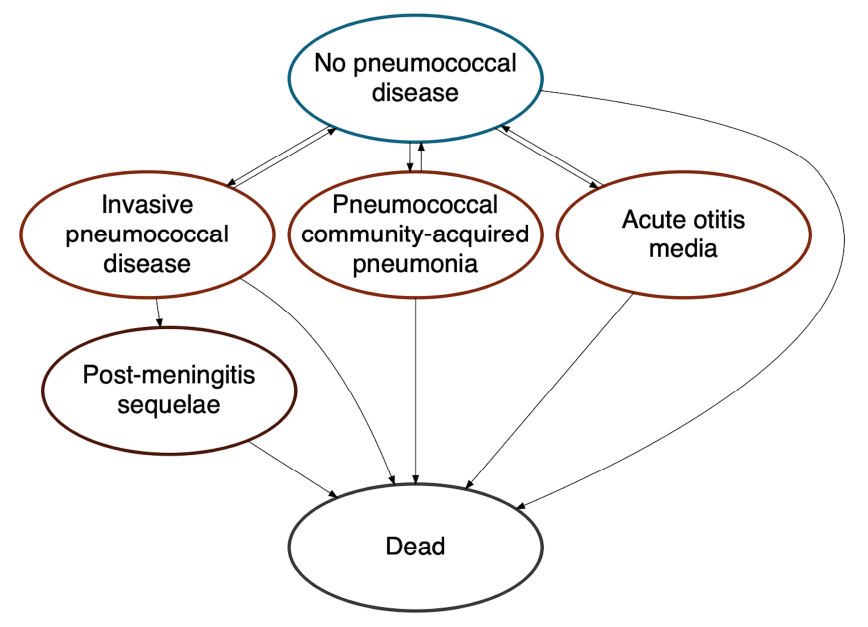
Figure 1: Descriptive text
Schematic of the pneumococcal model in which the relation between different health states is represented with ovals labelled with each health state and arrows representing how people can move between the different health states. There is a two-way relationship between "no pneumococcal disease" and the "invasive pneumococcal disease", "pneumococcal community-acquired pneumonia", and "acute otitis media" states, indicating that people can develop pneumococcal disease and recover. There is one-way movement from "invasive pneumococcal disease" to "post-meningitis sequelae", indicating that some people will develop long-term consequences of infection and not recover. People can move to the "dead" state from any of the other health states and cannot exit this state once they enter it.
- Figure 1 Footnote a
-
Vaccinated and unvaccinated people experienced the same health states, with risk modified based on vaccination status, type of vaccine received and time since vaccination
- Figure 1 Footnote b
-
Post-meningitis sequelae include auditory and neurologic sequelae
| Parameter | Base | Range | Reference(s) |
|---|---|---|---|
| IPD incidence (per 100,000 population) | |||
| Younger than 2 years | 14.5 | - | CNDSS, 2019; ICS program, 2019 Footnote 18 |
| 2–4 years | 10.2 | - | |
| 5–17 years | 2.1 | - | |
| 18–49 years | 5.2 | - | |
| 50–64 years | 13.6 | - | |
| 65 years and older | 23.8 | - | |
| CAP incidence (per 100,000 population) | |||
| Younger than 5 years | 4,991.1 | - | Nasreen et al., 2022 Footnote 19 |
| 5–17 years | 1,249.0 | - | |
| 18–39 years | 815.9 | - | |
| 40–64 years | 1,529.9 | - | |
| 65–74 years | 3,095.7 | - | |
| 75–84 years | 5,398.1 | - | |
| 85 years and older | 10,122.7 | - | |
| AOM incidence (per 100,000 population) | |||
| Younger than 5 years | 25,467.6 | - | Nasreen et al., 2022 Footnote 19 |
| 5–17 years | 7,225.9 | - | |
| 18–39 years | 2,204.4 | - | |
| 40–64 years | 2,058.6 | - | |
| 65–74 years | 1,954.7 | - | |
| 75–84 years | 1,857.4 | - | |
| 85 years and older | 1,621.4 | - | |
| Relative risk of PD in higher incidence setting | |||
| Younger than 2 years | 6.8 | - | CNDSS, 2019; ICS program, 2015–2019 Footnote 18 |
| 2–4 years | 0.9 | - | |
| 5–17 years | 3.9 | - | |
| 18–49 years | 2.1 | - | |
| 50–64 years | 2.1 | - | |
| 65 years and older | 2.4 | - | |
| Proportion of patients with CAP attributed to S. pneumoniae (%) | |||
| Younger than 1 year | 6.0 | 5.1–9.1 | King, 2023; LeBlanc et al., 2022; Pneumonia Etiology Research for Child Health (PERCH) Study Group, 2019 Footnote 20Footnote 21Footnote 22 |
| 1–15 years | 12.0 | 10.1–18.2 | |
| 16–49 years | 19.5 | 17.3–21.7 | |
| 50–64 years | 19.0 | 17.3–20.7 | |
| 65 years and older | 11.2 | 10.4–12.1 | |
| Proportion of patients with AOM attributed to S. pneumoniae (%) | |||
| Younger than 18 years | 17 | 14–22 | Kim et al., 2017; King, 2023 Footnote 20Footnote 23 |
| Proportion of patients with pCAP managed in inpatient setting (%) | |||
| Younger than 65 years | 4.6 | 2.2–9.3 | O’Reilly et al., 2023 Footnote 24 |
| 65 years and older | 12.3 | 7.9–18.6 | |
| Proportion of patients with IPD with meningitis (%) | |||
| Younger than 1 year | 16.9 | 13.3–21.1 | Morrow et al., 2007 Footnote 17 |
| 1–4 years | 4.6 | 3.0–6.8 | |
| 5–9 years | 8.7 | 4.1–15.9 | |
| 10–19 years | 8.5 | 5.1–13.3 | |
| 20–64 years | 5.1 | 3.9–6.4 | |
| 65 years and older | 3.1 | 2.2–4.1 | |
| Proportion of patients with meningitis with long-term post-meningitis sequelae (%) | |||
| Neurologic sequelae | 12.2 | 5.3–19.1 | Jit, 2010 Footnote 25 |
| Hearing loss | 8.2 | 4.5–11.9 | |
| Proportion of patients with AOM with ear tube placement (%) | |||
| Younger than 10 years | 6 | 4–12 | Canadian Institute for Health Information, 2020; Chuck et al., 2010; Nasreen et al., 2022; Assumption Footnote 19Footnote 26Footnote 27 |
| IPD case fatality (%) | |||
| Younger than 1 year | 11.8 | 11.2–12.3 | Wijayasri et al., 2019 Footnote 7 |
| 1–4 years | 1.6 | 0.8–2.7 | |
| 5–49 years | 5.7 | 4.9–6.7 | |
| 50–64 years | 10.9 | 9.9–12 | |
| 65 years and older | 17.2 | 16.2–18.3 | |
| pCAP (inpatient) case fatality (%) | |||
| Younger than 10 years | 1.0 | 0.3–3.1 | LeBlanc et al., 2022; Morrow et al., 2007; Assumption Footnote 17Footnote 22 |
| 10–15 years | 1.6 | 0.6–4.3 | |
| 16–49 years | 3.8 | 1.7–7.0 | |
| 50–64 years | 4.8 | 2.7–7.1 | |
| 65 years and older | 9.9 | 7.7–12.3 | |
| Vaccine-type serotype distribution (%), younger than 2 years | |||
| ST3 | 8 | - | National Microbiology Laboratory, 2019 Footnote 18 |
| Pneu-C-13/non-ST3 | 9 | - | |
| Pneu-C-15/non-Pneu-C-13 | 21 | - | |
| Pneu-C-20/non-Pneu-C-15 | 19 | - | |
| NVT | 43 | - | |
| Vaccine-type serotype distribution (%), 2–4 years | |||
| ST3 | 11 | - | National Microbiology Laboratory, 2019 Footnote 18 |
| Pneu-C-13/non-ST3 | 16 | - | |
| Pneu-C-15/non-Pneu-C-13 | 16 | - | |
| Pneu-C-20/non-Pneu-C-15 | 23 | - | |
| NVT | 33 | - | |
| Vaccine-type serotype distribution (%), 5–17 years | |||
| ST3 | 8 | - | National Microbiology Laboratory, 2019 Footnote 18 |
| Pneu-C-13/non-ST3 | 23 | - | |
| Pneu-C-15/non-Pneu-C-13 | 20 | - | |
| Pneu-C-20/non-Pneu-C-15 | 14 | - | |
| NVT | 35 | - | |
| Vaccine-type serotype distribution (%), 18–49 years | |||
| ST3 | 10 | - | National Microbiology Laboratory, 2019 Footnote 18 |
| Pneu-C-13/non-ST3 | 32 | - | |
| Pneu-C-15/non-Pneu-C-13 | 11 | - | |
| Pneu-C-20/non-Pneu-C-15 | 21 | - | |
| NVT | 26 | - | |
| Vaccine-type serotype distribution (%), 50–64 years | |||
| ST3 | 12 | - | National Microbiology Laboratory, 2019 Footnote 18 |
| Pneu-C-13/non-ST3 | 32 | - | |
| Pneu-C-15/non-Pneu-C-13 | 11 | - | |
| Pneu-C-20/non-Pneu-C-15 | 21 | - | |
| NVT | 26 | - | |
| Vaccine-type serotype distribution (%), 65 years and older | |||
| ST3 | 13 | - | National Microbiology Laboratory, 2019 Footnote 18 |
| Pneu-C-13/non-ST3 | 16 | - | |
| Pneu-C-15/non-Pneu-C-13 | 15 | - | |
| Pneu-C-20/non-Pneu-C-15 | 14 | - | |
| NVT | 42 | - | |
Abbreviations: AOM, acute otitis media; CAP, community acquired pneumonia; CNDSS, Canadian Notifiable Disease System; ICS, International Circumpolar Surveillance; IPD, invasive pneumococcal disease; NVT, non-vaccine type; pCAP, pneumococcal community acquired pneumonia; PD, pneumococcal disease; Pneu-C, pneumococcal conjugate vaccine; ST3, serotype 3; -, not applicable |
|||
Upon model entry, a proportion of each birth cohort was vaccinated at two, four and 12 months of age, based on estimated Pneu-C-13 vaccination coverage (Table 2) Footnote 28. Vaccination was assumed to reduce the risk of PD caused by the serotypes included in the vaccine. We assumed vaccine effectiveness (VE) for Pneu-C-15 and Pneu-C-20 was equivalent to VE for Pneu-C-13. All vaccines had a lower VE against serotype 3 compared to the other vaccine serotypes. In the model, vaccine-derived protection began after the second dose and waned over 15 years Footnote 29. The base case model did not include indirect effects of vaccination including herd immunity and serotype replacement.
| Parameter | Base | Range | Reference(s) |
|---|---|---|---|
| Vaccination coverage (%) | |||
| 2 doses | 87 | - | AssumptionFootnote a |
| 2+1 doses | 84.5 | - | Childhood National Immunization Coverage Survey (cNICS), 2022 Footnote 28 |
| Pneu-C effectiveness of 2+1 doses (%) | |||
| VT-IPD | 85 | 67–96 | Farrar et al., 2022; Prasad et al., 2023; Assumption Footnote 29Footnote 30 |
| ST3-IPD | 33 | 10–66 | Farrar et al., 2022; Prasad et al., 2023; Assumption Footnote 29Footnote 30 |
| VT-pCAP | 64 | 50–72 | Prasad et al., 2023; Stoecker, 2023; Assumption (based on adult data for relative VE for IPD vs. pCAP) Footnote 29Footnote 31 |
| ST3-pCAP | 25 | 19–28 | Assumption (based on IPD) |
| VT-AOM | 54 | 40–64 | Eskola, 2001 Footnote 32 |
| ST3-AOM | 21 | 15–25 | Assumption (based on IPD) |
| Pneu-C effectiveness of 2 doses | |||
| % of VE achieved with first 2 doses of series | 75 | 60–90 | Andrews et al., 2014; Assumption Footnote 33 |
| Duration of protection | |||
| Pneu-C | 15 years: stable for 5 years, linear decline to 0 over 10 years | - | Prasad et al., 2023 Footnote 29 |
Abbreviations: IPD, invasive pneumococcal disease; pCAP, pneumococcal community acquired pneumonia; Pneu-C, pneumococcal conjugate vaccine; ST3-AOM, serotype 3 acute otitis media; ST3-IPD, serotype 3 invasive pneumococcal disease; ST3-pCAP, serotype 3 pneumococcal community acquired pneumonia; VE, vaccine effectiveness; VT-AOM, vaccine-type acute otitis media; VT-IPD, vaccine-type invasive pneumococcal disease; VT-pCAP, vaccine-type pneumococcal community acquired pneumonia; -, not applicable Footnote
|
|||
Cost-utility analysis
We used the outputs from our model to inform a cost-utility analysis of the three vaccination strategies over a 10-year programmatic time horizon. A lifetime time horizon was used at the individual level (i.e., all long-term consequences of PD accrued over an individual’s lifetime were included). The assumed cost per dose in our base case was $71.50 for Pneu-C-13, $78.10 for Pneu-C-15 and $90.10 for Pneu-C-20 (Table 3). An unpublished analysis conducted by the Public Health Agency of Canada found that Canadian negotiated vaccine prices across all vaccine programs are typically 30%–50% of United States contract prices; we applied a 40% discount rate to the United States’ Centers for Disease Control and Prevention public vaccine prices to estimate the cost per dose in our base case Footnote 34. Costs and utilities were derived preferentially from Canadian surveillance data and published studies, and by assumption (Table 3, Table 4). We applied a discount rate of 1.5% to QALYs and costs, with costs inflated to 2022 Canadian dollars Footnote 35. Probabilistic model estimates were based on 10,000 simulations. For each model simulation, parameters were drawn from distributions and results were calculated for each scenario; summary results across the 10,000 simulations were computed. Values with ranges provided in Tables 1–4 indicate model parameters that were sampled probabilistically to capture uncertainty (i.e., sampled from beta distributions for probabilities and utilities and gamma distributions for costs). The model was constructed in R and parameters specifying distributions (shape and scale for gamma distributions and shape1 and shape2 for beta distributions) were estimated using the specified means and ranges Footnote 36Footnote 37. We conducted our analyses from both the health system and societal perspectives. In addition to including health outcome and health system costs, the latter also incorporates costs not paid by the publicly funded health system (e.g., direct out-of-pocket costs, productivity loss) Footnote 38.
| Parameter | Base ($) | Range ($) | Reference(s) |
|---|---|---|---|
| Cost per dose of vaccine | |||
| Vaccine administration | 16.77 | 12.58–20.96 | O’Reilly et al., 2017 Footnote 39 |
| Pneu-C-13 | 71.5 | - | Centers for Disease Control and Prevention; Assumption Footnote 34 |
| Pneu-C-15 | 78.1 (9.2% higher than Pneu-C-13) |
72.2–87.9 (1%–23% higher than Pneu-C-13) |
|
| Pneu-C-20 | 90.1 (26.1% higher than Pneu-C-13) |
78.6–107.2 (10%–50% higher than Pneu-C-13) |
|
| Cost per patient with IPD | |||
| Younger than 5 years | 20,468 | 17,422–23,755 | Discharge Abstract Database, 2015–2019 Footnote 40Footnote 41Footnote 42Footnote 43 |
| 5–17 years | 14,717 | 12,510–17,100 | |
| 18–49 years | 28,812 | 26,559–31,155 | |
| 50–64 years | 29,146 | 27,363–30,984 | |
| 65–74 years | 28,955 | 26,727–31,271 | |
| 75 years and older | 21,501 | 20,001–23,054 | |
| Cost per patient with pCAP managed in inpatient setting | |||
| Younger than 18 years | 7,345 | 7,189–7,545 | O’Reilly et al., 2023 Footnote 24 |
| 18–64 years | 14,185 | 13,708–14,686 | |
| 65 years and older | 14,179 | 13,931–14,433 | |
| Cost per patient with pCAP managed in outpatient setting | |||
| Younger than 18 years | 450 | 438–461 | O’Reilly et al., 2023 Footnote 24 |
| 18–64 years | 1,187 | 1,154–1,221 | |
| 65 years and older | 3,343 | 3,283–3,400 | |
| Cost per AOM case, excluding ear tube placement | |||
| Younger than 2 years | 260 | 258–301 | Gaboury et al., 2010; Assumption Footnote 44 |
| 2–9 years | 178 | 148–207 | |
| Cost of surgery for ear tube placement | 1,790 | 1,340–2,240Footnote a | Canadian Institute for Health Information, 2020 Footnote 26 |
| Cost of care for patients with post-meningitis sequelae (per year) | |||
| Annual cost of care for those with auditory sequelae | 2,783.3 | 2,087.5–3,479.2Footnote a | Christensen et al., 2014 Footnote 45 |
| Annual cost of care for those with neurologic sequelae | 9,262.4 | 6,946.8–11,578.0Footnote a | |
| Out-of-pocket costs | |||
| Medication, younger than 65 years | 18.1 | 13.6–22.6 | American Academy of Pediatrics, 2021; Metlay et al., 2019; Ontario Ministry of Health, 2022; Patented Medicine Prices Review Board Canada, 2019–2020 Footnote 46Footnote 47Footnote 48Footnote 49 |
| Transportation to inpatient care | 139 | 29–333 | Canada Revenue Agency, 2022; Colbert, 2020; Discharge Abstract Database, 2015–2019 Footnote 40Footnote 41Footnote 42Footnote 43Footnote 50Footnote 51 |
| Transportation to outpatient care | 3.7 | 2.8–4.6Footnote a | Canada Revenue Agency, 2022; Pong and Pitblado, 2005 Footnote 51Footnote 52 |
| Relative increase of direct costs in higher cost setting | |||
| Inpatient case | 1.8 | - | NACI Footnote 53 |
| Outpatient case | 1.2 | - | |
| Travel for outpatient case | 33 | - | |
| Workdays lost (16 years and older) | |||
| Inpatient IPD or pCAP | 15 | 9–29 | Pasquale et al., 2019 Footnote 54 |
| Outpatient pCAP | 5.4 | 1.8–6.3 | |
| Reduction in employment in patients with post-meningitis sequelae (%) | |||
| Auditory sequelae | 25 | 15–35 | Bizier et al., 2016; Jiang et al., 2012 Footnote 55Footnote 56 |
| Neurologic sequelae | 98 | 75–100 | Jiang et al., 2012; Assumption Footnote 56 |
| Caregiver workdays lost, IPD | |||
| Younger than 5 years | 11.2 | 9.4–13.0 | Discharge Abstract Database, 2015–2019 Footnote 40Footnote 41Footnote 42Footnote 43 |
| 5–15 years | 9.9 | 7.8–12.0 | |
| 16 years and older | 5.4 | 1.5–10.8 | Wyrwich et al., 2015 Footnote 57 |
| Caregiver workdays lost, inpatient pCAP | |||
| Younger than 5 years | 4.2 | 4.2–4.3 | Discharge Abstract Database, 2015–2019 Footnote 40Footnote 41Footnote 42Footnote 43 |
| 5–15 years | 5.0 | 7.8–12.0 | |
| 16 years and older | 5.4 | 1.5–10.8 | Wyrwich et al., 2015 Footnote 57 |
| Caregiver work days lost, outpatient pCAP | |||
| Younger than 16 years | 5.4 | 1.8–6.3 | Pasquale et al., 2019; Assumption Footnote 54 |
| 16 years and older | 1.1 | 1.0–1.2 | Dubé et al., 2011 Footnote 58 |
| Caregiver work days lost, AOM | |||
| AOM | 1.3 | 0.8–1.7 | Barber et al., 2014; Dubé et al., 2011 Footnote 58Footnote 59 |
| Ear tube placement | 2.1 | - | Petit et al., 2003 Footnote 60 |
| Caregiver work days lost, sequelae | |||
| Auditory sequelae (annual) | 0 | - | Assumption |
| Neurologic sequelae (annual) | 190 | 146–240Footnote a | Ganapathy et al., 2015 Footnote 61 |
| Caregiver work days lost, vaccination | |||
| Visit healthcare provider for vaccination | 0.5 | - | Assumption |
| Average employment income ($) | |||
| Age 16 years and older | Age-specific values | - | Statistics Canada Footnote 62 |
| Caregiver | 58,811 | - | |
| Labour force participation (%) | |||
| Age 16 years and older | Age-specific values | - | Statistics Canada Footnote 63 |
| Caregiver (age 25–54 years) | 87 | - | |
Abbreviations: AOM, acute otitis media; IPD, invasive pneumococcal disease; NACI, National Advisory Committee on Immunization; pCAP, pneumococcal community acquired pneumonia; Pneu-C, pneumococcal conjugate vaccine; -, not applicable Footnote
|
|||
| Parameter | Base | Range | Reference(s) |
|---|---|---|---|
| Background health utility | |||
| Younger than 6 years | 0.97 | 0.96–0.98 | Molina et al., 2023; Assumption Footnote 64 |
| 6–11 years | 0.95 | 0.94–0.96 | Molina et al., 2023 Footnote 64 |
| 12–17 years | 0.89 | 0.87–0.91 | Yan et al., 2023 Footnote 65 |
| 18–24 years | 0.879 | 0.863–0.895 | |
| 25–34 years | 0.881 | 0.864–0.898 | |
| 35–44 years | 0.878 | 0.863–0.893 | |
| 45–54 years | 0.855 | 0.838–0.872 | |
| 55–64 years | 0.839 | 0.822–0.856 | |
| 65–74 years | 0.867 | 0.849–0.885 | |
| 75 years and older | 0.861 | 0.835–0.887 | |
| IPD utility decrement | |||
| Younger than 19 years | 0.028 | 0.0165–0.0308 | Tang et al., 2022; Assumption Footnote 66 |
| 19–64 years | 0.0533 | 0.0425–0.0547 | |
| 65 years and older | 0.0745 | 0.0001–0.0745 | |
| Outpatient pCAP utility decrement | |||
| Younger than 19 years | 0.0004 | 0.0001–0.0329 | Tang et al., 2022 Footnote 66 |
| 19–64 years | 0.0094 | 0.0001–0.0205 | |
| 65 years and older | 0.0586 | 0.0271–0.0659 | |
| Inpatient pCAP utility decrement | |||
| Younger than 19 years | 0.0105 | 0.001–0.0155 | Tang et al., 2022; Assumption Footnote 66 |
| 19–64 years | 0.0396 | 0.0001–0.168 | |
| 65 years and older | 0.1154 | 0.0068–0.29 | |
| AOM utility decrement | |||
| Younger than 10 years | 0.0016 | 0–0.1461 | Tang et al., 2022 Footnote 66 |
| Auditory sequelae utility decrement (per year) | |||
| Younger than 19 years | 0.2137 | 0.07–0.72 | Tang et al., 2022 Footnote 66 |
| 19 years and older | 0.365 | 0.273–0.418 | Tang et al., 2022; Assumption Footnote 66 |
| Neurologic sequelae utility decrement (per year) | |||
| Younger than 19 years | 0.2456 | 0.16–0.49 | Tang et al., 2022 Footnote 66 |
| 19 years and older | 0.5278 | 0.22–0.783 | Tang et al., 2022; Assumption Footnote 66 |
Abbreviations: AOM, acute otitis media; IPD, invasive pneumococcal disease; pCAP, pneumococcal community acquired pneumonia; Pneu-C, pneumococcal conjugate vaccine |
|||
To compare the three vaccination strategies, we conducted a sequential cost-effectiveness analysis Footnote 38. In short, the three vaccination strategies were ordered from lowest to highest cost. Incremental costs and QALYs gained were compared between a given strategy and the next less costly strategy. A vaccination strategy was considered dominated if at least one other vaccination strategy was expected to result in additional QALYs gained at a lower cost.
Scenario and sensitivity analyses
We conducted a scenario analysis to estimate the potential impact of vaccine-derived indirect effects on ICERs by including an exponential decline in PD incidence caused by Pneu-C-15 specific serotypes (i.e., 22F and 33F) and Pneu-C-20 specific serotypes (i.e., 8, 10A, 11A, 12F, 15B, 22F and 33F) across all age groups. We included an exponential decline ranging from 0%–50%, with effects beginning one year after the vaccination program was implemented and taking five to 10 years to reach maximum effect.
We also evaluated the cost-effectiveness of the three vaccination strategies in a higher cost, higher PD incidence setting such as that observed in the circumpolar region Footnote 18Footnote 67. Age-specific relative risks were calculated by comparing IPD incidence in Yukon, Northwest Territories and Nunavut to all of Canada (including the territories) Footnote 18. A relative measure of the increased cost associated with medical care in Yukon, Northwest Territories and Nunavut compared to all of Canada was extracted from an economic analysis of pneumococcal vaccines in older adults Footnote 53. We applied these multipliers to S. pneumoniae-attributed health outcomes and relevant costs in our base case analysis.
In addition to a probabilistic sensitivity analysis, we conducted deterministic sensitivity analyses to examine the robustness of the base case findings to our assumptions. First, we examined the impact of varying key model parameters in our base case in a one-way sensitivity analysis. Parameters were varied across a range of values (Tables 1–4). Second, given the uncertainty of the prices of Pneu-C-15 and Pneu-C-20, we conducted a two-way sensitivity analysis. We varied the incremental price of Pneu-C-15 and Pneu-C-20 to be up to 50% higher than the assumed price of Pneu-C-13. Third, we lowered the incidence of pCAP and AOM in our model, reflective of data from British Columbia Footnote 19; data from Ontario informed our base case analysis. Fourth, we lowered the number of AOM cases projected to be prevented by replacing Pneu-C-13 with Pneu-C-15 or Pneu-C-20. This reflects the lower AOM incidence attributed Pneu-C-15 and Pneu-C-20 vaccine serotypes in the United States Footnote 68.
Although Canada does not have a set cost-effectiveness threshold, we used two common thresholds, $30,000 per QALY and $60,000 per QALY, in our scenario and sensitivity analyses for illustrative purposes Footnote 69Footnote 70.
Our study follows the Professional Society for Health Economics and Outcomes Research (ISPOR) Consolidated Health Economic Evaluation Reporting Standards (CHEERS) 2022.
Results
The use of Pneu-C-15 and Pneu-C-20 averted additional S. pneumoniae-attributable health outcomes over 10 years compared to the continued use of Pneu-C-13 (Figure 2). On average, Pneu-C-15 averted an additional 221 (interquartile range [IQR]: 206–233) IPD cases, 337 (IQR: 533–976) hospitalized pCAP cases, 7,428 (IQR: 6,965–7,885) outpatient pCAP cases and 51,143 (IQR: 47,184–55,089) AOM cases in the Canadian population compared to the continued use of Pneu-C-13 in our base case. The Pneu-C-20 vaccine averted an additional 468 (IQR: 436–494) IPD cases, 730 (IQR: 533–976) hospitalized pCAP cases, 16,084 (IQR: 15,082–17,071) outpatient pCAP cases and 109,527 (IQR: 101,054–117,926) AOM cases compared Pneu-C-13.
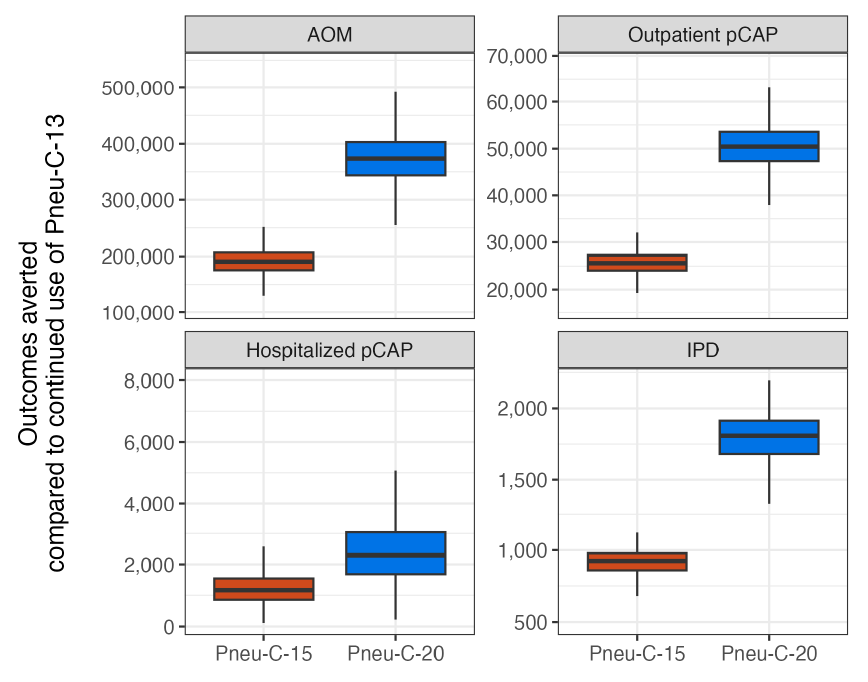
Figure 2: Descriptive text
| Strategy | Outcome | Minimum | Lower bound | Median | Upper bound | Maximum | |
|---|---|---|---|---|---|---|---|
| 1 | Pneu-C-15 | AOM | 35,369 | 47,183 | 51,143 | 55,089 | 66,903 |
| 2 | Pneu-C-20 | AOM | 75,773 | 101,054 | 109,527 | 117,926 | 143,075 |
| 3 | Pneu-C-15 | Outpatient pCAP | 5,588 | 6,965 | 7,428 | 7,885 | 9,263 |
| 4 | Pneu-C-20 | Outpatient pCAP | 12,098 | 15,082 | 16,084 | 17,071 | 20,049 |
| 5 | Pneu-C-15 | Hospitalized pCAP | 50 | 246 | 337 | 451 | 756 |
| 6 | Pneu-C-20 | Hospitalized pCAP | 107 | 533 | 730 | 976 | 1,638 |
| 7 | Pneu-C-15 | IPD | 165 | 206 | 221 | 233 | 263 |
| 8 | Pneu-C-20 | IPD | 350 | 436 | 468 | 494 | 556 |
Abbreviations: AOM, acute otitis media; IPD, invasive pneumococcal disease; pCAP, pneumococcal community acquired pneumonia; Pneu-C, pneumococcal conjugate vaccine
Footnote- Figure 2 Footnote a
-
Results are shown for 10,000 model simulations
From the health system perspective, replacing Pneu-C-13 with Pneu-C-15 is expected to save an average of 497 QALYs and cost an additional $30 million over 10 years (Table 5). Replacing Pneu-C-13 with Pneu-C-20 is expected to save an average of 1,039 QALYs and cost an additional $103 million over ten years. From the societal perspective, Pneu-C-15 is expected to cost an additional $9 million and Pneu-C-20 is expected to cost an additional $60 million over 10 years compared to the continued use of Pneu-C-13. From the health system perspective, Pneu-C-15 is most likely to be the optimal strategy at cost-effectiveness threshold ranges of $43,000 to $127,000 per QALY (Figure 3). Above $127,000 per QALY, Pneu-C-20 is most likely to be the optimal strategy. From the societal perspective, Pneu-C-15 is most likely to be the optimal strategy at cost-effectiveness threshold ranges of $3,000 to $86,000 per QALY, and Pneu-C-20 is most likely to be the optimal strategy at thresholds above $86,000 per QALY.
| Strategy | Effect (QALYs lost) |
Cost ($, millions) |
Sequential ICER ($/QALY) |
|---|---|---|---|
| Health system perspective | |||
| Pneu-C-13 | 229,769 | 4,945 | - |
| Pneu-C-15 | 229,272 | 4,975 | 58,823 |
| Pneu-C-20 | 228,730 | 5,048 | 135,289 |
| Societal perspective | |||
| Pneu-C-13 | 229,769 | 432,243 | - |
| Pneu-C-15 | 229,272 | 432,252 | 18,272 |
| Pneu-C-20 | 228,730 | 432,303 | 93,416 |
Abbreviations: ICER, incremental cost-effectiveness ratio; Pneu-C, pneumococcal conjugate vaccine; QALY, quality-adjusted life year; -, not applicable |
|||
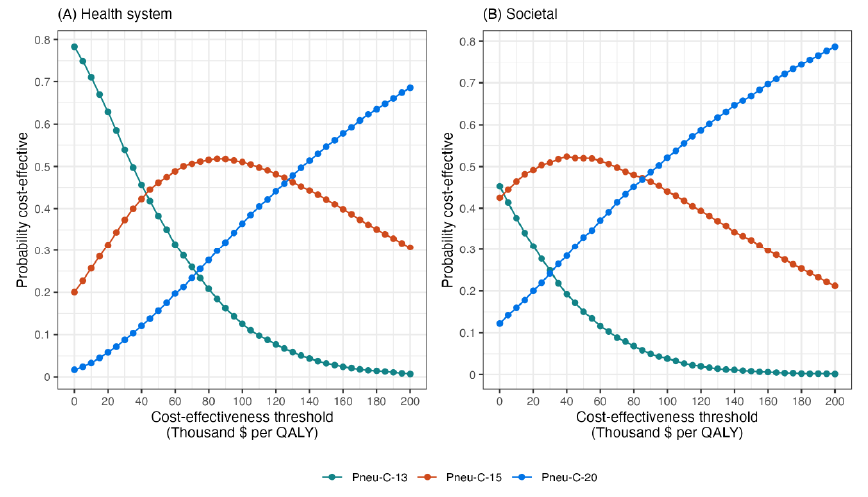
Figure 3: Descriptive text
This two-panel line graph shows the percent of simulations for which each vaccination strategy was optimal for a given cost-effectiveness threshold. Panel A shows results for the health system perspective and panel B shows results for the societal perspective. The x-axis is labelled "Cost-effectiveness threshold (Thousand $ per QALY)" and the scale ranges from 0 to 200. The y-axis is labelled "Probability cost-effective" and ranges from 0 to 0.8. There are lines on the graph for each vaccination strategy: Pneu-C-13, Pneu-C-15, and Pneu-C-20 and the lines show the probability that a given strategy is optimal for a given cost-effectiveness threshold, based on 10,000 model simulations. For the health system perspective, at low threshold values, Pneu-C-13 has the highest probability. At threshold values between $43,000 and $127,000, Pneu-C-15 has the highest probability. Above $127,000, Pneu-C-20 has the highest probability. For the societal perspective, Pneu-C-15 has the highest probability at threshold values of $3,000 to $86,000, with Pneu-C-20 having the highest probability at thresholds above $86,000.
Abbreviations: Pneu-C, pneumococcal conjugate vaccine; QALY, quality-adjusted life years
The inclusion of indirect effects leads to lower ICERs because of the resulting reduction in PD among population members who did not receive the vaccine (Figure 4). At a cost-effectiveness threshold of $30,000 per QALY, a 5% reduction in PD caused by the additional serotypes contained in Pneu-C-15 over a six-year period would result in Pneu-C-15 being the optimal strategy. At a cost-effectiveness threshold of $30,000 per QALY, a 10% or greater percent decrease in PD over a five-year period caused by the additional serotypes contained in Pneu-C-20 results in Pneu-C-20 being the preferred strategy. From the societal perspective, even smaller indirect effects would result in Pneu-C-15 or Pneu-C-20 being the optimal strategy.
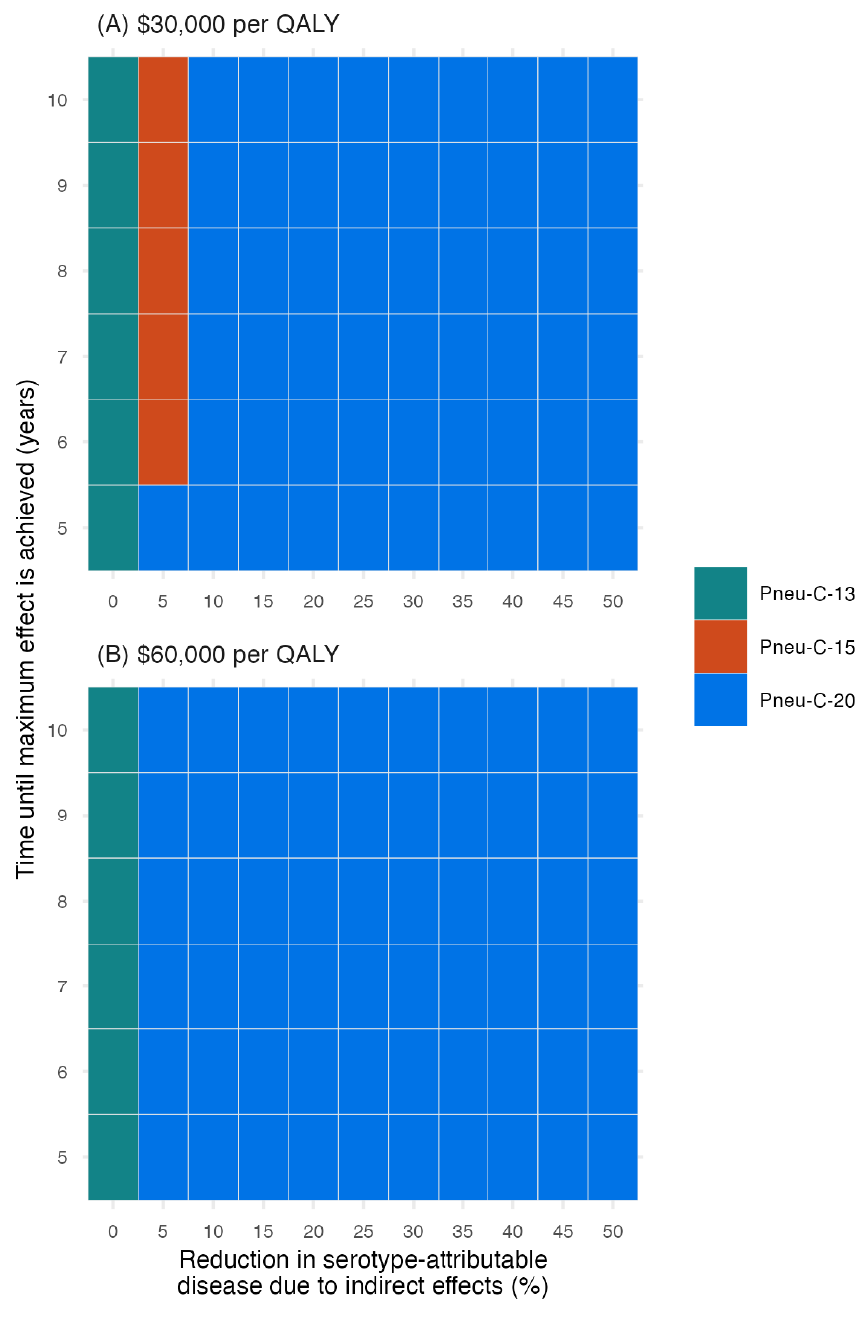
Figure 4: Descriptive text
This two-panel figure shows how the most cost-effective strategy changes when indirect effects are incorporated. Panel A shows results for a cost-effectiveness threshold of $30,000 per QALY and panel B shows results for $60,000 per QALY. For each figure, the x-axis shows the percent reduction in pneumococcal disease due to the additional serotypes contained in Pneu-C-15 or Pneu-C-20 and ranges from 0% to 50% in 5% increments. The y-axis shows the time until maximum effect is reached, ranging from 5 to 10 years. For each combination of x- and y-axis values, there is a shaded square that shows which strategy is optimal for the associated cost-effectiveness threshold. In both panels, Pneu-C-13 is the optimal strategy when the x-axis value is 0, representing the base case assumption of no indirect effects. For the top panel, there Pneu-C-15 is the optimal strategy when the magnitude of indirect effects is 5% and time to reach that effect is six years or more. For the rest of the parameter combinations at the $30,000 per QALY threshold, Pneu-C-20 is the optimal strategy. For the bottom panel, the remainder of the graph shows that Pneu-C-20 is the optimal strategy at the $60,000 per QALY threshold.
Abbreviations: Pneu-C, pneumococcal conjugate vaccine; QALY, quality-adjusted life year
Footnote- Figure 4 Footnote a
-
Results are a function of the percent reduction in serotype-attributable disease due to indirect effects and the time until the maximum effect is achieved
In a higher cost and higher PD incidence setting, on average, Pneu-C-15 averted an additional 925 (IQR: 859–979) IPD cases, 1,116 (IQR: 855–1,545) hospitalized pCAP cases, 25,638 (IQR: 24,055–27,254) outpatient pCAP cases and 190,760 (IQR: 175,466–205,884) AOM cases on average over 10 years compared to the continued use of Pneu-C-13 (Appendix, Figure A1). The Pneu-C-20 vaccine averted an additional 1,808 (IQR: 1,680–1,914) IPD cases, 2,294 (IQR: 1,683–3,039) hospitalized pCAP cases, 50,446 (IQR: 47,333–53,624) outpatient pCAP cases and 373,543 (IQR: 343,610–403,099) AOM cases compared Pneu-C-13. The Pneu-C-20 vaccine dominates (i.e., is less costly and more effective than) Pneu-C-13 and Pneu-C-15 from the both the health system and societal perspectives (Appendix, Table A1). The Pneu-C-20 vaccine is dominant, with lower costs and fewer QALYs lost than the current strategy (i.e., Pneu-C-13) and Pneu-C-15.
Our base case conclusions relied on several assumptions that we examined in sensitivity analyses. In our one-way sensitivity analysis of model parameters, vaccine price was the most influential parameter (not shown). When the relative vaccine prices of Pneu-C-15 and Pneu-C-20 compared to Pneu-C-13 were increased compared to their base case values, Pneu-C-13 remained the strategy with the lowest ICER (Figure 5). At a $30,000 per QALY threshold, Pneu-C-15 was the optimal strategy when the relative price increase of Pneu-C-15 was 5% or less than the price of Pneu-C-13. The Pneu-C-20 vaccine was the optimal strategy when the relative price increase of Pneu-C-20 was 10% or less than the price of Pneu-C-13. At a $60,000 per QALY threshold, Pneu-C-15 or Pneu-C-20 was the optimal strategy if the relative price increases for Pneu-C-15 or Pneu-C-20 were 5% or 15% or less than the price of Pneu-C-13, respectively. A lower incidence of pCAP and AOM led to sequential ICERs of over $100,000 per QALY for Pneu-C-15 and over $200,000 per QALY for Pneu-C-20. Additionally, an AOM serotype distribution more similar to the United States, which differs from the serotype distribution of IPD in Canada, results in sequential ICERs of over $100,000 per QALY for Pneu-C-15 and Pneu-C-20.
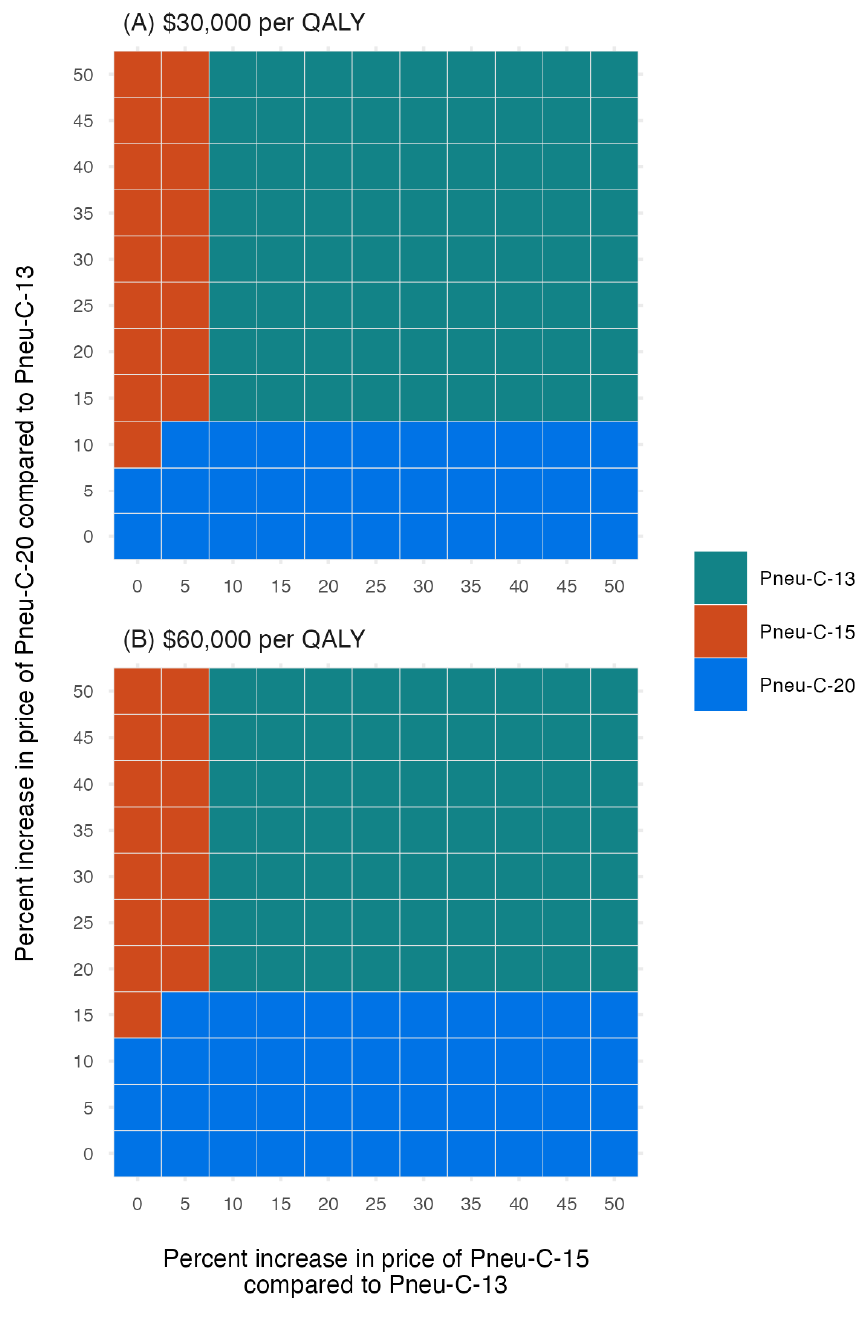
Figure 5: Descriptive text
This two-panel figure shows how the most cost-effective strategy changes for different relative prices per dose of Pneu-C-15 and Pneu-C-20 compared to Pneu-C-13, which has an assumed price of $71.50 per dose. The x-axis shows the percent increase in price per dose of Pneu-C-15 compared to Pneu-C-13 and the y-axis shows the percent increase in price per dose of Pneu-C-20 compared to Pneu-C-13. The ranges for both axes go from 0% to 50%. Panel A shows results for a cost-effectiveness threshold of $30,000 per QALY and panel B shows results for $60,000 per QALY. For each combination of x- and y-axis values, there is a shaded square that show which of the three strategies, Pneu-C-13, Pneu-C-15, or Pneu-C-20, is the optimal strategy for the given cost-effectiveness threshold. For the top panel, which uses a $30,000 cost-effectiveness threshold, Pneu-C-13 is the optimal strategy, unless the relative increase in price for Pneu-C-15 is 5% or less and/or the relative increase in price for Pneu-C-20 is 10% or less. For the bottom panel, which uses a $60,000 cost-effectiveness threshold, Pneu-C-13 is the optimal strategy unless the relative price increase per dose of Pneu-C-15 is 5% or less and/or the relative price increase of Pneu-C-20 is 15% or less.
Abbreviations: Pneu-C, pneumococcal conjugate vaccine; QALY, quality-adjusted life year
Footnotes- Figure 5 Footnote a
-
Incremental cost-effectiveness ratios were calculated for a range of prices per dose for Pneu-C-15 and Pneu-C-20, ranging from 0%–50% higher than the price of Pneu-C-13
- Figure 5 Footnote b
-
The optimal strategy was identified for cost-effectiveness thresholds of $30,000 and $60,000 per QALY from the health system perspective
Discussion
We conducted an economic evaluation to estimate the health impact and cost-effectiveness of replacing Pneu-C-13 with Pneu-C-15 or with Pneu-C-20 for routine use in the paediatric population in Canada. Our base case results found that both Pneu-C-15 and Pneu-C-20 prevented additional cases of IPD, pCAP and AOM compared to the continued use of Pneu-C-13. In our base case, Pneu-C-15 would require a threshold of $58,823 per QALY from the health system perspective and $18,272 per QALY from the societal perspective to be considered cost effective. The Pneu-C-20 vaccine would require a threshold of $135,289 per QALY from the health system perspective and $93,416 per QALY from the societal perspective to be considered cost effective. In contrast, with the inclusion of moderate indirect vaccine effects (e.g., a reduction of 5% or greater in serotype-attributable PD), both Pneu-C-15 and Pneu-C-20 could be considered cost effective at thresholds under $30,000 per QALY from the health system and societal perspectives. In a higher cost and higher PD incidence setting, Pneu-C-20 dominates the other vaccination strategies.
A recent comparative analysis of three cost-utility models conducted in the United States compared Pneu-C-20 to either Pneu-C-15 or Pneu-C-13 using a 3+1 schedule in children younger than two years of age Footnote 71. It showed similar trends as our analysis, with Pneu-C-20 expected to result in the largest gain in health outcomes compared to the other vaccines. From the societal perspective, results varied across the three included models, with ICERs for Pneu-C-20 ranging from dominant to $162,700 per QALY compared to Pneu-C-15. The models included in this analysis were all static but differed in structure, analytic time horizon, assumptions about indirect protection effects and key parameters, further highlighting the sensitivity of these model-based economic evaluation results to model assumptions and input parameters Footnote 13.
The estimated cost-effectiveness of the different conjugate vaccines was driven, in part, by the presence or absence of indirect effects. After the introduction of Pneu-C-13 in paediatric populations, IPD incidence caused by the serotypes in the vaccine decreased in all age groups Footnote 7Footnote 8, but overall IPD incidence in the population did not substantially decrease Footnote 10. In several countries including Canada, the introduction of pneumococcal conjugate vaccines (i.e., Pneu-C-7, Pneu-C-10 and Pneu-C-13) resulted in increases in the incidence of IPD caused by serotypes not included in the vaccines across all ages Footnote 72Footnote 73. In our base case analysis, we conservatively did not include indirect effects, given the uncertainty of herd immunity effects and serotype replacement. In our scenario analysis, we modelled indirect effects as a decline in pneumococcal disease in the broader population not receiving the higher valency conjugate vaccines.
Uncertainty about vaccine price in the Canadian context adds complexity to the interpretation of our results, given how influential the prices of Pneu-C-15 and Pneu-C-20 were on the estimated ICERs. In sensitivity analysis, we showed that at lower incremental prices compared to the price per dose of Pneu-C-13, both higher valency vaccines can be cost-effective options. Our analysis provides an indication of the prices at which either vaccine may become the optimal strategy based on commonly used thresholds.
Limitations
Because we used a static model, our approach did not fully capture the transmission dynamics associated with herd immunity effects and serotype replacement. Future economic evaluations of pneumococcal conjugate vaccination should consider using dynamic models to inform cost-utility analyses to better capture these effects Footnote 74.
Additionally, our economic evaluation focused on children beginning their pneumococcal vaccination series. We did not assess the cost-effectiveness of the three strategies among children who were mid-way through their vaccine series, and we did not assess the impact of a potential catch-up program. Our estimates of the incidence of PD included children at both low and high risk of PD. We did not identify the optimal vaccination strategy independently among children at higher risk for PD outside of a higher cost setting.
Conclusion
Our study provides evidence of the impact Pneu-C-15 and Pneu-C-20 could have on reducing the burden of PD in Canada compared to the continued use of Pneu-C-13. Although ICERs were relatively high in the base case analysis, at lower vaccine prices and/or in the presence of indirect effects in the broader population following vaccine introduction, both vaccines have the potential to improve health in a cost-effective manner.
Authors' statement
- AS — Conceptualization, formal analysis, writing–original draft
- GG — Conceptualization, formal analysis, writing–review & editing
- RP — Conceptualization, writing–review & editing
- AW — Conceptualization, writing–review & editing
- MT — Conceptualization, writing–review & editing
- AT — Conceptualization, analysis, modelling, writing–review & editing, supervision
Competing interests
None.
ORCID numbers
- Alison E Simmons — 0000-0001-8780-9467
- Gebremedhin B Gebretekle — 0000-0002-2485-505X
- Robert Pless — 0009-0004-4779-0844
- Aleksandra Wierzbowski — 0009-0002-7139-8450
- Matthew Tunis — 0000-0003-2092-9143
- Ashleigh R Tuite — 0000-0002-4373-9337
Acknowledgements
The authors thank members of the National Advisory Committee on Immunization Pneumococcal Working Group for providing feedback during model development.
Funding
None.
References
- Footnote 1
-
Scelfo C, Menzella F, Fontana M, Ghidoni G, Galeone C, Facciolongo NC. Pneumonia and Invasive Pneumococcal Diseases: The Role of Pneumococcal Conjugate Vaccine in the Era of Multi-Drug Resistance. Vaccines (Basel) 2021;9(5):420. https://doi.org/10.3390/vaccines9050420
- Footnote 2
-
van Hoek AJ, Andrews N, Waight PA, George R, Miller E. Effect of serotype on focus and mortality of invasive pneumococcal disease: coverage of different vaccines and insight into non-vaccine serotypes. PLoS One 2012;7(7):e39150. https://doi.org/10.1371/journal.pone.0039150
- Footnote 3
-
Greenberg D, Givon-Lavi N, Newman N, Bar-Ziv J, Dagan R. Nasopharyngeal carriage of individual Streptococcus pneumoniae serotypes during pediatric pneumonia as a means to estimate serotype disease potential. Pediatr Infect Dis J 2011;30(3):227–33. https://doi.org/10.1097/INF.0b013e3181f87802
- Footnote 4
-
Desai S, McGeer A, Quach-Thanh C, Elliott D; approved by NACI. Update on the Use of Conjugate Pneumococcal Vaccines in Childhood: An Advisory Committee Statement (ACS) National Advisory Committee on Immunization (NACI). Can Commun Dis Rep. 2010 23;36(ACS-12):1–21. https://doi.org/10.14745/ccdr.v36i00a12
- Footnote 5
-
Greenberg D, Hoover PA, Vesikari T, Peltier C, Hurley DC, McFetridge RD, Dallas M, Hartzel J, Marchese RD, Coller BG, Stek JE, Abeygunawardana C, Winters MA, MacNair JE, Pujar NS, Musey L. Safety and immunogenicity of 15-valent pneumococcal conjugate vaccine (PCV15) in healthy infants. Vaccine 2018;36(45):6883–91. https://doi.org/10.1016/j.vaccine.2018.02.113
- Footnote 6
-
Hurley D, Griffin C, Young M, Scott DA, Pride MW, Scully IL, Ginis J, Severs J, Jansen KU, Gruber WC, Watson W. Safety, Tolerability, and Immunogenicity of a 20-Valent Pneumococcal Conjugate Vaccine (PCV20) in Adults 60 to 64 Years of Age. Clin Infect Dis 2021;73(7):e1489–97. https://doi.org/10.1093/cid/ciaa1045
- Footnote 7
-
Wijayasri S, Hillier K, Lim GH, Harris TM, Wilson SE, Deeks SL. The shifting epidemiology and serotype distribution of invasive pneumococcal disease in Ontario, Canada, 2007-2017. PLoS One 2019;14(12):e0226353. https://doi.org/10.1371/journal.pone.0226353
- Footnote 8
-
Waye A, Chuck AW. Value Added by the Prevnar 13 Childhood Immunization Program in Alberta, Canada (2010–2015). Drugs Real World Outcomes 2015;2(3):311–8. https://doi.org/10.1007/s40801-015-0037-2
- Footnote 9
-
Public Health Agency of Canada. Vaccine Preventable Disease: Surveillance Report to December 31, 2019. Ottawa, ON: PHAC; 2024. https://www.canada.ca/en/public-health/services/publications/healthy-living/vaccine-preventable-disease-surveillance-report-2019.html
- Footnote 10
-
Public Health Agency of Canada. National Advisory Committee on Immunization. Public health level recommendations on the use of pneumococcal vaccines in adults, including the use of 15-valent and 20-valent conjugate vaccines. Ottawa, ON: PHAC; 2023. https://www.nitag-resource.org/resources/public-health-level-recommendations-use-pneumococcal-vaccines-adults-including-use-15
- Footnote 11
-
Lewnard JA, Hanage WP. Making sense of differences in pneumococcal serotype replacement. Lancet Infect Dis 2019;19(6):e213–20. https://doi.org/10.1016/S1473-3099(18)30660-1
- Footnote 12
-
Golden A, Griffith A, Demczuk W, Lefebvre B, McGeer A, Tyrrell G, Zhanel G, Kus J, Hoang L, Minion J, Van Caeseele P, Smadi H, Haldane D, Zahariadis G, Mead K, Steven L, Strudwick L, Li A, Mulvey M, Martin I. Invasive pneumococcal disease surveillance in Canada, 2020. Can Commun Dis Rep 2022;48(9):396–406. https://doi.org/10.14745/ccdr.v48i09a04
- Footnote 13
-
Public Health Agency of Canada. National Advisory Committee on Immunization. Summary of NACI statement of March 11, 2024: Recommendations for public health programs on the use of pneumococcal vaccines in children, including the use of 15-valent and 20-valent conjugate vaccines: Economic evidence supplementary appendix. Ottawa, ON: PHAC; 2024. https://www.canada.ca/en/public-health/services/publications/vaccines-immunization/national-advisory-committee-immunization-summary-recommendations-public-health-programs-use-pneumococcal-vaccines-children-including-use-15-valent-20-valent-conjugate-vaccines.html
- Footnote 14
-
Statistics Canada. Table 98-10-0027-01. Age (in single years), average age and median age and gender: Canada and forward sortation areas. Ottawa, ON: StatCan; 2021. [Accessed 2023 Mar 31]. https://www150.statcan.gc.ca/t1/tbl1/en/tv.action?pid=9810002701
- Footnote 15
-
Statistics Canada. Table 13-10-0837-01. Life expectancy and other elements of the complete life table, single-year estimates, Canada, all provinces except Prince Edward Island. Ottawa, ON: StatCan; 2022. [Accessed 2023 Mar 31]. https://doi.org/10.25318/1310083701-eng
- Footnote 16
-
Statistics Canada. Table 17-10-0057-01. Projected population, by projection scenario, age and sex, as of July 1 (x 1,000). Ottawa, ON: StatCan; 2022. [Accessed 2023 Mar 31]. https://doi.org/10.25318/1710005701-eng
- Footnote 17
-
Morrow A, De Wals P, Petit G, Guay M, Erickson LJ. The burden of pneumococcal disease in the Canadian population before routine use of the seven-valent pneumococcal conjugate vaccine. Can J Infect Dis Med Microbiol 2007;18(2):121–7. https://doi.org/10.1155/2007/713576
- Footnote 18
-
Public Health Agency of Canada. Invasive Pneumococcal Disease in Canada. Ottawa, ON: PHAC; 2023. https://www.canada.ca/en/public-health/services/immunization/vaccine-preventable-diseases/invasive-pneumococcal-disease/health-professionals.html
- Footnote 19
-
Nasreen S, Wang J, Sadarangani M, Kwong JC, Quach C, Crowcroft NS, Wilson SE, McGeer A, Morris SK, Kellner JD, Sander B, Kus JV, Hoang L, Marra F, Fadel SA. Estimating population-based incidence of community-acquired pneumonia and acute otitis media in children and adults in Ontario and British Columbia using health administrative data, 2005–2018: a Canadian Immunisation Research Network (CIRN) study. BMJ Open Respir Res 2022;9(1):e001218. https://doi.org/10.1136/bmjresp-2022-001218
- Footnote 20
-
King L. Pediatric outpatient ARI visits and antibiotic use attributable to serotypes in higher valency PCVs [slides presented at Advisory Committee on Immunization Practices (ACIP) meeting February 22, 2023]. Atlanta, GA: CDC; 2023. [Accessed 2023 Mar 14]. https://www.cdc.gov/vaccines/acip/meetings/downloads/slides-2023-02/slides-02-22/Pneumococcal-03-King-508.pdf
- Footnote 21
-
Pneumonia Etiology Research for Child Health (PERCH) Study Group. Causes of severe pneumonia requiring hospital admission in children without HIV infection from Africa and Asia: the PERCH multi-country case-control study. Lancet 2019;394(10200):757–79. https://doi.org/10.1016/S0140-6736(19)30721-4
- Footnote 22
-
LeBlanc JJ, ElSherif M, Ye L, MacKinnon-Cameron D, Ambrose A, Hatchette TF, Lang AL, Gillis HD, Martin I, Demczuk WH, Andrew MK, Boivin G, Bowie W, Green K, Johnstone J, Loeb M, McCarthy AE, McGeer A, Semret M, Trottier S, Valiquette L, Webster D, McNeil SA. Recalibrated estimates of non-bacteremic and bacteremic pneumococcal community acquired pneumonia in hospitalized Canadian adults from 2010 to 2017 with addition of an extended spectrum serotype-specific urine antigen detection assay. Vaccine 2022;40(18):2635–46. https://doi.org/10.1016/j.vaccine.2022.02.081
- Footnote 23
-
Kim SH, Jeon EJ, Hong SM, Bae CH, Lee HY, Park MK, Byun JY, Kim MG, Yeo SG. Bacterial Species and Antibiotic Sensitivity in Korean Patients Diagnosed with Acute Otitis Media and Otitis Media with Effusion. J Korean Med Sci 2017;32(4):672–8. https://doi.org/10.3346/jkms.2017.32.4.672
- Footnote 24
-
O’Reilly R, Lu H, Kwong JC, McGeer A, To T, Sander B. The epidemiology and healthcare costs of community-acquired pneumonia in Ontario, Canada: a population-based cohort study. J Med Econ 2023;26(1):293–302. https://doi.org/10.1080/13696998.2023.2176679
- Footnote 25
-
Jit M. The risk of sequelae due to pneumococcal meningitis in high-income countries: a systematic review and meta-analysis. J Infect 2010;61(2):114–24. https://doi.org/10.1016/j.jinf.2010.04.008
- Footnote 26
-
Canadian Institute for Health Information. Implantable medical devices in Canada: Insights into high-volume procedures and associated costs. Ottawa, ON: CIHI; 2020. https://secure.cihi.ca/free_products/implantable-medical-devices-report-en.pdf
- Footnote 27
-
Chuck AW, Jacobs P, Tyrrell G, Kellner JD. Pharmacoeconomic evaluation of 10- and 13-valent pneumococcal conjugate vaccines. Vaccine 2010;28(33):5485–90. https://doi.org/10.1016/j.vaccine.2010.05.058
- Footnote 28
-
Public Health Agency of Canada. Highlights from the 2019 childhood National Immunization Coverage Survey (cNICS). Ottawa, ON: PHAC; 2023. https://www.canada.ca/en/public-health/services/publications/vaccines-immunization/2019-highlights-childhood-national-immunization-coverage-survey.html
- Footnote 29
-
Prasad N, Stoecker C, Xing W, Cho BH, Leidner AJ, Kobayashi M. Public health impact and cost-effectiveness of 15-valent pneumococcal conjugate vaccine use among the pediatric population of the United States. Vaccine 2023;41(18):2914–21. https://doi.org/10.1016/j.vaccine.2023.03.045
- Footnote 30
-
Farrar J, Nsofor C, Childs L, Kobayashi M, Pilishvili T, editors. Systematic Review of 13-Valent Pneumooccal Conjugate Vaccine Effectiveness Against Pneumonia Among Children. 12th International Symposium on Pneumococci and Pneumococcal Diseases: Toronto, ON; 2022. https://isppd2022.kenes.com/
- Footnote 31
-
Stoecker C. Economic assessment of routine PCV20 for children [slides presented at Advisory Committee on Immunization Practices (ACIP) meeting June 22, 2023]. Atlanta, GA: CDC; 2023. [Accessed 2023 Jun 24]. https://www.cdc.gov/vaccines/acip/meetings/downloads/slides-2023-06-21-23/02-Pneumococcal-Stoecker-508.pdf
- Footnote 32
-
Eskola J, Kilpi T, Palmu A, Jokinen J, Haapakoski J, Herva E, Takala A, Käyhty H, Karma P, Kohberger R, Siber G, Mäkelä PH; Finnish Otitis Media Study Group. Efficacy of a pneumococcal conjugate vaccine against acute otitis media. N Engl J Med 2001;344(6):403–9. https://doi.org/10.1056/NEJM200102083440602
- Footnote 33
-
Andrews NJ, Waight PA, Burbidge P, Pearce E, Roalfe L, Zancolli M, Slack M, Ladhani SN, Miller E, Goldblatt D. Serotype-specific effectiveness and correlates of protection for the 13-valent pneumococcal conjugate vaccine: a postlicensure indirect cohort study. Lancet Infect Dis 2014;14(9):839–46. https://doi.org/10.1016/S1473-3099(14)70822-9
- Footnote 34
-
Centers for Disease Control and Prevention. VFC CDC Vaccine Price List Archives. Atlanta, GA: CDC; 2024. https://www.cdc.gov/vaccines/programs/vfc/awardees/vaccine-management/price-list/2022/2022-04-01.html
- Footnote 35
-
Statistics Canada. Table 18-10-0005-01. Consumer Price Index, annual average, not seasonally adjusted. Ottawa, ON: StatCan; 2024. [Accessed 2023 Mar 31]. https://doi.org/10.25318/1810000501-eng
- Footnote 36
-
R Foundation for Statistical Computing. R: A language and environment for statistical computing [Software]. 4.0 ed. Vienna, AT: R Core Team; 2020. [Accessed 2024 Jan 5]. https://www.r-project.org/
- Footnote 37
-
Devleesschauwer B, Torgerson P, Charlier J, Levecke B, Praet N, Roelandt S, Smit S, Dorny P, Bervens D, Speybroeck N. Package “prevalence” Oct 14, 2022: Tools for prevalence assessment studies. R package version 0.4.1. 2022. https://cran.r-project.org/package=prevalence
- Footnote 38
-
Public Health Agency of Canada. National Advisory Committee on Immunization (NACI): Guidelines for the economic evaluation of vaccination programs in Canada. Ottawa, ON: PHAC; 2024. https://www.canada.ca/en/public-health/services/immunization/national-advisory-committee-on-immunization-naci/methods-process/incorporating-economic-evidence-federal-vaccine-recommendations/guidelines-evaluation-vaccination-programs-canada.html
- Footnote 39
-
O’Reilly RK, McGeer A, To T, Sander B. The Cost-Effectiveness of a Pneumococcal Conjugate Vaccine (PCV13) Program for Older Adults (65+) in Ontario, Canada: Update on the use of pneumococcal vaccine in immunocompetent adults 65 years of age and older – A Public Health Perspective in the Context of Infant Immunization and Changing Serotype Distributions. Society for Medical Decision Making 2017. https://smdm.org/meeting/39th-annual-north-american-meeting
- Footnote 40
-
Canadian Institute for Health Information. Data Quality Documentation, Discharge Abstract Database - Current-Year Information, 2015–2016. Ottawa, ON: CIHI; 2016. [Accessed 2023 Mar 31]. https://www.cihi.ca/sites/default/files/document/dad-data-quality_15-16_en.pdf
- Footnote 41
-
Canadian Institute for Health Information. Data Quality Documentation Discharge Abstract Database - Current-Year Information 2018–2019. Ottawa, ON: CIHI; 2019. [Accessed 2023 Mar 31]. https://www.cihi.ca/sites/default/files/document/current-year-information-dad-2018-2019-en-web.pdf
- Footnote 42
-
Canadian Institute for Health Information. Data Quality Documentation, Discharge Abstract Database - Current-Year Information, 2016–2017. Ottawa, ON: CIHI; 2017. [Accessed 2023 Mar 31]. https://www.cihi.ca/sites/default/files/document/current-year_information_dad_2016-2017-en-web.pdf
- Footnote 43
-
Canadian Institute for Health Information. Data Quality Documentation, Discharge Abstract Database - Current-Year Information, 2017–2018. Ottawa, ON: CIHI; 2018. [Accessed 2023 Mar 31]. https://www.cihi.ca/sites/default/files/document/current-year-information-dad-2017-2018-en-web.pdf
- Footnote 44
-
Gaboury I, Coyle K, Coyle D, Le Saux N. Treatment cost effectiveness in acute otitis media: A watch-and-wait approach versus amoxicillin. Paediatr Child Health 2010;15(7):e14–8. https://doi.org/10.1093/pch/15.7.e14
- Footnote 45
-
Christensen H, Trotter CL, Hickman M, Edmunds WJ. Re-evaluating cost effectiveness of universal meningitis vaccination (Bexsero) in England: modelling study. BMJ 2014;349:g5725. https://doi.org/10.1136/bmj.g5725
- Footnote 46
-
Ontario Ministry of Health. Formulary/Comparative Drug Index (CDI) Edition 43. Toronto, ON: MOHLTC; 2024. [Accessed 2023 Mar 31]. https://www.ontario.ca/document/ontario-drug-benefit-odb-formulary-comparative-drug-index-cdi-and-monthly-formulary-0
- Footnote 47
-
Committee on Infectious Diseases, American Academy of Pediatrics. Red Book: 2021–2024 Report of the Committee on Infectious Diseases, 32nd Edition. Kimberlin DW, Barnett ED, Lynfield R, Sawyer MH, editors. Itasca, IL; American Academy of Pediatrics; 2021. ISBN-13; 978-1-61002-735-9
- Footnote 48
-
Metlay JP, Waterer GW, Long AC, Anzueto A, Brozek J, Crothers K, Cooley LA, Dean NC, Fine MJ, Flanders SA, Griffin MR, Metersky ML, Musher DM, Restrepo MI, Whitney CG. Diagnosis and Treatment of Adults with Community-acquired Pneumonia. An Official Clinical Practice Guideline of the American Thoracic Society and Infectious Diseases Society of America. Am J Respir Crit Care Med 2019;200(7):e45–67. https://doi.org/10.1164/rccm.201908-1581ST
- Footnote 49
-
Patented Medicine Prices Review Board Canada. Dispensing fee policies in public drug plans, 2019/20. Ottawa, ON: PMPRB; 2020. [Accessed 2023 Mar 24]. http://www.pmprb-cepmb.gc.ca/CMFiles/NPDUIS/refdocs/ReferenceDoc_Dispensing_Fees_2019-20_EN.pdf
- Footnote 50
-
Colbert Y. ‘My jaw dropped,’ says Ontario woman of $12K air ambulance bill in Nova Scotia. CBC News. 2020 Nov 27. [Accessed 2023 Mar 31]. https://www.cbc.ca/news/canada/nova-scotia/ground-and-air-ambulance-fees-health-care-universal-health-care-1.5817284
- Footnote 51
-
Canada Revenue Agency. Calculate payroll deductions and contributions: Automobile or motor vehicle benefits – Allowances or reimbursements provided to an employee for the use of their own vehicle. Ottawa, ON: CRA; 2024. [Accessed 2023 Mar 31]. https://www.canada.ca/en/revenue-agency/services/tax/businesses/topics/payroll/benefits-allowances/automobile/automobile-motor-vehicle-allowances.html
- Footnote 52
-
Pong RW, Pitblado JR. Geographic distribution of physicians in Canada: beyond how many and where. Ottawa, ON: Canadian Institute for Health Information 2006. https://secure.cihi.ca/estore/productFamily.htm?locale=en&pf=PFC609
- Footnote 53
-
Public Health Agency of Canada. National Advisory Committee on Immunization. Recommendations on the use of conjugate pneumococcal vaccine-15 valent (PNEU-C-15) and 20 valent (PNEU-C-20) in adults. Ottawa, ON: PHAC; 2023. https://www.canada.ca/en/public-health/services/immunization/national-advisory-committee-on-immunization-naci/public-health-level-recommendations-use-pneumococcal-vaccines-adults-including-use-15-valent-20-valent-conjugate-vaccines.html
- Footnote 54
-
Pasquale CB, Vietri J, Choate R, McDaniel A, Sato R, Ford KD, Malanga E, Yawn BP. Patient-reported consequences of community-acquired pneumonia in patients with chronic obstructive pulmonary disease. Chronic Obstr Pulm Dis (Miami) 2019;6(2):132–44. https://doi.org/10.15326/jcopdf.6.2.2018.0144
- Footnote 55
-
Bizier C, Contreras R, Walpole A. Hearing disabilities among Canadians aged 15 years and older, 2012. Ottawa, ON: StatCan; 2016. [Accessed 2023 Mar 31]. https://www150.statcan.gc.ca/n1/pub/89-654-x/89-654-x2016002-eng.htm
- Footnote 56
-
Jiang Y, Gauthier A, Annemans L, van der Linden M, Nicolas-Spony L, Bresse X. Cost-effectiveness of vaccinating adults with the 23-valent pneumococcal polysaccharide vaccine (PPV23) in Germany. Expert Rev Pharmacoecon Outcomes Res 2012;12(5):645–60. https://doi.org/10.1586/erp.12.54
- Footnote 57
-
Wyrwich KW, Yu H, Sato R, Powers JH. Observational longitudinal study of symptom burden and time for recovery from community-acquired pneumonia reported by older adults surveyed nationwide using the CAP Burden of Illness Questionnaire. Patient Relat Outcome Meas 2015;6:215–23. https://doi.org/10.2147/PROM.S85779
- Footnote 58
-
Dubé E, De Wals P, Gilca V, Boulianne N, Ouakki M, Lavoie F, Bradet R. Burden of acute otitis media on Canadian families. Can Fam Physician 2011;57(1):60–5.
- Footnote 59
-
Barber C, Ille S, Vergison A, Coates H. Acute otitis media in young children - what do parents say? Int J Pediatr Otorhinolaryngol 2014;78(2):300–6. https://doi.org/10.1016/j.ijporl.2013.11.030
- Footnote 60
-
Petit G, De Wals P, Law B, Tam T, Erickson LJ, Guay M, Framarin A. Epidemiological and economic burden of pneumococcal diseases in Canadian children. Can J Infect Dis 2003;14(4):215–20. https://doi.org/10.1155/2003/781794
- Footnote 61
-
Ganapathy V, Graham GD, DiBonaventura MD, Gillard PJ, Goren A, Zorowitz RD. Caregiver burden, productivity loss, and indirect costs associated with caring for patients with poststroke spasticity. Clin Interv Aging 2015;10:1793–802. https://doi.org/10.2147/CIA.S91123
- Footnote 62
-
Statistics Canada. Table 11-10-0239-01. Income of individuals by age group, sex and income source, Canada, provinces and selected census metropolitan areas. Ottawa, ON: StatCan; 2023. [Accessed 2023 May 31]. https://doi.org/10.25318/1110023901-eng
- Footnote 63
-
Statistics Canada. Table 14-10-0327-02. Unemployment rate, participate rate and employment rate by sex, annual. Ottawa, ON; StatCan; 2023. [Accessed 2023 Mar 31]. https://doi.org/10.25318/1410032701-eng
- Footnote 64
-
Molina M, Humphries B, Guertin JR, Feeny D, Tarride JE. Health Utilities Index Mark 3 scores for children and youth: population norms for Canada based on cycles 5 (2016 and 2017) and 6 (2018 and 2019) of the Canadian Health Measures Survey. Health Rep 2023;34(2):29–39. https://doi.org/10.25318/82-003-x202300200003-eng
- Footnote 65
-
Yan J, Xie S, Johnson JA, Pullenayegum E, Ohinmaa A, Bryan S, Xie F. Canada population norms for the EQ-5D-5L. Eur J Health Econ 2024;25(1):147–55. https://doi.org/10.1007/s10198-023-01570-1
- Footnote 66
-
Tang Z, Matanock A, Jeon S, Leidner AJ. A review of health-related quality of life associated with pneumococcal disease: pooled estimates by age and type of disease. J Public Health (Oxf) 2022;44(2):e234–40. https://doi.org/10.1093/pubmed/fdab159
- Footnote 67
-
Bruce MG, Deeks SL, Zulz T, Bruden D, Navarro C, Lovgren M, Jette L, Kristinsson K, Sigmundsdottir G, Jensen KB, Lovoll O, Nuorti JP, Herva E, Nystedt A, Sjostedt A, Koch A, Hennessy TW, Parkinson AJ. International Circumpolar Surveillance System for invasive pneumococcal disease, 1999–2005. Emerg Infect Dis 2008;14(1):25–33. https://doi.org/10.3201/eid1401.071315
- Footnote 68
-
Kaur R, Fuji N, Pichichero ME. Dynamic changes in otopathogens colonizing the nasopharynx and causing acute otitis media in children after 13-valent (PCV13) pneumococcal conjugate vaccination during 2015–2019. Eur J Clin Microbiol Infect Dis 2022;41(1):37–44. https://doi.org/10.1007/s10096-021-04324-0
- Footnote 69
-
Pichon-Riviere A, Drummond M, Palacios A, Garcia-Marti S, Augustovski F. Determining the efficiency path to universal health coverage: cost-effectiveness thresholds for 174 countries based on growth in life expectancy and health expenditures. Lancet Glob Health 2023;11(6):e833–42. https://doi.org/10.1016/S2214-109X(23)00162-6
- Footnote 70
-
Ochalek JM, Lomas JR, Claxton KP. Assessing health opportunity costs for the Canadian health care systems. North York, ON: University of York (Commissioned report); 2018. https://pure.york.ac.uk/portal/en/publications/assessing-health-opportunity-costs-for-the-canadian-health-care-s
- Footnote 71
-
Ayabina D. Summary of three economic analyses of the use of 20-valent pneumococcal conjugate vaccine (PCV20) in children in the United States [slides presented at Advisory Committee on Immunization Practices meeting June 22, 2023]. Atlanta, GA: CDC; 2023. [Accessed 2024 Jan 11]. https://www.cdc.gov/vaccines/acip/meetings/downloads/slides-2023-06-21-23/03-Pneumococcal-Ayabina-508.pdf
- Footnote 72
-
Weinberger DM, Malley R, Lipsitch M. Serotype replacement in disease after pneumococcal vaccination. Lancet 2011;378(9807):1962–73. https://doi.org/10.1016/S0140-6736(10)62225-8
- Footnote 73
-
Feikin DR, Kagucia EW, Loo JD, Link-Gelles R, Puhan MA, Cherian T, Levine OS, Whitney CG, O’Brien KL, Moore MR; Serotype Replacement Study Group. Serotype-specific changes in invasive pneumococcal disease after pneumococcal conjugate vaccine introduction: a pooled analysis of multiple surveillance sites. PLoS Med 2013;10(9):e1001517. https://doi.org/10.1371/journal.pmed.1001517
- Footnote 74
-
Pitman R, Fisman D, Zaric GS, Postma M, Kretzschmar M, Edmunds J, Brisson M; ISPOR-SMDM Modeling Good Research Practices Task Force. Dynamic transmission modeling: a report of the ISPOR-SMDM Modeling Good Research Practices Task Force--5. Value Health 2012;15(6):828–34. https://doi.org/10.1016/j.jval.2012.06.011
Appendix
Figure A1 : Descriptive text
| Strategy | Outcome | Minimum | Lower bound | Median | Upper bound | Maximum | |
|---|---|---|---|---|---|---|---|
| 1 | Pneu-C-15 | AOM | 130,032 | 175,466 | 190,760 | 205,884 | 251,450 |
| 2 | Pneu-C-20 | AOM | 254,800 | 343,610 | 373,543 | 403,099 | 492,212 |
| 3 | Pneu-C-15 | Outpatient pCAP | 19,275 | 24,055 | 25,638 | 27,254 | 32,051 |
| 4 | Pneu-C-20 | Outpatient pCAP | 37,922 | 47,333 | 50,446 | 53,624 | 63,057 |
| 5 | Pneu-C-15 | Hospitalized pCAP | 115 | 855 | 1,166 | 1,545 | 2,577 |
| 6 | Pneu-C-20 | Hospitalized pCAP | 227 | 1,683 | 2,294 | 3,039 | 5,071 |
| 7 | Pneu-C-15 | IPD | 680 | 859 | 925 | 979 | 1,123 |
| 8 | Pneu-C-20 | IPD | 1,330 | 1,680 | 1,808 | 1,914 | 2,194 |
Abbreviations: AOM, acute otitis media; IPD, invasive pneumococcal disease; pCAP, pneumococcal community acquired pneumonia; Pneu-C, pneumococcal conjugate vaccine
Footnote- Figure A1 Footnote a
-
Results are shown for 10,000 model simulations
| Strategy | Effect (QALYs lost) |
Cost ($, millions) |
Sequential ICER ($/QALY) |
|---|---|---|---|
| Health system perspective | |||
| Pneu-C-20 | 15,794 | 541,539 | - |
| Pneu-C-15 | 15,819 | 543,513 | Dominated by Pneu-C-20 |
| Pneu-C-13 | 15,897 | 545,613 | Dominated by Pneu-C-20 |
| Societal perspective | |||
| Pneu-C-20 | 541,539 | 445,465 | - |
| Pneu-C-15 | 543,513 | 455,579 | Dominated by Pneu-C-20 |
| Pneu-C-13 | 545,613 | 445,760 | Dominated by Pneu-C-20 |
Abbreviations: ICER, incremental cost-effectiveness ratio; Pneu-C, pneumococcal conjugate vaccine; QALY, quality-adjusted life year; -, not applicable |
|||
