
National hepatitis B and C estimates for 2021

 Download this article as a PDF (134 KB)
Published by: The Public Health Agency of Canada
Issue: Volume 51-6/7, June/July 2025: Hepatitis B & C Viruses in Canada
Date published: August 2025
ISSN: 1481-8531
Submit a manuscript
About CCDR
Browse
Volume 51-6/7, June/July 2025: Hepatitis B & C Viruses in Canada
Epidemiologic Study
National hepatitis B and C estimates for 2021: Measuring Canada’s progress towards eliminating viral hepatitis as a public health concern
Simone Périnet1, Anson Williams1, Laurence Campeau1, Janelle Elliott1, Fan Zhang1, Qiuying Yang1,2, Joseph Cox1,2, Karelyn Davis1, Jordan J Feld3, Marina B Klein4,5, Nadine Kronfli6,7, Mia J Biondi8, Peter K Daley9, Nashira Popovic1
Affiliations
1 Centre for Communicable Diseases and Infection Control, Public Health Agency of Canada, Ottawa, ON
2 Department of Epidemiology, Biostatistics and Occupational Health, McGill University, Montréal, QC
3 Toronto Centre for Liver Disease, University Health Network, University of Toronto, Toronto, ON
4 Research Institute of the McGill University Health Centre, Montréal, QC
5 CIHR Pan-Canadian Network for HIV and STBBI Clinical Trials Research (CTN+), Montréal, QC
6 Department of Medicine, Division of Infectious Diseases and Chronic Viral Illness Service, McGill University, Montréal, QC
7 Centre for Outcomes Research and Evaluation, Research Institute of the McGill University Health Centre, Montréal, QC
8 School of Nursing, York University, Toronto, ON
9 Memorial University of Newfoundland, St. John's, NL
Suggested citation
Périnet S, Williams A, Campeau L, Elliott J, Zhang F, Yang Q, Cox J, Davis K, Feld JJ, Klein MB, Kronfli N, Biondi MJ, Daley PK, Popovic N. National hepatitis B and C estimates for 2021: Measuring Canada’s progress towards eliminating viral hepatitis as a public health concern. Can Commun Dis Rep 2025;51(6/7):223−37. https://doi.org/10.14745/ccdr.v51i67a02
Keywords: viral hepatitis, hepatitis B, hepatitis C, prevalence, incidence, key populations, estimations, Canada
Abstract
Background: Hepatitis B virus (HBV) and hepatitis C virus (HCV) infections are major causes of morbidity and mortality worldwide. Measuring the epidemiological burden of HCV and HBV in Canada is essential to measure progress towards global elimination targets and to ultimately eliminate viral hepatitis as a public health concern.
Objective: This study aimed to provide the first national estimates of HBV prevalence and unawareness, and to update estimates of HCV incidence, prevalence, and unawareness in the general population and key populations in Canada for 2021. Progress towards elimination targets for 2025, namely incidence, awareness, mortality, and HBV vaccination, was also assessed.
Methods: A combination workbook method and mathematical modelling was used to estimate the prevalence and unawareness of chronic hepatitis B (CHB), prevalence and incidence of anti-HCV antibodies, and the prevalence and unawareness of chronic hepatitis C (CHC).
Results: The estimated prevalence of CHB was 0.68% (plausible range: 0.40%–0.97%) or 262,000 (152,000–371,000) people in the general population, of whom 42.5% (33.9%–51.0%) were unaware of their infection. Immigrants from countries where HBV is common had the highest prevalence at 4.2% (1.9%–5.6%). An estimated 8,212 new HCV infections occurred in 2021, and the estimated prevalence of CHC was 0.56% (0.15%–0.97%) or 214,000 (58,500–369,000) people, of whom 41.5% (34.3%–48.8%) were unaware of their infection. People who inject drugs had the highest prevalence and largest proportion who were unaware at 36.9% (12.6%–55.1%) and 49.9% (29.0%–70.2%), respectively.
Conclusion: While the overall viral hepatitis burden is low in the general Canadian population, these estimates indicate that certain populations and communities remain disproportionately affected. Although Canada has met some of the 2025 targets, more work is needed. To this end, efforts to obtain and standardize provincial and national data will be required to measure progress towards all elimination targets.
Introduction
Hepatitis B virus (HBV) and hepatitis C virus (HCV) infections are sexually transmitted and blood-borne infections (STBBI) leading to chronic liver disease with a risk of progression to cirrhosis, liver failure and liver cancer Footnote 1, despite the availability of effective treatment and HBV vaccines. Following HBV infection, approximately 90% of newborns, 20%–30% of children younger than five years, and 5%–10% of adults younger than 50 years develop chronic hepatitis B (CHB) Footnote 2Footnote 3 which may cause progressive liver injury. Suppressive treatment is available Footnote 3 and reduces the risk of liver-related outcomes but must be taken long-term and rarely leads to clearance of the infection. People exposed to and infected with HCV develop antibodies that remain detectable regardless of spontaneous clearance or successful treatment. Detection of viral RNA is necessary to diagnose chronic hepatitis C (CHC) infection, defined as persistence of viremia beyond six months Footnote 4. More than 95% of people who take direct-acting antivirals (DAAs) treatment achieve a sustained virological response 12 weeks after the end of treatment and are therefore considered cured Footnote 5. Treatment is well tolerated and recommended for all people living with CHC Footnote 6.
Key guiding documents identify certain populations and communities that are disproportionately impacted by HBV and HCV Footnote 7Footnote 8Footnote 9Footnote 10, including immigrants from countries where HBV or HCV is common, gay, bisexual and other men who have sex with men (GBMSM), incarcerated people, people who inject drugs (PWID), First Nations, Inuit and Métis, and adults in the 1945–1975 birth cohort. Canada is committed to achieving the global targets in support of eliminating viral hepatitis as a public health concern Footnote 8Footnote 11. Global targets include a reduction of incidence and mortality, an increase in the proportion of people living with CHC or CHB who are diagnosed and treated, and an increase of HBV vaccine coverage.
This paper provides updated national estimates of HCV incidence, prevalence, awareness and treatment, as well as the first national estimates of HBV prevalence and awareness, for 2021 Footnote 9. These estimates are reported for the general population, as well as for key populations. Finally, Canada's progress towards some of the 2025 global viral hepatitis elimination targets are discussed.
Methods
A combination of a modified workbook method and mathematical modelling was used to estimate the prevalence of CHB and the proportion of people living with CHB who were unaware of their infection, and to estimate the prevalence of anti-HCV antibodies and CHC and the proportion of people living with CHC who were unaware of their infection. Incidence for HCV was estimated using mathematical modelling. Mortality, HBV vaccination and HCV treatment were estimated using administrative data. Rates were calculated using national population estimates Footnote 12.
Hepatitis B
Systematic review
A systematic search for literature published between January 1, 2016 and March 31, 2023, on prevalence and unawareness of HBV infection in Canada was conducted in the MEDLINE, Embase and Scopus databases and yielded an initial 355 records, with an additional 40 records identified through other sources. Using a previously described method Footnote 13, 14 records were selected to consider in the workbook method, in addition to unpublished data from organizations and researchers.
Mathematical modelling
National CHB modelling was described elsewhere Footnote 14 and used data from the Canadian Notifiable Disease Surveillance System (CNDSS), extracted in July 2023 for all provinces and territories, as input into the model.
Modified workbook
A modified workbook method Footnote 13 was used to estimate the prevalence of CHB infection (using the hepatitis B surface antigen (HBsAg) as a proxy for CHB, where applicable), and its proportion unaware, for the general population and for key populations informed by an environmental scan. Each measure extracted from the systematic search records were classified as “underestimate,” “appropriate estimate” or “overestimate” based on a review of the methodology of each study. The underestimates and overestimates were used as plausible ranges. When measures from multiple records were available, evidence was ranked to prioritize representative data (e.g., national surveys) over data of lower representativity (e.g., local studies) to determine each plausible range. Where possible, results from comparable studies were averaged. Point estimates were calculated as the midpoint between bounds, except when representative data (“appropriate estimates”) were used as the point estimate. In instances where only one representative estimate was available, the plausible range is the 95% confidence interval, computed as needed using the Wilson method Footnote 15. In instances where there was one data source of low representativity or no data, “insufficient data” was indicated. Proportions ≤1 were rounded to two decimal places, larger proportions were rounded to one decimal place, and absolute numbers were rounded to three significant digits.
Administrative data: Vaccination and mortality
Vital statistics data Footnote 16 were used to estimate the proportion of all live births in Canada that occurred in provinces and territories offering universal birth dose vaccination. Vaccination coverage was taken from the Childhood National Immunization Coverage Survey report Footnote 17.
Vital statistics data were used to directly estimate the number of deaths in 2021 for which HBV (ICD-10 codes B16.0, B16.1, B16.2, B16.9, B17.0, B18.0, and B18.1) was identified as the underlying cause or one of the other 19 contributing causes of death Footnote 18.
Hepatitis C
Systematic review
A search on prevalence, incidence and unawareness of infection in Canada was updated with records published between July 1, 2021 and March 31, 2023, yielding 187 records, with an additional 28 records found outside of the search. A total of 31 records were selected for consideration using the workbook method, in addition to the 22 records identified and used through the 2019 estimates process Footnote 13 and unpublished data from organizations and researchers.
Mathematical modelling
Back-calculation mathematical modelling Footnote 7Footnote 19 with least square method Footnote 20 for 2020–2021 pandemic adjustment was used to estimate HCV incidence and as input for the anti-HCV antibodies prevalence estimates. Data from a July 2023 CNDSS extraction for British Columbia, Alberta, Saskatchewan, Ontario, Québec and the Yukon were used as input and model outputs were projected to Canadian population.
Modified workbook
Using methods described in the HBV section, this study estimated the prevalence of anti-HCV antibodies (as a marker of current or past infection) as well as the prevalence of CHC infection (using detection of HCV RNA as a proxy where applicable) and its proportion unaware, for the general population and for key populations, based on priority populations identified in the blueprint to inform hepatitis C elimination efforts in Canada Footnote 7.
Administrative data: Treatment and mortality
Licensed data were obtained from IQVIA Solutions Canada (IQVIA) to estimate the number of people treated for HCV in Canada between 2012 and 2021. The 2012–2016 estimates were produced by the British Columbia Centre for Disease Control using Compuscript data from IQVIA, and the 2017–2021 estimates were projected patient counts computed by IQVIA using the GPM Custom Solutions information service.
Vital statistics data were used to directly estimate the number of deaths in 2021 for which HCV (ICD-10 codes B17.1 and B18.2) was identified as an underlying cause or one of the other 19 contributing causes of death Footnote 18.
Results
Chronic hepatitis B prevalence
The prevalence of CHB in the general population was estimated at 0.68% (plausible range: 0.40%–0.97%) or 262,000 (152,000–371,000) people at the end of 2021. Among key populations, the highest estimated prevalence was 4.2% (1.9%–5.6%) among immigrants from countries where HBV is common (≥2% HBsAg prevalence), followed by GBMSM at 1.4% (0.8%–2.1%) and people incarcerated in federal prisons (Table 1). Additional data are needed to estimate the prevalence in other key populations.
| Population | Population size estimate | Prevalence (%) | Estimated number of people living with CHB | Reference(s) | ||||
|---|---|---|---|---|---|---|---|---|
| Point estimate | Lower bound | Upper bound | Point estimate | Lower bound | Upper bound | |||
| General population | 38,239,864 | 0.68% | 0.40% | 0.97% | 262,000 | 152,000 | 371,000 | Footnote 12Footnote 14Footnote 21Footnote 22Footnote 23Footnote 24 |
| Immigrants from countries where HBV is common (HBsAg ≥2%) | 5,599,485 | 4.2% | 1.9% | 5.6% | 237,000 | 106,000 | 312,000 | Footnote 21Footnote 25Footnote 26 |
| GBMSM | 669,613 | 1.4% | 0.8% | 2.1% | 9,310 | 5,360 | 14,100 | Footnote 27Footnote 28 Unpublished data from the Engage cohort study, 2017–2019 |
| People incarcerated in federal prisonsFootnote a | 12,405 | 0.28% | 0.19% | 0.41% | 35 | 24 | 51 | Unpublished data from Correctional Service Canada, 2021 (personal communication, 2024) |
| People incarcerated in provincial prisonsFootnote b | Insufficient information | |||||||
| PWID | Insufficient information | |||||||
| First Nations | Insufficient information | |||||||
| Inuit | Insufficient information | |||||||
| Métis | Insufficient information | |||||||
Unawareness of chronic hepatitis B infection
The proportion of people living with CHB who were unaware of their infection was estimated at 42.5% (33.9%–51.0%), or 111,000 (88,700–134,000) people (Table 2). Additional data are needed to estimate unawareness in key populations.
| Population | Estimated number of people living with CHB | Proportion who were unaware (%) | Estimated number of people who were unaware | Reference(s) | ||||
|---|---|---|---|---|---|---|---|---|
| Point estimate | Lower bound | Upper bound | Point estimate | Lower bound | Upper bound | |||
| General population | 262,000 | 42.5% | 33.9% | 51.0% | 111,000 | 88,700 | 134,000 | Footnote 14Footnote 21 |
| Immigrants from countries where HBV is common (HBsAg ≥2%) | Insufficient information | |||||||
| GBMSM | Insufficient information | |||||||
| People incarcerated in federal prisonsFootnote a | Insufficient information | |||||||
| People incarcerated in provincial prisonsFootnote b | Insufficient information | |||||||
| PWID | Insufficient information | |||||||
| First Nations | Insufficient information | |||||||
| Inuit | Insufficient information | |||||||
| Métis | Insufficient information | |||||||
Hepatitis B vaccination
In the seven jurisdictions with a three-dose program for infants, the HBV vaccine coverage among two-year-old children was 82.6% (79.7%–85.1%) in 2021. The national HBV vaccine coverage among 14-year-old adolescents was 89.0% (86.3%–91.2%) in 2021 Footnote 17.
Three (New Brunswick, Northwest Territories and Nunavut) out of 13 provinces and territories have universal HBV vaccination programs initiated at birth, and 7,690 live births occurred in these jurisdictions between July 1, 2021 and June 30, 2022, representing 2% of live births in Canada during that period Footnote 16.
Hepatitis B-related mortality
In 2021, HBV was identified as a contributing cause for 274 deaths for a crude mortality rate of 0.72 per 100,000 population. Between 2015 and 2021, the annual mortality rate for HBV-related deaths was relatively stable (Figure 1).
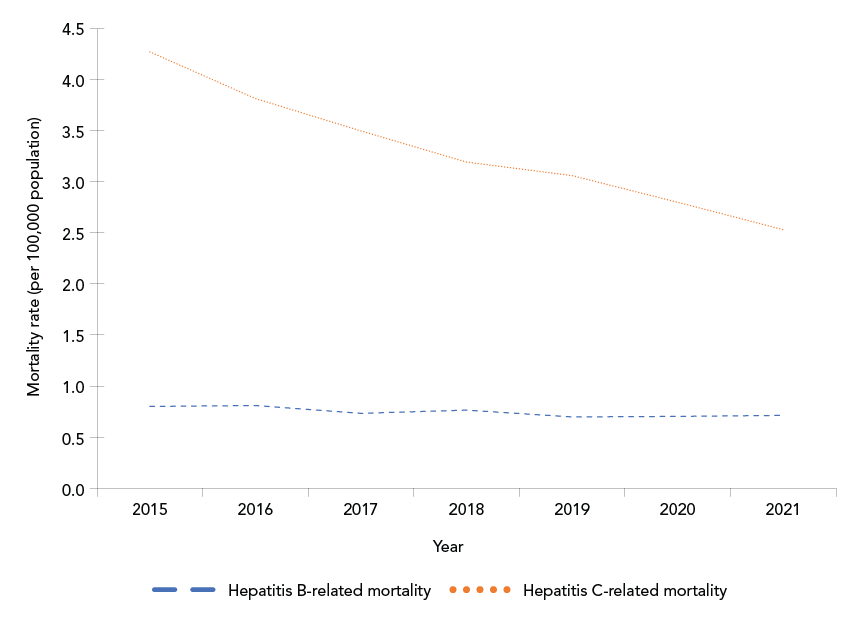
Figure 1: Descriptive text
This line graph shows crude annual hepatitis B virus (HBV)-related and hepatitis C virus (HCV)-related mortality rates (per 100,000 population) in Canada between 2015 and 2021. The y-axis shows the mortality rate per 100,000 population, and the x-axis shows the calendar year. Over the period displayed, the HBV-related mortality rate remained relatively stable, between 0.7 and 0.8, while the HCV-related mortality rate exhibited a decline from 4.3 per 100,000 population in 2015 to 2.5 per 100,000 population in 2021.
Hepatitis C incidence
An estimated 8,212 seroconversions (representing new HCV infections) occurred in 2021 in Canada, corresponding to an annual incidence rate of 21.47 per 100,000 population. The overall incidence rate has been slowly declining since 2013 (Figure 2). When grouped by birth cohort, as a proxy for established generations, those born between 1980 and 1994 had the highest incidence in 2021 (Figure 2) with 3,179 estimated seroconversions, for a rate of 39.76 per 100,000 population (data not shown).
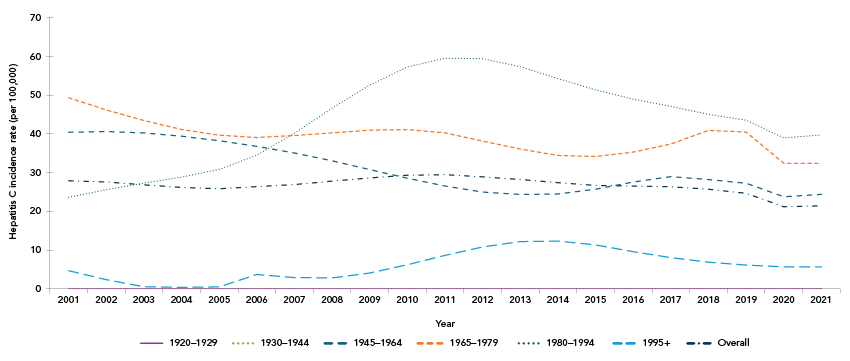
Figure 2: Descriptive text
This line graph shows the estimated annual hepatitis C virus (HCV) incidence rates by year and by birth cohort, between 2001 and 2021. The y-axis shows the estimated annual HCV incidence rate per year, the x-axis shows the calendar years, and the lines represent each birth cohort.
The overall estimated incidence rate among all birth cohorts has been slowly declining from approximately 28 per 100,000 population in 2001 to 21.47 per 100,000 population in 2021. The 1980–1994 birth cohort had the highest annual incidence rate in 2021 (at 39.76 per 100,000) and since 2007, with a peak of approximately 60 per 100,000 population in 2011. In contrast, the 1965–1979 birth cohort initially had the highest incidence rate in 2001 at approximately 49 per 100,000 population, which gradually declined to approximately 32 per 100,000 in 2021. Similarly, the incidence rate for the 1945–1964 birth cohort declined from approximately 40 per 100,000 population in 2001 to approximately 24 per 100,000 population in 2021. Incidence rates remained relatively stable among the birth cohort born in 1995 or after at approximately 5.0 per 100,000 population, while the 1920–1929 and 1930–1944 birth cohorts maintained an incidence rate of 0 per 100,000 population.
Hepatitis C prevalence
The estimated prevalence of anti-HCV antibodies in Canada was 0.99% (0.68%–1.30%) or 378,000 (258,000–497,000) people who were ever infected with HCV at the end of 2021. Among key populations, the highest estimated prevalence was among PWID (within 12 months) at 64.2% (36.7%–91.8%), followed by those who have ever injected drugs (35.4%; 9.3%–61.5%). In absolute numbers, adults in the 1945–1975 birth cohort represented the population with the largest number of people ever infected at 270,000 (157,000–383,000) (Table 3).
| Population | Population size estimate | Prevalence (%) | Estimated number of people with current or past HCV infection | Reference(s) | ||||
|---|---|---|---|---|---|---|---|---|
| Point estimate | Lower bound | Upper bound | Point estimate | Lower bound | Upper bound | |||
| General population | 38,239,864 | 0.99% | 0.68% | 1.3% | 378,000 | 258,000 | 497,000 | Footnote 12Footnote 21Footnote 29Footnote 30Footnote 31 Unpublished data from PHAC, 2021 (this study) |
| PWID, within 12 months | 100,300 | 64.2% | 36.7% | 91.8% | 64,400 | 36,800 | 92,100 | Footnote 32Footnote 33Footnote 34Footnote 35 Unpublished data from the HEPCO study, 2022–2023 (personal communication, Sarah Larney, 2024) |
| People who have ever injected drugs | 388,400 | 35.4% | 9.3% | 61.5% | 137,000 | 36,100 | 239,000 | Footnote 21Footnote 33Footnote 35Footnote 36Footnote 37 Unpublished data from the Virtual Cascade of Care Cohort study, 2018–2019 (personal communication, Stine Høj, 2023) |
| People incarcerated in provincial prisonsFootnote a | 18,950 | 14.2% | 9.5% | 19.0% | 2,700 | 1,790 | 3,600 | Footnote 38Footnote 39Footnote 40Footnote 41 Unpublished data from Alberta Health Services, 2023 (personal communication, Kaylee Goralcyk, 2024) |
| People incarcerated in federal prisonsFootnote b | 12,405 | 11.1% | 10.2% | 12.0% | 1,370 | 1,260 | 1,490 | Unpublished data from Correctional Service Canada, 2021 (personal communication, 2024) |
| First Nations | 1,048,400 | 8.0% | 3.5% | 12.5% | 84,000 | 36,600 | 131,000 | Footnote 42Footnote 43Footnote 44 Unpublished data from the CHMS, Statistics Canada, 2014–2015 |
| Immigrants from countries where hepatitis C is common (≥2% seroprevalence) | 1,276,405 | 4.0% | 2.9% | 6.7% | 51,500 | 36,700 | 85,300 | Footnote 25 |
| GBMSM | 669,613 | 3.0% | 0.82% | 5.2% | 20,100 | 5,490 | 34,800 | Footnote 27Footnote 45Footnote 46 Unpublished data from the Engage cohort study, 2017–2019 |
| Adults in the 1945–1975 birth cohort | 14,267,340 | 1.9% | 1.1% | 2.7% | 270,000 | 157,000 | 383,000 | Footnote 12Footnote 21Footnote 29Footnote 30Footnote 31Footnote 36Footnote 47 Unpublished data from PHAC, 2021 (this study) |
| Inuit | Insufficient information | |||||||
| Métis | Insufficient information | |||||||
The prevalence of CHC in Canada was estimated at 0.56% (0.15%–0.97%) or 214,000 (58,500–369,000) people living with CHC at the end of 2021. Among key populations, PWID (within 12 months) and those who have ever injected drugs had the highest estimated prevalence of CHC at 36.9% (12.6%–55.1%) and 18.1% (5.7%–30.5%), respectively. In absolute numbers, adults in the 1945–1975 birth cohort had the largest number of people living with CHC at 157,000 (30,000–284,000) (Table 4).
| Population | Population size estimate | Prevalence (%) | Estimated number of people living with CHC | Reference(s) | ||||
|---|---|---|---|---|---|---|---|---|
| Point estimate | Lower bound | Upper bound | Point estimate | Lower bound | Upper bound | |||
| General population | 38,239,864 | 0.56% | 0.15% | 0.97% | 214,000 | 58,500 | 369,000 | Footnote 12Footnote 21Footnote 30Footnote 31Footnote 48Footnote 49Footnote 50Footnote 51Footnote 52 |
| PWID, within 12 months | 100,300 | 36.9% | 12.6% | 55.1% | 37,000 | 12,600 | 55,300 | Footnote 32Footnote 33Footnote 34Footnote 35Footnote 53Footnote 54 Unpublished data from the Virtual Cascade of Care Cohort study, 2018–2019 (personal communication, Stine Høj, 2023) |
| People who have ever injected drugs | 388,400 | 18.1% | 5.7% | 30.5% | 70,100 | 21,900 | 118,000 | Footnote 21Footnote 35 Unpublished data from the Virtual Cascade of Care Cohort study, 2018–2019 (personal communication, Stine Høj, 2023) |
| People incarcerated in provincial prisonsFootnote a | 18,950 | 5.1% | 4.4% | 5.7% | 957 | 834 | 1,080 | Footnote 38Footnote 40Footnote 41 Unpublished data from Alberta Health Services, 2023 (personal communication, Kaylee Goralcyk, 2024) |
| First Nations | 1,048,400 | 3.3% | 1.5% | 5.0% | 34,300 | 15,800 | 52,800 | Footnote 42Footnote 43Footnote 44Footnote 55Footnote 56 |
| People incarcerated in federal prisonsFootnote b | 12,405 | 3.2% | 2.7% | 3.7% | 396 | 335 | 464 | Unpublished data from Correctional Service Canada, 2021 (personal communication, 2024) |
| Immigrants from countries where hepatitis C is common (≥2% seroprevalence) | 1,276,405 | 2.2% | 1.6% | 3.5% | 28,100 | 19,800 | 44,600 | Footnote 25 |
| Adults in the 1945–1975 birth cohort | 14,267,340 | 1.1% | 0.21% | 2.0% | 157,000 | 30,000 | 284,000 | Footnote 12Footnote 21Footnote 48Footnote 49Footnote 57 |
| GBMSM | 669,613 | 0.94% | 0.18% | 1.7% | 6,290 | 1,210 | 11,400 | Footnote 27Footnote 45Footnote 46 Unpublished data from the Engage cohort study 2017–2019 |
| Inuit | Insufficient information | |||||||
| Métis | Insufficient information | |||||||
Unawareness of chronic hepatitis C infection
The proportion of people living with CHC who were unaware of their infection was estimated at 41.5% (34.3%–48.8%) or 104,000 people. Among key populations, the largest proportion was among PWID at 49.9% (29.0%–70.2%), followed by people incarcerated in federal prisons at 32.7% (28.2%–37.5%). In absolute numbers, adults in the 1945–1975 birth cohort had the largest number of people unaware of their infection at 45,200 (24,700–65,800) (Table 5). Additional data are needed to estimate unawareness in other key populations.
| Population | Estimated number of people living with CHC | Proportion who were unaware (%) | Estimated number of people living with CHC who are unaware | Reference(s) | ||||
|---|---|---|---|---|---|---|---|---|
| Point estimate | Lower bound | Upper bound | Point estimate | Lower bound | Upper bound | |||
| General population | 214,000 | 41.5% | 34.3% | 48.8% | 104,000 | 73,300 | 104,000 | Footnote 21Footnote 48Footnote 49 |
| PWID, within 12 months | 37,000 | 49.9% | 29.0% | 70.2% | 18,500 | 10,700 | 26,000 | Footnote 32 |
| People who have ever injected drugs | Insufficient information | |||||||
| People incarcerated in provincial prisonsFootnote a | Insufficient information | |||||||
| First Nations | Insufficient information | |||||||
| People incarcerated in federal prisonsFootnote b | 396 | 32.7% | 28.2% | 37.5% | 129 | 112 | 148 | Unpublished data from Correctional Services Canada, 2021 (personal communication, 2024) |
| Adults in the 1945–1975 birth cohort | 157,000 | 28.9% | 15.7% | 41.9% | 45,200 | 24,700 | 65,800 | Footnote 21Footnote 48Footnote 49Footnote 58 |
| Immigrants from countries where hepatitis C is common (≥2% seroprevalence) | Insufficient information | |||||||
| Inuit | Insufficient information | |||||||
| Métis | Insufficient information | |||||||
| GBMSM | Insufficient information | |||||||
Hepatitis C treatment
It is estimated that, between 2012 and 2021, 108,000 people living with CHC received treatment. Since the introduction of highly effective DAAs in Canada in 2014, approximately 99,400 people were treated. Between 2015 and 2021, but drastically starting in 2017, the estimated number of people treated annually surpassed the estimated number of new infections annually (Table 6, Figure 3).
| Year | Estimated number of new HCV infections | Estimated number of people who received HCV treatment |
|---|---|---|
| 2012 | 10,075 | 4,370 |
| 2013 | 9,912 | 4,221 |
| 2014 | 9,690 | 5,147 |
| 2015 | 9,557 | 11,138 |
| 2016 | 9,580 | 10,496 |
| 2017 | 9,673 | 14,887 |
| 2018 | 9,506 | 19,155 |
| 2019 | 9,298 | 16,619 |
| 2020 | 8,086 | 11,774 |
| 2021 | 8,212 | 10,155 |
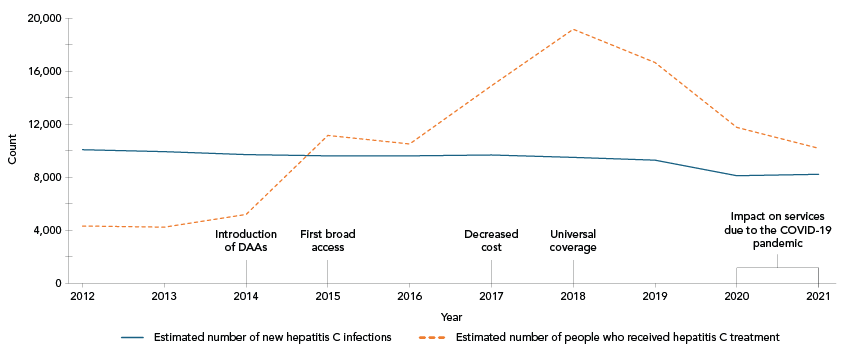
Figure 3: Descriptive text
This line graph shows the estimated number of new hepatitis C virus (HCV) infections and the estimated number of people who have received HCV treatment in Canada by year, between 2012 and 2021. The y-axis shows counts, and the x-axis shows the calendar years along with callouts on certain years identifying important milestones of HCV treatment access and policy in Canada.
The estimated number of people treated annually increased between 2014 and 2018, where it reached its peak. The estimated number of new HCV infections was relatively stable. In 2015, the number of people treated and cured surpassed the number of new infections.
| Year | Estimated number of new HCV infections | Estimated number of people who received HCV treatment | HCV treatment milestones |
|---|---|---|---|
| 2012 | 10,075 | 4,370 | N/A |
| 2013 | 9,912 | 4,221 | N/A |
| 2014 | 9,690 | 5,147 | Introduction of direct-acting antivirals (DAAs) |
| 2015 | 9,557 | 11,138 | First broad access |
| 2016 | 9,580 | 10,496 | N/A |
| 2017 | 9,673 | 14,887 | Decreased cost |
| 2018 | 9,506 | 19,155 | Universal coverage |
| 2019 | 9,298 | 16,619 | N/A |
| 2020 | 8,086 | 11,774 | Impact on services due to the COVID-19 pandemic |
| 2021 | 8,212 | 10,155 | N/A |
Hepatitis C-related mortality
In 2021, HCV was identified as a contributing cause for 972 deaths for a crude mortality rate of 2.54 per 100,000 population. Between 2010 and 2021, the annual mortality rate decreased, starting in 2016 (Figure 1).
Progress towards viral hepatitis elimination
Table 7 summarises the intermediary global targets for 2025 in relation to the 2021 estimates. For HBV, these estimates suggest that, as of 2021, Canada was on track to meet or had met three of the seven targets for 2025. For HCV, these estimates suggest that, as of 2021, Canada was on track to meet or had met three of the eight targets for 2025.
| Indicator | 2025 target Footnote 11 | 2021 estimates | Reference(s) |
|---|---|---|---|
| Hepatitis B | |||
| Hepatitis B surface antigen prevalence among children 0–4 years old | 0.5% | Additional data needed | |
| Number of new hepatitis B infections per year | 11/100,000 population | Additional data needed | |
| Number of people dying from hepatitis B per year | 7/100,000 population | 0.72/100,000 population | This study using Vital statistics data Footnote 18 |
| Percentage of newborns who have benefitted from a timely birth dose of hepatitis vaccine and from other interventions to prevent the vertical (mother-to-child) transmission of hepatitis B virus | 70% | Less than 2% | This study using Vital statistics data Footnote 18 |
| Hepatitis B vaccine coverage among children (third dose)Footnote a | 90% | 89.0% among 14-year-olds, 1 or more dose |
Footnote 17 |
| Percentage of people living with hepatitis B diagnosed | 60% | 57.5% | This study |
| Percentage of people living with hepatitis B diagnosed and treated | 50% | Additional data needed | |
| Hepatitis C | |||
| Number of new hepatitis C infections per year | 13/100,000 population | 21.47/100,000 population | This study |
| Number of new hepatitis C infections among PWID per year | 3/100 | Additional data needed | |
| Number of people dying from hepatitis C per year | 3/100,000 population | 2.54/100,000 population | This study using Vital statistics data Footnote 18 |
| Number of needles and syringes distributed per PWID | 200 | Additional data needed | |
| Blood safety: proportion of blood units screened for blood-borne diseases | 100% | 100% of blood donations are tested for hepatitis B and C | Footnote 59 |
| Safe injections: proportion of safe healthcare injections | 100% | Additional data needed | |
| Percentage of people living with hepatitis C diagnosed | 60% | 58.5% | This study |
| Percentage of people living with hepatitis C diagnosed and cured | 50% | Additional data needed | |
Discussion
Although the overall viral hepatitis burden is low in the general Canadian population, the 2021 national estimates indicate that certain populations and communities remain disproportionately affected, and that a significant number of people in Canada would benefit from targeted testing and treatment. These estimates mostly use data sources preceding the COVID-19 pandemic. Measuring post-pandemic estimates will be important to account for decreased demand for, and access to prevention, testing, treatment and care services for HBV and HCV. Given changes in methods and available evidence, these estimates replace previously published estimates and should not be compared over time.
It is estimated that 0.68% of people in Canada were living with CHB at the end of 2021. Other estimates for Canada include a 0.4% prevalence (2007–2011) Footnote 61 and a 0.6% HBsAg prevalence (2022) Footnote 62Footnote 63, which are comparable to the results in this study. Immigrants from countries where HBV is common have the highest burden, by far. Regarding progress towards HBV elimination, we cannot report on the incidence target using available data. Estimates suggest that Canada is close to meeting the 60% diagnosis target for 2025 with 57.5% people living with CHB who were aware of their infection. Awareness data for key populations is scarce, limiting the evidence base for planning targeted interventions. An estimated 0.72 deaths per 100,000 population were identified as HBV-related in 2021, suggesting that the 2025 target of seven per 100,000 population is met, which is supported by a modelling study estimating one per 100,000 population HBV-related deaths in Canada in 2019 Footnote 64. The HBV vaccine coverage of 89% in adolescents approximates the 2025 target of 90% among children. We estimate that less than 2% of infants born in Canada in 2021 had access to universal birth dose vaccination, far from the 70% global target set for 2025. Of note, health care is a provincial and territorial responsibility, and the Canadian Immunization Guide indicates that the HBV vaccine should be provided according to provincial and territorial immunization schedules Footnote 65. Hepatitis B treatment data were not nationally validated at the time of press.
An estimated 21.47 new HCV infections per 100,000 population occurred in 2021, highlighting that more prevention work, including harm reduction services in all settings Footnote 8Footnote 10, is needed to reduce the incidence of HCV and meet the 2025 target of 13 per 100,000 population. We estimate that 0.99% of the Canadian population was ever infected with HCV. Other estimates include a 0.07% anti-HCV prevalence among Canadian first-time blood donors in nine provinces, representing a low-risk and undiagnosed population Footnote 66. We estimate the CHC prevalence at 0.56% in the general population; other CHC estimates include a prevalence of viremic infection of 130,000 people (2022) Footnote 67, and of 0.03% among low-risk undiagnosed blood donors (2021) Footnote 66. Among people living with CHC, we estimate that 58.5% were diagnosed, suggesting that Canada is close to meeting the 2025 diagnosis target of 60%. However, additional data will be needed to quantify awareness of CHC in all key populations. We identified 2.54 HCV-related deaths per 100,000 population, suggesting that Canada has met the 2025 target of 3 per 100,000. However, this finding contrasts with other evidence suggesting a seven per 100,000 population mortality rate in Canada for 2021 Footnote 64. Of note, in absolute numbers, more deaths were attributed to HCV than HBV in 2021, despite the availability of curative treatment which is associated with reduced mortality Footnote 68.Treatment data suggest that more people are being treated for HCV each year than there are new infections. Administrative data for key populations is not available at the national level, although it is documented that self-reported treatment uptake varies by key populations Footnote 32Footnote 69. Since treatment estimates do not consider mortality among treated individuals, we are unable to report on the proportion treated among people living with diagnosed HCV.
Limitations
The main strengths of this study are the use of updated Canadian Health Measures Survey (CHMS) data, in combination with results from modelling using national surveillance data as model inputs for the first national HBV estimates and updated HCV estimates. We also compiled a thorough list of relevant scientific studies to inform the workbook estimates.
The analyses for this study have several limitations. First, mathematical modelling used for incidence (HCV) and as a lower bound for prevalence was based on reported cases, likely underestimating the true burden. The COVID-19 pandemic had an impact on STBBI testing in Canada Footnote 70Footnote 71Footnote 72Footnote 73, potentially making the modelled estimates for 2020–2021 an underestimation despite mathematical corrections. The workbook method produces large ranges of uncertainty given the heterogeneity of studies (e.g., participants, sampling, methods, geographic location) and data. In some instances, results from local studies were extrapolated nationally. These may impact the precision and accuracy of the estimates. Data is limited for key populations, restricting our capacity to provide estimates for all. Moreover, given the intersection of risks and identities across key populations, estimates cannot be added together or used to create proportions. The general population estimates for CHC rely on data for a reference period up to 2019, therefore this study's findings may be more representative of the burden for 2019 than for the end of 2021. Measures of HBsAg and HCV RNA, where applicable, were used as proxies for CHB and CHC infections, respectively. Both could potentially result in a slightly overestimated chronicity, given that HBsAg is a marker of active HBV infection that occurs in its acute or chronic phase Footnote 74, and that HCV RNA is detectable for most people in the acute phase of the infection Footnote 75. The measure of the HBV vaccine target is likely overestimated since it is measured in adolescents with at least one dose. For mortality, a direct measurement method of documented causes of deaths was used, which excludes all deaths among undiagnosed individuals. As well, potential underreporting of causes on death certification is likely, which could lead to underestimation of the measure towards the target for deaths not identified as viral hepatitis-related. On the other hand, deaths with other direct causes, such as accidents or drug toxicity, may be misclassified as viral hepatitis-related, which would result in overestimation of mortality. Given the nature of this study, we could not control for confounding and missing data.
Conclusion
Prevention of advanced liver disease caused by viral hepatitis is possible, and epidemiological estimates are essential to identify gaps in the care continuum by key population, contribute to planning evidence-based interventions, and track progress towards elimination as a public health concern. While these estimates suggest that Canada has met or is on track to meet six of the 15 global targets for 2025, more work is needed to address data gaps and to meet the targets that are not on track, such as HCV incidence. Additional national-level data are needed to produce estimates of prevalence and proportion unaware among all key population and to report Canada's progress towards all elimination targets, including validated treatment data for HBV and cascade of care data.
Authors' statement
-
SP — Conceptualization, methodology, formal analysis, validation, writing–original draft, writing–review & editing
AW — Methodology, formal analysis, validation
LC — Conceptualization, methodology, formal analysis, validation
JE — Methodology, formal analysis
FZ — Methodology, formal analysis
QY — Conceptualization, methodology, formal analysis
JC — Methodology, validation
KD — Methodology, validation
JJF — Methodology, validation
MBK — Methodology, validation
NK — Methodology, validation
MJB — Methodology, validation
PKD — Methodology, validation
NP — Conceptualization, methodology, validation, supervision
All authors approved the final version of the manuscript.
Competing interests
The statements, findings, conclusions, views, and opinions expressed in this report are based in part on data obtained under licence from IQVIA Solutions Canada Inc. concerning the following information service(s): CompuScript and GPM Custom Solutions from January 2012 to December 2021. All Rights Reserved. The statements, findings, conclusions, views, and opinions expressed herein are not necessarily those of IQVIA Solutions Canada Inc. or any of its affiliated or subsidiary entities.
MJB reports receiving presentation fees from AbbVie and Gilead, and grant funding from AbbVie, Gilead, and Cepheid. NK has received research funding from ViiV Healthcare, Abbvie, and Gilead, advisory fees from Gilead Sciences, ViiV Healthcare, Merck, and Abbvie, and speaker fees from Gilead Sciences, Abbvie, and Merck, all outside this work. MBK reports grants for investigator-initiated studies from ViiV Healthcare, AbbVie, and Gilead; and consulting fees from ViiV Healthcare, Merck, AbbVie, and Gilead.
ORCID numbers
-
Simone Périnet — 0000-0002-3077-7908
Anson Williams — 0009-0009-6512-4884
Laurence Campeau — 0000-0002-8675-0317
Qiuying Yang — 0009-0003-7939-3029
Joseph Cox — 0000-0002-7041-1556
Jordan J. Feld — 0000-0003-2640-2211
Marina B. Klein — 0000-0002-3063-8430
Nadine Kronfli — 0000-0003-2724-0496
Mia J. Biondi — 0000-0002-1409-9908
Peter K. Daley — 0000-0001-7068-8056
Nashira Popovic — 0009-0007-3841-5841
Acknowledgements
We thank non-co-author members of our Working Group for their expert guidance throughout the estimates process: Drs Carla S. Coffin, Brian Conway, Naveed Janjua, Curtis Cooper, Christina Greenaway, Gisela Macphail, Sara Larney, Samuel S. Lee, William W.L. Wong, Marjolaine Pruvost, Abdel Aziz Shaheen and Eliverta Bicja. We also thank Correctional Service Canada, Alberta Health Services, and teams for the Tracks bio-behavioural surveys (Public Health Agency of Canada), the Virtual Cascade of Care Cohort, the Hepatitis cohort (HEPCO) and the Engage cohort for sharing unpublished data. We thank the health librarians from the Health Canada Library for providing the systematic literature searches.
Funding
This work was supported by the Public Health Agency of Canada. MBK is supported by a Tier I Canada Research Chair. NK is supported by a career award from the Fonds de Recherche Québec – Santé (FRQ-S; Junior 2).
