
ARCHIVED - Chronic Diseases and Injuries in Canada
Volume 31, no. 4, September 2011
Chronic Diseases and Injuries in Canada
The prevalence of chronic pain and pain-related interference in the Canadian population from 1994 to 2008
M. L. Reitsma, MSc (1); J. E. Tranmer, PhD (1); D. M. Buchanan, PhD (1); E. G. Vandenkerkhof, DrPH (1,2)
https://doi.org/10.24095/hpcdp.31.4.04
This article has been peer reviewed.
Author references:
- School of Nursing, Queen’s University, Kingston, Ontario, Canada
- Department of Anesthesiology, Queen’s University, Kingston, Ontario, Canada
Correspondence: Elizabeth VanDenKerkhof, Department of Anesthesiology & Perioperative Medicine, Queen's University, 76 Stuart St., Kingston ON K7L 2V7; Tel.: (613) 549-6666 ext. 3964; Fax: (613) 548-1375; Email: ev5@queensu.ca
Abstract
Introduction: Estimates of the prevalence of chronic pain worldwide and in Canada are inconsistent. Our primary objectives were to determine the prevalence of chronic pain by sex and age and to determine the prevalence of pain-related interference for Canadian men and women between 1994 and 2008.
Methods: Using data from seven cross-sectional cycles in the National Population Health Survey and the Canadian Community Health Survey, we defined two categorical outcomes, chronic pain and pain-related interference with activities.
Results: Prevalence of chronic pain ranged from 15.1% in 1996/97 to 18.9% in 1994/95. Chronic pain was most prevalent among women (range: 16.5% to 21.5%), and in the oldest (65 years plus) age group (range: 23.9% to 31.3%). Women aged 65 years plus consistently reported the highest prevalence of chronic pain (range: 26.0% to 34.2%). The majority of adult Canadians who reported chronic pain also reported at least a few activities prevented due to this pain (range: 11.4% to 13.3% of the overall population).
Conclusion: Similar to international estimates, this Canadian population-based study confirms that chronic pain persists and impacts daily activities. Further study with more detailed definitions of pain and pain-related interference is warranted.
Keywords: chronic pain, prevalence, sociodemographic factors, general population, activity prevention
Introduction
Approximately 17% of Canadians—3.9 million individuals aged 15 years plus—reported having chronic pain or some discomfort.(1) Chronic pain interferes with quality of life, including the social and family aspects, and with the ability to work.(2) In 2010, the Chronic Pain Association of Canada reported that “the annual cost of chronic pain, including medical expenses, lost income, and lost productivity, but not the social costs, is estimated to exceed $10 billion.”(3)
The prevalence of non-specific chronic pain in the general population is reported to be as high as 55%.(4,5) Canadian studies have also reported a broad range of estimates of prevalence of chronic pain, from 11% to 44%.(1,2,6-13) These studies used time frames ranging from 3 to 6 months(2,6,7,12) or defined pain as usual pain/often troubled with pain;(1,8,13)however, pain definitions with a broader time frame (i.e. usual or persistent pain) reported lower prevalence estimates.(1,8-11,13)Moreover, of all the Canadian reports, only five were large population-based studies(1,9-11,13) and three of these reported on older data from the National Population Health Survey (NPHS) 1996/97 cycle.(9,11,13)
Both Canadian and international prevalence estimates of chronic pain varied by age and sex, with a higher prevalence in females(2,5,6-10,12,14-18) and in the older age group.(2,5,6-11,14,15,17-20) Not all of the Canadian studies that examined the prevalence of chronic pain within gender and age categories are representative of the general population; one study included a participant sample representative of seven counties in southeastern Ontario(12) and another of a city near Toronto.(8) Nevertheless, the available evidence from cross-sectional population-based studies that used older data (from 1996/97) and from smaller studies suggests that in Canada, women and older individuals report chronic pain more often. Although previous studies found that pain interferes with daily activities,(1,2,7,8,10,12,13) no studies have addressed the interference of chronic pain in Canadians over time.
The purpose of our study was to examine the overall prevalence of chronic pain and pain-related interference in Canadians over time, regardless of the factors associated with it. The specific research objectives were to
Methods
Questionnaire and data collection
Our study used data from seven cross-sectional cycles from the Household component of the NPHS (1994/95, 1996/97 and 1998/99) and the Canadian Community Health Survey (CCHS) (2000/01, 2003, 2005 and 2007/08) to document chronic pain in Canada over time. These surveys collect information on participants’ health status, determinants of health and use of health and medical services through structured interviews held in person and by telephone.(21,22)
The NPHS began in 1994 as both a cross-sectional and longitudinal survey; in 2000/01, the cross-sectional component of the NPHS became part of the CCHS, still conducted by Statistics Canada.(21) Both the NPHS and CCHS took place biennially until 2007, when the CCHS became an annual survey, but the combined data for the two years (2007/08) were also released.(23) Both surveys were developed by specialists at Health Canada, Statistics Canada and provincial health ministries as well as academic researchers in relevant fields; advisory and expert committees approved the questionnaires. Further information on the sample design of the NPHS and CCHS is available elsewhere.(21,22)
Population and sample
We included NPHS participants aged 25 years plus and CCHS participants aged 20 years plus. The difference in the age groups is due to the different age categories used in the variation tables provided by Statistics Canada (12–24, 25–44, 45–64 and 65+ years for NPHS; 12–19, 20–29, 30–44, 45–64, and 65+ years for CCHS). Although some of the previous studies included participants as young as 15 years old,(11,14,15,19) we limited age to 20 years and over to avoid combining and comparing adolescents and adults. Two prospective studies(24,25) and one study that used the NPHS data(13) also used data for those aged 25 years plus at baseline; hence we can compare our results with published results.
In the 1994/95, 1996/97 and 1998/99 NPHS, the household sample was selected from the 10 provinces and included 17 626 participants, 81 804 participants and 17 244 participants, respectively.(26-2)(8) The participants were selected using two different sampling techniques including clusters and dwellings.(21) In the 2000/01, 2003, 2005 and 2007/08 CCHS, 65 000 participants from 121 health regions from all the provinces and territories were required each year.(22) The sample sizes were 130 827 participants in 2000/01, 134 072 in 2003, 132 947 in 2005 and 131 061 in 2007/08.(23,29-31) The most recent census was used to guide the sample population and account for recent deaths, births and estimated migration; if needed, changes were made to the surveyed health regions based on the latest census.(23,26-31) Moreover, when results are weighted correctly, the NPHS and CCHS are representative of the covered population including the provinces and territories from which they were sampled.(23,26-31) Both the NPHS and CCHS household cross-sectional components excluded residents of institutions, reserves and some remote areas and full-time members of the Canadian forces.(21,22) Response rates for all of the cycles used in this study were greater than 77.6%.
Variables
Outcome variable : pain and pain interference
We defined chronic pain using the following question: “Are you usually free of pain or discomfort?”(26-30,32,33) Participants who responded “no” were considered to have chronic pain. These individuals were then asked how many activities their pain or discomfort prevented, choosing from “none,” “a few,” “some” or “most.”(26-30,32,33) This definition, used in several studies, is thought to be a valid measure of the prevalence of chronic pain in the general population.(9,13)
Independent variables: age and sex
We examined the presence of “usual pain” by sex and by age and the number of activities prevented due to this pain by sex. Participants were grouped into age categories depending on the variation tables provided by Statistics Canada (25–44, 45–64, 65+ years for NPHS; 20–44 [20–29 and 30–44], 45–64, 65+ years for CCHS).
Data analysis
We analyzed the data for each NPHS and CCHS cycle separately using SPSS version 16.0 (IBM). For each statistical test, the sample was weighted to the Canadian population using the appropriate weighting variable for each cycle.(23,26-31) The Canadian population was described by sex for each cycle using numbers and percentages. Significant differences in the prevalence estimates and measures of prevented activities between groups were identified using 95% confidence intervals (CIs). Sampling weights were applied to all estimates to allow for generalization to the Canadian population. Only groups that included at least 30 sampled participants were reported as indicated in the release guidelines set out by Statistics Canada.(26,29) We compared all numbers reported to the Statistics Canada Sampling Variability Tables to determine if the cell frequency for a given variable was large enough to avoid an individual being identified: if the coefficient of variation was between 0.0 and 16.5, it was acceptable to release; if 16.6 to 33.3, it was considered marginal and numbers were allowed to be released with a caution (in the NPHS, coefficient of variations between 25.1 and 33.3 could only be released with the exact variance); and if greater than 33.3, it could not be released.(26,29) Confidence intervals were obtained using the Sampling Variability Tables. For the CCHS 2003, estimates were obtained using a subsample macro file in the Research Data Centre at Queen’s University and we performed bootstrapping and obtained confidence intervals in STATA: Data Analysis and Statistical Software version 11.0 (StataCorp LP). Bootstrapping allows robust standard error estimates and confidence intervals for a variety of estimates, including means and proportions.(34) We replicated five hundred samples for each analysis to ensure results were not significant due to large sample sizes.
The Queen’s University Health Sciences and Affiliated Teaching Hospitals Research Ethics Board reviewed and approved this analysis.
Results
Population
The ratio of men to women was similar across years and between provinces, with a higher ratio of women to men; the reverse was seen in the Yukon, Northwest Territories and Nunavut. The Canadian population to which these results are generalizable (i.e. non-military, non-institutionalized, etc.) increased from 18 836 000 individuals in 1994/95 to 24 639 000 in 2007/08.
Chronic pain
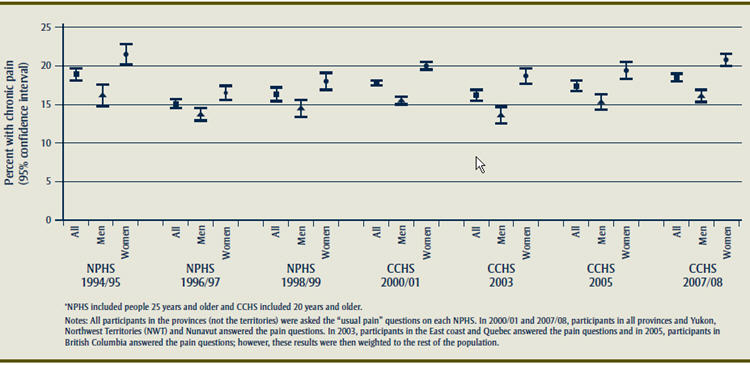
In the first cycle (1994/95), 18.9% (95% CI: 18.1–19.7) of the Canadian population reported chronic pain; in the next cycle (1996/97), this percentage dropped to 15.1% (95% CI: 14.5–15.7). Since then, this percentage has increased overall to a high of 18.5% (95% CI: 18.0–19.0) in 2007/08. Generally, the prevalence reported in consecutive cycles was not significantly different from one to the next. However, the 1996/97 cycle reported a significantly lower prevalence compared to all others except the 1998/99 cycle. Figure 1 shows the prevalence of chronic pain between 1994/95 and 2007/08.
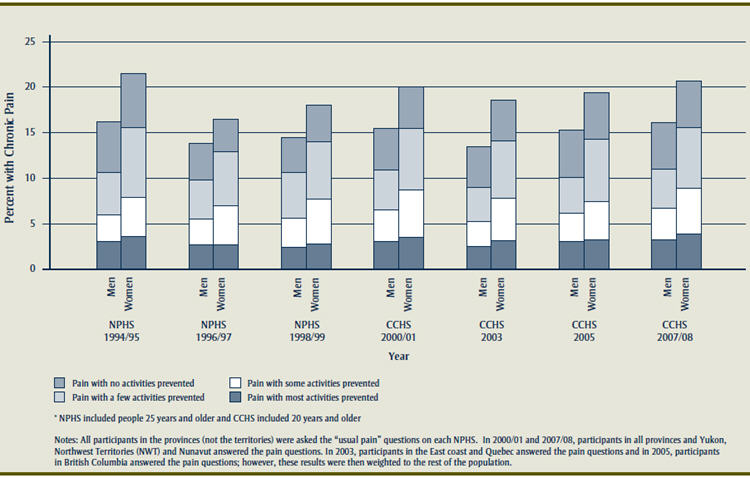
Figure 1
Crude prevalence of chronic pain in men and women in the Canadian population based on the cross-sectional data from the National Population Health Survey and Canadian Community Health Survey
Text Equivalent of Figure 1
Figure 1 shows the prevalence of chronic pain between 1994/95 and 2007/08. Women reported higher pain estimates in every surveyed cycle compared to men. The prevalence of chronic pain in women ranged from 16.5% (95% CI: 15.6–17.4) in 1996/97 to 21.5% (95% CI: 20.2–22.8) in 1994/95 and in men from 13.6% (95% CI: 12.5–14.7) in 2003 to 16.2% (95% CI: 14.8–17.6) in 1994/95. In general, there were no significant differences in pain prevalence by sex over time; however, there were significant differences between sexes.
Women reported higher pain estimates in every surveyed cycle compared to men. The prevalence of chronic pain in women ranged from 16.5% (95% CI: 15.6–17.4) in 1996/97 to 21.5% (95% CI: 20.2–22.8) in 1994/95 and in men from 13.6% (95% CI: 12.5–14.7) in 2003 to 16.2% (95% CI: 14.8–17.6) in 1994/95. In general, there were no significant differences in pain prevalence by sex over time; however, there were significant differences between sexes (Figure 1).
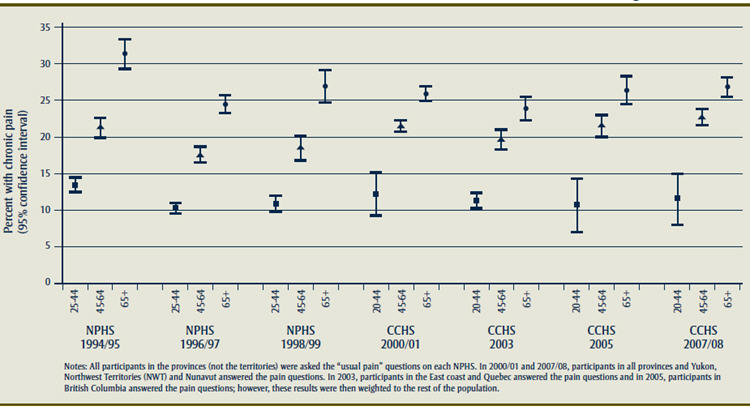
The prevalence of pain was significantly different between age groups (Figure 2). The oldest age group (65+ years) reported the highest prevalence of chronic pain (range: 23.9% to 31.3%); there was no significant trend over time. Generally, there was a significant difference in the prevalence of chronic pain reported between the age groups in both men and women (Figures 3 and 4); further, women in the two oldest age groups (45–64 and 65+ years) reported significantly higher prevalence estimates than did men in these age groups. Women aged 65 years plus consistently reported the highest prevalence of chronic pain, ranging from 26.0% (95% CI: 24.4–27.6) in 1996/97 to 34.2% (95% CI: 31.9–36.5) in 1994/95.
Figure 2
Crude prevalence of chronic pain in the Canadian population based on the cross-sectional data from the National Population Health Survey and Canadian Community Health Survey by age
Text Equivalent of Figure 2
The prevalence of pain was significantly different between age groups. The oldest age group (65+ years) reported the highest prevalence of chronic pain (range: 23.9% to 31.3%); there was no significant trend over time.
Figure 3
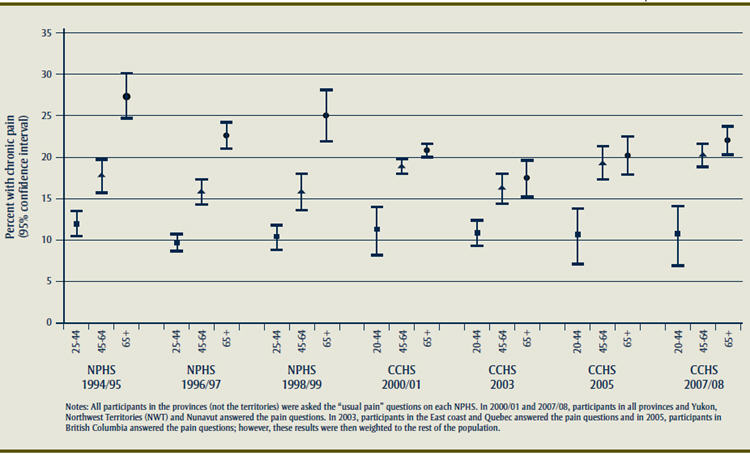
Crude prevalence of chronic pain in men in the Canadian population based on the cross-sectional data from the National Population Health Survey and Canadian Community Health Survey by age
Text Equivalent of Figure 3
Generally, there was a significant difference in the prevalence of chronic pain reported between the age groups in both men and women; further, women in the two oldest age groups (45–64 and 65+ years) reported significantly higher prevalence estimates than did men in these age groups. Women aged 65 years plus consistently reported the highest prevalence of chronic pain, ranging from 26.0% (95% CI: 24.4–27.6) in 1996/97 to 34.2% (95% CI: 31.9–36.5) in 1994/95.
Figure 4
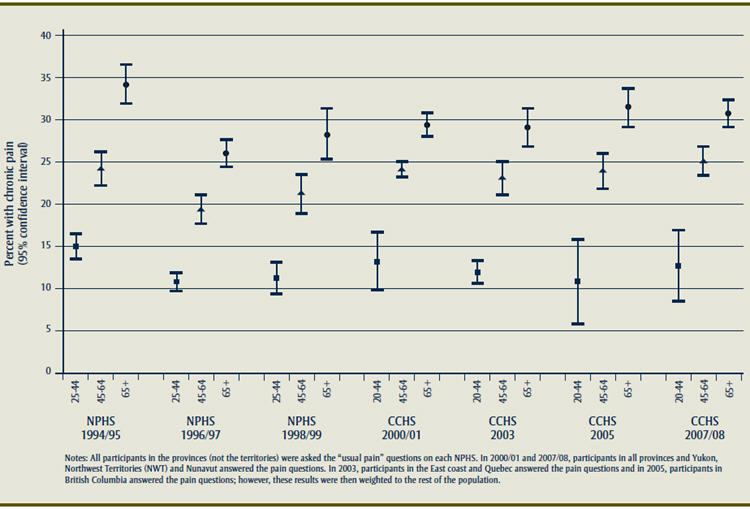
Crude prevalence of chronic pain in women in the Canadian population based on the cross-sectional data from the National Population Health Survey and Canadian Community Health Survey by age
Text Equivalent of Figure 4
Generally, there was a significant difference in the prevalence of chronic pain reported between the age groups in both men and women; further, women in the two oldest age groups (45–64 and 65+ years) reported significantly higher prevalence estimates than did men in these age groups. Women aged 65 years plus consistently reported the highest prevalence of chronic pain, ranging from 26.0% (95% CI: 24.4–27.6) in 1996/97 to 34.2% (95% CI: 31.9–36.5) in 1994/95.
Level of activities prevented by chronic pain
The majority of the population with chronic pain reported interference with activities: 11.4% of the entire population in 1996/97 (95% CI: 10.8–12.0) to 13.3% of the entire population in 2000/01 (95% CI: 13.0–13.6) and 2007/08 (95% CI: 12.8–13.8) reported at least a few prevented activities (Figure 5). Overall, compared to men at each surveyed year, women reported more interference and significantly more pain that prevented a few activities and some activities (Figure 6). Generally, there was no difference between women and men reporting pain that prevented no activities and most activities. Also, there was no statistically significant difference between consecutive years; further, the patterns are similar between prevalence of chronic pain and pain interference over the years.
Figure 5
Crude prevalence of chronic pain with the level of activity prevented using cross-sectional data from the National Population Health Survey and Canadian Community Health Survey

Text Equivalent of Figure 5
The majority of the population with chronic pain reported interference with activities: 11.4% of the entire population in 1996/97 (95% CI: 10.8–12.0) to 13.3% of the entire population in 2000/01 (95% CI: 13.0–13.6) and 2007/08 (95% CI: 12.8–13.8) reported at least a few prevented activities.
Figure 6
Crude prevalence of chronic pain in men and women with the level of activity prevented using cross-sectional data from the National Population Health Survey and Canadian Community Health Survey
Text Equivalent of Figure 6
Overall, compared to men at each surveyed year, women reported more interference and significantly more pain that prevented a few activities and some activities. Generally, there was no difference between women and men reporting pain that prevented no activities and most activities. Also, there was no statistically significant difference between consecutive years; further, the patterns are similar between prevalence of chronic pain and pain interference over the years.
Missing data for the chronic pain variables in each cycle ranged from 0.1% to 0.5%.
Discussion
This is the first study to examine the prevalence and interference of chronic pain over a 14-year period (1994–2008) in Canadian adults.
With the exception of a significant decrease in chronic pain from the first cycle (1994/95) to the second cycle (1996/97) (Figure 1), the prevalence of chronic pain gradually increased over time. The overall temporal trend was not significant; however, there was a significant difference between the cycle years 1996/97 and 2007/08, indicating real increases in chronic pain over time.
Our study reported prevalence estimates (15.1% to 18.9%) that were within earlier Canadian estimates (11% to 44%).(2,6-13) The differences could be attributed to differences in sampling methodology, sample sizes and definitions of chronic pain. Population level studies with large sample sizes (10 000 participants or more) such as ours were more likely to report smaller prevalence estimates (11% to ~21%) than were studies with fewer participants.(1,9-11,13-15,35,36)
Studies using the same or similar definitions as the NPHS and CCHS reported prevalence estimates (11% to 17%) comparable to our findings.(1,8-11,13) Three of these used the 1996/97 NPHS cycle,(9,11,13) with one reporting only chronic non-cancer pain(11) and another reporting all chronic pain;(13) nevertheless, prevalence estimates remained similar. Studies that used a concrete timeframe to define chronic pain (e.g. 3 or 6 months) were more likely to report higher estimates of chronic pain than we found when using a more general timeframe (i.e. usual pain).(2,6,7,12) However, small sample sizes may also have affected the reported prevalence estimates.(2,6,7,12) Further, it was not clear that all reports of estimates of chronic pain were based on a validated measure.(19,25,37) Results from studies not using a validated definition should be interpreted with caution.
The majority of those reporting chronic pain also reported interference in daily activities as a result of this pain; moreover, the level of interference in activities due to chronic pain (range: 11.4% to 13.3%) is consistent with an Australian study also reporting interference in daily activities (women: 13.5%; men: 11.0%).(14)
We found that women were more likely to report chronic pain than were men and that chronic pain generally increased with age. These findings were consistent across survey cycles and are supported by the literature.(2,5,6-8,11,12,14-18,20,37) We also found that chronic pain was most prevalent in the women’s oldest age group (65+ years) and that most participants reporting chronic pain also reported interference with activities due to pain, with women reporting more interference than did men.
One limitation of our study is that we did not control for diseases known to be associated with chronic pain, such as arthritis, and therefore we could not distinguish between condition-re lated pain and chronic pain of unknown origin. This may partially explain the higher reported prevalence of chronic pain in older women who are known to report more chronic pain conditions than do men (e.g. due to fibromyalgia, arthritis/rheumatism, back problems, and migraine headaches).(38)Differences in prevalence estimates worldwide may be true differences, or they may be due to a number of factors, including lifestyle, age distribution, and pain perception and treatment.(36) A longitudinal study is necessary to elucidate factors that increase the risk of chronic pain.
Second, although the NPHS and CCHS household cross-sectional components are representative of most of Canada, they both exclude residents of institutions.(21,22) As a result, the prevalence of chronic pain in the Canadian population may be underreported as nursing homes and other long-term care facilities most likely have many individuals suffering from chronic pain.(39) Third, the pain question does not specify a time frame for “usual pain.” Individuals with other conditions may also be reporting chronic pain. However, our findings are similar to the results reported in a cross-sectional study using 1996/97 NPHS data that controlled for medical and health factors.(11) Moreover, previous studies using general pain definitions reported similar prevalence estimates of chronic pain.(1,8-11,13) The age groups, although similar, are not identical between the NPHS (25 years plus) and CCHS (20 years plus), but results are similar across cycles. Similar age groups were used in the literature, so our results could be compared to those of previous studies.(13,24,25) Finally, recall bias may be an issue due to self-reported questionnaires.
There are substantial strengths to this study. The seven NPHS and CCHS cycles were each based upon a large random sample with minimal missing data. This large random sample supports the generalizability of the findings to the rest of the population (excluding those few areas mentioned above). Further, Van Den Kerkhof et al. compared the Canadian census data to the NPHS 1996/97 data using direct standardization and found the sample to be representative and generalizable to the overall Canadian population.(13) Also, the pain questions are considered to be a valid measure of chronic pain.(9,13,39) Thus these results provide a reliable and accurate estimate of the prevalence of chronic pain and interference in daily activities as a result of pain in the Canadian population.
Conclusion
This study is the first to examine the prevalence of chronic pain over a number of years in Canada; it demonstrated that chronic pain is prevalent in the Canadian population (range: 15.1% to 18.9%), that it is most prevalent among women (range: 16.5% to 21.5%) and the older population (range: 23.9% to 31.3%), and that many of those with chronic pain were prevented from taking part in at least a few activities by this pain (range: 11.4% to 13.3%). Cross-sectional studies do not identify the incidence of a disease or predictors and/or causes of a disease or illness. Therefore, future research includes the need for a longitudinal study to identify the incidence and predictors of chronic pain in Canadians.
Funding
Funding was provided by the Freda Paltiel Award for statistics consultation. Funding was also received through the Queen’s Graduate Award.
References
- Millar WJ. Chronic pain. Health Rep. 1996;7(4):47-53.
- Moulin DE, Clark AJ, Speechley M, Morley-Forster PK. Chronic pain in Canada —prevalence, treatment, impact and the role of opioid analgesia. Pain Res Manag. 2002 Winter;7(4):179-84
- Pain Facts [Internet]. Edmonton (AB): Chronic Pain Association of Canada. [cited 2010 Apr 5]. Available from: http://www.chronicpaincanada.com
- Andersson HI, Ejlertsson G, Leden I, Rosenberg C. Chronic pain in a geographically defined general population: studies of differences in age, gender, social class, and pain localization. Clin J Pain. 1993;9(3):174-82.
- Elliott AM, Smith BH, Penny KI, Smith WC, Chambers WA. The epidemiology of chronic pain in the community. Lancet. 1999 Oct; 354(9186):1248-52.
- Birse TM, Lander J. Prevalence of chronic pain. Can J Public Health. 1998 Mar- Apr;89(2):129-31.
- Boulanger A, Clark AJ, Squire P, Cui E, Horbay GL. Chronic pain in Canada: have we improved our management of chronic noncancer pain? Pain Res Manag. 2007 Spring;12(1):39-47.
- Crook J, Rideout E, Browne G. The prevalence of pain complaints in a general population. Pain. 1984 Mar;18(3):299-314.
- Health Surveillance Alberta Health. Chronic pain in Alberta: a portrait from the 1996 National Population Health Survey and the 2001 Canadian Community Health Survey [Internet]. 2003 May [cited 2011 Jan 26]. Available from: www.health.alberta.ca/documents/Chronic-Pain-Survey-2003.pdf
- Meana M, Cho R, DesMeules M. Chronic pain: the extra burden on Canadian women. BMC Womens Health. 2004 Aug; 4 Suppl 1:S17.
- Rashiq S, Dick BD. Factors associated with chronic noncancer pain in the Canadian population. Pain Res Manag. 2009 Nov-Dec;14(6):454-60.
- Tripp DA, VanDenKerkhof EG, McAlister M. Prevalence and determinants of pain and pain-related disability in urban and rural settings in southeastern Ontario. Pain Res Manag. 2006 Winter;11(4):225-33.
- Van Den Kerkhof EG, Hopman WM, Towheed TE, Anastassiades TP, Goldstein DH; Canadian Multicentre Osteoporosis Study Research Group. The impact of sampling and measurement on the prevalence of self-reported pain in Canada. Pain Res Manag. 2003 Fall;8(3):157-63.
- Blyth FM, March LM, Brnabic AJ, Jorm LR, Williamson M, Cousins MJ. Chronic pain in Australia: a prevalence study. Pain. 2001 Jan;89(2-3):127-34.
- Eriksen J, Jensen MK, Sjogren P, Ekholm O, Rasmussen NK. Epidemiology of chronic non-malignant pain in Denmark. Pain. 2003 Dec;106(3):221-8.
- Rustoen T, Wahl AK, Hanestad BR, Lerdal A, Paul S, Miaskowski C. Prevalence and characteristics of chronic pain in the general Norwegian population. Eur J Pain. 2004 Dec;8(6):555-65.
- Sa K, Baptista AF, Matos MA, Lessa I. Prevalence of chronic pain and associated factors in the population of Salvador, Bahia. Rev Saude Publica. 2009 Aug; 43(4):622-30.
- Catala E, Reig E, Artes M, Lopez JS, Segu JL, Aliaga L. Prevalence of pain in the Spanish population: telephone survey in 5000 homes. Eur J Pain. 2002 April;6(2):133-40.
- Sjogren P, Ekholm O, Peuckmann V, Gronbaek M. Epidemiology of chronic pain in Denmark: an update. Eur J Pain. 2009 Mar;13(3):287-92.
- Ng KF, Tsui SL, Chan WS. Prevalence of common chronic pain in Hong Kong adults. Clin J Pain. 2002 Sep-Oct;18(5):275-81.
- Statistics Canada. National Population Health Survey - Household Component - Cross-sectional (NPHS) [Internet]. Ottawa (ON): Statistics Canada; 2000 [cited 2009 Jun 25]. Available from: http://www.statcan.gc.ca/cgi-bin/imdb/p2SV.pl?Function=getSurvey&SDDS=3236&lang=en&db=imdb&adm=8&dis=2
- Statistics Canada. Canadian Community Health Survey (CCHS) [Internet]. Ottawa (ON): Statistics Canada; 2009 [updated 2009 Jun 24; cited 2010 Mar 1]. Available from: http://www.statcan.gc.ca/cgi-bin/imdb/p2SV.pl?Function=getSurvey&SDDS=3226&lang=en&db=imdb&adm=8&dis=2
- Health Statistics Division, Statistics Canada. Canadian Community Health Survey, 2007-2008, Cycle 4.1 [Data files and documentation (User Guide 2007/2008 Main File)] [Internet]. Ottawa (ON): Statistics Canada; 2009 [cited 2010 Mar 1]. Available from: http://search1.odesi.ca/details/view.html?q=Canadian+Community+Health+Survey,+2007-2008,+2009+Cycle+4.1&field=&coll=all&date-gt=1871&date-lt=2011&uri=/odesi/escc_82M0013_F_2007-2008_c4.1.xml
- Elliott AM, Smith BH, Hannaford PC, Smith WC, Chambers WA. The course of chronic pain in the community: results of a 4-year follow-up study. Pain. 2002 Sept; 99(1-2):299-307.
- Magni G, Marchetti M, Moreschi C, Merskey H, Luchini SR. Chronic musculoskeletal pain and depressive symptoms in the National Health and Nutrition Examination. I. Epidemiologic follow-up study. Pain. 1993 May;53(2):163-8.
- Statistics Canada. National Population Health Survey 1994-1995 user's guide [Internet]. Ottawa (ON): Statistics Canada; 2010 [updated 2010 Jan 7; cited 2010 Mar 1]. Available from: http://www.statcan.gc.ca/dli-ild/data-donnees/ftp/nphs-ensp/nphs1994-ensp1994-eng.htm
- Statistics Canada. National Population Health Survey 1996-1997 user's guide and questionnaire [Internet]. Ottawa (ON): Statistics Canada; 2010 [updated 2010 Jan 7; cited 2010 Mar 1]. Available from: http://www.statcan.gc.ca/dli-ild/data-donnees/ftp/nphs-ensp/nphs1996-ensp1996-eng.htm
- Statistics Canada. National Population Health Survey 1998-1999 questionnaire, user's guide [Internet]. Ottawa (ON): Statistics Canada; 2010 [updated 2010 Jan 7; cited 2010 Mar 1]. Available from: http://www.statcan.gc.ca/dli-ild/data-donnees/ftp/nphs-ensp/nphs1998-ensp1998-eng.htm
- Statistics Canada. Cycle 1.1 Questionnaire, code book, user's guide [Internet]. Ottawa (ON): Statistics Canada; 2010 [updated 2010 Jan 7; cited 2010 Mar 1]. Available from: http://www.statcan.gc.ca/dli-ild/data-donnees/ftp/cchs-escc/cchs-escc1_1-eng.htm
- Statistics Canada. Cycle 2.1 questionnaire, user's guide [Internet]. Ottawa (ON): Statistics Canada; 2005 [updated 2010 Jan 7; cited 2010 Mar 1]. Available from: http://www.statcan.gc.ca/dli-ild/data-donnees/ftp/cchs-escc/cchs-escc2_1-eng.htm
- Statistics Canada. Canadian Community Health Survey (CCHS) cycle 3.1 (2005): public use microdata file (PUMF) user guide [Internet]. Ottawa (ON): Statistics Canada; 2006 [cited 2010 Mar 1]. Available from: http://www.statcan.gc.ca/dli-ild/meta/cchs-escc/cycle3-1/guide-eng.pdf
- Statistics Canada. Canadian Community Health Survey Cycle 3.1 Final Questionnaire [Internet]. 2005 [cited 2011 Apr 20]. Available from: http://www.statcan.gc.ca/imdb-bmdi/instrument/3226_Q1_V3-eng.pdf
- Statistics Canada. Canadian Community Health Survey (CCHS) - 2007 Questionnaire [Internet]. 2007 [cited 2011 Apr 20]. Available from: http://www.statcan.gc.ca/imdb-bmdi/instrument/3226_Q1_V4-eng.pdf
- SPSS Inc. IBM SPSS Bootstrapping 19: Part 1: Users Guide: Bootstrapping [Internet]. 2010 [cited 2011 April 20] Available from: http://support.spss.com/productsext/statistics/documentation/19/client/User%20Manuals/English/IBM%20SPSS%20Bootstrapping%2019.pdf
- Hardt J, Jacobsen C, Goldberg J, Nickel R, Buchwald D. Prevalence of chronic pain in a representative sample in the United States. 2008; Pain Med. 2008 Oct;9(7):803-12.
- Breivik H, Collett B, Ventafridda V, Cohen R, Gallacher D. Survey of chronic pain in Europe: prevalence, impact on daily life, and treatment. Eurp J Pain. 2006 May;10(4):287-333.
- Von Korff M, Dworkin SF, Le Resche L. Graded chronic pain status: an epidemiologic evaluation. Pain. 1990 Mar;40(3):279-91.
- Munce SE, Stewart DE. Gender differences in depression and chronic pain conditions in a national epidemiologic survey. Psychosomatics. 2007 Sep-Oct;48(5): 394-9.
- Statistics Canada. National Population Health Survey: Health Institutions Component, Longitudinal (NPHS) [Internet]. 2000 [cited 2009 Apr 27] Available from:
http://www.statcan.gc.ca/cgi-bin/imdb/p2SV.pl?Function=getSurvey&SurvId=19819&SurvVer=1&
InstaId=20083&InstaVer=2&SDDS=5003&lang=en&db=IMDB&adm=8&dis=2