
ARCHIVED - Chronic Diseases and Injuries in Canada
Volume 31, no. 4, September 2011
Chronic Diseases and Injuries in Canada
A review of screening mammography participation and utilization in Canada
G. P. Doyle, MBA (1); D. Major, PhD (2); C. Chu, MSc (3); A. Stankiewicz, MPH (4); M. L. Harrison, MSc (5); L. Pogany, MSc (4); V. M. Mai, MD (6); J. Onysko, MA (4)
https://doi.org/10.24095/hpcdp.31.4.03
This article has been peer reviewed.
Author references:
- Breast Screening Program for Newfoundland and Labrador, St. John’s, Newfoundland, Canada
- Institut national de santé publique du Québec, Québec City, Quebec, Canada
- BC Cancer Agency, Vancouver, British Columbia, Canada
- Public Health Agency of Canada, Ottawa, Ontario, Canada
- Cancer Care Manitoba, Winnipeg, Manitoba, Canada
- Cancer Care Ontario, Toronto, Ontario, Canada
Correspondence: Gregory P. Doyle, Breast Screening Program for Newfoundland and Labrador, 35 Major’s Path, Suite 102, St. John’s NL A1A 4Z9; Tel.: (709) 777-5064; Fax: (709) 777-5069; Email: gregory.doyle@easternhealth.ca
Abstract
Introduction: Participation rate is an important indicator for a screening program’s effectiveness; however, the current approach to measuring participation rate in Canada is not comparable with other countries. The objective of this study is to review the measurement of screening mammography participation in Canada, make international comparisons, and to propose alternative methods.
Methods: Canadian breast cancer screening program data for women aged 50 to 69 years screened between 2004 and 2006 were extracted from the Canadian Breast Cancer Screening Database (CBCSD). The fee-for-services (FSS) mammography data (opportunistic screening mammography) were obtained from the provincial ministries of health. Both screening mammography program participation and utilization were examined over 24 and 30 months.
Results: Canada’s screening participation rate increases from 39.4% for a 24-month cut-off to 43.6% for a 30-month cut-off. The 24-month mammography utilization rate is 63.1% in Canada, and the 30-month utilization rate is 70.4%.
Conclusion: Due to the differences in health service delivery among Canadian provinces, both programmatic participation and overall utilization of mammography at 24 months and 30 months should be monitored.
Keywords: breast, mammography, early detection of cancer, breast cancer, cancer, program participation, program utilization, screening
Introduction
Breast cancer is the second leading cause of death by cancer among Canadian women.(1) About 23 200 women were projected to be diagnosed with breast cancer in 2010, and 5300 women to die from the disease.(1) Screening for breast cancer is widely viewed as a beneficial health intervention, especially for women aged 50 to 69 years. Randomized controlled trials and meta-analyses suggest that programmatic screening reduces mortality by between 25% and 30%;(2-6) however, routine reporting has proven difficult. Reducing mortality in the population eligible for screening is directly related to the rate of participation.(7) As a result, using participation as an interim measure provides a more practical opportunity for routine reporting by programs.
No standardized measure exists for participation in screening mammography. Defining screening participation rates outside of trial settings is complicated by the types of mammography service delivery, which can be both organized breast cancer screening programs and other healthcare facilities. Organized breast cancer screening programs identify and invite eligible women and provide a screening examination (typically a bilateral 2-view screening mammogram on a biennial basis), follow-up of any abnormality, and recall after a normal or benign examination.
How participation is calculated nationally and internationally varies substantially, as do recommended screening intervals and retention. This further complicates routine reporting. Despite this, most programs consistently report on program participation; they have adopted a target of 70% participation based on assumed mortality reduction.(8)
Because of the wide variation in reporting on participation in screening mammography and the interest in determining the most appropriate method of such reporting, the Canadian Partnership Against Cancer formed a working group to (1) review the rationale for the 70% participation rate target for women aged 50 to 69 years and (2) propose alternative methods for calculating routine (biennial) mammography utilization that would more comprehensively reflect the way in which Canadian women receive screening mammography.
Methods
The working group completed a review of selected literature on participation rates in breast cancer screening programs to identify the range of definitions and calculations of participation used by programs in different countries. We selected two definitions for the calculations: programmatic participation, the proportion of women aged 50 to 69 years screened in an organized breast cancer screening program in a defined period of time among the total population of women of that age (obtained from census data); and overall utilization, the combined proportion of women aged 50 to 69 years receiving bilateral mammography (including screening mammography in organized programs, screening mammography outside of organized programs, or bilateral diagnostic mammography outside of organized programs in provinces that do not have non-program screening mammography billing code) among the total population of women aged 50 to 69 years (obtained from census data).
The Canadian Breast Cancer Screening Database (CBCSD) provided data on programmatic screening. The details of individual programs and methods of data collection for the CBCSD are described in detail elsewhere.(9) Provincial ministries of health provided data for fee-for-services (FSS) claims by physicians for mammography services (opportunistic screening mammography). Calculations were performed for the data years 2004 to 2006, the most recent available from both the CBCSD and FFS data sources. Where possible, data from organized screening and FFS were cross-referenced to eliminate duplication; only a very small number of duplicate screens were found. The analysis included data from seven provinces: British Columbia, Alberta, Saskatchewan, Manitoba, Ontario, Quebec, and Newfoundland and Labrador. Statistics Canada’s Canadian Community Health Survey (CCHS) provided self-report data on 24-month screening mammography.(9)
Two screening intervals, 24 and 30 months, were selected as defined periods for assessing programmatic participation and overall utilization of breast cancer screening programs. The 24-month interval represents a strict interpretation of screening interval recommendations and performance targets, while the 30-month interval reflects more realistic adherence to screening interval recommendations.
Results
International breast cancer screening programs show considerable differences in their organization, screening modalities, recruitment methods, and target age groups;(10-18)these are likely to affect comparison of participation (Table 1). In Canada, organized programs report upon the participation of women aged 50 to 69 years based on a denominator of first- and second-year populations averaged from census estimates (Table 2). The cumulative probability of returning to a mammography screening program (the retention rate) in Canada, for example, shows that only approximately 30% of the screening population undergo their screening mammography at the strict interval of 24 months (Figure 1).
Table 1. Overview of screening programs guidelines and calculation of participation (10-18)
| Country | Canada | Australia | New Zealand | European | United Kingdom | Hungary |
|---|---|---|---|---|---|---|
| Notes: In addition to accepting volunteers, some Canadian provinces also send letters of invitation to the target population. This differs from Australia and New Zealand, where all programs accept volunteers and send letters of invitation, and from the United Kingdom and Hungary, where only women who receive a letter of invitation are accepted. | ||||||
| Organization | Provincial | National | National | -- | National | National |
| Recruitment method | Volunteer | Volunteer/ invitation | Volunteer/ invitation | Invitation | Invitation | Invitation |
| Target age range, years | 50–69 | 50–69 | 50–69 | 50–69 | 50–70 | 45–65 |
| Participation numerator | Number of women screened in a 2-year period | Number of women screened in a 2-year period | Number of women screened in a 2-year period | Number of invited women screened | Number of invited women screened in a 12-month period | Number of invited women screened in a 2-year period |
| Participation denominator | 1st and 2nd year populations averaged from census/forecast | Average of 2-year estimated population on June 30 | Smoothed census population estimates over 2 years | Invited population | Invited population in a 12-month period | Invited population in a 2-year period |
| Target participation rate | ≥ 70% | ≥ 70% | ≥ 70% of women aged 45−69 years | Acceptable: > 70% Desirable: > 75% |
Minimum: ≥ 70% Target: ≥ 80% |
Acceptable: > 70% Desirable: > 75% |
| Province | Program start date | Target age group, years | Availability of mobile screening | CBE offered |
|---|---|---|---|---|
| Abbreviations: CBE, clinical breast examination. a Nurse or technologist provided CBE service until October 2005. b Nurse provides CBE at 52% of sites. c Nurse completes CBE. |
||||
| British Columbia | 1988 | 50–69 | Yes | No |
| Alberta | 1990 | 50–69 | Yes | No |
| Saskatchewan | 1990 | 50–69 | Yes | No |
| Manitoba | 1995 | 50–69 | Yes | Noa |
| Ontario | 1990 | 50–69 | Yes | Yesb |
| Quebec | 1998 | 50–69 | Yes | No |
| Newfoundland and Labrador | 1996 | 50–69 | No | Yesc |
Figure 1
Cumulative probability of returning for a subsequent breast cancer screen by age group, among women who participated in screening in the years 2000 and 2001
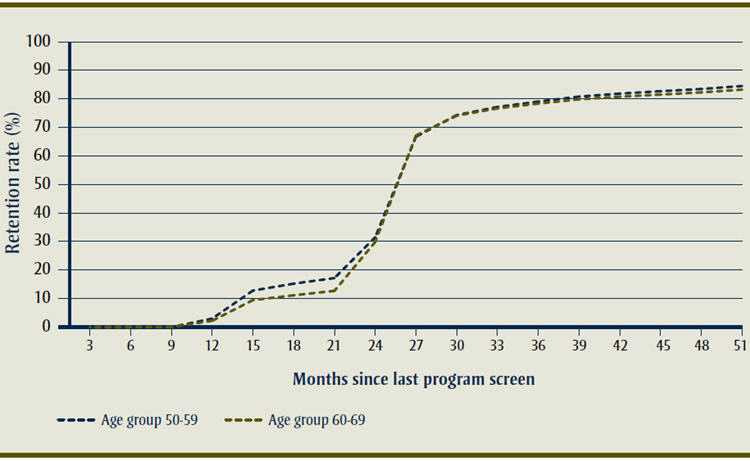
Text Equivalent of Figure 1
The cumulative probability of returning to a mammography screening program (the retention rate) in Canada, for example, shows that only approximately 30% of the screening population undergo their screening mammography at the strict interval of 24 months.
The use of a 30-month screening interval to account for the “true” screening interval overestimates rates of biennial screening mammography.
Participation in programmatic breast cancer screening was 39.4% (24-month interval) and 43.6% (30-month interval) in Canada. When utilization was calculated by incorporating FFS screening, the estimates rose to 63.1% and 70.4% respectively (Table 3). The 30-month utilization estimate is close to the 70% target set by most countries, while the 24-month utilization estimate closely approximates the CCHS self-reported screening by Canadian women. Increases in programmatic participation and overall utilization were accrued by using a 30-month period; however, these increases varied provincially between 3.3% and 15.7% (Table 3).
Table 3. Screening mammography programmatic participation and overall utilization, nationally and by province, 2004–2006Area |
Participation in program at 24 monthsa % |
Participation in program at 30 monthsb % |
Overall utilization at 24 monthsa % |
Overall utilization at 30 monthsb % |
Self-reported screening mammography 24 monthsc % (95% CI) |
|---|---|---|---|---|---|
| Abbreviations: CI, confidence interval. a 24-month period from January 1, 2005, to December 31, 2006. b 30-month period from January 1, 2004, to June 30, 2006. c 2008 Canadian Community Health Survey(9) d Provincial fee-for-service code definitions available upon request. e 24-month period from April 1, 2005, to March 31, 2007; 30-month period from April 1, 2004, to September 30, 2006. | |||||
| Canada | 39.4 | 43.6 | 63.1 | 70.4 | 62.5 (60.9–64.1) |
| British Columbiad | 51.1 | 55.1 | 60.0 | 65.4 | 60.1 (55.7–64.6) |
| Albertad | 9.1 | 10.8 | 62.8 | 70.9 | 64.0 (58.4–69.3) |
| Saskatchewand | 48.3 | 54.8 | 60.9 | 68.8 | 63.7 (58.1–69.2) |
| Manitobad,e | 52.5 | 56.5 | 63.7 | 69.4 | 56.1 (50.1–62.1) |
| Ontariod | 32.4 | 36.5 | 63.5 | 72.5 | 62.7 (59.8–65.7) |
| Quebecd | 51.6 | 56.7 | 64.6 | 70.4 | 64.3 (61.0–67.6) |
| Newfoundland and Labradord | 35.4 | 36.6 | 63.9 | 68.6 | 61.5 (55.0–68.1) |
Discussion
Accurate estimates of participation in screening mammography are essential to determine the impact of screening on mortality. Reports on participation indicators (programmatic screening, utilization and self-reports) must consider the context, the limitations in the methodology of calculation and the screening interval (24 versus 30 months), and the practices of the programs being compared.
All the methods available in the Canadian context have limitations. The current practice of reporting only programmatic screening excludes a substantial amount of screening mammography, leading to substantial underestimation of the potential mortality reduction. Estimates of self-reported mammography utilization are consistent across jurisdictions; however, they rely on survey participant recall, which is thought to result in an overestimation of desirable behaviour.(19) Mammography utilization may exaggerate the impact on mortality because FFS screening does not include features such as population-based recruitment, automated recall/reminders for subsequent screening, coordinated follow-up of abnormal screening, systematic quality assurance and routine performance evaluation. In addition, both misclassification of diagnostic mammograms as screening mammograms and double counting of women screening in both the FFS and programmatic sector can artificially elevate the utilization rate and lead to overestimating the benefit to mortality. Further, programs varied in their capacity to eliminate double counting for the utilization rate, but those that succeeded found an inconsequential amount of double counting. The 24-month self-reported and utilization rates are similar (Table 3), suggesting that both methods may be more accurate than previously reported, or at least similarly biased.
The use of a 30-month screening interval to account for the “true” screening interval overestimates rates of biennial screening mammography (Figure 1). While screening outcomes, including the abnormality recall rate and cancer detection rate, appear to hardly vary among women who return for screening by 30 months versus 24 months,(9) delaying diagnosis and treatment by as little as 3 to 6 months may be associated with worse survival.(20) However, the United Kingdom Breast Screening Frequency Trial, using indirect indicators of outcome, found a relatively small effect on breast cancer mortality when comparing annual screening to a 3-year screening interval.(21) Given the conflicting evidence, it is difficult to determine if screening programs that obtain 70% participation over 24 months will outperform, in terms of their effect on mortality, those programs that obtain the same rate of participation over a 30-month screening interval.
Of note is the low rate of programmatic screening in Alberta compared to the rest of Canada (9.1% vs. 39.4%) (Table 3). During the period under study, 2004 to 2006, the organized breast cancer screening program in Alberta included a fixed site clinic in each of two major cities and a mobile service in remote areas. Mammography services were also available through the FFS sector in the rest of the province. As a result, their mammography utilization rates were comparable to that of national rates (70.9% vs. 70.4%, respectively). A province-wide breast cancer screening program was launched in March 2008.
Ensuring that participation rates are internationally comparable is extremely difficult. An indicator must have as little bias as possible and accurately reflect practices that maximize mortality reduction. In addition, the context of program practices must always be considered when making comparisons. While most programs report on women aged 50 to 69 years, Hungary and United Kingdom use a wider age range (Table 1). Most programs rely on biennial recall, but the United Kingdom uses a 3-yearly approach. Most importantly, calculation of both the denominator and numerator varies considerably; the Canadian method results in the most conservative estimates of participation (Table 1).
Conclusion
In general, measures of overall program utilization in Canada suggest that breast cancer screening is occurring at close-to-target levels, but the impact on mortality of overall utilization cannot be assumed to be equivalent to that of programmatic screening. This is due to insufficient information concerning the quality of FFS mammography screening.
Due to the differences in provincial health care structures and service delivery, and the significant amount of opportunistic mammography that takes place in Canada, we conclude that both programmatic participation and overall utilization of mammography at 24 months and 30 months should be monitored and reported. Moreover, reporting on multiple participation indicators may facilitate the comparison of mammography usage internationally.
Acknowledgements
Funding for this research was provided by the Canadian Partnership Against Cancer.
The authors thank Dr. Laura McDougall from Alberta Health Services for her helpful discussion and insight.
References
- Canadian Cancer Society’s Steering Committee. Canadian Cancer Statistics 2010. Canadian Cancer Society. Toronto (ON): Canadian Cancer Society; 2010.
- Andersson I, Aspegren K, Janzon L, Landberg T, Lindholm K, Linell F, et al. Mammographic screening and mortality from breast cancer: the Malmo mammographic screening trial. BMJ. 1988;297:943-8.
- Alexander FE, Anderson TJ, Brown HK, Forrest AP, Hepburn W, Kirkpatrick AE, et al. 14 years of follow-up from the Edinburgh randomised trial of breast-cancer screening. Lancet. 1999;353;1903-08
- Duffy SW, Tabar L, Vitak B, Yen MF, Warwick J, Smith RA, et al. The Swedish Two-County Trial of mammographic screening: cluster randomisation and end point evaluation. Ann Oncol. 2003;14(8):1196-8.
- Shapiro S, Strax P, Venet L. Periodic breast cancer screening in reducing mortality from breast cancer. JAMA. 1971;215:1777-85.
- International Agency for Research on Cancer Screening. IARC Handbooks of Cancer Prevention, Vol.7, Breast Cancer Screening. Lyon (FR): IARC Press; 2002.
- Day NE, Williams DR, Khaw KT. Breast cancer screening programmes: the development of a monitoring and evaluation system. Br J Cancer. 1989;59(6):954-8.
- Forrest AP. Breast cancer: the decision to screen. 4th H.M. Queen Elizabeth The Queen Mother Fellowship; 1990. London (UK): Nuffield Provincial Hospitals Trust; 1990.
- Public Health Agency of Canada. Organized breast cancer screening programs in Canada: report on program performance in 2005 and 2006. Ottawa (ON): Health Canada. Forthcoming 2011.
- Evaluation Indicators Monitoring Group. Guidelines for monitoring breast screening program performance, 2nd ed. Ottawa (ON): Public Health Agency of Canada; 2007 Mar.
- BreastScreen Australia Data Dictionary Version 1 [Internet]. [place unknown]: National Quality Management Committee; 2004 [cited 2009 Mar 7]. Available at: http://www.cancerscreening.gov.au/internet/screening/publishing.nsf/Content/br-dictionary/$File/bsa-dd.pdf
- BreastScreen Aotearoa Data Management Manual Version 4.0 [Internet]. [place unknown]: National Screening Unit BreastScreen Aotearoa; 2010 Mar Available at: http://www.nsu.govt.nz/files/BSA/Data_management_manual.pdf
- Consolidated guidance on standards for the NHS Breast Screening Programme. NHSBSP Publication No 60 version 2. London (UK): NHS Cancer Screening Programmes; 2005 Apr.
- Boncz I, Sebestyen A, Dobrossy L, Pentek Z, Budai A, Kovacs A, et al. The organisation and results of first screening round of the Hungarian nationwide organized cancer screening programme. Ann Oncol. 2007;18:795-9.
- National Quality Management Committee of BreastScreen Australia. BreastScreen Australia National Accreditation Standards, Quality Improvement Program. BreastScreen Australia; Jul 2001, revised 2008 Apr.
- Breastscreen Aotearoa [Internet]. New Zealand National Health Board; 2009 [cited 2009 Mar 7]. Available from: http://www.nsu.govt.nz/Current-NSU-Programmes/559.asp
- Taylor R, Arnett K, Begg S. BreastScreen Aotearoa Independent Monitoring Report, January-June, 2007 [Internet]. Queensland (AU): School of Population Health, University of Queensland; 2007 [cited 2009 Mar 7]. Available from: http://www.nsu.govt.nz/Health-Professionals/1048.asp
- Perry N, Broeders M, De Wolf C, Tornberg S, Holland R, Von Karsa L, Puthaar E, editors. European guidelines for quality assurance in breast cancer screening and diagnosis, 4th ed. Health & Consumer Protection Directorate-General, European Communities: Brussels (LU); 2006.
- Bancej CM, Maxwell CJ, Snider J. Inconsistent self-reported mammography history: findings from the National Population Health Survey longitudinal cohort. BMC Health Serv Res. 2004;4:32.
- Richards MA, Westcombe AM, Love SB, Littlejohns P, Ramirez AJ. Influence of delay on survival in patients with breast cancer: a systematic review. Lancet. 1999;353(9159):1119-26.
- Breast Screening Frequency Trial Group. The frequency of breast cancer screening: results from the UKCCCR Randomised Trial. United Kingdom Co-ordinating Committee on Cancer Research. Eur J Cancer. 2002;38:1458-64.