Chapter 3: Cancer incidence in Canada: trends and projections (1983-2032) - HPCDP: Volume 35, Supplement 1, Spring 2015
Chapter 3: Overview of Observed and Projected Status of All Cancers
Recent changes in observed cancer incidence rates
The annual percent change in cancerspecific ASIRs in males and females in the last observed decade (1998–2007) shows varying trends by cancer site (Figures 3.1 and 3.2). Between 1998 and 2007, the overall incidence rate increased significantly in females by 0.3% per year. Statistically significant increases of 2% or more per year occurred for liver cancer in both males (3.6%) and females (2.4%), kidney cancer in males (2.6% since 2003) and thyroid in both males (6.8%) and females (6.9% since 2002). Significant annual decreases of 2% or more occurred in larynx cancer for both males (3.8%) and females (3.4%) and in stomach cancer in males (2.0%). The possible explanations for the observed trends can be found in the corresponding section of Chapter 4.
FIGURE 3.1
Annual percent changes in age-standardized incidence rates (1998–2007) for selected cancers, males, Canada
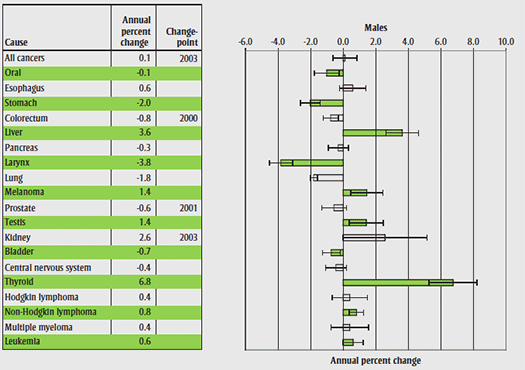
FIGURE 3.1, Text Equivalent]
The annual percent change in cancer-specific ASIRs in males in the last observed decade (1998-2007) shows varying trends by cancer site. Statistically significant increases of 2% or more per year occurred for liver cancer (3.6%), kidney cancer (2.6% since 2003) and thyroid (6.8%). Significant annual decreases of 2% or more occurred in larynx cancer (3.8%), and stomach cancer (2.0%).
Note: The error bars refer to 95% confidence intervals.
FIGURE 3.2
Annual percent changes in age-standardized incidence rates (1998–2007) for selected cancers, females, Canada

[FIGURE 3.2, Text Equivalent]
Note: The error bars refer to 95% confidence intervals.
Overall (historic and projected) trends
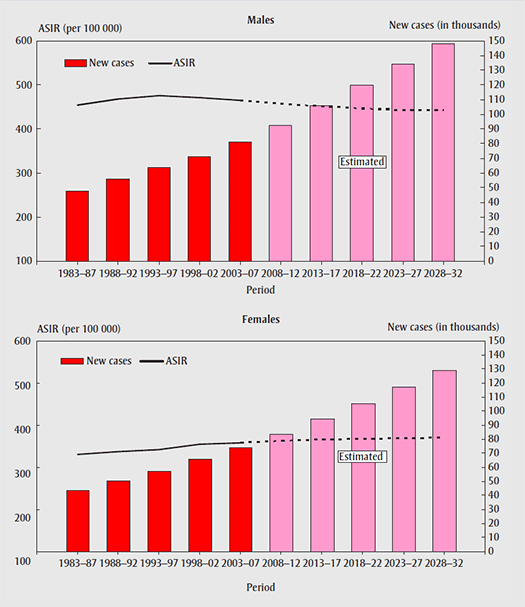
Figure 3.3 illustrates the average annual number of new cases and ASIRs for all cancers combined for 1983–2032, with projections as of the year 2008. Even though the observed ASIRs for all cancers combined stabilized, the number of new cancer cases continues to increase as the Canadian population grows and ages. The ASIRs in males decreased after increasing until 1993–1997. This pattern mirrors a similar trend in the incidence of prostate cancer, the leading cancer in males. The decrease also represents the decrease in lung cancer rates in men aged 65 or older. In females, the cancer incidence rate increased slightly over the observation horizon. The increase reflects the rise in rates in cancers of lung (in women aged 65 or older), uterus, thyroid, breast (in females aged under 45), leukemia, kidney, and melanoma.
FIGURE 3.3
Average annual new cases and age-standardized incidence rates (ASIRs) for all cancers, Canada, 1983–2032
[FIGURE 3.3, Text Equivalent]
Figure 3.3 illustrates the average annual number of new cases and ASIRs for all cancers combined for 1983-2032, with projections as of the year 2008. Even though the ASIRs have and will continue to stabilize, the number of new cancer cases continues to increase as the Canadian population grows and ages. The observed ASIRs in males decreased after increasing until 1993-1997. This pattern mirrors a similar trend in the incidence of prostate cancer, the leading cancer in males. The decrease also represents the decrease in lung cancer rates in men aged 65 or older. In females, the cancer incidence rate increased slightly over the observation horizon. The increase reflects the rise in rates in cancers of lung (in women aged 65 or older), uterus, thyroid, breast (in females aged under 45), leukemia, kidney, and melanoma.
All cancers combined excludes non-melanoma skin cancer. In Canada, non-melanoma skin cancer accounts for about 30% of all new cancer cases.
Tables 3.1 to 3.4 show historic and projected numbers of new cancer cases and ASIRs by sex, period, age group and geographical region. From 2003–2007 to 2028–2032, the ASIRs for all cancers in Canada are projected to decrease in males by 5%, from 464.8 to 443.2 per 100 000, and to increase in females by 4%, from 358.3 to 371.0 per 100 000. The annual number of cases is projected to increase by 84% (from 80 810 to 148 370) in males and by 74% (from 74 165 to 128 830) in females.
| Period | Age | New cases | |||||||||||
|---|---|---|---|---|---|---|---|---|---|---|---|---|---|
| CA | BC | AB | SK | MB | ON | QC | NB | NS | PE | NL | TC | ||
| 2003–07 | <45 | 4720 | 560 | 495 | 125 | 155 | 1950 | 1080 | 100 | 155 | 20 | 65 | 15 |
| 45–54 | 8265 | 970 | 850 | 230 | 280 | 3230 | 2000 | 225 | 285 | 40 | 140 | 20 | |
| 55–64 | 18 860 | 2280 | 1655 | 540 | 600 | 7145 | 4870 | 545 | 715 | 110 | 360 | 40 | |
| 65–74 | 24 570 | 3090 | 2090 | 840 | 825 | 9375 | 6135 | 710 | 905 | 140 | 420 | 40 | |
| 75–84 | 19 040 | 2600 | 1555 | 705 | 725 | 6985 | 4925 | 500 | 670 | 95 | 260 | 20 | |
| 85+ | 5350 | 785 | 440 | 235 | 240 | 1750 | 1470 | 155 | 195 | 30 | 55 | 5 | |
| Total | 80 810 | 10 280 | 7090 | 2675 | 2825 | 30 430 | 20 480 | 2235 | 2925 | 440 | 1295 | 140 | |
| 2008–12 | <45 | 4810 | 555 | 555 | 125 | 135 | 1940 | 1060 | 100 | 140 | 20 | 65 | 10 |
| 45–54 | 9490 | 1015 | 1015 | 255 | 280 | 3865 | 2180 | 235 | 320 | 50 | 140 | 25 | |
| 55–64 | 23 235 | 2665 | 2120 | 695 | 680 | 9090 | 5640 | 710 | 875 | 135 | 455 | 55 | |
| 65–74 | 27 390 | 3435 | 2160 | 870 | 830 | 10 455 | 6875 | 850 | 1060 | 160 | 495 | 50 | |
| 75–84 | 20 520 | 2775 | 1680 | 675 | 660 | 7435 | 5520 | 545 | 705 | 110 | 275 | 25 | |
| 85+ | 7065 | 1050 | 560 | 245 | 265 | 2385 | 2055 | 180 | 220 | 30 | 55 | 5 | |
| Total | 92 515 | 11 495 | 8085 | 2860 | 2850 | 35 170 | 23 330 | 2620 | 3320 | 510 | 1490 | 170 | |
| 2013–17 | <45 | 5085 | 590 | 590 | 120 | 130 | 2030 | 1110 | 100 | 140 | 20 | 65 | 10 |
| 45–54 | 9505 | 1000 | 1035 | 245 | 260 | 3965 | 2085 | 230 | 315 | 50 | 145 | 25 | |
| 55–64 | 26 330 | 2985 | 2610 | 795 | 750 | 10 455 | 6140 | 760 | 910 | 150 | 470 | 60 | |
| 65–74 | 33 695 | 4245 | 2810 | 1005 | 990 | 12 860 | 8175 | 1070 | 1320 | 200 | 630 | 75 | |
| 75–84 | 22 080 | 2955 | 1855 | 680 | 660 | 7910 | 5935 | 620 | 780 | 125 | 310 | 35 | |
| 85+ | 8940 | 1265 | 750 | 265 | 295 | 3080 | 2670 | 205 | 250 | 35 | 65 | 5 | |
| Total | 105 630 | 13 040 | 9645 | 3115 | 3085 | 40 300 | 26 115 | 2985 | 3715 | 580 | 1685 | 210 | |
| 2018–22 | <45 | 5420 | 650 | 605 | 125 | 130 | 2170 | 1155 | 105 | 145 | 20 | 70 | 10 |
| 45–54 | 8895 | 925 | 1015 | 220 | 235 | 3735 | 1890 | 215 | 280 | 45 | 130 | 20 | |
| 55–64 | 28 975 | 3235 | 2945 | 845 | 800 | 11 885 | 6500 | 780 | 970 | 170 | 465 | 65 | |
| 65–74 | 40 245 | 5110 | 3665 | 1220 | 1165 | 15 510 | 9295 | 1250 | 1505 | 235 | 735 | 95 | |
| 75–84 | 25 830 | 3445 | 2220 | 740 | 750 | 9150 | 6925 | 760 | 950 | 145 | 385 | 50 | |
| 85+ | 10 370 | 1450 | 915 | 285 | 305 | 3530 | 3155 | 240 | 280 | 45 | 80 | 10 | |
| Total | 119 730 | 14 810 | 11 360 | 3440 | 3385 | 45 985 | 28 915 | 3355 | 4130 | 655 | 1870 | 250 | |
| 2023–27 | <45 | 5765 | 710 | 620 | 130 | 130 | 2340 | 1190 | 110 | 150 | 20 | 70 | 10 |
| 45–54 | 9065 | 950 | 1065 | 215 | 240 | 3785 | 1940 | 215 | 275 | 40 | 125 | 20 | |
| 55–64 | 28 925 | 3245 | 2970 | 815 | 775 | 12 195 | 6210 | 750 | 950 | 170 | 460 | 60 | |
| 65–74 | 46 165 | 5815 | 4515 | 1415 | 1325 | 18 160 | 10 280 | 1350 | 1615 | 260 | 770 | 110 | |
| 75–84 | 32 640 | 4395 | 2960 | 895 | 945 | 11 625 | 8475 | 975 | 1220 | 180 | 505 | 70 | |
| 85+ | 11 725 | 1615 | 1055 | 305 | 335 | 3995 | 3570 | 280 | 330 | 50 | 95 | 10 | |
| Total | 134 285 | 16 725 | 13 185 | 3780 | 3750 | 52 105 | 31 670 | 3685 | 4545 | 725 | 2025 | 280 | |
| 2028–32 | <45 | 5990 | 745 | 620 | 135 | 125 | 2475 | 1220 | 115 | 150 | 15 | 70 | 10 |
| 45–54 | 9780 | 1070 | 1135 | 235 | 260 | 4065 | 2060 | 215 | 295 | 45 | 135 | 15 | |
| 55–64 | 27 300 | 3075 | 2930 | 750 | 715 | 11 615 | 5685 | 700 | 860 | 150 | 420 | 55 | |
| 65–74 | 51 070 | 6370 | 5090 | 1510 | 1440 | 20 765 | 10 950 | 1405 | 1745 | 295 | 780 | 115 | |
| 75–84 | 39 720 | 5365 | 3930 | 1115 | 1140 | 14 280 | 9880 | 1155 | 1415 | 215 | 600 | 90 | |
| 85+ | 14 510 | 2010 | 1335 | 350 | 400 | 4855 | 4475 | 365 | 425 | 65 | 130 | 15 | |
| Total | 148 370 | 18 635 | 15 040 | 4090 | 4085 | 58 055 | 34 275 | 3955 | 4890 | 785 | 2140 | 305 | |
|
Abbreviations: AB, Alberta; BC, British Columbia; CA, Canada; MB, Manitoba; NB, New Brunswick; NL, Newfoundland and Labrador; NS, Nova Scotia; ON, Ontario; PE, Prince Edward Island; QC, Quebec; SK, Saskatchewan; TC, All Territories (Yukon, Northwest Territories and Nunavut). Note: Totals may not add up due to rounding. |
|||||||||||||
| Period | Age | New cases | |||||||||||
|---|---|---|---|---|---|---|---|---|---|---|---|---|---|
| CA | BC | AB | SK | MB | ON | QC | NB | NS | PE | NL | TC | ||
| 2003–07 | <45 | 7940 | 895 | 820 | 190 | 240 | 3505 | 1725 | 175 | 230 | 30 | 110 | 20 |
| 45–54 | 11 490 | 1370 | 1095 | 310 | 395 | 4490 | 2950 | 280 | 345 | 45 | 185 | 30 | |
| 55–64 | 15 485 | 1870 | 1305 | 440 | 550 | 5810 | 4195 | 400 | 530 | 75 | 275 | 35 | |
| 65–74 | 16 325 | 2025 | 1350 | 515 | 570 | 6245 | 4280 | 405 | 570 | 85 | 250 | 25 | |
| 75–84 | 15 975 | 2035 | 1225 | 550 | 655 | 5960 | 4280 | 420 | 565 | 75 | 200 | 15 | |
| 85+ | 6945 | 900 | 540 | 280 | 310 | 2380 | 1990 | 190 | 265 | 35 | 55 | 5 | |
| Total | 74 165 | 9100 | 6335 | 2280 | 2715 | 28 385 | 19 425 | 1870 | 2505 | 345 | 1075 | 130 | |
| 2008–12 | <45 | 7900 | 850 | 875 | 185 | 235 | 3605 | 1630 | 165 | 195 | 25 | 105 | 20 |
| 45–54 | 12 670 | 1430 | 1245 | 325 | 400 | 5195 | 3125 | 290 | 370 | 50 | 205 | 30 | |
| 55–64 | 18 805 | 2235 | 1690 | 520 | 645 | 7140 | 5030 | 480 | 595 | 85 | 335 | 45 | |
| 65–74 | 18 915 | 2315 | 1600 | 565 | 655 | 7135 | 5075 | 485 | 640 | 95 | 330 | 35 | |
| 75–84 | 16 755 | 2025 | 1390 | 545 | 630 | 6310 | 4635 | 420 | 575 | 80 | 215 | 20 | |
| 85+ | 8885 | 1185 | 730 | 315 | 375 | 3170 | 2530 | 225 | 305 | 40 | 65 | 5 | |
| Total | 83 930 | 10 040 | 7525 | 2460 | 2945 | 32 560 | 22 020 | 2070 | 2675 | 375 | 1255 | 160 | |
| 2013–17 | <45 | 8280 | 860 | 935 | 200 | 255 | 3865 | 1670 | 170 | 190 | 30 | 100 | 20 |
| 45–54 | 12 770 | 1425 | 1290 | 290 | 385 | 5595 | 2910 | 275 | 340 | 45 | 195 | 30 | |
| 55–64 | 21 300 | 2425 | 2045 | 600 | 720 | 8270 | 5560 | 515 | 635 | 90 | 370 | 55 | |
| 65–74 | 23 685 | 2870 | 2075 | 660 | 795 | 8915 | 6405 | 625 | 785 | 115 | 445 | 50 | |
| 75–84 | 17 955 | 2150 | 1575 | 560 | 650 | 6745 | 4965 | 460 | 610 | 90 | 255 | 30 | |
| 85+ | 10 500 | 1310 | 915 | 355 | 420 | 3770 | 3125 | 260 | 345 | 50 | 85 | 5 | |
| Total | 94 495 | 11 035 | 8830 | 2660 | 3220 | 37 160 | 24 635 | 2305 | 2900 | 420 | 1450 | 195 | |
| 2018–22 | <45 | 8685 | 905 | 995 | 210 | 280 | 4130 | 1715 | 165 | 180 | 30 | 100 | 15 |
| 45–54 | 12 365 | 1370 | 1275 | 260 | 360 | 5685 | 2610 | 260 | 300 | 40 | 175 | 30 | |
| 55–64 | 23 405 | 2590 | 2300 | 635 | 760 | 9510 | 5820 | 550 | 675 | 95 | 380 | 60 | |
| 65–74 | 28 330 | 3400 | 2640 | 790 | 940 | 10 780 | 7505 | 735 | 900 | 130 | 535 | 70 | |
| 75–84 | 21 170 | 2545 | 1915 | 620 | 735 | 7820 | 5945 | 550 | 720 | 110 | 340 | 45 | |
| 85+ | 11 635 | 1415 | 1075 | 365 | 450 | 4190 | 3530 | 280 | 360 | 55 | 100 | 10 | |
| Total | 105 590 | 12 230 | 10 200 | 2875 | 3525 | 42 110 | 27 125 | 2545 | 3140 | 465 | 1630 | 235 | |
| 2023–27 | <45 | 9035 | 975 | 1025 | 220 | 295 | 4425 | 1695 | 165 | 175 | 30 | 100 | 15 |
| 45–54 | 12 750 | 1380 | 1340 | 280 | 375 | 5890 | 2665 | 265 | 305 | 45 | 160 | 30 | |
| 55–64 | 23 410 | 2625 | 2350 | 570 | 735 | 10 080 | 5360 | 525 | 635 | 90 | 360 | 60 | |
| 65–74 | 32 100 | 3775 | 3165 | 915 | 1050 | 12 430 | 8270 | 800 | 985 | 145 | 585 | 90 | |
| 75–84 | 26 800 | 3245 | 2495 | 740 | 905 | 9860 | 7535 | 715 | 910 | 135 | 455 | 65 | |
| 85+ | 13 085 | 1600 | 1270 | 400 | 480 | 4675 | 3975 | 320 | 405 | 70 | 120 | 15 | |
| Total | 117 185 | 13 600 | 11 645 | 3125 | 3845 | 47 365 | 29 500 | 2790 | 3415 | 515 | 1780 | 280 | |
| 2028–32 | <45 | 9110 | 995 | 1020 | 215 | 295 | 4580 | 1655 | 175 | 175 | 30 | 105 | 15 |
| 45–54 | 13 610 | 1505 | 1475 | 310 | 435 | 6340 | 2785 | 250 | 295 | 45 | 150 | 25 | |
| 55–64 | 22 685 | 2560 | 2310 | 520 | 695 | 10 190 | 4825 | 500 | 570 | 80 | 325 | 60 | |
| 65–74 | 35 275 | 4085 | 3550 | 970 | 1115 | 14 235 | 8655 | 855 | 1065 | 155 | 605 | 100 | |
| 75–84 | 32 250 | 3900 | 3180 | 900 | 1080 | 11 955 | 8875 | 845 | 1065 | 160 | 550 | 95 | |
| 85+ | 15 895 | 1950 | 1570 | 445 | 555 | 5590 | 4925 | 390 | 500 | 85 | 170 | 25 | |
| Total | 128 830 | 14 995 | 13 105 | 3360 | 4170 | 52 890 | 31 720 | 3015 | 3670 | 555 | 1900 | 320 | |
|
Abbreviations: AB, Alberta; BC, British Columbia; CA, Canada; MB, Manitoba; NB, New Brunswick; NL, Newfoundland and Labrador; NS, Nova Scotia; ON, Ontario; PE, Prince Edward Island; QC, Quebec; SK, Saskatchewan; TC, All Territories (Yukon, Northwest Territories and Nunavut). Note: Totals may not add up due to rounding. |
|||||||||||||
| Period | Age | ASIRs | |||||||||||
|---|---|---|---|---|---|---|---|---|---|---|---|---|---|
| CA | BC | AB | SK | MB | ON | QC | NB | NS | PE | NL | TC | ||
| 2003–07 | <45 | 46.0 | 43.1 | 43.4 | 42.8 | 42.4 | 48.3 | 45.6 | 44.4 | 54.1 | 53.3 | 40.8 | 35.0 |
| 45–54 | 331.4 | 291.0 | 330.1 | 307.3 | 316.8 | 346.2 | 327.3 | 368.3 | 381.3 | 393.1 | 319.7 | 259.3 | |
| 55–64 | 1109.9 | 975.6 | 1099.4 | 1132.0 | 1019.7 | 1133.7 | 1120.4 | 1239.1 | 1295.8 | 1369.8 | 1124.0 | 932.9 | |
| 65–74 | 2287.3 | 2035.9 | 2305.9 | 2453.0 | 2218.9 | 2302.8 | 2297.5 | 2672.0 | 2642.8 | 2782.8 | 2238.1 | 2446.9 | |
| 75–84 | 3068.1 | 2876.7 | 3046.6 | 3012.9 | 2999.1 | 2907.7 | 3404.9 | 3358.1 | 3583.7 | 3517.4 | 2724.6 | 3229.8 | |
| 85+ | 3506.6 | 3246.0 | 3394.8 | 3122.3 | 3355.0 | 3093.5 | 4643.9 | 3735.2 | 3631.1 | 3692.9 | 2367.1 | 2467.3 | |
| Total | 464.8 | 420.2 | 461.3 | 467.3 | 444.3 | 461.1 | 489.3 | 517.7 | 535.7 | 550.6 | 433.8 | 440.2 | |
| 2008–12 | <45 | 47.7 | 42.4 | 45.1 | 42.4 | 37.9 | 49.3 | 46.6 | 47.6 | 54.9 | 49.3 | 47.5 | 31.2 |
| 45–54 | 342.9 | 279.5 | 340.0 | 321.4 | 295.3 | 362.0 | 331.4 | 380.8 | 405.2 | 434.7 | 330.5 | 281.2 | |
| 55–64 | 1129.3 | 929.0 | 1062.6 | 1165.2 | 959.9 | 1190.9 | 1113.7 | 1341.0 | 1347.4 | 1419.7 | 1191.9 | 928.6 | |
| 65–74 | 2208.8 | 1946.8 | 2055.6 | 2394.1 | 2001.2 | 2254.4 | 2185.5 | 2666.1 | 2652.8 | 2729.1 | 2216.4 | 2327.6 | |
| 75–84 | 2942.7 | 2714.5 | 2860.4 | 2867.5 | 2672.3 | 2767.8 | 3280.2 | 3371.6 | 3424.2 | 3519.0 | 2613.7 | 3340.0 | |
| 85+ | 3368.6 | 3176.5 | 3220.2 | 2878.2 | 2999.6 | 2950.5 | 4469.9 | 3416.4 | 3477.7 | 3603.6 | 2139.2 | 3120.6 | |
| Total | 457.6 | 401.9 | 434.8 | 459.7 | 403.5 | 458.7 | 476.0 | 526.9 | 536.7 | 552.1 | 437.7 | 442.0 | |
| 2013–17 | <45 | 49.3 | 43.1 | 45.7 | 41.0 | 35.0 | 50.4 | 48.0 | 50.8 | 56.9 | 48.0 | 51.4 | 30.3 |
| 45–54 | 341.9 | 268.5 | 344.9 | 330.3 | 282.8 | 357.2 | 328.3 | 386.7 | 413.8 | 441.6 | 348.7 | 292.8 | |
| 55–64 | 1120.4 | 919.8 | 1076.3 | 1150.2 | 915.9 | 1183.3 | 1085.6 | 1340.3 | 1296.4 | 1458.8 | 1186.2 | 893.9 | |
| 65–74 | 2157.2 | 1898.1 | 2018.9 | 2309.2 | 1895.1 | 2203.5 | 2104.0 | 2607.6 | 2617.2 | 2651.4 | 2200.5 | 2186.3 | |
| 75–84 | 2867.6 | 2608.8 | 2824.4 | 2879.8 | 2587.1 | 2684.2 | 3159.4 | 3320.8 | 3332.2 | 3382.3 | 2515.8 | 3452.5 | |
| 85+ | 3345.1 | 3061.9 | 3272.9 | 2824.4 | 2935.6 | 2902.9 | 4447.3 | 3397.1 | 3467.1 | 3615.1 | 2135.7 | 3071.7 | |
| Total | 451.4 | 392.1 | 433.7 | 452.5 | 385.4 | 451.3 | 464.1 | 523.7 | 528.8 | 545.3 | 437.3 | 433.5 | |
| 2018–22 | <45 | 50.5 | 44.6 | 45.4 | 40.6 | 33.3 | 51.5 | 48.5 | 52.0 | 59.0 | 46.4 | 56.1 | 27.4 |
| 45–54 | 346.3 | 260.4 | 350.8 | 330.7 | 273.4 | 361.9 | 334.4 | 409.4 | 422.5 | 421.0 | 361.5 | 301.1 | |
| 55–64 | 1114.2 | 907.9 | 1083.8 | 1145.1 | 900.8 | 1176.9 | 1068.0 | 1332.7 | 1297.5 | 1502.9 | 1168.9 | 884.7 | |
| 65–74 | 2130.2 | 1870.0 | 2026.7 | 2258.2 | 1822.8 | 2190.7 | 2046.5 | 2573.5 | 2538.7 | 2609.4 | 2173.6 | 2126.1 | |
| 75–84 | 2782.1 | 2532.5 | 2759.1 | 2829.2 | 2486.9 | 2600.1 | 3020.4 | 3228.1 | 3286.9 | 3286.9 | 2500.3 | 3213.3 | |
| 85+ | 3277.6 | 2968.9 | 3268.1 | 2849.4 | 2826.1 | 2810.4 | 4351.1 | 3422.5 | 3345.9 | 3625.9 | 2135.2 | 3445.8 | |
| Total | 446.6 | 385.6 | 432.9 | 446.8 | 372.3 | 447.2 | 453.7 | 520.9 | 523.1 | 539.6 | 438.0 | 422.8 | |
| 2023–27 | <45 | 51.8 | 46.0 | 45.7 | 41.4 | 31.7 | 52.7 | 49.7 | 54.2 | 59.3 | 43.5 | 58.9 | 27.8 |
| 45–54 | 354.3 | 264.7 | 354.7 | 315.8 | 273.9 | 373.8 | 340.6 | 423.8 | 445.9 | 424.3 | 380.5 | 275.7 | |
| 55–64 | 1112.2 | 889.6 | 1094.3 | 1169.0 | 893.6 | 1173.6 | 1061.8 | 1338.3 | 1322.3 | 1510.5 | 1204.6 | 902.2 | |
| 65–74 | 2115.6 | 1862.3 | 2045.3 | 2238.9 | 1788.2 | 2190.6 | 2000.2 | 2559.6 | 2468.9 | 2653.8 | 2143.9 | 2033.8 | |
| 75–84 | 2715.7 | 2477.3 | 2707.2 | 2724.7 | 2401.9 | 2556.1 | 2910.6 | 3132.1 | 3252.1 | 3133.1 | 2448.2 | 3025.3 | |
| 85+ | 3183.1 | 2848.0 | 3199.1 | 2872.0 | 2823.0 | 2745.5 | 4177.2 | 3286.2 | 3284.9 | 3337.1 | 1982.1 | 3329.5 | |
| Total | 443.8 | 381.8 | 433.2 | 443.0 | 365.2 | 446.8 | 445.9 | 518.7 | 521.3 | 533.2 | 439.6 | 407.6 | |
| 2028–32 | <45 | 52.8 | 46.8 | 45.8 | 42.0 | 29.9 | 53.8 | 51.0 | 55.6 | 57.2 | 36.2 | 59.7 | 28.1 |
| 45–54 | 361.1 | 276.1 | 352.9 | 313.4 | 278.1 | 381.6 | 339.2 | 427.6 | 476.5 | 443.8 | 427.6 | 242.0 | |
| 55–64 | 1121.5 | 873.7 | 1106.0 | 1173.9 | 882.6 | 1186.9 | 1074.8 | 1383.0 | 1343.2 | 1459.9 | 1230.4 | 909.2 | |
| 65–74 | 2106.3 | 1845.6 | 2060.8 | 2239.0 | 1779.0 | 2184.7 | 1973.7 | 2541.9 | 2485.4 | 2730.1 | 2122.2 | 2018.7 | |
| 75–84 | 2682.2 | 2449.9 | 2725.4 | 2670.3 | 2326.4 | 2548.3 | 2832.4 | 3087.4 | 3143.8 | 3089.7 | 2426.8 | 2927.3 | |
| 85+ | 3086.7 | 2794.6 | 3120.2 | 2776.5 | 2689.4 | 2651.1 | 4018.4 | 3189.2 | 3258.1 | 3340.9 | 2043.7 | 2983.8 | |
| Total | 443.2 | 379.5 | 434.9 | 440.6 | 358.8 | 447.9 | 441.4 | 520.1 | 521.9 | 529.5 | 445.8 | 396.8 | |
|
Abbreviations: AB, Alberta; BC, British Columbia; CA, Canada; MB, Manitoba; NB, New Brunswick; NL, Newfoundland and Labrador; NS, Nova Scotia; ON, Ontario; PE, Prince Edward Island; QC, Quebec; SK, Saskatchewan; TC, All Territories (Yukon, Northwest Territories and Nunavut). |
|||||||||||||
| Period | Age | ASIRs | |||||||||||
|---|---|---|---|---|---|---|---|---|---|---|---|---|---|
| CA | BC | AB | SK | MB | ON | QC | NB | NS | PE | NL | TC | ||
| 2003–07 | <45 | 77.6 | 67.3 | 76.0 | 65.9 | 68.9 | 86.2 | 73.4 | 74.7 | 77.5 | 68.5 | 67.6 | 60.3 |
| 45–54 | 459.8 | 405.1 | 442.7 | 424.9 | 456.7 | 477.2 | 479.8 | 454.7 | 454.1 | 423.5 | 416.5 | 435.8 | |
| 55–64 | 875.8 | 779.9 | 865.6 | 901.5 | 908.0 | 876.9 | 914.4 | 886.4 | 923.9 | 902.5 | 848.4 | 1003.9 | |
| 65–74 | 1372.1 | 1283.4 | 1396.0 | 1386.5 | 1363.1 | 1362.6 | 1405.8 | 1391.2 | 1515.1 | 1583.5 | 1277.7 | 1680.4 | |
| 75–84 | 1828.8 | 1737.8 | 1805.9 | 1757.9 | 1867.6 | 1758.8 | 1971.2 | 1907.9 | 2085.6 | 1956.8 | 1569.3 | 2078.9 | |
| 85+ | 2023.8 | 1869.5 | 1978.6 | 1772.8 | 1919.8 | 1894.5 | 2453.6 | 1982.7 | 2097.8 | 1973.2 | 1081.8 | 1834.0 | |
| Total | 358.3 | 326.1 | 354.8 | 344.6 | 354.4 | 361.7 | 372.7 | 360.4 | 381.4 | 368.9 | 319.0 | 382.9 | |
| 2008–12 | <45 | 79.4 | 64.2 | 77.6 | 67.1 | 69.6 | 90.6 | 74.0 | 79.3 | 72.9 | 71.3 | 71.2 | 57.1 |
| 45–54 | 465.1 | 389.1 | 445.4 | 415.8 | 432.8 | 493.0 | 484.2 | 454.3 | 459.2 | 407.4 | 459.5 | 414.1 | |
| 55–64 | 880.0 | 747.8 | 864.4 | 869.6 | 888.1 | 889.5 | 947.0 | 877.0 | 878.7 | 830.8 | 848.1 | 886.4 | |
| 65–74 | 1397.4 | 1250.5 | 1437.2 | 1447.9 | 1444.3 | 1384.0 | 1458.9 | 1445.6 | 1470.6 | 1530.6 | 1408.4 | 1718.1 | |
| 75–84 | 1838.1 | 1668.4 | 1892.9 | 1812.9 | 1899.0 | 1781.7 | 2000.7 | 1920.2 | 2079.2 | 1980.7 | 1605.8 | 2509.1 | |
| 85+ | 2042.4 | 1937.0 | 2094.1 | 1856.0 | 1992.9 | 1924.8 | 2419.9 | 1990.6 | 2126.3 | 1846.7 | 1145.8 | 1890.5 | |
| Total | 362.7 | 315.5 | 363.2 | 348.7 | 358.0 | 370.2 | 380.7 | 367.0 | 372.0 | 358.9 | 337.0 | 386.7 | |
| 2013–17 | <45 | 81.1 | 62.3 | 78.4 | 69.9 | 71.6 | 94.5 | 74.9 | 83.0 | 72.4 | 75.3 | 74.9 | 54.4 |
| 45–54 | 476.5 | 387.4 | 464.0 | 397.7 | 428.8 | 521.5 | 482.0 | 461.4 | 447.9 | 392.3 | 458.6 | 404.5 | |
| 55–64 | 875.1 | 711.8 | 860.9 | 857.5 | 879.2 | 896.0 | 947.3 | 863.2 | 848.7 | 819.6 | 880.9 | 892.3 | |
| 65–74 | 1402.8 | 1217.3 | 1431.1 | 1435.6 | 1423.2 | 1395.4 | 1500.4 | 1446.6 | 1431.8 | 1396.2 | 1450.0 | 1556.5 | |
| 75–84 | 1862.5 | 1650.6 | 1965.0 | 1903.5 | 1963.8 | 1800.5 | 2045.9 | 1963.9 | 2042.2 | 2056.7 | 1712.4 | 2623.6 | |
| 85+ | 2059.0 | 1845.4 | 2165.1 | 1944.2 | 2011.0 | 1933.9 | 2480.6 | 2062.5 | 2253.8 | 1990.6 | 1264.3 | 2115.6 | |
| Total | 366.1 | 307.0 | 368.4 | 351.0 | 359.3 | 378.0 | 386.2 | 371.4 | 365.2 | 354.0 | 350.2 | 379.7 | |
| 2018–22 | <45 | 80.9 | 61.2 | 79.4 | 70.7 | 74.3 | 95.9 | 73.0 | 81.5 | 69.4 | 73.9 | 76.7 | 50.4 |
| 45–54 | 494.7 | 386.2 | 473.2 | 401.4 | 431.9 | 557.2 | 489.0 | 496.7 | 451.8 | 411.0 | 462.2 | 412.6 | |
| 55–64 | 883.4 | 701.1 | 866.3 | 850.7 | 865.4 | 919.4 | 947.2 | 888.2 | 850.5 | 791.0 | 899.4 | 875.5 | |
| 65–74 | 1387.1 | 1168.3 | 1409.8 | 1396.5 | 1386.3 | 1390.1 | 1512.8 | 1401.1 | 1388.5 | 1340.6 | 1447.6 | 1564.1 | |
| 75–84 | 1881.5 | 1640.5 | 2005.3 | 1960.3 | 1982.8 | 1810.6 | 2087.7 | 1984.7 | 2025.1 | 2089.3 | 1827.0 | 2560.5 | |
| 85+ | 2061.9 | 1821.2 | 2209.9 | 1961.0 | 2090.4 | 1938.0 | 2500.3 | 2084.3 | 2196.0 | 1982.0 | 1337.4 | 2302.1 | |
| Total | 368.3 | 301.3 | 370.9 | 350.8 | 359.3 | 384.9 | 388.2 | 374.2 | 359.4 | 349.9 | 358.0 | 376.5 | |
| 2023–27 | <45 | 80.5 | 61.5 | 78.7 | 71.2 | 74.5 | 96.9 | 71.1 | 82.8 | 64.9 | 73.3 | 80.4 | 49.2 |
| 45–54 | 503.5 | 379.6 | 478.4 | 419.1 | 442.0 | 573.2 | 491.3 | 514.4 | 478.8 | 448.5 | 459.7 | 411.6 | |
| 55–64 | 897.5 | 708.1 | 889.7 | 817.0 | 854.4 | 957.5 | 934.6 | 896.3 | 846.0 | 780.0 | 880.7 | 890.9 | |
| 65–74 | 1376.2 | 1134.0 | 1394.3 | 1381.2 | 1371.9 | 1392.5 | 1501.1 | 1383.3 | 1365.3 | 1332.4 | 1472.4 | 1618.6 | |
| 75–84 | 1878.9 | 1616.7 | 1979.2 | 1938.3 | 1946.1 | 1812.1 | 2126.5 | 1977.2 | 1997.4 | 1923.5 | 1831.2 | 2407.2 | |
| 85+ | 2092.4 | 1833.8 | 2294.3 | 2104.9 | 2144.1 | 1950.6 | 2550.1 | 2135.5 | 2204.3 | 2148.6 | 1405.5 | 2445.5 | |
| Total | 369.7 | 298.3 | 371.9 | 349.8 | 357.8 | 391.0 | 387.1 | 376.8 | 356.4 | 347.8 | 361.2 | 376.6 | |
| 2028–32 | <45 | 79.3 | 60.6 | 78.3 | 69.7 | 71.4 | 96.4 | 69.3 | 86.6 | 64.9 | 72.6 | 84.4 | 48.0 |
| 45–54 | 504.3 | 382.7 | 485.0 | 429.0 | 478.0 | 582.6 | 477.6 | 485.1 | 451.0 | 444.3 | 452.0 | 390.9 | |
| 55–64 | 924.9 | 712.0 | 903.0 | 820.6 | 859.0 | 1011.6 | 940.4 | 950.5 | 855.6 | 814.0 | 876.3 | 921.1 | |
| 65–74 | 1385.3 | 1127.1 | 1399.5 | 1365.6 | 1345.9 | 1421.1 | 1493.7 | 1415.0 | 1380.4 | 1308.4 | 1483.6 | 1620.8 | |
| 75–84 | 1852.7 | 1562.0 | 1946.5 | 1884.9 | 1896.6 | 1797.0 | 2129.0 | 1906.7 | 1951.7 | 1895.8 | 1819.4 | 2483.2 | |
| 85+ | 2099.2 | 1825.4 | 2300.0 | 2107.2 | 2136.8 | 1948.8 | 2582.1 | 2131.0 | 2190.7 | 2121.5 | 1498.1 | 2307.0 | |
| Total | 371.0 | 295.8 | 372.7 | 347.2 | 356.3 | 397.6 | 384.8 | 380.5 | 353.5 | 346.9 | 364.1 | 377.6 | |
|
Abbreviations: AB, Alberta; BC, British Columbia; CA, Canada; MB, Manitoba; NB, New Brunswick; NL, Newfoundland and Labrador; NS, Nova Scotia; ON, Ontario; PE, Prince Edward Island; QC, Quebec; SK, Saskatchewan; TC, All Territories (Yukon, Northwest Territories and Nunavut). |
|||||||||||||
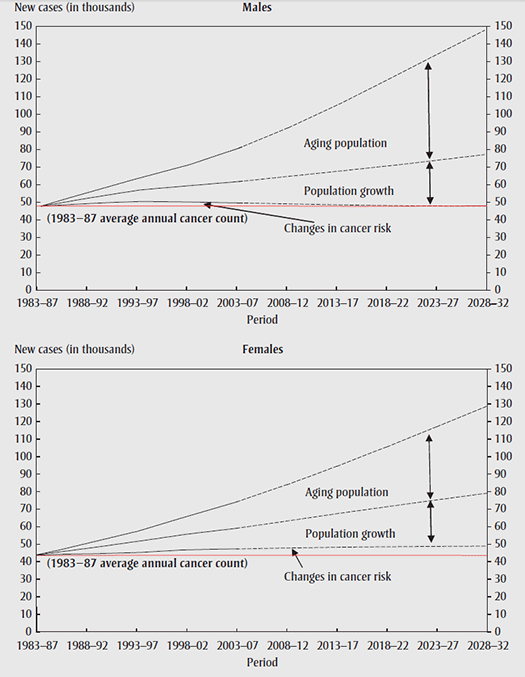
Figure 3.4, presenting the determinants of increases in the total average annual numbers of cancer incidence cases (see Chapter 2 for definitions of the series), shows that the observed and projected increase in the number of cancer cases mainly results from the aging of the population and, to a lesser extent, population growth. Changes in the risk of cancer have been contributing marginally to the increase in new cases, especially in males. In 2028–2032, the percentages of the total changes due to aging, population increase and cancer risk are predicted to be 70.9%, 29.1% and 0.1% respectively in males, and 58.4%, 35.5% and 6.1% in females. In addition, the percentages of the total changes due to change of age distribution increase with time, from 41.5% in 1988– 1992 to 70.9% in 2028–2032 in males and from 42.0% to 58.4% in females. The percentages due to change of population size generally decrease over the same period, from 39.8% to 29.1% in males and from 46.8% to 35.5% in females. The percentages due to change of cancer risk decrease in males from 18.7% to 0.1% over the study period, whereas the percentages in females increased from 11.2% in 1988–1992 to 14.1% in 1998–2002 (in part because of increased mammography screening) and decrease thereafter to 6.1% in 2028–2032.
FIGURE 3.4
Trends in average annual new cases for all cancers and ages, attributed to changes in cancer risk, population growth, and aging population, Canada, 1983–2032
[FIGURE 3.4, Text Equivalent]
Figure 3.4, presenting the determinants of increases in the total average annual numbers of cancer incidence cases, shows that the observed and projected increase in the number of cancer cases mainly results from the aging of the population and, to a lesser extent, the population growth. Changes in the risk of cancer will constitute a relatively small component of the projected increase in new cases among females, and will cause a relatively small decrease in new cases among males, although the total male cases will increase.
Trends by age
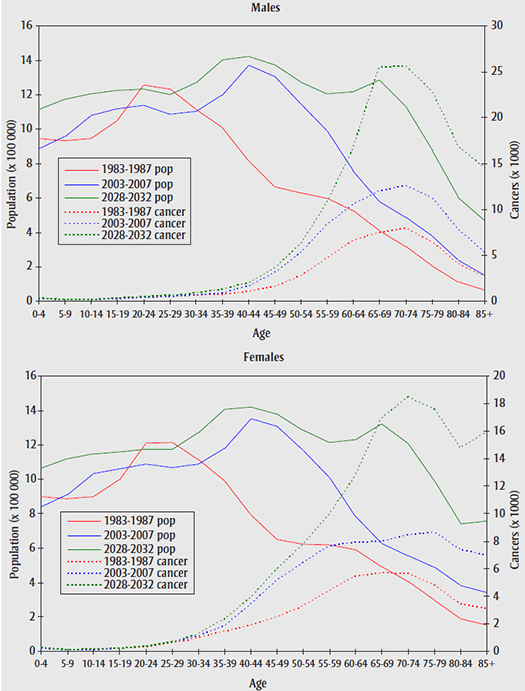
Figure 3.5 shows similar patterns of cancer occurrence and population distribution in males and females. The figure shows the increase in percentage of the population at older ages along with the corresponding increase in the number of expected cancer cases. Cancer cases increase with age until the peak in the 70–74 age group in both sexes, and illustrate approximately bell shaped symmetric distributions about the peak in the 50-or-older age groups.
FIGURE 3.5
Historic and projectedFigure 3.5 - Footnote a growth in average annual population (pop) and in average annual incidence cases of all cancers in Canada by age, 1983–2032
[FIGURE 3.5, Text Equivalent]
Figure 3.5 shows similar patterns of cancer occurrence and population distribution in males and females. Cancer cases increase with age until the peak in the 70-74 age group in both sexes, and illustrate approximately bell-shaped symmetric distributions about the peak in the 50-or-older age groups.
The figure shows the increase in percentage of the population at older ages along with the corresponding increase in the number of expected cancer cases. Even though incidence rates are projected to increase for females, and decrease for males, because the growth in population in males age 65 or older is expected to be greater than that in females, the projected number of cases will go up faster for males than for females.
- Footnote a
- aCases and populations in the 2028–2032 period are projected.
Trends by sex
Figure 3.6 compares the ASIRs for all cancers between sexes by 10-year age group from 1983 to 2032. Cancer is more common in males than in females except in those aged under 55. Breast cancer is the most common cancer in females under 55, accounting for 30% to 40% of cases in this age range in 2003–2007 (see Figure 3.9). Thyroid and cervical cancer also account for the higher cancer incidence in younger females. The overall cancer incidence rate in men aged 65 or older has been falling. The decrease in lung cancer incidence rates in males aged 65 or older as a result of decrease in tobacco useEndnote 36, Endnote 42, Endnote 43 and the decrease in prostate cancer rates in people aged 75 or older have together contributed to the overall decrease in this age range, as these two cancers account for 42% of all new cancer cases in Canadian men in 2003–2007. In women aged 65 or older, the relatively stable rate is the result of an increase primarily of lung cancer incidence offset by decreases in incidence for the other cancer sites.
FIGURE 3.6
Age-standardized incidence rates (ASIRs) for all cancers by age group, Canada, 1983–2032 (red lines denote males, blue lines denote females)
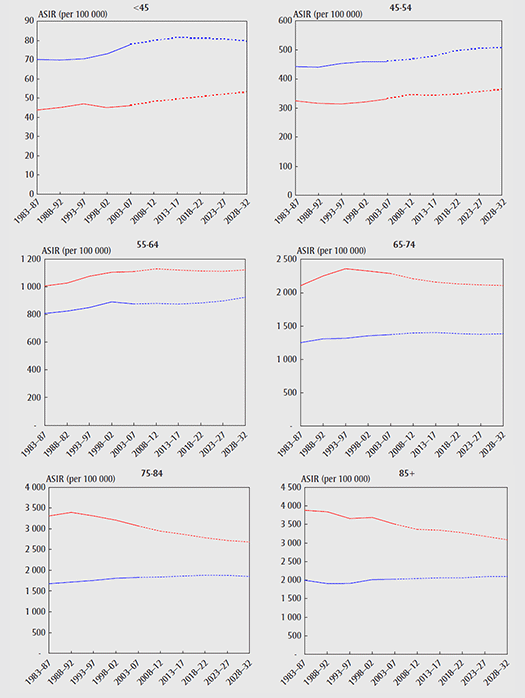
[FIGURE 3.6, Text Equivalent]
Figure 3.6 compares the ASIRs for all cancers between sexes by 10-year age group from 1983 to 2032. Cancer is more common in males than in females except in those aged under 55. The overall cancer incidence rate in men aged 65 or older has been falling. In women aged 65 or older, the relatively stable rate is the result of an increase primarily of lung cancer incidence offset by decreases in incidence for the other cancer sites.
Trends by geographical region
Figure 3.7 shows historic and estimated ASIRs for all cancers combined by sex and region from 1983 to 2032. In males, the ASIRs for all cancers combined are projected to continue to be highest in the Atlantic region and lowest in British Columbia. Male incidence rates in Quebec, Ontario, the Prairies and British Columbia are projected to decrease and then stabilize, while rates in the Atlantic region will be relatively stable. In females, Ontario is predicted to surpass Quebec and experience the highest rates in 15 years (i.e. after 2018–2022), while British Columbia will continue to have the lowest incidence. Female incidence rates are predicted to increase 10%, 3% and 1% in Ontario, Quebec and the Atlantic region, respectively, and decrease 9% and 7% in British Columbia and the Prairies by 2028–2032. This follows an increasing trend in the former regions prior to 2008 and a decreasing trend in the latter regions starting in 1998–2002. The overall differences in cancer incidence across the country are smaller in females, ranging from 7.1 to 101.8 per 100 000 versus 45.9 to 134.6 per 100 000 in males over the observation and projection periods.
FIGURE 3.7
Age-Standardized Incidence Rates (ASIRs) by region, all cancers, 1983–2032
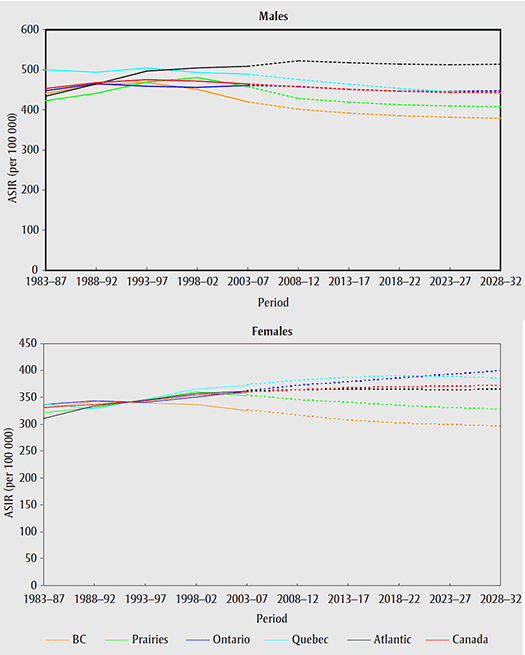
[FIGURE 3.7, Text Equivalent]
Figure 3.7 shows historic and estimated ASIRs for all cancers combined by sex and region from 1983 to 2032, with projections as of the year 2008. In males, the ASIRs are projected to continue to be highest in the Atlantic region and lowest in British Columbia. Male incidence rates in Quebec, Ontario, the Prairies and British Columbia are projected to decrease and then stabilize, while rates in the Atlantic region will be relatively stable. In females, Ontario is predicted to surpass Quebec and experience the highest rates in 15 years, while British Columbia will continue to have the lowest incidence. Female incidence rates are predicted to increase 10%, 3% and 1% in Ontario, Quebec and the Atlantic region, respectively, and decrease 9% and 7% in British Columbia and the Prairies by 2028-2032.
Observed most common cancers by sex and age
Figures 3.8 and 3.9 show the most common newly diagnosed cancers by sex and age group for 1983–1987 and 2003–2007. Overall, 52% of new cases in the last observation period (2003–2007) were in males and 48% in females. For males in each period, prostate, lung and colorectum were among the most frequently diagnosed cancer sites, together accounting for just over half the cases. In the last period the incidence of prostate cancer had replaced lung cancer in first place, followed by cancers of the colorectum and bladder. These cancers were similarly distributed for males within the various age groups, with some variation in proportions and ranking. The only exception was the youngest age group (<45 years), in which testis cancer was the most common newly diagnosed cancer. The incidence of testis cancer increased over the 2 periods of study. Other common cancers in the youngest males included non-Hodgkin lymphoma (NHL), leukemia and cancer of the central nervous system (CNS). Prostate cancer cases in men aged 45 to 74 increased markedly and occurred with the highest frequency in the most recent period, as a prevalent pool of undiagnosed cancers were detected by prostate-specific antigen (PSA) screening.Endnote 36
FIGURE 3.8
Most common newly diagnosed cancers in Canada, 1983–1987
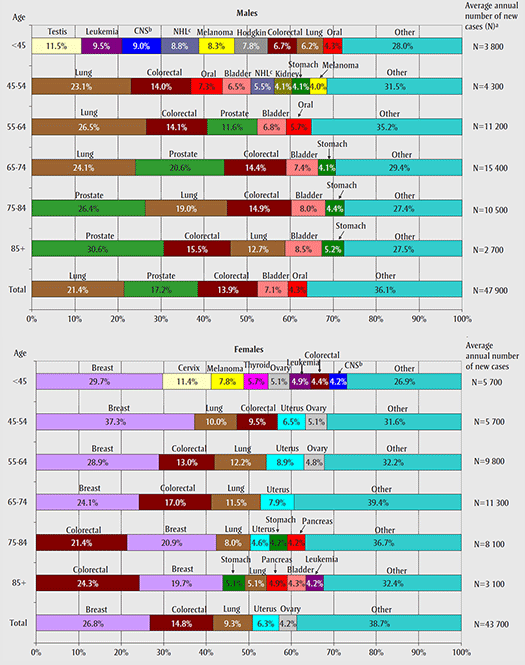
[FIGURE 3.8, Text Equivalent]
For males, lung, prostate, and colorectum were among the most frequently diagnosed cancer sites, together accounting for just over half the cases. The cancers were similarly distributed for males within each age group of 55 or older, with some variation in proportions and ranking. The only exception was the youngest age group (<45 years), in which testis cancer was the most common newly diagnosed cancer. Breast cancer dominated cancer incidence in females, representing 27% of all diagnoses, followed by colorectal and lung cancers. The top 3 cancer diagnoses for females within each age group of 45 or older were these same 3, but with changes in proportions and ranking. For the youngest females (<45 years), the most common newly diagnosed cancer was breast cancer, with 30% of new cases. The other common cancers in this age group included cervical cancer, melanoma, and thyroid cancer.
- Total of rounded numbers may not equal rounded total number;
- CNS refers to central nervous system cancer;
- NHL refers to non-Hodgkin lymphoma.
FIGURE 3.9
Most common newly diagnosed cancers in Canada, 2003–2007
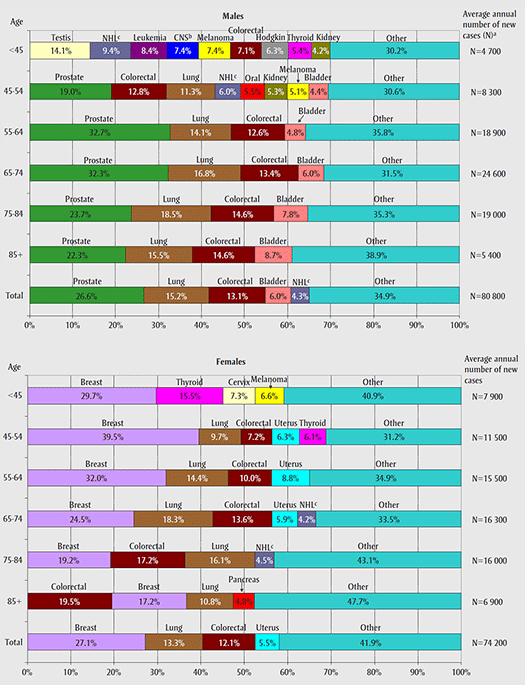
[FIGURE 3.9, Text Equivalent]
Overall, 52% of new cases were in males and 48% in females. For males, prostate, lung and colorectum were among the most frequently diagnosed cancer sites, together accounting for just over half the cases. The top 3 cancer diagnoses for males within each age group of 45 or older were these same 3, but with some variation in proportions and ranking. The only exception was the youngest age group (<45 years), in which testis cancer was the most common cancer. Other common cancers in the youngest males included non-Hodgkin lymphoma, leukemia and cancer of the central nervous system. Breast cancer dominated cancer incidence in females, representing 27% of all diagnoses, followed by lung and colorectal cancers. The top 3 cancer diagnoses for females within each age group of 45 or older were these same 3, but with changes in proportions and ranking. For the youngest females (<45 years), the most common cancer was breast cancer, with 30% of new cases. The other common cancers in this age group included thyroid, cervical cancers and melanoma.
- Total of rounded numbers may not equal rounded total number;
- CNS refers to central nervous system cancer;
- NHL refers to non-Hodgkin lymphoma.
Breast cancer dominated cancer incidence in females, representing the same proportion of 27% of all diagnoses in the 2 periods studied, followed by lung and colorectal cancers (which had switched places between 1983–1987 and 2003–2007). The top 3 cancer diagnoses for females within each age group of 45 or older were these same 3, but with slight variations in rank. For the youngest females (<45 years), the most common newly diagnosed cancer was breast cancer, with 30% of new cases. The other common cancers in this age group included thyroid, cervical cancers and melanoma.
The most noticeable difference between males and females under 45 was the much higher proportion of thyroid cancer incidence in females. The most dramatic changes in the incidence proportions of different types of cancer as a function of age (<45 and 45+) occurred with melanoma, leukemia, CNS tumours, NHL, thyroid and genital tract malignancies.
The incidence proportions (by 10-year age group) of lung cancer in males aged 45 to 74 decreased by 7% to 12% between 1983–1987 and 2003–2007, whereas the incidence proportions of prostate cancer increased more pronouncedly (10%–20%) over the 2 periods for the same age groups. The incidence share attributed to NHL also registered some increase in the 2 youngest age groups, while the proportion of stomach cancer incidence decreased in each age group.
The increase of 6% to 8% between the study periods in the incidence proportion of lung cancer in women 65 or older is notable. A similar trend was observed in European countries.Endnote 4 The proportional increase in lung cancer incidence in females of all ages was 4% from 1983–1987 to 2003–2007. The incidence percentage also increased notably for NHL in women aged 65 to 84 and for thyroid cancer in those under 55. The proportion of breast cancer incidence increased by 2% to 3% in women aged between 45 and 64. This increased share for breast cancer may be partly attributable to the impact of early detection with the increased uptake of mammography screening. There was a marked reduction in the incidence proportion for cervical cancer in females aged under 45 as well as noteworthy reductions in the incidence proportions for stomach cancer and colorectal cancer in all female age groups. Many more cervical cancers are prevented by screening each year.
Projected most common cancers by sex and age
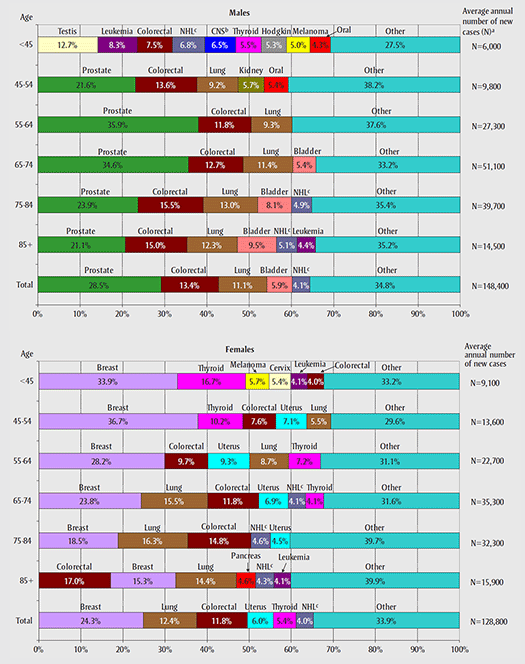
As the projected change in cancer incidence is attributable primarily to demographic factors, the relative frequencies of major cancers are not expected to change significantly. Figure 3.10 shows the cancer types that are projected to be newly diagnosed with the greatest frequency in 2028–2032 by sex and age group. By 2028–2032, colorectal cancer is projected to have overtaken lung cancer as the second most frequently diagnosed cancer in males, even though colorectal cancer will maintain a similar percentage of the total cancer cases in males as during 2003–2007. This change in ranking is the result of a decrease of 27% in the incidence of lung cancer as a proportion of all cancers, reflecting the historical reduction in smoking prevalence after accounting for a lag period.Endnote 42, Endnote 43, Endnote 44, bladder (6%) and NHL (4%). The age-specific analysis indicates that, between 2003–2007 and 2028–2032, the incidence of lung cancer in males (as a proportion of total cancer cases) will decrease by 19%, 34%, 32%, 30%and 21% for each of the 10-year age groups from 45 to 85 and over, respectively. Another notable change in the incidence frequency will be the 32% decrease in the melanoma incidence proportion in the youngest males (<45 years). Cancers of the prostate, colorectum and lung are projected to be the top 3 most common types, in that order, within each age group from 45 years and older.
FIGURE 3.10
Projected most common newly diagnosed cancers in Canada, 2028–2032
[FIGURE 3.10, Text Equivalent]
Figure 3.10 shows the cancer types that are projected to be newly diagnosed with the greatest frequency in 2028-2032 by sex and age group. In males, the most common cancers in 2028-2032 are projected to be prostate cancer (28%), colorectal (13%), lung (11%), bladder (6%) and NHL (4%). Cancers of the prostate, colorectum and lung are projected to be the top 3 most common types, in that order, within each age group from 45 years and older. For females, the most commonly diagnosed cancers in 2028-2032 are projected to be breast cancer (24%), lung cancer (12%), colorectal cancer (12%), uterine cancer (6%), thyroid cancer (5%) and NHL (4%). For the youngest females (<45 years), the most common newly diagnosed cancers will be breast, thyroid and cervical cancers and melanoma.
- Total of rounded numbers may not equal rounded total number;
- CNS refers to central nervous system cancer;
- NHL refers to non-Hodgkin lymphoma.
For females, the top 4 most common incident cancers are expected to remain the same as in the last observation period (2003–2007). However, thyroid cancer will outrank NHL as the fifth most common cancer. Specifically, the most commonly diagnosed cancers in females in 2028–2032 are projected to be breast cancer (24%), lung cancer (12%), colorectal cancer (12%), uterine cancer (6%), thyroid cancer (5%) and NHL (4%). The overall increase in thyroid cancer will be mainly from the proportional increases of 67% in women aged 45 to 54, 140%in those aged 55 to 64, and 105% in those aged 65 to 74. The 26% predicted reduction in the incidence proportion for cervical cancer in females under 45 will underscore the further success of prevention and screening programs.Endnote 45, Endnote 46 Compared with the 2003–2007 age-specific results, the projected most common incident cancers in females will be the same within each 10-year age group, but with changes in ranking order for the under-65 and 75–84 age groups. The cancers in the ‘Other’ category, together representing just over one-third of all new cancer cases, will be examined in Chapter 4.