
Status report – Geographic retail food environment measures for use in public health
Health Promotion and Chronic Disease Prevention in Canada
Ahalya Mahendra, MHSc Endnote 1; Jane Y. Polsky, PhD Endnote 2; Éric Robitaille, PhD Endnote 3; Marc Lefebvre, MA Endnote 4; Tina McBrien, MScCH, Endnote 5; Leia M. Minaker, PhD Endnote 6
https://doi.org/10.24095/hpcdp.37.10.06
Correspondence: Ahalya Mahendra, Public Health Agency of Canada, 180 Queen Street West, 11th floor, Toronto, ON M5V 3L7; Tel: 416-954-5036; Fax: 416-973-0009; Email: ahalya.mahendra@phac-aspc.gc.ca
Abstract
The Association of Public Health Epidemiologists in Ontario (APHEO) Core Indicators Work Group standardizes definitions and calculation methods for over 120 public health indicators to enhance accurate and standardized community health status reporting across public health units in Ontario. The Built Environment Subgroup is a multi-disciplinary group made up of planners, researchers, policy analysts, registered dietitians, geographic information systems (GIS) analysts and epidemiologists. The Subgroup selected and operationalized a suite of objective, standardized indicators intended to help public health units and regional health authorities assess their community retail food environments. The Subgroup proposed three indicators that use readily available data sources and GIS tools to characterize geographic access to various types of retail food outlets within neighbourhoods in urban settings. This article provides a status report on the development of these food environment indicators.
Keywords: measurement, food environment, urban environments, food retail, built environment
Highlights
- Environmental factors (such as the unhealthy food retail that is easily accessible throughout communities) are gaining recognition as important determinants of food choice and diet-related health outcomes such as obesity.
- There is a lack of consistency in food environment measures, which is problematic for the many jurisdictions across Canada interested in implementing policies to improve the food environment.
- This paper provides a status report on recent work done to develop a set of standardized, objective indicators (i.e. measures) to aid public health units and regional health authorities assess their community food environments within urban settings.
- Three indicators were selected to assess different dimensions of the community food environment: (1) intensity (i.e. density) of food outlets; (2) the relative density of less healthy food outlets; and (3) proximity of the population, living in specific geographic areas, to food outlets.
Introduction
Poor diet and excess body weight account for a significant share of disease burden in Canada and are among today’s most pressing public health challenges.Footnote 1,Footnote 2,Footnote 3,Footnote 4 The vast majority of Canadians do not consume a healthy dietFootnote 5 and the prevalence of obesity has tripled over the past three decades.Footnote 6 In 2011 to 2012, one in four or 6.3 million Canadians had obesity,Footnote 7 and in 2012 to 2013, 62% of Canadian adults were overweight or had obesity based on measured height and weight data.Footnote 8 Dietary patterns and body weight are complex issues influenced by biological, behavioural and contextual factors.Footnote 9,Footnote 10
The food environment is gaining recognition as a major determinant of food choices and diet-related outcomes such as obesity.Footnote 10,Footnote 11 Thus, a promising approach to improving population-level dietary patterns and associated health outcomes is to intervene in the environments in which food purchasing and consumption decisions are made.Footnote 12,Footnote 13,Footnote 14,Footnote 15,Footnote 16
Food environment researchers acknowledge the complex psychosocial and environmental factors influencing dietary habits, and have investigated various aspects of the food environment in relation to food purchasing and consumption behaviours, and related health outcomes.Footnote 17,Footnote 18,Footnote 19,Footnote 20,Footnote 21 In Glanz and colleagues’ foundational paper on healthy nutrition environments,Footnote 19 the food environment is conceptualized to consist of multiple dimensions, including the media environment, organizational environments (e.g. schools and workplaces), the community environment (i.e. type and location of stores and restaurants in neighbourhoods) and the consumer environment (i.e. availability, price and promotion of foods in stores and restaurants). Assessment of and interventions within the organizational food environment has been the focus of much research to date.Footnote 22,Footnote 23,Footnote 24 The body of research on community and consumer environments has also grown considerably over the past decade, employing hundreds of different food environment measures.Footnote 25 The use of inconsistent and diverse food environment measures has been regularly identified as a key limitation in this field of research.Footnote 17,Footnote 18,Footnote 20 Measures of the consumer environment tend to be resource-intensive to implement (e.g. inventory-type measures to assess the availability and pricing of specific foods and beverages or the shelf space dedicated to fruits and vegetables). Therefore, the current report focusses on describing methods for the consistent assessment of community food environments across Ontario health units, using standardized measures that are feasible to implement.
Despite the growing interest over the past decade in the health impacts of food environments, the overall pattern of findings remains inconsistent.Footnote 17,Footnote 18,Footnote 20 One reason for this may be the hundreds of different measures used to assess the food environment,Footnote 18,Footnote 20,Footnote 25,Footnote 26,Footnote 27 which challenge researchers’ ability to compare results of different studies across populations, social and economic contexts, geographic regions and trends over time.Footnote 17,Footnote 18,Footnote 27,Footnote 28,Footnote 29 This lack of consistency in food environment measures is also problematic for the many jurisdictions across Canada interested in implementing policies to improve the food environment, but challenged by a lack of guidance on how best to assess their local food environments.Footnote 30
This paper provides a status report on recent work done by the Association of Public Health Epidemiologists in Ontario (APHEO) to develop a set of standardized, objective indicators (i.e. measures) to aid public health units and health authorities in assessing their community food environments within urban settings. These indicators use readily available datasets and geographic information systems (GIS) methodology to characterize geographic access to various types of retail food outlets within neighbourhoods in urban settings.
APHEO Built Environment Subgroup
The Built Environment SubgroupFootnote * of the APHEO Core Indicators Work Group recognized the need of public health practitioners to assess their local food environments and identified the lack of consistent assessment tools as one of the largest practice gaps.
Indicator selection and adaptation
A nonsystematic scoping review of the literature was conducted for the Subgroup in 2014. PubMed, Web of Science and Scopus were searched for peer-reviewed articles published in English at any time up to and including May 2014. We used a variety of search terms including “food/nutrition environment” and “retail food access” to identify studies that reported quantitative findings on some aspect of the retail food environment in relation to dietary or weight-related outcomes. Reviews, conceptual papers and commentaries were also included, as were studies of the school food environment. The quality of studies and the psychometric properties of food environment measures in the reviewed studies were not assessed. As selection and adaptation of the indicators unfolded, key empirical and review papers published after May 2014 were also reviewed by the Subgroup.
We reviewed article titles and abstracts, and selected 190 articles from the search results. Consistent with a number of previous systematic reviews of food environment studies,Footnote 17,Footnote 18,Footnote 20,Footnote 31,Footnote 32 our literature scan found that of the different dimensions of the food environment,Footnote 19 the community food environment (i.e. geographic access to local retail food outlets) has been studied most extensively, potentially due to the ease of obtaining the required retail food data and the growing availability of GIS-based tools.Footnote 31,Footnote 32 Given that the availability of reliable data and GIS tools are critical to public health for monitoring, surveillance and awareness building, objective measures of geographic access to food retail within communities were selected as the primary area of focus for our indicator selection.
Similar to findings from previous systematic reviews, we found that objective measures of geographic access to local stores and restaurants are commonly classified into three types of measures: density, proximity and variety.Footnote 17,Footnote 18,Footnote 20,Footnote 27,Footnote 31 Density measures typically assess the concentration of outlets (i.e. number) per neighbourhood population or geographic area. Proximity is most commonly measured as the distance between a location (e.g. residential area or school) and the nearest outlet of a particular type (e.g. grocery or convenience store). Finally, variety measures attempt to reflect the relative mix of various types of outlets within a particular area. Such measures have been used in a number of recent investigations of the local food environment,Footnote 33,Footnote 34,Footnote 35,Footnote 36 and can be used in conjunction with other community food environment measures (such as in-store assessments) or layered with demographic information to provide a comprehensive understanding of the retail food environment at varying geographic scales (e.g. at the neighbourhood, municipal or regional levels).
Following our review of the existing literature, we chose three indicators reflecting different dimensions of the community food environment: (1) intensity (i.e. density) of food outlets; (2) the relative density of less healthy food outlets; and (3) proximity to food outlets. These indicators reflect the most commonly studied objective aspects of geographic food access in communities, and can be readily created in Ontario using a health unit’s existing food premise inspection database, standard geographic units from the Canadian census (or custom geographic units, if available), and the Ontario Road Network (or another road network file) in a GIS environment. All indicators measure the food environment within 1000 m (approximately a 10- to 15-minute walk) from residential areas, a distance that has been commonly usedFootnote 37,Footnote 38,Footnote 39 in previous studies to represent a neighbourhood environment easily accessible by walking.Footnote 34,Footnote 35,Footnote 40
Indicator definitions
1. Density: population-weighted average number of food outlets of a given category within 1000 mFootnote † of dissemination block (DB) centroids per dissemination area (DA)Footnote ‡ (or another geographic area of interest, such as the household vicinity).
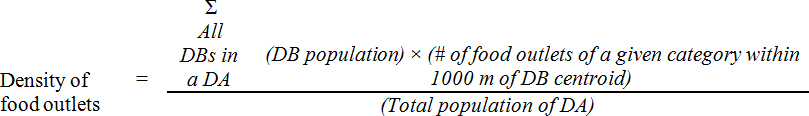
Figure 1 - Text Description
The density of food outlets is equal to sum, for all dissemination blocks in a dissemination area, of: the population of the dissemination block multiplied by the number of food outlets of a given category within 1000 m of the dissemination block centroid; this sum divided by the total population of the dissemination area.
2. Relative density (also known as the Modified Retail Food Environment Index [mRFEI]): ratio of unhealthy food retailers to both healthy and unhealthy food retailers within 1000 m of DBs per DA (or another, larger geographic area of interest, such as census tracts, administrative division or neighbourhood).
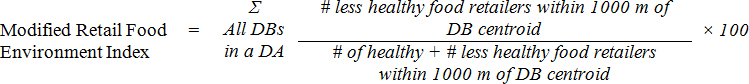
Figure 2 - Text Description
The relative density, or Modified Retail Food Environment Index, is equal to the sum, for all dissemination blocks in a dissemination area, of the number of less healthy food retailers within 1000 m of a dissemination block centroid, divided by the of healthy AND the number of less healthy food retailers within 1000 m of a dissemination block centroid; this total is then multiplied by 100.
3. Proximity: Population-weighted mean network distance (metres) between dissemination block (DB) centroids and nearest food outlets of a given category per dissemination area (DA) (or geographic unit of interest).
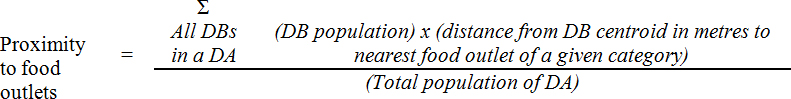
Figure 3 - Text Description
The proximity to food outlets is equal to the sum, for all dissemination blocks in a dissemination area, of: the population of the dissemination block multiplied by the distance from the dissemination block centroid (in metres) to the nearest food outlet of a given category; this sum divided by the total population of the dissemination area.
Classification of food retail types
Food retailers can be classified into different categories using Standard Industry Classification (SIC) codes or the newer system of North American Industry Classification System (NAICS) codes.Footnote 43,Footnote § These indicators of intensity and proximity can be calculated either for a specific outlet category (e.g. supermarket) or for a range of outlets classified as healthy or unhealthy, as indicated for the relative density indicator (i.e. a measure of the relative density of outlets offering unhealthy options).Footnote 46,Footnote 47,Footnote 48 Previous studies have commonly classified supermarkets, grocery stores and fruit and vegetable markets as “healthy” food retail, while convenience stores and fast-food (i.e. limited-service) restaurants have been classified as “unhealthy” retail food outlets.Footnote 44,Footnote 49,Footnote 50 While it is acknowledged that highly processed foods that are energy-dense and nutrient-poor can be purchased at “healthy” food retailers (e.g. supermarkets) and minimally processed nutrient-dense foods can be purchased at “unhealthy” food retailers (e.g. convenience stores or limited-service restaurants offering vegetables, fruit or less processed items), previous research has found that the consumer nutrition environment—food purchasing cues within stores and restaurants—varies by outlet type.Footnote 49,Footnote 51,Footnote 52
Discussion
A retail food environment that promotes and supports access to and availability of healthy food choices is one aspect of a healthy neighbourhood design and built environment. Assessing geographic access to food retail either independently or alongside additional consumer nutrition environment measures (i.e. in-store or in-restaurant audits) can provide a method for health units to characterize the local retail food landscape and thus increase their understanding of how community design impacts the health and well-being of populations. Other methods, such as questionnaires, interviews and store and restaurant inventory measures, can be used to measure resident perceptions of the food environment or the availability and price of nutritious food.Footnote 32,Footnote 53
Strengths and limitations
The APHEO Core Indicators were developed in order to systematically define and operationalize a core set of health indicators due to a recognized need for consistency among health reports and to enable true comparisons across health units. They describe complex concepts in a concrete, clearly defined way using standardized definitions and methods and form the foundation for community health status reporting in public health in Ontario. The three indicators of the community food environment presented in this report (i.e. intensity, relative density and proximity) are the first set of core indicators on the food environment in Ontario and will allow health units to monitor their food environment and examine associations with various health outcomes or socioeconomic data. As municipalities across Canada and globally are increasingly considering or implementing different policies to affect the local food environment (e.g. zoning by-laws to restrict fast-food outlets in certain areas), these indicators will enable health units to monitor the impact of these policies on a variety of health outcomes. Moreover, these indicators are consistent with those recently proposed by the international INFORMAS framework to monitor and benchmark community food environments.Footnote 27 As such, the use of indicators outlined in this paper can potentially contribute toward international efforts to monitor local food environments in a consistent way, which is critical for the development of effective policy interventions.Footnote 27
While the three indicators of the community food environment outlined in this paper were created in part to reflect the legislative requirements set in the Ontario Public Health Standards,Footnote 54 they can be used by other regional health authorities to characterize their food environments since the indicators were designed for use by public health practitioners. Additionally, in an attempt to leverage complementary work, the APHEO Built Environment Subgroup recently consulted with Health Canada during the development of a manual intended to guide communities across Canada in assessing their food environments. As a result of these consultations, the Health Canada manual and APHEO are recommending the same set of indicators to characterize the community food environment in urban settings.
Despite the strengths of these indicators, there are some limitations. The retail food environment is continuously changing in response to the changing nature of food retail business models. For example, fast-food outlets are increasingly offering healthier choices, while grocery stores continue to introduce many highly processed food choices, which pose challenges to the current “healthy” and “unhealthy” food retail classifications. The impact of these changes can in part be ameliorated by ensuring that the consumer (i.e. in-store or in-restaurant) nutrition environment assessments specific to Canadian contextsFootnote 55 are included in the evaluation of the local food environment.
Another challenge to measuring the community food environment using the proposed indicators is the reliance on public health inspection databases. While these types of databases are accessible to health unit staff in Ontario and some other provinces (in Quebec and Newfoundland and Labrador such data are collected at the provincial level), it is important to note that they classify retail food outlets based on food safety risk and not for research or monitoring purposes. Therefore, food retail outlets may need to be recategorized (e.g. convenience stores and fruit and vegetable shops are commonly assigned to a single low-risk “food store” category in food inspection databases, but for research purposes should be categorized into distinct outlet types).
Finally, these indicators were developed for use within urban settings. Several studies have proposed different methods for assessing rural environments, citing the unique ways in which rural residents interact with their food environment and the need to consider the dispersed form and unique socio-spatial structure of the rural environment.Footnote 56,Footnote 57,Footnote 58,Footnote 59
Conclusion
Given the high prevalence of poor diet quality and excess body weight in Canada, public health agencies are increasingly looking at policies to reshape food environments to better support and promote healthy, active living. A promising means by which local health practitioners can assess their local food environment is through the use of standardized indicators that use readily available data. These assessments can serve as valuable local surveillance data for evaluating the impact of policy interventions. The use of standardized measures that can be applied across Ontario (and Canada) has the added benefit of enabling accurate between-region comparisons of how different policies are reshaping the food environment and impacting health outcomes.
Acknowledgements
The authors would like to acknowledge all the members of the Built Environment Subgroup of the APHEO Core Indicators work group. LMM gratefully acknowledges a Canadian Cancer Society Career Development Award in Prevention Research (grant #704744).
Conflicts of interest
The authors declare no conflicts of interest.
Authors’ contributions
AM and JYP drafted the manuscript, and all authors made revisions and approved the final version of the manuscript.