
Development, reliability and use of a food environment assessment tool in supermarkets of four neighbourhoods in Montréal, Canada
Élise Jalbert-Arsenault, DtP (1); Éric Robitaille, PhD (1,2); Marie-Claude Paquette, PhD (1,2)
https://doi.org/10.24095/hpcdp.37.9.04
This article has been peer reviewed.
Author references:
1. Université de Montréal, Montréal, Quebec, Canada
2. Institut national de santé publique du Québec, Montréal, Quebec, Canada
Correspondence: Élise Jalbert-Arsenault, Université de Montréal, 7809 Avenue de Gaspé, Montréal, Quebec H2R 2A5; Email: elise.jalbert-arsenault@umontreal.ca
Health Promotion and Chronic Disease Prevention in Canada
Abstract
Introduction: The food environment is a promising arena in which to influence people’s dietary habits. This study aimed to develop a comprehensive food environment assessment tool for businesses and characterize the food environment of a low-to-medium income area of Montréal, Canada.
Methods: We developed a tool, Mesure de l’environnement alimentaire du consommateur dans les supermarchés (MEAC-S), and tested it for reliability. We used the MEAC-S to assess the consumer food environment of 17 supermarkets in four neighbourhoods of Montréal. We measured the shelf length, variety, price, display counts and in-store positions of fruits and vegetables (FV) and ultra-processed food products (UPFPs). We also assessed fresh FV for quality. Store size was estimated using the total measured shelf length for all food categories. We conducted Spearman correlations between these indicators of the food environment.
Results: Reliability analyses revealed satisfactory results for most indicators. Characterization of the food environment revealed high variability in shelf length, variety and price of FV between supermarkets and suggested a disproportionate promotion of UPFPs. Display counts of UPFPs outside their normal display location ranged from 7 to 26, and they occupied 8 to 33 strategic in-store positions, whereas the number of display counts of fresh FV outside their normal display location exceeded 1 in only 2 of the 17 stores surveyed, and they occupied a maximum of 2 strategic in-store positions per supermarket. Price of UPFPs was inversely associated with their prominence (p < .005) and promotion (p < .003). Store size was associated with display counts and strategic in-store positioning of UPFPs (p < .001), but not FV, and was inversely associated with the price of soft drinks (p < .003).
Conclusion: This study illustrates the variability of the food environment between supermarkets and underscores the importance of measuring in-store characteristics to adequately picture the consumer food environment.
Keywords: nutrition, food environment, consumer food environment, fruits and vegetables, food processing, food marketing, obesity, ultra-processed food products
Highlights
- The MEAC-S tool was designed to assess and monitor the consumer food environment in Montréal, Canada, and has shown robust interrater reliability.
- The availability and price of fruits and vegetables vary greatly among supermarkets.
- Ultra-processed food products, unlike fruits and vegetables, are highly and disproportionately promoted inside supermarkets, their promotion increasing with store size.
- When assessing the community food environment, food stores cannot be dichotomized into healthy versus unhealthy, as this does not comprehensively capture the food environment to which consumers are exposed.
Introduction
More than half of Canadian adults are overweight (36.8%) or obese (25.1%).Footnote 1 This represents a significant social and financial burden for the country, with up to 12% of total health expenditures in Canada estimated to be attributable to obesity.Footnote 2 In Quebec alone, the annual cost of excess weight has been estimated at 3 billion dollars.Footnote 3 Meanwhile, eating behaviours, which are considered one of the main determinants of body weight and a modifiable risk factor for the development of many noncommunicable diseases,Footnote 4 are not optimal in Quebec. The mean consumption of fruits and vegetables (FV) in the adult population is under five portions per day.Footnote 5 A recent analysis of the data for Quebec in the Canadian Community Health Survey, Cycle 2.2, Nutrition (2004), have also reported that ultra-processed food products (UPFPs) represent almost half of calories consumed (47%) in the province.Footnote 6
The food environment has been shown to influence food choices and dietary patterns.Footnote 7 Community (accessibility of different types of food stores) and consumer (what is available inside food stores) food environments have been associated with FV consumption,Footnote 8-13 diet quality,Footnote 8 Footnote 11 Footnote 14-18 and weight.Footnote 19-25 In Canada, the current food environment provides cheap, readily available, and massively marketed high-energy-density foods and UPFPs.Footnote 26 In such a skewed food environment, nutrition education is most likely insufficient to improve the population’s eating habits.Footnote 27 Footnote 28 To start curbing the rise in the prevalence of obesity, changes in the food environment are essential to make the healthy choice the easy choice.
The food environment in Canada and in Quebec is currently not well documented. This scarcity of data impedes the ability to orient, develop and implement interventions and policies that would make it conducive to healthy eating.Footnote 29 A recent review by Minaker and colleaguesFootnote 30 particularly highlights the lack of research on the consumer food environment in Canada, with only one paper that used measures of the consumer food environment to study the association between food environment and health outcomes. While store proximity and availability in one’s neighbourhood have been linked with diet quality, studies have reported inconsistent results,Footnote 31 suggesting that physical accessibility alone might not be sufficient to explain dietary habits. The availability and affordability of the foods within those stores may be contributing to the association between food store access and food store choice, eating behaviours and health outcomes.Footnote 32 Footnote 33
More than 30 different food environment assessment tools have been identified.Footnote 34 The two most frequently used tools are the Nutrition Environment Measures Survey in Stores (NEMS-S)Footnote 35 and the USDA Thrifty Food Plan.36 These tools describe the availability and price of a variety of food products. The NEMS-S also assesses produce quality. Neither of them, nor most other food environment assessment tools,Footnote 34 describe food promotion or the prominence of food categories inside food stores, despite the influence of these factors on food-purchasing decisions.Footnote 37-40
The objectives of this study were to (1) develop a food store survey that incorporates the components of the consumer food environment as defined in the Model of Community Nutrition Environments developed by Glanz and colleagues, including promotion and placementFootnote 7 ; and (2) characterize the consumer food environment of a low-to-medium income area (4 neighbourhoods) in the southeastern part of Montréal.
Methods
Tool development
The Mesure de l’environnement alimentaire du consommateur dans les supermarchés (MEAC-S) was developed to assess the consumer food environment inside supermarkets.
The MEAC-S includes two foods categories: those that have been documented to be consumed in insufficient quantities (FV category) and those that have been documented to be consumed in too large quantities (UPFPs category) according to recommendations in Canada’s Food Guide.Footnote 5 Footnote 6 The FV category includes fresh, frozen, canned and ready-to-eat FV. The UPFPs category, defined as food products formulated from industrial ingredients and containing little or no whole foods,Footnote 41 includes chips, soft drinks, frozen entrees and confectioneries. These foods were chosen because they accounted for 11% of total supermarket sales in the province in 2013 to 2014.Footnote 42
Pilot testing revealed that confectioneries were available in multiple locations within the store and often shared shelves with other food products. This placement of confectioneries precluded reliable assessment of variety and shelf length for these products. Confectioneries were thus only assessed for availability in strategic in-store positioning.
The MEAC-S assessed availability, affordability, prominence and promotion for both food categories inside supermarkets. Indicators included in the tool are listed and defined below.
1. Availability of food items was operationalized using three indicators: the variety of items in each food category, the shelf length they occupy in the supermarket and the quality of produce.
Variety was calculated by counting every available item per food category, including different sales formats, brands, flavours and types. For example, all available varieties of the same kind of fruit or vegetable were counted separately.
Shelf length was calculated using a step-length method.Footnote 43 The auditor walked in front of every shelf of food included in the tool while counting her steps, which were previously calibrated. In order to measure the accessibility of food for shoppers, audits were taken from every aisle, around island displays and near the cash registers. When a food category was available in multiple locations inside a store, the measurements for all locations were summed to obtain the total shelf length for that food category. Shelves’ depth and height were not measured nor accounted for. The total shelf length measured for all food groups was summed to create a proxy of store size.
Quality of produce was evaluated on a three-point scale, from −1 to 1. It was audited separately for fruits and vegetables and was based on the auditor’s evaluation of freshness, according to their appearance, smell and ripeness level. Full criteria for freshness evaluation are provided in the MEAC-S user guide (available from the authors upon request, in French only).
2. Affordability of food was evaluated through the price per portion for FV, price per 100 g for chips and frozen entrees and price per 2 L for soft drinks. Promotion prices were not considered.
The price per portion for fruits and vegetables was calculated using, respectively, the mean price for one portion of apple, banana, strawberry and orange, and the mean price for one portion of tomato, carrot, lettuce and cucumber. Canada’s Food Guide served as a reference for portion size. When more than one kind of these fruit or vegetable was available (e.g. 17 kinds of apple), the lowest regular price was selected.
The prices per 100 g of chips and frozen entrees and per 2 L of soft drinks were audited for the lowest-priced product in each store, usually the private label brand. The auditors also recorded prices of standard products that were shown to be available in every store during pilot testing. The standard product for chips was the 180 g bag of Lay’s Original chips and the standard product for frozen entrees was the 286 g Stouffer’s lasagna. The 2 L bottle of Coke was the standard product for soft drinks.
3. Indicators of prominence were developed to describe the simultaneous exposure to healthy and unhealthy food products. These include the “ratio of variety” and the “ratio of shelf length” of FV to UPFPs. The ratio of variety was calculated by dividing the number of products available in the FV category by the number of UPFPs available. The ratio of shelf length was obtained by dividing the total FV shelf length by the total UPFPs shelf length.
4. Promotion of food items was operationalized using two indicators: display counts and strategic in-store positioning of FV, chips, soft drinks and confectioneries. Display counts represent the number of times food products were found outside their principal point of sale in the store (e.g. chips are available in many other locations inside a store other than the chip aisle). Strategic in-store positions are the end of aisles, areas near the cash registers and ready-to-eat displays. The auditors noted the number of these positions occupied by FV, chips, soft drinks and confectioneries.
We conducted a pilot study in five food stores, and adjusted the MEAC-S to facilitate data collection. The final form is presented in Figure 1. The complete user guide is available (in French only) upon request to the corresponding author.
Figure 1 - MEAC-S measurement form

-
Abbreviations: FV, fruits and vegetables; MEAC-S, Mesure de l’environnement alimentaire du consommateur dans les supermarchés; UPFP, ultra-processed food product; w/, without.
Figure 1 - Text Equivalent
The following information is requested at the top of MEAC-S measurement form:
- Store
- Address
- Evaluation date
- Duration
The next section of the form contains 4 column labels:
- Promotion
- In store position (3 row subcategories: end of aisles, cash registers, ready-to-eat area)
- Number
- Occupied by UPFPs (ultra-processed food product)
- UPFPs
- Sodas (end of aisles, cash registers, ready-to-eat area)
- Chips (end of aisles, cash registers, ready-to-eat area)
- Confectioneries (end of aisles, cash registers, ready-to-eat area)
- Fruits and vegetables (end of aisles, cash registers, ready-to-eat area)
- Promotional material
- UPFPs (end of aisles and cash registers)
- fruits and vegetables (FV) (ready-to-eat area)
In the last section there are food items assessed for availability (based on variety and shelf length), price without promotion (per unit and per kilogram) and for quality (-1, 0, 1). On the left most column, the food items are subdivided into three subcategories: 1) fruits and vegetables 2) ready – to – eat 3) ultra-processed food products.
- Fruits and Vegetables
- Fresh fruits (assessed for availability and quality)
- Fresh vegetables (assessed for price without promotion)
- Apple
- Banana
- Strawberry
- Orange
- Tomato
- Carrot
- Lettuce
- Cucumber
- Potato (assessed for availability by shelf length and price without promotion)
- Ready-to- eat FV (availability is assessed)
- Frozen
- Fruits (Assessing availability: variety is assessed separately, shelf length includes fruits and vegetables)
- Vegetables (Assessing availability: variety is assessed separately, shelf length includes fruits and vegetables)
- Cans
- Fruits (Assessing availability, variety is assessed separately, shelf length includes fruits and vegetables)
- Vegetables (Assessing availability, variety is assessed separately, shelf length includes fruits and vegetables)
- Tomatoes (Assessing availability, variety is assessed separately, shelf length includes fruits and vegetables)
- Frozen
- Ready-to-eat
- Prepared by store (assessed for availability)
- Frozen entrees
- Cheapest brand (availability is assessed and price without promotion is assessed by format (g) and price/unit)
- Standard product (286g Stouffer’s individual lasagna) - price/unit (empty table cell found under price without promotion)
- Under ultra-processed food products
- Chips
- Cheapest brand (assessed for availability and price without promotion in format (g) and price/unit)
- Standard product (180 g Lays Original, regular size) - price/unit (empty table cell found under price without promotion)
- Soft drinks
- Cheapest brand (assessed for availability and price without promotion by price/2L
- Standard product ( 2L bottle of Coke) - price/unit (empty table cell found under price without promotion)
Display counts (excluding principal point of sale) (at the bottom right corner of the form)
- Chips
- Soft drink
Data collection
The study took place in four low-to-medium income neighbourhoods in the southeastern part of Montréal, Canada. These neighbourhoods are divided into eight Forward Sortation Areas (FSAs). The first three characters of the postal code identify the FSA. We evaluated every supermarket in these FSAs.
We selected supermarkets using a Google map search. The FSA was entered as primary term and the terms “supermarket” or “grocery store” were entered in the local search engine. We found a total of 57 food stores, of which 18 were supermarkets. In order to ensure that every supermarket was visited, we systematically tracked food stores by going through every major street in the four neighbourhoods. Two stores were not eligible for auditing as one was closed permanently and another was a convenience store. One supermarket was also added to the list, for a total of 17 supermarkets, as illustrated in Figure 2.
Figure 2 - Study area
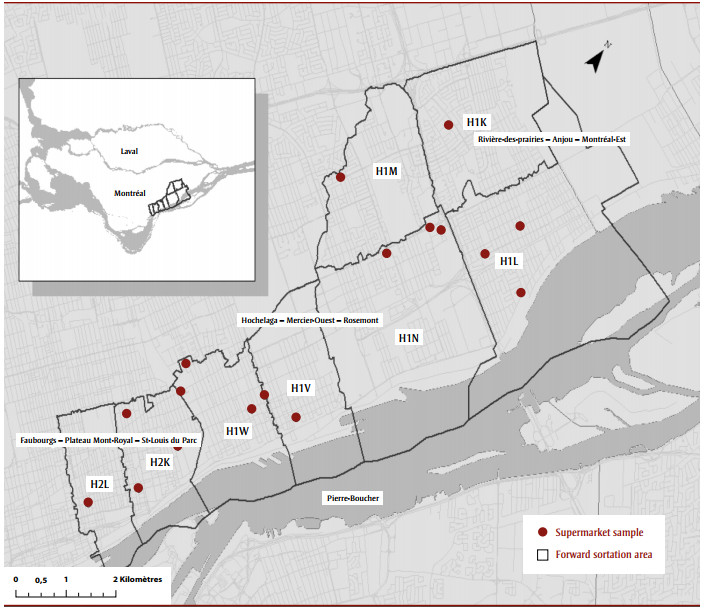
Figure 2 - Text Equivalent
Supermarkets for the study were selected using a Google map search, using the terms “supermarket” or “grocery store.” We found a total of 57 food stores, of which 18 were supermar¬kets. In order to ensure that every super¬market was visited, we systematically tracked food stores by going through every major street in the four neighbourhoods. Two stores were not eligible for auditing as one was closed permanently and another was a convenience store. One supermarket was also added to the list, for a total of 17 supermarkets, which can be seen on the map presented in this figure.
Data were collected between May and July 2015 to avoid seasonal influences on FV availability, price and prominence.
We did not seek permission from store managers to assess the food environment inside their supermarket. Therefore, subtlety was a key component of the data collection. The MEAC-S form was printed and folded like a grocery shopping list and the auditor bought food items in every store visited to avoid unwanted attention. No intervention from store managers or employees compromised data collection.
Interrater and test-retest reliability
In November 2015, five months after the first assessment, two auditors reassessed six stores to evaluate the MEAC-S for interrater and test-retest reliability.
Statistical analysis
We calculated intraclass correlation coefficients (ICCs) with a two-way random ANOVA model assessing for absolute agreement to evaluate the MEAC-S for interrater and test-retest reliability.
We conducted Spearman correlations between price and prominence indicators, and between store size and all other food environment indicators in supermarkets.
All statistical analyses were performed in SPSS Statistics version 19.0 (IBM Corp., Armonk, NY, USA). A p-value inferior to .05 was considered significant.
Results
All supermarkets included in the study are chain supermarkets, with estimated annual chain sales exceeding $150 million.Footnote 44
Audits lasted on average 56 minutes (32–75 minutes). We assessed interrater and test-retest reliability using the ICC coefficient for each indicator. An ICC coefficient above 0.75 indicates excellent agreement and an ICC coefficient between 0.40 and 0.75 indicates medium-to-good agreement.Footnote 45
All indicators had an ICC coefficient above 0.85 for interrater reliability, suggesting excellent agreement between auditors. The ICC coefficients for test-retest reliability were lower. ICC coefficients below 0.75 were found for indicators of display counts (0.43) and strategic in-store positioning (0.53) and coefficients were mostly invalid for indicators of price due to within-group to between-group variance (Table 1).
| Indicators | ICC | |
|---|---|---|
| Interrater | Test-retest | |
| Variety | 0.888 | 0.876 |
| Shelf length | 0.908 | 0.894 |
| Display counts | 0.951 | 0.431 |
| Quality | 0.968 | 0.968 |
| Price | 0.883 | NV |
| Strategic in-store positioning | 0.845 | 0.529 |
| Mean ICC for all indicators | 0.894 | 0.607 |
|
||
Consumer food environment
Overall availability, affordability, prominence and promotion of food items per supermarket are described in Table 2.
| Consumer food environment indicators | Supermarkets (N = 17) | ||
|---|---|---|---|
| Mean | (min-max) | ||
| Variety | Fresh FV | 221.3 | (149–319) |
| Total FV | 518.6 | (361–757) | |
| Ready-to-eat meals | 79.3 | (0–187) | |
| Frozen entrees | 134.5 | (41–209) | |
| Chips | 235.7 | (123–338) | |
| Soft drinks | 41.7 | (27–50) | |
| Ratio (FV/UPFPs) | 1.28 | (0.89–1.48) | |
| Shelf length (m) | Fresh FV | 89.1 | (18.2–166.4) |
| Total FV | 123 | (34.8–223.4) | |
| Ready-to-eat meals | 11.2 | (0.0–29.7) | |
| Frozen entrees | 46.4 | (18.6–91.5) | |
| Chips | 39.6 | (14.2–82.0) | |
| Soft drinks | 26.8 | (9.5–70.9) | |
| Ratio (FV/UPFPs) | 1.2 | (0.64–2.34) | |
| Total measured shelf length | 247 | (88.4–455.3) | |
| Quality (−1,0,1) | F | 0.8 | (−0.5 to 1.0) |
| V | 0.9 | (0.0–1.0) | |
| Price ($) | F (per portion) | 0.7 | (0.43–1.22) |
| V (per portion) | 0.33 | (0.22–0.53) | |
| Frozen entrees, HB (per 100 g) | 0.72 | (0.47–0.93) | |
| Stouffer’s lasagna (per 100 g) | 1.41 | (1.39–1.57) | |
| Chips, HB (per 100 g) | 0.99 | (0.74–1.25) | |
| Lay’s (per 100 g) | 1.63 | (1.23–1.99) | |
| Soft drinks, HB (per 2 L) | 1.32 | (1.00–1.99) | |
| Coke (per 2 L) | 2.38 | (1.67–2.79) | |
| Display counts | FV | 0.7 | (0–3) |
| Chips | 9.9 | (4–18) | |
| Soft drinks | 5.5 | (2–10) | |
| Strategic in-store positioning | FV | 0.5 | (0–2) |
| Chips | 6.9 | (3–13) | |
| Soft drinks | 5.7 | (2–9) | |
| Confectioneries | 10.7 | (3–17) | |
|
|||
Availability of food items differed greatly among supermarkets, as illustrated by the variability in variety and shelf length indicators. We calculated variety and shelf length ratios for each store. Ratios above 1.0 indicate greater presence of FV, whereas ratios under 1.0 indicate a greater presence of UPFPs. Two supermarkets had variety ratios inferior to 1.0 and five supermarkets had shelf length ratios inferior to 1.0.
Price per portion of vegetable varied more than twofold and price per portion of fruit more than threefold from one supermarket to another.
Quality of FV did not differ significantly among supermarkets; most of them offered FV of the highest quality.
Display counts and strategic in-store positioning for UPFPs greatly outnumbered those for FV. Nine supermarkets did not have display counts for FV outside their normal display location or strategic in-store positioning for FV, and of the stores that did, 6 out of 8 were for canned FV. In comparison, all stores had at least 7 additional display counts and 8 strategic positions occupied by UPFPs.
Price and prominence of ultra-processed food products
Results showed that the price of UPFPs such as chips and soft drinks was inversely associated with their availability, prominence and promotion in the supermarket (Table 3). This association was not seen for FV (data not shown).
| Price | Display counts: chips | Display counts: soft drinks | Display counts: UPFPs | Strategic in-store positioning: chips | Strategic in-store positioning: soft drinks | Strategic in-store positioning: UPFPs | Shelf length: chips | Shelf length: soft drinks | Shelf length: ratio | Variety: soft drinks |
|---|---|---|---|---|---|---|---|---|---|---|
| Chips (HB) | -0.690 p=0.002 |
NS | -0.674 p=0.003 |
-0.641 p=0.006 |
NS | NS | -0.521 p=0.032 |
-0.489 p=0.046 |
0.661 p=0.004 |
NS |
| Soft drinks (Coke) | -0.808 p<0.001 |
-0.653 p=0.004 |
-0.865 p<0.001 |
-0.842 p<0.001 |
-0.533 p=0.028 |
-0.834 p<0.001 |
-0.804 p<0.001 |
-0.767 p<0.001 |
0.695 p=0.002 |
-0.667 p=0.003 |
|
||||||||||
Consumer food environment indicators and supermarket size
Because supermarket size could account for some of the results, we conducted Spearman correlations between the store size proxy and indicators of the consumer food environment, excluding shelf length measurements (Table 4).
| Variety | Display Counts | Price | Strategic in-store positioning | |||||||
|---|---|---|---|---|---|---|---|---|---|---|
| FV | Chips | UPFPs | FV | Chips | UPFPs | Soft drinks (Coke) | Chips | Confectioneries | UPFPs | |
| Store size | 0.527 p= .030 |
0.784 p< .001 |
0.655 p= .004 |
0.577 p= .015 |
0.821 p< .001 |
0.772 p< .001 |
-0.695 p= .002 |
0.735 p= .001 |
0.583 p= .014 |
0.760 p< .001 |
|
||||||||||
Store size was positively associated with UPFPs variety, display counts and strategic in-store positioning and inversely associated with the price of soft drinks. It was also positively correlated to FV variety and display counts, though it should be noted that additional display counts for FV were present in only 8 supermarkets out of 17, and that most of these display counts were for canned, not fresh FV.
Discussion
This study’s first objective was to develop a tool to assess the consumer nutrition environment inside supermarkets in the province of Quebec. The MEAC-S is used to audit foods that are under- or overconsumed in Quebec, using eight indicators that reflect the consumer food environment in stores.
Overall data suggest variability among supermarkets, particularly regarding shelf length measurements and price of FV. The price of FV varied more than twofold between supermarkets. This can result in a difference of over $30.00 per week for a family of four, depending on their choice of supermarket, a considerable amount for low-income families living in the surveyed neighbourhoods.
Many studies have suggested that neighbourhood socioeconomic status (SES) is associated with FV and snack foods availability inside food retailers,Footnote 46 Footnote 47 thus mediating the relationship between individual SES and diet quality.Footnote 33 However, the available data on SES in our study area do not match our geographic breakdown, thus restricting our ability to analyze the consumer food environment in the different FSAs with respect to their SES. Future studies should consider using geographic boundaries allowing for adequate integration of SES information.
Our results also showed that in this sample, almost 30% of the 17 supermarkets had a shelf length ratio below 1.0, indicating prominence of UPFPs in these stores. The limited number of UPFPs included in the MEAC-S likely under estimates this percentage.
Moreover, our data suggest that larger stores have more display counts and in-store positioning of UPFPs than do smaller ones, a relationship that is not observed for FV. This result is consistent with previous research showing that unhealthy food item promotion seems to be related to store size, whereas FV are found less frequently and in less prominent spaces, regardless of store size.Footnote 40 A study conducted in Montréal by Blanchard also suggested that shelf space of snack foods is more extensible than shelf space of FV.Footnote 46
Most studies on community food environment categorize supermarkets as healthy stores.Footnote 48 While it has been shown that they usually do have a greater availability of healthy foods at lower prices when compared to other types of stores,Footnote 33 Footnote 49 they also offer more UPFPs at lower pricesFootnote 19 Footnote 50 and their in-store content may vary greatly among supermarkets.Footnote 20 Footnote 29 This study confirms these results and suggests that supermarkets cannot be uniformly considered healthy stores. Many researchers are urging their colleagues to explore the consumer nutrition environment further and revise their categorization of stores as healthy or unhealthy.Footnote 23 Footnote 29 Footnote 32 Footnote 51
In contrast to availability and price, produce quality did not vary among stores. This is probably due to the highest quality standard to which chain supermarkets adhere. In this context, the assessment of produce quality might be more valuable when comparing the food environment inside different types of stores. It is also worth mentioning that in most supermarkets we visited, the produce section was located at the store entrance. These choices are likely not arbitrary and may reflect the marketing practices of store owners. A US study reports that consumers who choose to purchase food perceived as healthy, such as fresh FV, are more likely to choose to purchase high-energy-density and ultra-processed products later in their store visit.Footnote 52
This study also found an inverse relationship between the price, promotion and prominence of UPFPs, but not of FV. Price, promotion and prominence are known to have a central influence on food purchasing behaviour. Marketing research suggests that increasing the shelf space, lowering the price and displaying products at the end of aisles or near cash registers all lead to increasing sales of these products.Footnote 14 Footnote 37-40
Notably, UPFPs were promoted in this way in all stores included in the study, which was not the case for FV. Strategic in-store positioning of unhealthy items not only increases the purchase of these items in percentage of total sales, but also reduces the purchase of FV.Footnote 40 Considering the influence of promotion and prominence on sales, a promising strategy to improve the consumer nutrition environment without compromising store profitability could be to encourage store managers, through financial incentives or regulations, to also apply this marketing mix to FV.Footnote 37 Footnote 39
Strengths and limitations
This study has many strengths and limitations. The MEAC-S was validated for interrater reliability with satisfactory ICC coefficients for all indicators, suggesting excellent agreement between raters. The ICC coefficients for test-retest reliability were somewhat less satisfactory. The production of FV being closely linked to climate and temperature, seasonal changes influence the in-store availability and price of produce, which could explain the lower ICC scores. Moreover, display counts and in-store positioning of food products may not be constant over time. This might be linked with in-store positioning of food products related to seasonal particularities or holidays. To limit the influence of seasonality on ICC scores, test-retest reliability of the MEAC-S should be evaluated again using a shorter timeframe. Precautions should also be taken when using the MEAC-S to assess the food environment quality over time or when comparing stores or neighbourhoods. To maximize comparability, the assessment should be done within the same season.
Another strength of this study is the indicators and measurements used. The MEAC-S tool includes every variety of each of the food categories surveyed. While including a larger variety can be time-consuming, it could allow for a more sensitive classification of food stores with regards to FV and food products availability. (For example, a study conducted in Montréal failed to detect differences between stores by SES area while using the NEMS-S checklist for fresh FV, but detected a significant difference when using a homemade checklist of 137 fresh FV.Footnote 46 )
Additionally, the MEAC-S integrates measures of food prominence and promotion, such as additional display counts and strategic in-store positioning, which were found to be closely related to purchase behaviours.Footnote 37 Footnote 39 To our knowledge, this is the first study to integrate both of these measurements in a food store survey. The MEAC-S also combines both absolute and relative indicators, which better illustrates the simultaneous exposure of consumers to both healthy and unhealthy food items.Footnote 29 Footnote 48 Footnote 49
Finally, unlike the method proposed by other audit tools, MEAC-S indicators were not aggregated into a global quality score per supermarket. Results from different indicators did not converge and were sometimes in opposition regarding the quality of the food environment inside supermarkets (e.g. price per portion of vegetable positively correlated with FV prominence). Aggregation of these contrasting results would not give a complete and accurate picture of the situation and would possibly underestimate the importance of one or many indicators in relation with consumer’s purchase behaviours or health outcomes. Moreover, all indicators of the consumer food environment may not be linked with dietary outcomes or weight in the same way and in every population subgroup.Footnote 51 The MEAC-S, by generating data for multiple indicators, allows for analysis between each component of the consumer food environment and dietary or health outcomes.
The main limitation of the MEAC-S is the inclusion of only a limited number of food products for assessment. This limitation was intended to ensure the tool was convenient and easy to use, particularly for public health practitioners that lack both time and human resources mostly due to budget constraints. The exclusion of UPFPs other than chips, soft drinks, frozen entrees and confectioneries likely underestimates the prominence of this category of products in our food environment. Furthermore, the MEAC-S does not provide information regarding healthy options within these food groups or for other available food categories, such as grains and proteins.
Another important limitation of this study is the exclusion of food stores other than supermarkets. There was a wide variety of other types of food stores in the study area, such as small grocery stores and produce stands. In Quebec, these types of stores accounted for 12.2% of food purchases in 2013, while 55.2% of food were purchased in supermarkets.Footnote 53 Therefore, excluding other types of stores may misrepresent the consumer food environment of neighbourhoods residents.Footnote 29 However, most consumers tend to choose supermarkets as their primary food store and visit other types of stores for smaller, complementary purchases between their main food shopping trips.Footnote 17 Footnote 33 The inclusion of every supermarket within the four neighbourhoods thus probably depicts at least part of the food environment to which most of the residents are exposed.
In order to more accurately reflect financial accessibility to food items, promotion prices were excluded from the observations, despite their known influence on purchase behaviours.Footnote 54 In addition to display counts and strategic in-store positioning, further studies could also assess the frequency of price promotions per food category. Other limitations include the small sample of supermarkets and the urban, low-to-medium income setting in which the study was conducted, limiting the ability to generalize results to rural or higher-income areas.
Conclusion
To our knowledge, the MEAC-S is the first tool developed to assess the consumer food environment using such a broad set of measures, integrating availability and price, but also prominence and promotion indicators. Results illustrate the prominence and promotion of UPFPs over FV in the neighbourhoods surveyed and underscores the necessity to adequately picture the consumer food environment to which consumers are exposed, breaking with the dichotomous classification of stores as healthy or unhealthy. The MEAC-S could be used to reliably characterize and monitor the consumer food environment inside supermarkets, providing much-needed data to inform interventions and policies targeting the food environment to ultimately improve eating habits at the population level.
Acknowledgements
This project was in part supported by a Canada Graduate Scholarship—Master’s Program from the Canadian Institutes of Health Research (CIHR).