
Original quantitative research – The association of school connectedness and bullying involvement with multiple screen-time behaviours among youth in two Canadian provinces: a COMPASS study
Health Promotion and Chronic Disease Prevention in Canada
Tarun R. Katapally, PhDAuthor reference 1Author reference 2Author reference 3; Audur Sjofn Thorisdottir, MScAuthor reference 4; Rachel Laxer, MSc Author reference 5; Wei Qian, MScAuthor reference 5; Scott T. Leatherdale, PhDAuthor reference 5
https://doi.org/10.24095/hpcdp.38.10.03
This article has been peer reviewed.
Author references:
- Author reference 1
-
Johnson Shoyama Graduate School of Public Policy, University of Regina, Regina, Saskatchewan, Canada
- Author reference 2
-
Johnson Shoyama Graduate School of Public Policy, University of Saskatchewan, Saskatoon, Saskatchewan, Canada
- Author reference 3
-
Department of Community Health and Epidemiology, College of Medicine, University of Saskatchewan, Saskatoon, Saskatchewan, Canada
- Author reference 4
-
Department of Psychology, University of Regina, Regina, Saskatchewan, Canada
- Author reference 5
-
School of Public Health and Health Systems, University of Waterloo, Waterloo, Ontario, Canada
Correspondence: Tarun R Katapally, Johnson Shoyama Graduate School of Public Policy, University of Regina, 110-2 Research Drive, Regina, SK S4S 7H9; Tel: 306-585-4544; Email: Tarun.katapally@uregina.ca
Abstract
Introduction: Screen time, a proxy for sedentary behaviours, has emerged as a critical health determinant among youth in contemporary societies, where most aspects of youth life involve access to screen-time devices. An understudied approach to reducing screen time among youth is bullying reduction. This study aims to understand the association between bullying perpetration, victimization, youth perception of the school environment and multiple screen-time behaviours.
Methods: A total of 44,861 youth aged between 13 and 18 years in two Canadian provinces completed a validated questionnaire that collected student data on health behaviours and outcomes, including multiple screen-time behaviours, bullying perpetration and victimization, and school connectedness. The outcome variables were total screen time, time spent watching television, playing video games, internet surfing, and communication-based screen-time behaviours. Using a random intercept, the final models were built using PROC MIXED in SAS 9.4. These models were adjusted for age, ethnicity, weekly disposable income, daylight hours, and weather variables.
Results: Compared to youth who reported non-involvement in bullying, youth who were bullies, victims, or both bullies and victims spent on average more minutes per day in front of screens across all screen time categories. Youth who felt happy and safe at school, and who perceived their teachers as being fair, reported lower levels of multiple screen-time behaviours.
Conclusion: With non-involvement in bullying showing a strong negative association with multiple screen-time behaviours, school policies to address bullying and screen time through school connectedness could offer a novel approach in minimizing these harmful behaviours.
Keywords: youth health, school connectedness, bullying, screen time, TV, internet surfing, texting, video games
Highlights
- Bullying perpetration, victimization, or both are associated with increased multiple screen-time behaviours among youth.
- Non-involvement in bullying is associated with decreased multiple screen-time behaviours among youth.
- Positive perception of the school environment and enhanced school connectedness could play an important role in minimizing screen time among youth.
- Strategies to minimize screen time among youth should move beyond limiting access to screen-time devices.
- School policies should target both bullying and screen time to maximize the reduction of these complex harmful behaviours.
Introduction
Screen time (ST), a proxy for sedentary behaviours, has emerged as a critical determinant of health among youth in contemporary societies,Footnote 1Footnote 2 where most aspects of youth life involve digital media.Footnote 3Footnote 4 ST is associated with a wide range of poor health outcomes, including obesity, metabolic syndrome, anxiety and depression, poor vision, and multiple risk behaviours such as smoking and other illicit drug use.Footnote 5Footnote 6Footnote 7Footnote 8Footnote 9
Evidence also suggests that time spent using computers and playing video games is associated with physical violence,Footnote 10 as well as increased loneliness, risk of online victimization,Footnote 11 and various functional problems such as peer-related issues and hyperactivity.Footnote 12Footnote 13 An important yet understudied avenue for reducing ST in youth may involve targeting negative social factors in their environment, such as bullying.
Bullying is a heterogeneous concept that refers to a wide array of repeated behaviours, including physical and verbal aggressions, intended to harm or intimidate individuals who are perceived as less powerful.Footnote 14 Bullying affects between 6 and 40 per cent of youth annually (youth sample consisted of ages 11, 13, and 15 years)Footnote 15Footnote 16 and has been linked to various poor health outcomes, such as depression, suicidal ideation, and physical inactivity.Footnote 17Footnote 18Footnote 19 Cyber-bullying is a special cause for concern as it is not confined to social settings and can occur anytime and anywhere through electronic devices. Online communication is also faster, more widespread, and sometimes anonymous with limited accountability, which can create disinhibition and distance from the victim that may prompt more severe aggressionsFootnote 20 and lead to worse outcomes compared to other types of bullying (e.g., suicide attempts that need medical attention, heavier substance use).Footnote 21Footnote 22
Drawing upon existing literature on bullying interventions, school strategies such as environmental supervision (e.g., playground supervision) and educating school staff about appropriate strategies for intervening are somewhat effective in reducing aggressions and victimization among youth.Footnote 15Footnote 20 The effectiveness of anti-bullying endeavours may, however, be contingent upon students’ perceptions of school connectedness and environment. Rates of bullying are lower when students perceive their school environment as supportive and safe, the school climate is positive (e.g., staff/teachers provide caring atmosphere that promotes autonomy), and when students have positive relationships with teachers.Footnote 23Footnote 24
This study is based on the hypothesis that involvement in bullying (either perpetration, victimization, or both) and negative perceptions of the school environment and school connectedness are associated with increased ST in youth. The study aims to understand the association between bullying perpetration, victimization, and youth perception of the school environment and school connectedness on different types of ST behaviours after controlling for weather variation (a perennial factor that is known to influence sedentary behaviours) in two geographically and climatically distinct provinces in Canada (Ontario and Alberta).Footnote 25Footnote 26Footnote 27
Methods
Design
COMPASS (2012-2021) is a cohort study collecting data from a focussed sample of secondary school students (grades 9 through 12) and the schools they attend in Ontario (n=79) and Alberta (n=10).Footnote 28 This study uses secondary cross-sectional student- and school-level data from Year 2 (2013-2014) of the COMPASS cohort. Year 2 data were used because Year 1 data consisted of a smaller sample of schools (www.compass.uwaterloo.ca).Footnote 28
Participants
Parents or guardians of eligible students were mailed an information letter or received an automated call about the COMPASS study and were asked to contact the COMPASS recruitment coordinator using a toll-free phone number or email address if they did not want their child to participate. Students whose parents or guardians did not contact the COMPASS team to withdraw their child were deemed eligible to participate. Students could also withdraw themselves and decline participation at any time. All procedures were approved by the University of Waterloo Office of Research Ethics and participating School Boards. In Ontario, out of a total 52,529 students enrolled in grades 9 to 12, 80.1% (N = 41 734) students completed the student-level COMPASS questionnaire (Cq)Footnote 28; in Alberta, out of a total of 4,700 students enrolled in grades 9 to 12, 77.1% (N = 3564) of students completed the Cq in class time on the day of their schools’ scheduled data collection.
Data collection tools
The Cq collects individual student data pertaining to demographic variables (e.g., age, ethnicity, disposable income) and health behaviours, including physical activity, ST-based sedentary behaviour, bullying, and school connectedness. Items measured on the Cq were based on national standards or current national public health guidelines.Footnote 28 To account for weather variation, weather and daylight data were obtained for each COMPASS school through the Environment Canada website’s Climate database.Footnote 29
Policies and programs related to physical activity and bullying were measured using the School Policies and Practices Questionnaire, a paper-based survey completed by the administrator most knowledgeable about the school’s program, practice, and policy environment. This survey measured the presence or absence of relevant programs and policies, as well as changes to school programs, policies, or resources, that are related to student health.
Measures
Student-level measures
Students were asked to report, via four individual items on the Cq, the average amount of time per day they had spent in each type of ST behaviour for the past 7 days: (1) watching/streaming TV shows or movies; (2) playing video/computer games; (3) surfing the internet; and (4) texting, messaging, and emailing. Total ST was measured as the sum of minutes for these four activities. Reported ST was not context-specific (e.g., school, home). Previous research found that the test re-test reliability for these individual items ranged from fair (TV: ICC = 0.56) to moderate (playing video or computer games: ICC = 0.65; surfing the internet: ICC = 0.71) to substantial (texting, messaging, emailing: ICC = 0.86).Footnote 30Footnote 31
Students reported their experience related to bullying by answering the following question: “In the last 30 days, in what ways were you bullied by other students?” with response options of “I did not get bullied by other students”; physical attacks, verbal attacks, or cyber-attacks;and stealing. They were also asked: “In the last 30 days, in what ways did you bully other students?” with response options of “I did not bully other students”; physical attacks, verbal attacks, or cyber-attacks; and stealing. Perception of school environment and school connectedness was measured by asking students to strongly agree, agree, disagree, or strongly disagree with the following statements: “I feel close to people at my school,” “I feel I am a part of my school,” “I am happy to be at my school,” “I feel the teachers at my school treat me fairly,” “I feel safe in my school,” and “getting good grades is important to me.”
School-level measures
School level variables of interest for this study included policies to address bullying and enhance physical activity. Bullying policy questions for school administrators included examples such as, “Is bullying a problem in your school?” (Yes/No); “Does your school have any policies to address bullying?” (Yes/No. If yes, “Please list them” (Table 1).
| School-level questions | School-level outcomes (Yes/No) | Total daily screen time in minutes | |||||
|---|---|---|---|---|---|---|---|
| Alberta | p -value | Ontario | p -value | ||||
| Yes | No | Yes | No | ||||
| Does your school have written policies on the following? e.g., bullying | Alberta (yes=2, no=7) Ontario (yes=3, no=73) |
440.2 | 477.3 | 0.0023 | 489.7 | 475.3 | 0.1615 |
| In which fields does your school receive support from your school's local Public Health Unit? (Check all that apply) e.g., bullying | Alberta (yes=1, blank=9), Ontario( yes =27, blank=52) |
535.2 | 461.4 | 0.0009 | 476.5 | 478.4 | 0.5492 |
| Is bullying a problem at your school? | Alberta (yes=8, no=2), Ontario (yes=45, no=30) |
477.0 | 441.9 | 0.0050 | 475.4 | 478.9 | 0.3060 |
| Does your school have any programs that address bullying? | Alberta (yes=7, no=3) Ontario (yes=74, no=5) |
481.4 | 443.6 | 0.0014 | 477.3 | 482.3 | 0.4618 |
Notes: p-values are based on ANOVA and show the differences between within-province total screen-time behaviours/day based on the presence or absence of policies/programs (yes/no). |
|||||||
Weather and daylight data
All weather data were for the seven days prior to the Cq data collection date to match ST recall data. Data on maximum temperature (degrees Celsius [°C]), total rainfall (millimetres [mm]), and total daylight hours (sunrise to sunset) were collected.
Analyses
All the analyses were carried out in SAS 9.4. The sample was divided into four groups (Ontario males and females, Alberta males and females) to develop five random-intercept linear regression models for each of the five outcomes. Random-intercept models were chosen because they account for the effects of clustering of children within each school. The primary assumption of these models is that the mean outcome for each school varies around a grand mean of the outcome for all schools. The estimated coefficients in the models are indicative of the amount of increase in the ST minutes associated with one-unit increase in the independent variables, holding other covariates fixed. The five outcomes were average minutes/day of total ST, and individual ST behaviours (television viewing, internet surfing, video gaming, communication-based ST). The models were adjusted for age, ethnicity, weekly disposable income, daylight hours, and weather variables.
Results
As shown in Table 2 total ST (min/day) was similar among females (Ontario: mean = 473.7 ± 318.7; Alberta: 459.9 ± 325.0) and males (Ontario: mean = 481.5 ± 332; Alberta: 476.9 ± 340.5) in both provinces, with a major proportion of youth (41%) accumulating more than 7.5 hours of ST per day. Males in both Ontario and Alberta spent significantly more minutes per day playing video games than females (< 0.0001), whereas females spent significantly more minutes per day in communication-based ST behaviours and internet surfing (< 0.0001) (Table 2). Time spent watching TV was similar between females and males in both provinces.
| Descriptive category | ON (N = 41 324) |
AB (N = 3537) |
||||||
|---|---|---|---|---|---|---|---|---|
| Female (n = 20 388) |
Male (n = 20 936) |
DF | p-value | Female (n = 1761) |
Male (n = 1776) |
DF | p-value | |
| Grade (%; n) | ||||||||
| 9 | 26.7 (5445) | 27.5 (5742) | 3 | 0.027 | 15.0 (264) | 15.4 (274) | 3 | 0.6978 |
| 10 | 26.2 (5344) | 25.3 (5277) | 33.0 (582) | 31.3 (556) | ||||
| 11 | 24.9 (5062) | 24.4 (5099) | 28.3 (499) | 28.5 (505) | ||||
| 12 | 22.2 (4511) | 22.9 (4777) | 23.6 (416) | 24.8 (440) | ||||
| Age (%; n) | ||||||||
| 13 | 1.1 (229) | 1.2 (250) | 5 | < .0001 | 0.4 (7) | 0.6 (10) | 5 | 0.0214 |
| 14 | 21.6 (4405) | 21.6 (4517) | 13.0 (229) | 11.5 (204) | ||||
| 15 | 25.9 (5284) | 24.8 (5176) | 29.4 (517) | 26.8 (475) | ||||
| 16 | 25.3 (5155) | 24.5 (5129) | 30.2 (531) | 29.4 (522) | ||||
| 17 | 20.2 (4119) | 20.6 (4307) | 22.2 (391) | 24.8 (440) | ||||
| 18 | 5.8 (1179) | 7.3 (1528) | 4.9 (86) | 6.9 (123) | ||||
| Ethnicity (%; n) | ||||||||
| White | 75.3 (15342) | 73.2 (15315) | 5 | < .0001 | 74.2 (1307) | 72.6 (1290) | 5 | 0.0067 |
| Black | 3.2 (657) | 4.9 (1033) | 1.2 (21) | 2.8 (50) | ||||
| Asian | 5.2 (1068) | 5.2 (1082) | 3.4 (60) | 4.4 (78) | ||||
| Aboriginal | 3.0 (613) | 2.8 (591) | 11.1 (195) | 10.2 (182) | ||||
| Hispanic | 1.9 (386) | 2.2 (453) | 0.5 (8) | 0.2 (4) | ||||
| Other/Mixed | 11.4 (2322) | 11.8 (2462) | 9.7 (170) | 9.7 (172) | ||||
| BMI categories (%; n) | ||||||||
| Underweight | 1.4 (282) | 1.7 (350) | 4 | < .0001 | 1.4 (25) | 1.8 (32) | 4 | < .0001 |
| Healthy weight | 61.7 (12574) | 52.6 (11021) | 58.0 (1022) | 50.0 (888) | ||||
| Overweight | 11.4 (2332) | 16.7 (3493) | 11.8 (208) | 16.9 (300) | ||||
| Obese | 4.1 (838) | 8.3 (1734) | 6.0 (105) | 10.1 (180) | ||||
| Not Stated | 21.4 (4362) | 20.7 (4338) | 22.8 (401) | 21.2 (376) | ||||
| Weekly disposable income (%; n) | ||||||||
| Zero | 15.3 (3127) | 16.8 (3513) | 7 | < .0001 | 13.9 (245) | 14.3 (254) | – | < .0001 |
| $1 to $5 | 7.0 (1428) | 6.4 (1331) | 3.8 (67) | 3.4 (61) | ||||
| $6 to $10 | 8.1 (1650) | 7.9 (1658) | 6.0 (105) | 4.1 (72) | ||||
| $11 to $20 | 14.8 (3016) | 14.8 (3105) | 10.3 (181) | 9.6 (170) | ||||
| $21 to $40 | 13.1 (2676) | 12.3 (2584) | 12.6 (222) | 12.4 (221) | ||||
| $41 to $100 | 14.9 (3037) | 12.4 (2600) | 17.2 (303) | 15.0 (266) | ||||
| More than $100 | 13.7 (2787) | 17.2 (3591) | 17.5 (309) | 27.7 (492) | ||||
| DK/Missing | 13.1 (2667) | 12.2 (2554) | 18.7 (329) | 13.5 (240) | ||||
| Bullying victimization and perpetration (%; n) | ||||||||
| Victims of bullying | 23.9 (4867) | 19.7 (4120) | – | – | 30.8 (542) | 22.1 (392) | – | – |
| Victims of physical attacks | 1.8 (358) | 3.7 (775) | 1 | < .0001 | 2.6 (46) | 5.3 (95) | 1 | < .0001 |
| Victims of verbal attacks | 17.5 (3562) | 11.8 (2463) | 1 | < .0001 | 24.9 (438) | 13.6 (241) | 1 | < .0001 |
| Victims of cyber-attacks | 8.2 (1671) | 2.9 (600) | 1 | < .0001 | 10.2 (179) | 2.9 (52) | 1 | < .0001 |
| Victims of property damage and theft | 2.6 (526) | 3.4 (702) | 1 | < .0001 | 3.6 (63) | 4.3 (77) | 1 | 0.2476 |
| Perpetrators of bullying | 10.3 (2102) | 15.9 (3338) | – | – | 11.9 (209) | 18.0 (319) | – | – |
| Perpetrators of physical attacks | 0.9 (187) | 3.3 (681) | 1 | < .0001 | 0.4 (7) | 4.7 (83) | 1 | < .0001 |
| Perpetrators of verbal attacks | 6.6 (1353) | 9.5 (1984) | 1 | < .0001 | 9.3 (163) | 11.7 (208) | 1 | 0.0172 |
| Perpetrators of cyber-attacks | 2.1 (438) | 1.8 (370) | 1 | 0.0052 | 1.3 (23) | 2.0 (36) | 1 | 0.0941 |
| Perpetrators of theft and property damage | 0.6 (118) | 1.6 (328) | 1 | < .0001 | 0.3 (6) | 1.7 (31) | 1 | < .0001 |
| Non-involvement in bullying (%;n) | ||||||||
| Did not bully others | 89.7 (18286) | 84.1 (17598) | 1 | < .0001 | 88.1 (1552) | 82.0 (1457) | 1 | < .0001 |
| Did not get bullied | 76.1 (15521) | 80.3 (16816) | 1 | < .0001 | 69.2 (1219) | 77.9 (1384) | 1 | < .0001 |
| Multiple screen-time behaviours (mean minutes/day; SD) | ||||||||
| Total screen time | 473.7 (318.7) | 481.5 (332.0) | – | 0.0153 | 459.9 (325.0) | 476.9 (340.5) | – | 0.1295 |
| TV | 122.6 (92.1) | 120.4 (96.0) | – | 0.0147 | 115.3 (89.1) | 119.4 (98.1) | – | 0.1945 |
| Internet surfing | 143.0 (129.7) | 117.3 (120.7) | – | < .0001 | 128.6 (133.8) | 104.8 (118.5) | – | < .0001 |
| Video games | 38.4 (81.4) | 126.0 (128.4) | – | < .0001 | 43.7 (83.8) | 125.4 (127.0) | – | < .0001 |
| Communication-based screen-time behaviours | 169.7 (165.3) | 117.9 (145.3) | – | < .0001 | 172.2 (169.2) | 127.2 (154.7) | – | < .0001 |
Abbreviations: BMI, body mass index; DF, degrees of freedom; SD, standard deviation. Note: Only variables that were statistically significant following backward stepwise elimination were included in the models. – : not available. |
||||||||
The prevalence of reported bullying victimization and perpetration was similar across the two provinces. In both provinces, the proportion of females who reported being bullied in the past 30 days was significantly higher than males (< 0.0001) (Table 2). In contrast, in both provinces, the proportion of males who reported bullying others in the past 30 days was significantly higher than females (< 0.0001) (Table 2). In both provinces, males reported being victims of significantly more physical attacks (< 0.0001) and females reported being victims of significantly more verbal and cyber-attacks (< 0.0001). Figures 1 and 2 show that in both Ontario and Alberta, youth who reported involvement in bullying, both as perpetrators and victims, also reported significantly higher ST in comparison with youth who reported being only perpetrators or only victims and youth who reported non-involvement (< 0.0001).
Figure 1. Average screen-time behaviours across the distribution of bullying perpetration, victimization, both perpetration/victimization, and non-involvement in Ontario, Canada, COMPASS Study (2013-2014)
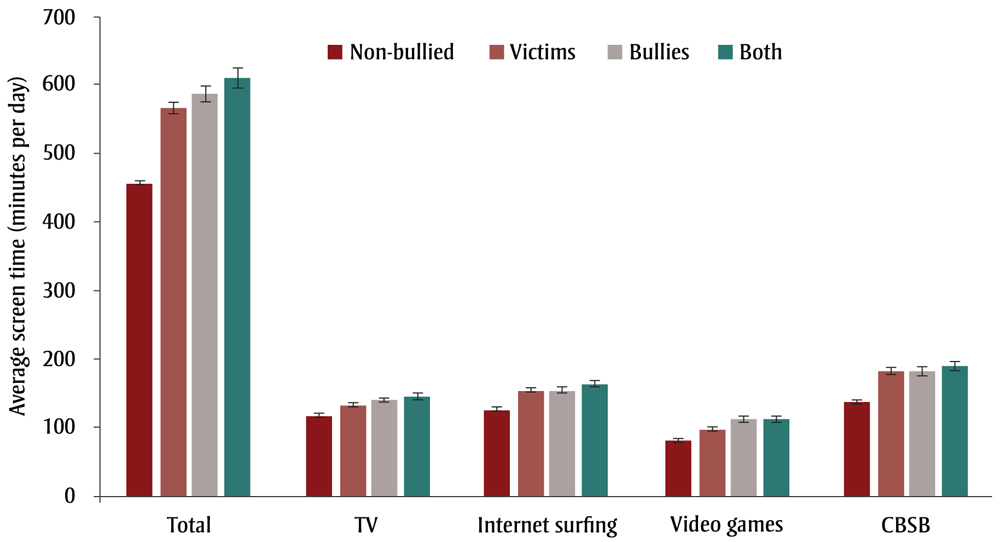
Abbreviation: CBSB, communication-based screen-time behaviours.
Text Description
| Group | Total | TV | Internet surfing | Video games | Communication-based screen-time behaviours |
|---|---|---|---|---|---|
| Non-bullied | 454 | 118 | 123.6 | 78.8 | 132.9 |
| Victims | 565 | 133 | 153 | 97 | 182 |
| Bullies | 587 | 140 | 155 | 111 | 181 |
| Both | 609 | 145 | 162 | 115 | 187 |
Figure 2. Average screen-time behaviours per day across the distribution of bullying perpetration, victimization, both perpetration/victimization, and non-involvement in bullying in Alberta, Canada, COMPASS Study (2013-2014)
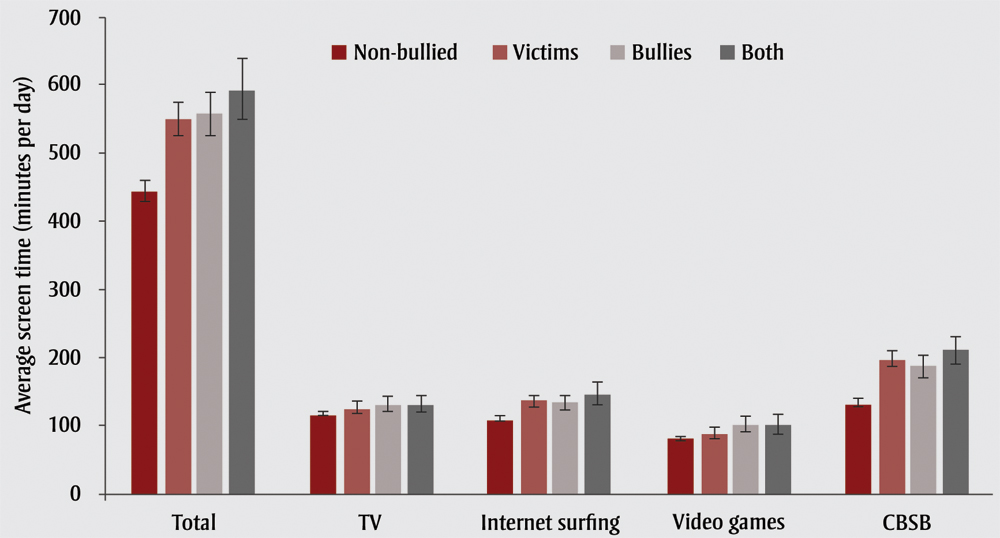
Abbreviation: CBSB, communication-based screen-time behaviours.
Text Description
| Group | Total | TV | Internet surfing | Video games | Communication-based screen-time behaviours |
|---|---|---|---|---|---|
| Non-bullied | 441 | 115 | 110 | 83 | 133 |
| Victims | 546 | 125 | 137 | 89 | 196 |
| Bullies | 552 | 130 | 134 | 102 | 186 |
| Both | 590 | 132 | 147 | 102 | 210 |
Separate random-intercept linear effects models for males in Ontario, females in Ontario, and total youth (males and females) in Alberta examined the associations between youth perception of the school environment, school connectedness, and bullying involvement (perpetration, victimization) and non-involvement (i.e., those who were neither bullied nor bully others) with multiple ST behaviours (Tables 3, 4, 5 and 6). Overall, higher perceived school connectedness was associated with lower ST across all groups (i.e., Ontario males, Ontario females, and total youth in Alberta). On the other hand, involvement in bullying, whether perpetration, victimization, or both, was associated with higher ST across all groups.
| Ontario males | ||||||||||
| Perception of school environment, school connectedness and involvement in bullying | TV | Video games | Internet surfing | Communication-based screen time | Total screen time | |||||
|---|---|---|---|---|---|---|---|---|---|---|
| Est. | 95% CI | Est. | 95% CI | Est. | 95% CI | Est. | 95% CI | Est. | 95% CI | |
| School connectedness | ||||||||||
| Close to people | – | – | – | – | – | – | 0.19 | 0.14 to 0.23 | 0.05 | 0.01 to 0.09 |
| Part of school | – | – | −0.10 | −0.13 to −0.06 | −0.08 | 0.02 to −0.12 | – | – | – | – |
| Happy at school | – | – | – | – | – | – | −0.08 | −0.13 to −0.04 | −0.06 | −0.10 to −0.02 |
| Fair teachers | – | – | – | – | – | – | −0.19 | −0.24 to −0.15 | −0.10 | −0.14 to −0.06 |
| Safe at school | −0.06 | −0.09 to −0.03 | – | – | – | – | – | – | −0.07 | −0.12 to −0.02 |
| Victims of bullying | ||||||||||
| Physical attacks | 0.25 | 0.14 to 0.35 | – | – | – | – | – | – | 0.33 | 0.19 to 0.48 |
| Verbal attacks | – | – | – | – | – | – | – | – | – | – |
| Cyber-attacks | – | – | – | – | 0.45 | 0.31 to 0.60 | 0.61 | 0.45 to 0.78 | 0.45 | 0.29 to 0.61 |
| Bullying perpetrators | ||||||||||
| Verbal attacks | – | – | – | – | – | – | −0.24 | −0.41 to −0.06 | – | – |
| Cyber-attacks | – | – | 0.25 | 0.03 to 0.46 | – | – | – | – | – | – |
| Property damage | – | – | 0.18 | −0.07 to 0.43 | – | – | – | – | – | – |
| Non-involvement in bullying | ||||||||||
| Did not get bullied | – | – | −0.14 | −0.20 to −0.08 | – | – | – | – | – | – |
| Did not bully | – | – | – | – | – | – | – | – | – | – |
Abbreviations: CI, confidence interval; Est., estimate. Note: Only variables that were statistically significant following backward stepwise elimination were included in the models. |
||||||||||
| Ontario females | ||||||||||
| Perception of school environment, school connectedness and involvement in bullying | TV | Video games | Internet surfing | Communication-based screen time | Total screen time | |||||
|---|---|---|---|---|---|---|---|---|---|---|
| Est. | 95% CI | Est. | 95% CI | Est. | 95% CI | Est. | 95% CI | Est. | 95% CI | |
| School connectedness | ||||||||||
| Close to people | – | – | – | – | – | – | 0.12 | 0.08 to 0.16 | 0.06 | 0.03 to 0.10 |
| Part of school | −0.06 | −0.09 to −0.03 | – | – | – | – | – | – | – | – |
| Happy at school | – | – | – | – | −0.12 | −0.16 to −0.09 | −0.08 | −0.13 to −0.04 | −0.13 | −0.17 to −0.09 |
| Fair teachers | – | – | – | – | – | – | −0.19 | −0.24 to −0.14 | −0.13 | −0.17 to −0.09 |
| Safe at school | −0.07 | −0.10 to −0.03 | – | – | −0.09 | −0.14 to −0.05 | −0.12 | −0.17 to −0.06 | −0.14 | −0.19 to −0.09 |
| Victims of bullying | ||||||||||
| Cyber-attacks | – | – | – | – | 0.21 | 0.12 to 0.29 | 0.49 | 0.37 to 0.61 | – | – |
| Bullying perpetrators | ||||||||||
| Cyber-attacks | – | – | – | – | – | – | 0.39 | 0.19 to 0.60 | – | – |
| Non-involvement in bullying | ||||||||||
| Did not get bullied | – | – | – | – | – | – | −0.19 | −0.27 to −0.11 | −0.17 | −0.25 to −0.10 |
| Did not bully | – | – | – | – | −0.20 | −0.28 to −0.13 | −0.21 | −0.31 to −0.10 | −0.30 | −0.39 to −0.21 |
Abbreviations: CI, confidence interval; Est., estimate. Note: Only variables that were statistically significant following backward stepwise elimination were included in the models. |
||||||||||
| Alberta males | ||||||||||
| Perception of school environment, school connectedness and involvement in bullying | TV | Video games | Internet surfing | Communication-based screen time | Total screen time | |||||
|---|---|---|---|---|---|---|---|---|---|---|
| Est. | 95% CI | Est. | 95% CI | Est. | 95% CI | Est. | 95% CI | Est. | 95% CI | |
| Victims of bullying | ||||||||||
| Cyber-attacks | – | – | – | – | – | – | 1.35 | 0.76 to 1.94 | – | – |
| Non-involvement in bullying | ||||||||||
| Did not get bullied | – | – | – | – | −0.37 | −0.56 to −0.17 | – | – | −0.25 | −0.48 to −0.02 |
| Did not bully | – | – | – | – | – | – | −0.48 | −0.75 to −0.21 | – | – |
Abbreviations: CI, confidence interval; Est., estimate. Note: Only variables that were statistically significant following backward stepwise elimination were included in the models. –: not applicable. |
||||||||||
| Alberta females | ||||||||||
| Perception of school environment, school connectedness and involvement in bullying | TV | Video games | Internet surfing | Communication-based screen time | Total screen time | |||||
|---|---|---|---|---|---|---|---|---|---|---|
| Est. | 95% CI | Est. | 95% CI | Est. | 95% CI | Est. | 95% CI | Est. | 95% CI | |
| School connectedness | ||||||||||
| Part of school | – | – | −0.24 | −0.37 to −0.10 | – | – | – | – | – | – |
| Victims of bullying | ||||||||||
| Cyber-attacks | – | – | – | – | – | – | 0.38 | 0.05 to 0.72 | 0.52 | 0.19 to 0.84 |
| Non-involvement in bullying | ||||||||||
| Did not get bullied | – | – | – | – | −0.17 | −0.34 to −0.00 | −0.45 | −0.69 to −0.21 | −0.28 | −0.50 to −0.07 |
| Did not bully | – | – | – | – | – | – | −0.32 | −0.60 to −0.03 | – | – |
Abbreviations: CI, confidence interval; Est., estimate. Note: Only variables that were statistically significant following backward stepwise elimination were included in the models. –: not applicable. |
||||||||||
Ontario males
Among males in Ontario, feeling happy and safe at school and perceiving teachers as fair was associated with significantly lower total ST. Males who felt safe at school reported lower TV viewing time and males who felt like they were part of their school reported less time playing video games and surfing the Internet. However, males who reported being close to people in their school spent more time in communication-based ST behaviours and accumulated more total ST.
Males who reported being attacked physically had significantly more TV viewing time and accumulated more total ST. Males who bullied others on the Internet and those who were responsible for damaging property or theft spent more time playing video games. Males who reported that they had engaged in verbal attacks against others spent significantly less time in communication-based ST behaviours. Males who were not bullied in any form reported significantly less time playing video games.
Ontario females
Among females in Ontario, feeling happy and safe at schools and perceiving teachers as fair was associated with significantly lower total ST. Females in Ontario who felt safe and part of their school reported lower TV viewing time. Females who reported being happy and safe at school reported less time surfing the internet. Feeling happy and safe at school and perceiving teachers as fair was further associated with fewer minutes per day spent in communication-based ST behaviours. Moreover, similar to the findings among males, feeling close to people at school was associated with significantly more communication-based ST behaviours and more total ST among females.
Females who reported cyber-attacks spent more time surfing the internet and in communication-based ST behaviours. Females who reported bullying others online also had significantly more communication-based ST behaviours. On the other hand, females who reported non-involvement in bullying (i.e., those who did not bully or get bullied) reported significantly lower ST. Females who reported that they did not bully spent less time surfing the internet, in communication-based ST behaviours, and accumulated lower total ST. Females who reported not being victims of bullying reported less time spent in communication-based ST behaviours and accumulated lower total ST.
Alberta youth
Females in Alberta who felt being part of their school reported significantly less time playing video games. Both females and males who reported cyber-attacks spent more time in communication-based ST behaviours, with females who reported cyber-attacks also accumulating more total ST. Females and males who reported that they had not bullied others spent significantly less time in communication-based ST behaviours. Females and males who were not bullied spent significantly less time surfing the Internet and accumulated lower total ST, with females who were not bullied also spending less time in communication-based ST behaviours
Discussion
The purpose of this study was to examine the association between perception of school environment, school connectedness, and involvement in bullying with multiple ST behaviours among youth in a large sample spread across two Canadian provinces. Our hypothesis that involvement in bullying and negative perceptions of school environment and school connectedness are associated with higher ST was supported.
Average ST reported among youth in both provinces was more than 7.5 hours per day, which corroborates a nationally representative sample of youth in Canada.Footnote 32 The high ST accumulation among youth is attributed to constant access and exposure to diverse ST devices, both at school and at home.Footnote 33 Thus, it is essential that studies capture the entire range of ST behaviours. Males spent significantly more time playing video games than females, whereas females spent significantly more time in communication-based ST behaviours and surfing the internet. These findings highlight the need for gendered interventions in reducing ST among youth.Footnote 33
Females in Ontario who felt like they were part of their school spent less time on average watching TV. Previous research suggests that time spent watching TV is associated with loneliness and lower social engagement.Footnote 34Footnote 35 Youth who report feeling integrated in their school may be more likely to be actively involved in school activities and thus have higher social engagement and lower TV time.
However, feeling close to people at school was associated with more communication-based ST behaviours, and higher total ST among both males and females in Ontario. These findings are in line with previous research that shows that communication-based ST behaviours (e.g., short messaging services, instant messages) have become the primary and preferred method of interpersonal communication among youth and are associated with efforts to enhance belonging.Footnote 36Footnote 37 This increase in communication-based ST behaviours could explain higher total ST among youth who feel closer to people at school. There appear to be obvious trade-offs in terms of various aspects of school connectedness and their relationship with different ST behaviours. Nevertheless, our models showed that both Ontario males and females who felt happy and safe at school and who perceived their teachers as being fair reported lower levels of multiple ST behaviours. This reiterates the point that a positive perception of the school environment and enhanced school connectedness could play an important role in minimizing ST among youth.
Bullying perpetration and victimization were both associated with increased ST among youth. Compared to youth who reported non-involvement in bullying, youth who were bullies, victims, and both bullies and victims spent on average more minutes per day in front of screens across all ST categories.
Prevalence of past-month involvement in bullying was approximately 20% among both females and males in Alberta and Ontario, which is similar to previously reported prevalence rates of bullying involvement in Canada.Footnote 38 Involvement in bullying differed between males and females by type of bullying behaviours. More males reported being victims and perpetrators of physical violence, perpetrators of verbal attacks, and perpetrators of property damage or theft. More females reported being victims of verbal attacks, and both victims and perpetrators of cyber-bullying. This evidence reiterates existing literature that suggests that males are more likely to engage in physical aggressions, whereas females tend to engage in bullying perpetration through social aggression.Footnote 38
One consistent pattern was that the victims of cyber-attacks were associated with more communication-based ST in all four cohorts. However, cyber-bullying perpetrators among Ontario females also had higher communication-based ST, which could potentially be explained by the evidence that females predominantly engage in bullying perpetration through social manipulation.Footnote 39
Females in both Ontario and Alberta spent significantly more time than males surfing the internet and in communication-based ST behaviour. Previous studies have also found that risk of cyber-bullying victimization is higher with more time spent on the internet, including more “chatting online.”Footnote 10Footnote 11 Cyber-bullying is different from other types of bullying in that it can occur anytime and anywhere through multiple digital devices. In addition, youth that engage in cyber-bullying perpetration are more likely to be involved in school bullying, either as a perpetrator or a victim.Footnote 11
Bullying perpetration through property damage and theft was associated with more time spent playing video games for males in Ontario. These findings are in line with Janssen et al.’sFootnote 10 prospective cohort study that found that video game use predicted physical violence among high school students.
Perhaps the most conclusive evidence of the strong association between bullying perpetration/victimization and ST behaviours is shown by the findings that among all four cohorts, non-involvement in bullying (i.e., youth who were not bullied or who did not bully) was associated with lower accumulation of multiple ST behaviours. ST behaviours are complex not only because they are enabled by a constant access to a range of multiple digital media devices (e.g., TV, desktop/laptop computers, tablets), but also because of the varied impact of each ST behaviour. For instance, both TV viewing and playing video games are associated with increased loneliness and poor social engagement,Footnote 13Footnote 32Footnote 33 with video games also being connected to physical violenceFootnote 10 and TV viewing to poor nutritional choices associated with obesity.Footnote 40Footnote 41
Communication-based ST behaviours are more complicated because although they correlate with social engagement and connections,Footnote 36 they are also associated with cyber-bullying.Footnote 10Footnote 11 Furthermore, there is gendered variation in ST behaviours, with males spending significantly more time playing video games and females spending significantly more time accumulating communication-based ST behaviours.
With consistently increasing dependence on the use of multiple ST devices among youth,Footnote 32 restricting access to ST devices is becoming exceedingly difficult. Different types of ST behaviours can be accumulated via access to various devices. For example, youth can watch TV, play video games, surf the internet, and communicate via texts, online messaging, or emails using laptops, desktops, tablets, and even smartphones – sometimes simultaneously. In this scenario, strategies to minimize ST should move beyond limiting access to ST devices.
It is theoretically difficult to argue a linear, unidirectional relationship between multiple ST behaviours and bullying, especially with evidence from a cross-sectional study. ST and bullying are complex behaviours that need to be studied with more robust study designs, and a systems science perspective to delineate if their relationship is causal or more complex.Footnote 42Footnote 43Footnote 44 Nevertheless, the evidence of an association between bullying, school connectedness, and ST, has policy implications for schools to address bullying perpetration and the prevalence of multiple screen-time behaviours.
With non-involvement in bullying showing a strong negative association with multiple ST behaviours, school policies to address both bullying and screen time could offer a novel approach in reducing harmful behaviours among youth. However, school policies should focus on improving youth perception of school environment and connectedness as this could enable pathways to prevent bullying and reduce ST.
Strengths and limitations
The major strength of the study is the sample size of schools and distribution of participants across two Canadian provinces who reported multiple ST behaviours. However, the modeling of multiple ST behaviours and the depiction as well as the interpretation of results can be challenging due to the large number of independent factors that need to be tested across different ST behaviours. Potential under reporting, recall bias, and missing data are the primary limitations of the study due to its reliance on self-reported surveys. Nevertheless, COMPASS survey measures specific to this study have previously demonstrated satisfactory reliability and validity.Footnote 29 Another limitation is the lack of context in terms of ST behaviours because we do not know the type of digital devices that youth were using to accumulate different types of ST behaviours and where they are using these devices (e.g., home, school). It is important to understand the nuances and distribution of ST behaviours across different devices and physical contexts to tailor ST reduction policy interventions.
Adapted ST surveys that capture the variation of ST behaviours accumulated over different types of screens or devices and ecological momentary assessments deployed through smartphones could provide the device and physical context lacking in current evidence.Footnote 45 Smartphone-based studies could also reduce recall bias and measure objective smartphone ST behaviour.Footnote 46 Finally, since this study is cross-sectional in nature, causal inferences cannot be made and there may be pathways through which more ST could result in greater exposure to bullying, especially when it comes to the association of computer usage and video games with physical violenceFootnote 10 and the risk of online victimization.Footnote 11
Conclusion
This study is the first to simultaneously examine the association between involvement in bullying, youth perception of school environment/school connectedness, and multiple ST behaviours. Our findings suggest that school policies should focus on improving school connectedness and target both bullying and screen time to maximize the reduction of these complex harmful behaviours.
Acknowledgments
The COMPASS study was supported by a bridge grant from the Canadian Institutes of Health Research’s Institute of Nutrition, Metabolism and Diabetes through the "Obesity - Interventions to Prevent or Treat" priority funding awards (OOP-110788; grant awarded to S. Leatherdale) and an operating grant from the Canadian Institutes of Health Research’s Institute of Population and Public Health (MOP-114875; grant awarded to S. Leatherdale). We acknowledge Chad Bredin, the Project Manager of COMPASS, for enabling data acquisition and processing.
Conflicts of interest
Apart from Dr. Leatherdale being the CIHR-PHAC Chair in Applied Public Health Research, and an Associate Scientific Editor with Health Promotion and Chronic Disease Prevention in Canada: Research, Policy and Practice, we declare that no other conflicts of interest exist.
Authors’ contributions and statement
TRK conceptualized the study, interpreted the data and drafted the paper. AST and RL interpreted the data and drafted the paper. WQ analyzed the data and drafted the paper. STL designed the study, and acquired and interpreted the data. All authors revised the paper and approved its final version.
The content and views expressed in this article are those of the authors and do not necessarily reflect those of the Government of Canada.
References
- Footnote 1
-
Tremblay MS, LeBlanc AG, Janssen I, Kho ME, Hicks A, Murumets K, et al. Canadian sedentary behaviour guidelines for children and youth. Appl Physiol Nutr Metab. 2011;36(1):59-64;65-71.
- Footnote 2
-
Tremblay MS, LeBlanc AG, Kho ME, Saunders TJ, Larouche R, Colley RC, et al. Systematic review of sedentary behaviour and health indicators in school-aged children and youth. Int J Behav Nutr Phys. 2011;21(8):98.
- Footnote 3
-
Lenhart A. Teens, smartphones & texting. Pew Internet & American Life Project. 2012;19:1-34.
- Footnote 4
-
Strasburger VC, Hogan MJ. Children, Adolescents, and the Media. Pediatr. 2013; 132:958-61.
- Footnote 5
-
Mark AE, Janssen I. Relationship between screen time and metabolic syndrome in adolescents.J Public Health. 2008;30(2):153-60.
- Footnote 6
-
Bener A, Al-Mahdi HS, Vachhani PJ, Al-Nufal M, Ali AI. Do excessive internet use, television viewing and poor lifestyle habits affect low vision in school children? J Child Health Care. 2010;14(4):375-85.
- Footnote 7
-
Carson V, Pickett W, Janssen I. Screen time and risk behaviors in 10- to 16-year-old Canadian youth. Prev Med. 2011;52(2):99-103.
- Footnote 8
-
Maras D, Flament MF, Murray M, Buchholz A, Henderson KA, Obeid N, et al. Screen time is associated with depression and anxiety in Canadian youth. Prev Med. 2015;73:133-38.
- Footnote 9
-
Bai Y, Chen S, Laurson KR. The associations of youth physical activity and screen time with fatness and fitness: The 2012 NHANES National Youth Fitness Survey. PloS One. 2016;11(1):e0148038.
- Footnote 10
-
Janssen I, Boyce WF, Pickett W. Screen time and physical violence in 10 to 16-year-old Canadian youth. Int J Public Health. 2012;57(2):325-31
- Footnote 11
-
Mishna F, Khoury-Kassabri M, Gadalla T, Khoury-Kassabrib M, Gadallaa T, Daciuka J. Risk factors for involvement in cyber bullying: victims, bullies and bully-victims. Child Youth Serv Rev. 2012;34(1):63-70.
- Footnote 12
-
Mathers M, Canterford L, Olds T, Hesketh K, Ridley K, Wake M. Electronic media use and adolescent health and well-being: cross-sectional community study. Acad Pediatr. 2009;9(5):307-14.
- Footnote 13
-
Rosen LD, Lim AF, Felt J, Carrier LM, Cheever NA, Lara-Ruiz JM, et al. Media and technology use predicts ill-being among children, preteens and teenagers independent of the negative health impacts of exercise and eating habits. Comput Human Behav. 2014;34:365-74.
- Footnote 14
-
Ttofi MM, Farrington DP. Effectiveness of school-based programs to reduce bullying: a systematic and meta-analytic review. J Exp Criminol. 2011;7(1):27-56.
- Footnote 15
-
Due P, Holstein BE, Lynch J, Diderichsen F, Gabhain SN, Scheidt P, et al. Bullying and symptoms among school-aged children: international comparative cross sectional study in 28 countries. Eur J P Health. 2015;15(2):128-32.
- Footnote 16
-
Craig W, Harel-Fisch Y, Fogel-Grinvald H, Dostaler S, Hetland J, Simons-Morton B, et al. A cross-national profile of bullying and victimization among adolescents in 40 countries. Int J Public Health. 2009:54(2):216-24.
- Footnote 17
-
McDougall P, Vaillancourt T. Long-term adult outcomes of peer victimization in childhood and adolescence: pathways to adjustment and maladjustment. Am Psychol. 2015;70(4):300-10.
- Footnote 18
-
Lereya ST, Winsper C, Heron J, Lewis G, Gunnell D, Fisher HL, et al. Being bullied during childhood and the prospective pathways to self-harm in late adolescence.J Am Acad Child Adolesc Psychiatry. 2013;52(6):608-18.
- Footnote 19
-
Hertz MF, Everett Jones S, Barrios L, David-Ferdon C, Holt M. Association between bullying victimization and health risk behaviors among high school students in the United States. J Sch Health. 2015;5(12):833-42.
- Footnote 20
-
Antoniadou N, Kokkinos CM. Cyber and school bullying: same or different phenomena? Aggress Violent Behav. 2015;25:363-72.
- Footnote 21
-
Låftman SB, Modin B, Östberg V. Cyberbullying and subjective health: a large-scale study of students in Stockholm, Sweden. Child Youth Serv. Rev. 2013;35(1):112-19.
- Footnote 22
-
Pearce N, Cross D, Monks H, Waters S, Falconer S. Current evidence of best practice in whole-school bullying intervention and its potential to inform cyberbullying interventions. Aust. J. Guid. Couns. 2011;21(1):1-21.
- Footnote 23
-
Currie C, Zanotti C, Morgan A. Health behaviour in school-aged children (HBSC) study: international report from the 2009/2010 survey. Copenhagen: WHO Regional Office for Europe; 2012.
- Footnote 24
-
Richard JF, Schneider BH, Mallet P. Revisiting the whole-school approach to bullying: Really looking at the whole school. Sch Psychol Int. 2012;33(3):263-84.
- Footnote 25
-
Katapally TR, Laxer RE, Qian W, Leatherdale ST. Do school physical activity policies and programs have a role in decreasing multiple screen time behaviours among youth? Prev Med. 2018;110:106-113. doi: 10.1016/j.ypmed.2017.11.026.
- Footnote 26
-
Katapally TR, Muhajarine N. Capturing the interrelationship between objectively measured physical activity and sedentary behaviour in children in the context of diverse environmental exposures. Int J Environ Res Public Health. 2015;12(9):10995-1011.
- Footnote 27
-
Katapally TR, Rainham D, Muhajarine N. The influence of weather variation, urban design and built environment on objectively measured sedentary behaviour in children. AIMS Public Health. 2016;3(4):663-81.
- Footnote 28
-
Leatherdale ST, Brown KS, Carson V, Childs RA, Dubin JA, Elliott SJ, et al. The COMPASS study: a longitudinal hierarchical research platform for evaluating natural experiments related to changes in school-level programs, policies and built environment resources. BMC Public Health. 2014;8(14):331.
- Footnote 29
-
Environment Canada. Climate Database [Internet]. [Cited 15 August 2017]. Available from: http://climate.weather.gc.ca/
- Footnote 30
-
Leatherdale ST, Harvey A. Examining communication-and media-based recreational sedentary behaviors among Canadian youth: results from the COMPASS study. Prev Med. 2015;74:74-80.
- Footnote 31
-
Leatherdale ST, Laxer RE, Faulkner G. Reliability and validity of the physical activity and sedentary behaviour measures in the COMPASS study. COMPASS Technical Report Series. 2014;(2):1-16.
- Footnote 32
-
Leatherdale ST, Ahmed R. Screen-based sedentary behaviours among a nationally representative sample of youth: are Canadian kids couch potatoes? Chronic Dis Inj Can. 2011;31(4):141-46.
- Footnote 33
-
Rideout V. The common sense census: Media use by tweens and teens. San Francisco: Common Sense Media; 2015. Available from: https://www.commonsensemedia.org.
- Footnote 34
-
Bickham DS, Rich M. Is television viewing associated with social isolation? Roles of exposure time, viewing context, and violent content. Arch Pediatr Adolesc Med. 2006;160(4):387-92.
- Footnote 35
-
Primack BA, Swanier B, Georgiopoulos AM, Land SR, Fine MJ. Association between media use in adolescence and depression in young adulthood: a longitudinal study. Arch Gen Psychiatry. 2009;66(2):181-88.
- Footnote 36
-
Skierkowski D, Wood RM. To text or not to text? The importance of text messaging among college-aged youth. Comput Human Behav. 2012;28(2):744-56.
- Footnote 37
-
Walsh SP, White KM, Young RM. The phone connection: a qualitative exploration of how belongingness and social identification relate to mobile phone use amongst Australian youth. J Community Appl Soc Psychol. 2009;19(3):225-40.
- Footnote 38
-
Nansel TR, Craig W, Overpeck MD, Saluja G, Ruan WJ, Health Behaviour in School-aged Children Bullying Analyses Working Group. Cross-national consistency in the relationship between bullying behaviors and psychosocial adjustment. Arch Pediatr AdolescMed. 2004;58(8):730-36.
- Footnote 39
-
Graham S. Victims of bullying in schools. Theor Pract. 2016;55(2):136-44.
- Footnote 40
-
Vandewater EA, Park SE, Hébert ET, Cummings HM. Time with friends and physical activity as mechanisms linking obesity and television viewing among youth. Int J Behav Nutr Phys Act. 2015;12(1):S6.
- Footnote 41
-
Borghese MM, Tremblay MS, Leduc G, Boyer C, Bélanger P, LeBlanc AG, et al. Television viewing and food intake during television viewing in normal-weight, overweight and obese 9-to 11-year-old Canadian children: a cross-sectional analysis. J Nutr Sci. 2015;4:e8.
- Footnote 42
-
Lich KH, Finexi EM, Osgood ND, Mabry PL. A call to address complexity in prevention science research. Prev Sci. 2013;14:279-89.
- Footnote 43
-
Roux AV. Complex systems thinking and current impasses in health disparities research. Am J Pub Health. 2011;101(9):1627-34.
- Footnote 44
-
Pearce N, Merletti F. Complexity, simplicity, and epidemiology. Int J Epidemiol. 2006;35:515-19
- Footnote 45
-
Stone AA, Schwartz JE, Neale JM, Shiffman S, Marco CA, Hickcox M, et al. A comparison of coping assessed by ecological momentary assessment and retrospective recall. J Pers Soc Psychol. 1998;74(6);1670-80.
- Footnote 46
-
Biddle SJ, Gorely T, Marshall SJ, Cameron N. The prevalence of sedentary behavior and physical activity in leisure time: a study of Scottish adolescents using ecological momentary assessment. Prev Med. 2009;48(2):151-55.