
Original quantitative research – Breast cancer detection method, diagnostic interval and use of specialized diagnostic assessment units across Ontario, Canada
Health Promotion and Chronic Disease Prevention in Canada
Li Jiang, MScAuthor reference 1Author reference 2; Julie Gilbert, PhDAuthor reference 3; Hugh Langley, MDAuthor reference 4; Rahim Moineddin, PhDAuthor reference 5; Patti A. Groome, PhDAuthor reference 1Author reference 2
https://doi.org/10.24095/hpcdp.38.10.02
This article has been peer reviewed.
Author references:
- Author reference 1
-
Division of Cancer Care and Epidemiology, Cancer Research Institute, Queen's University, Kingston, Ontario, Canada
- Author reference 2
-
Institute for Clinical Evaluative Sciences, Toronto, Ontario, Canada
- Author reference 3
-
Cancer Care Ontario, Toronto, Ontario, Canada
- Author reference 4
-
South East Regional Cancer Program, Kingston General Hospital, Kingston, Ontario, Canada
- Author reference 5
-
Department of Family and Community Medicine, University of Toronto, Toronto, Ontario, Canada
Correspondence: Patti A. Groome, Division of Cancer Care and Epidemiology, Cancer Research Institute at Queen's University, 10 Stuart St., Level 2, Kingston ON K7L 3N6; Tel: 613-533-6000 ext. 78512; Fax: 613-533-6794; Email: groomep@queensu.ca
Abstract
Introduction: Breast cancer is detected through screening or through signs and symptoms. In Canada, mammograms for breast cancer screening are offered in organized programs or independently (opportunistic screening). Province of Ontario breast Diagnostic Assessment Units (DAUs) are facility-based programs that provide coordinated breast cancer diagnostic services, as opposed to usual care, in which the primary care provider arranges the tests and consultations. This study describes breast cancer detection method, diagnostic interval and DAU use across Ontario.
Methods: The study cohort consisted of 6898 women with invasive breast cancer diagnosed in 2011. We used the Ontario Cancer Registry linked to administrative health care databases. We determined the detection method using the Ontario Breast Screening Program (OBSP) data and physician claims. The diagnostic interval was the time between the initial screen, specialist referral or first diagnostic test and the cancer diagnosis. The diagnostic route (whether through DAU or usual care) was determined based on the OBSP records and biopsy or surgery location. We mapped the diagnostic interval and DAU coverage geographically by women's residence.
Results: In 2011, 36% of Ontario breast cancer patients were screen-detected, with a 48% rate among those aged 50 to 69. The provincial median diagnostic interval was 32 days, with county medians ranging from 15 to 65 days. Provincially, 48.4% were diagnosed at a DAU, and this ranged from zero to 100% across counties.
Conclusion: The screening detection rate in age-eligible breast cancer patients was lower than published population-wide screening rates. Geographic mapping of the diagnostic interval and DAU use reveals regional variations in cancer diagnostic care that need to be addressed.
Keywords: breast neoplasms/diagnosis, female, diagnostic services, early detection of cancer, early diagnosis, cross-sectional studies, health services research
Highlights
- In 2011, 48.4% of female breast cancer patients in Ontario who were age-eligible for screening had their cancers detected through screening.
- The median time to breast cancer diagnosis was 4.6 weeks.
- There was substantial geographic variation in the diagnostic interval and in the use of Diagnostic Assessment Unit (DAU) services across Ontario.
Introduction
Screening is important for achieving an early diagnosis of cancer and thereby improving the chance of survival.Footnote 1 In Canada, mammograms for breast cancer screening are offered by organized programs or independently (opportunistic screening).Footnote 2 The breast screening participation rate in the screen-eligible population is viewed as an important indicator of a screening program's effectiveness and is routinely monitored by organized programs.Footnote 3 But a high screening participation rate does not necessarily mean that all breast cancers are detected by the screening program. In fact, many are detected when the patient presents to her doctor with breast cancer signs or symptoms.Footnote 4 Documentation of the proportion of breast cancer patients detected by screening (vs. symptomatic presentation) is lacking.
The breast cancer diagnostic period is characterized by multiple appointments for diagnostic tests and consultations and it often provokes considerable distress and anxiety for women and their families.Footnote 5Footnote 6Footnote 7 A diagnostic delay of three months or more can lead to advanced cancer stage and lower chances of survival.Footnote 8 The 2007 guideline for monitoring breast screening program performance recommended 90% of abnormal screening results should be resolved within 5 weeks, or within 7 weeks if a tissue (core or open) biopsy is required.Footnote 9 Consequently, the time interval from an abnormal screen to a final diagnosis is routinely assessed against the national targets by organized programs. In 2011, the Ontario Breast Screening Program (OBSP) reported significant regional variation in meeting the national timeliness target for women with abnormal screens.Footnote 3 However, little is known about the length of the diagnostic interval at the population level and whether it varies in different regions of the province.
Ontario Diagnostic Assessment Units (DAUs) are innovative, facility-based programs designed to improve the timeliness and quality of diagnostic care services.Footnote 7 Similar initiatives exist in many jurisdictions around the world.Footnote 10Footnote 11 Ontario breast DAUs take two forms: organized Breast Assessment Affiliates (BAAs),Footnote 12 and regionally developed breast assessment centres. Diagnostic care at BAAs is provided by a multidisciplinary health care team that includes a nurse navigator who coordinates the process. This differs from the usual care diagnostic route (UC) where the patient's primary care provider plays a central role in arranging referrals and recommending appropriate diagnostic assessments and specialist consultations.Footnote 12Footnote 13Footnote 14 The nurse navigator also provides patient psychological and informational support. Each designated facility has to meet minimum organizational criteria regarding breast cancer diagnostic service resources and availability to maintain its BAA status.Footnote 13 The diagnostic process at regional breast assessment centres is less well documented, but those centres have similar goals and structures to those of the BAAs.
This study aimed to describe, among all Ontario breast cancer patients: 1) the cancer detection method; 2) the length of the diagnostic interval and its geographic pattern; and 3) the coverage of DAU services and its geographic pattern. This is one of three reports arising from our population-based study on DAU use and the diagnostic interval.Footnote 14Footnote 15Footnote 16
Methods
Study population
The study population consisted of women with a first primary invasive breast cancer diagnosed in 2011 in Ontario, Canada. We excluded: 1) those whose cancer registry record could not be linked to administrative data; 2) those who were living outside of Ontario at the time of diagnosis; and 3) those who did not have Ontario Health Insurance Plan (OHIP) coverage for at least three years prior to diagnosis.Footnote 14Footnote 15
Data sources
Study data included the Ontario Cancer Registry linked to administrative databases at the Institute for Clinical Evaluative Sciences (ICES) and Cancer Care Ontario (CCO). We used the Ontario Cancer Registry to identify breast cancer cases and determine the date of diagnosis. The Collaborative Stage Data provided information on cancer stage and histology. We defined stage at diagnosis using the TNM classification, 7th edition.Footnote 17Footnote 18 The OBSP database provides information on screening date, screening test results and use of BAAs. The OHIP claims database, the National Ambulatory Care Reporting System (NACRS), the Canadian Institute for Health Information Discharge Abstract Database (CIHI-DAD) and the Same-Day Surgery Database (CIHI-SDS) contain information on breast cancer diagnostic procedures and associated dates and physicians. A list of BAA hospitals was provided by the OBSP and we developed a separate list of regional breast assessment centres by conducting an email survey among CCO Regional Primary Care Leads and OBSP Regional Program Managers.
Detection method, diagnostic interval and DAU use definitions
We determined screen-detected cancers by looking back 12 months from the date of the cancer diagnosis for abnormal OBSP screens and 6 months for opportunistic screens. We assumed a patient presented with signs or symptoms if her cancer was not screen-detected. We shortened the look-back time window to 6 months from 12 months when identifying opportunistic screens because those screens were identified using billing claims, which do not contain test results (which were available in the OBSP database). This 6-month window was based on Canadian guideline evidenceFootnote 9Footnote 19 and our observation that fewer than 5% of abnormal OBSP screens occurred in the 6 to 12 months before diagnosis.Footnote 15
We defined the diagnostic interval as the number of days from the date of the cancer diagnosis back to the initial screen, or referral to a specialist or the first diagnostic test in the absence of a screening test (Figure 1). This strategy is an adaptation of one used in colorectal cancer.Footnote 20 The cancer diagnosis date was contained in the Ontario Cancer Registry and is normally the first occurrence of a histology- or cytology-confirmed malignancy or a hospital admission or outpatient consultation. The diagnostic interval was analyzed as both a continuous and a dichotomous outcome at 7 weeks, with the latter based on the longer of the two timeliness targets mentioned above.Footnote 9Footnote 19
Figure 1. Measurement of the breast cancer diagnostic interval
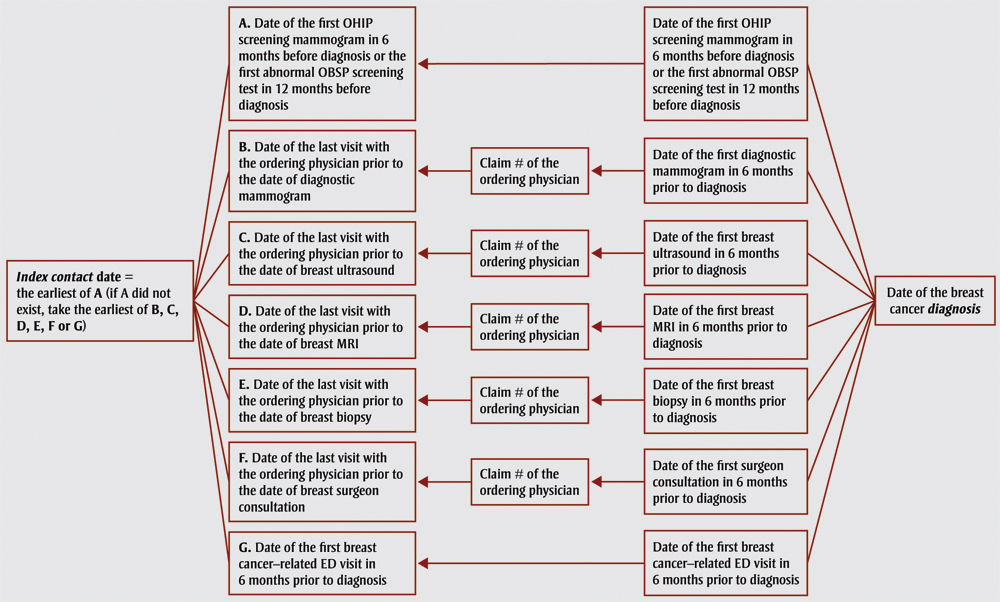
Source: Based on methodology outlined in Singh et al.20
Text Description
We defined the diagnostic interval as the number of days from the date of the cancer diagnosis back to the initial screen, or referral to a specialist or the first diagnostic test in the absence of a screening test. This figure is a flow chart illustrating this process and is replicated in the table below:
| Index contact date | Visit date | Claim | Treatment date | Date of diagnosis |
|---|---|---|---|---|
| Index contact date = the earliest of A (if A did not exist, take the earliest of B, C, D, E, F or G) | A. Date of the first OHIP screening mammogram in 6 months before diagnosis or the rst abnormal OBSP screening test in 12 months before diagnosis | N/A | Date of the first OHIP screening mammogram in 6 months before diagnosis or the first abnormal OBSP screening test in 12 months before diagnosis | Date of the breast cancer diagnosis |
| Index contact date = the earliest of A (if A did not exist, take the earliest of B, C, D, E, F or G) | B. Date of the last visit with the ordering physician prior to the date of diagnostic mammogram | Claim # of the ordering physician | Date of the first diagnostic mammogram in 6 months prior to diagnosis | Date of the breast cancer diagnosis |
| Index contact date = the earliest of A (if A did not exist, take the earliest of B, C, D, E, F or G) | C. Date of the last visit with the ordering physician prior to the date of breast ultrasound | Claim # of the ordering physician | Date of the first breast ultrasound in 6 months prior to diagnosis | Date of the breast cancer diagnosis |
| Index contact date = the earliest of A (if A did not exist, take the earliest of B, C, D, E, F or G) | D. Date of the last visit with the ordering physician prior to the date of breast MRI | Claim # of the ordering physician | Date of the first breast MRI in 6 months prior to diagnosis | Date of the breast cancer diagnosis |
| Index contact date = the earliest of A (if A did not exist, take the earliest of B, C, D, E, F or G) | E. Date of the last visit with the ordering physician prior to the date of breast biopsy | Claim # of the ordering physician | Date of the first breast biopsy in 6 months prior to diagnosis | Date of the breast cancer diagnosis |
| Index contact date = the earliest of A (if A did not exist, take the earliest of B, C, D, E, F or G) | F. Date of the last visit with the ordering physician prior to the date of breast surgeon consultation | Claim # of the ordering physician | Date of the first surgeon consultation in 6 months prior to diagnosis | Date of the breast cancer diagnosis |
| Index contact date = the earliest of A (if A did not exist, take the earliest of B, C, D, E, F or G) | G. Date of the first breast cancer-related ED visit in 6 months prior to diagnosis | N/A | Date of the first breast cancer-related ED visit in 6 months prior to diagnosis | Date of the breast cancer diagnosis |
We determined DAU use for patients who had an initial screen within the OBSP (OBSP patients) separately from the rest, because the OBSP has a database that tracks the use of the Breast Assessment Affiliates. The OBSP patients were considered to be diagnosed through a DAU if they had either an OBSP BAA payment record or a biopsy/surgery performed at a DAU hospital. Otherwise, they were considered to be diagnosed through the UC. The remaining patients (opportunistically screened and symptomatic patients) were considered to be diagnosed through a DAU if they had a biopsy/surgery performed at a DAU hospital. We validated this strategy using the OBSP record as the criterion standard and found that using the biopsy/surgery hospital had a sensitivity of 90.1% and a specificity of 84.6%.Footnote 15
Statistical analysis
We used proportions to describe the breast cancer screening detection rates and DAU use. Screening detection rates were categorized into three age groups (< 50 years, 50–69 years, > 69 years) based on the most recent Canadian guideline at the time of this study, although the updated guideline increased the upper age limit for screening to 74 in November of 2011.Footnote 21 We report the median diagnostic interval because its distribution is right-skewed. We report the diagnostic interval and DAU coverage by Local Health Integration Network (LHIN) and by county, both based on the patient's residence location at diagnosis. The county-level diagnostic interval was categorized for mapping purposes with category cut-points chosen to ensure a reasonable number of counties within each category. DAU service coverage was also categorized for mapping. To assess whether adjacent counties could be combined, we calculated a spatial autocorrelation on the diagnostic interval using the Global Moran's I statistic, which takes the values between −1 (perfect spatial dispersion) to 1 (perfect spatial clustering), with 0 representing a random geographic pattern.Footnote 22 For the county-level analysis, we conducted univariable and multivariable median regressions to assess the unadjusted and stage-adjusted geographic variation in the diagnostic interval because earlier stage at diagnosis has repeatedly been shown to be associated with a longer diagnostic interval.Footnote 23 We received ethics approval from the Health Sciences and Affiliated Teaching Hospitals Research Ethics Board at Queen's University at Kingston, Ontario, Canada.
Results
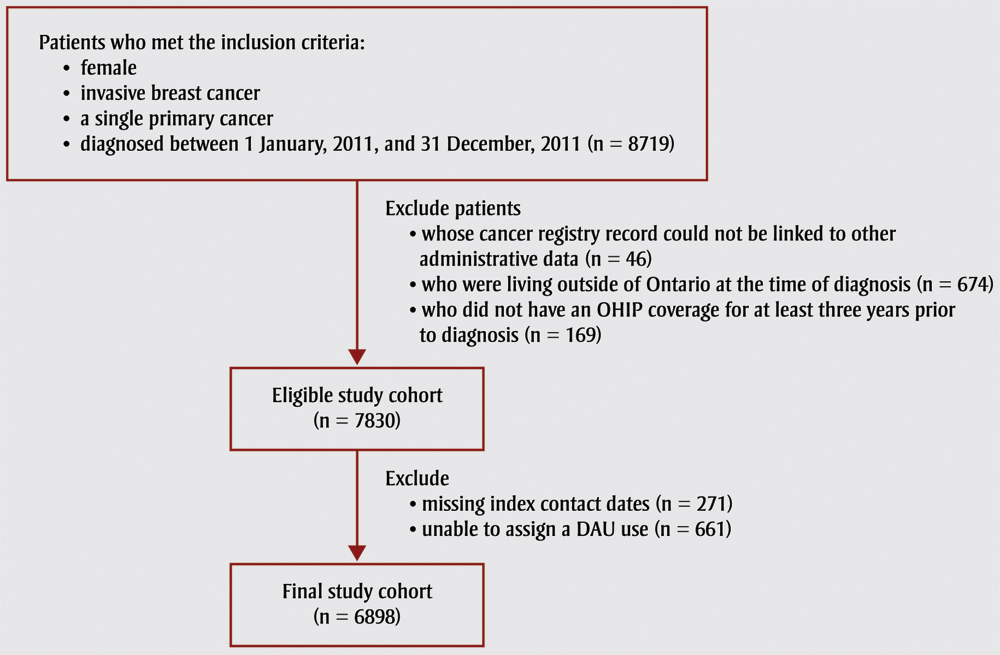
The final cohort size was 6898. The flow chart depicting the cohort selection process is shown in Figure 2. The mean age was 61.2 (SD: 13.5).
Figure 2. Cohort selection process
Text Description
The final cohort size was 6898. The flow chart depicting the cohort selection process is shown in this figure, as follows:
Patients who met the inclusion criteria:
- female
- invasive breast cancer
- a single primary cancer
- diagnosed between 1 January, 2011, and 31 December, 2011 (n = 8719)
Patients excluded
- whose cancer registry record could not be linked to other administrative data (n = 46)
- who were living outside of Ontario at the time of diagnosis (n = 674)
- who did not have an OHIP coverage for at least three years prior to diagnosis (n = 169)
Eligible study cohort (n = 7830)
Further exclusions
- missing index contact dates (n = 271)
- unable to assign a DAU use (n = 661)
Final study cohort (n = 6898)
Of the 6898 patients, 2499 (36.2%) were screen-detected and 4399 (63.8%) were symptomatic. Table 1 reports screening detection rates by age group. Of screen-detected patients, 1986 (79.5%) were screened via the OBSP and 513 (20.5%) were screened opportunistically.
| Age group | Screen-detected | Symptomatic |
|---|---|---|
| Total (row %) | Total (row %) | |
| < 50 years | 158 (11.1) | 1270 (88.9) |
| 50–69 years | 1736 (48.4) | 1851 (51.6) |
| > 69 years | 605 (32.1) | 1278 (67.9) |
| All ages (total) | 2499 (36.2) | 4399 (63.8) |
The provincial median time to diagnosis was 32 days (interquartile range: 17–60). Sixty-eight percent of breast cancer patients were diagnosed within the 7-week target, while 10% waited 107 days or more. Nearly half (48.4%) of patients were diagnosed at a DAU.
Table 2 describes the diagnostic interval and DAU use by LHIN. The median diagnostic interval ranged from 24 days (95% CI: 20.6–27.4) in the South East LHIN to 41 days (95% CI: 34.7–47.3) in the North West LHIN (p < .001). The percent of women diagnosed through a DAU varied from 2.6% (95% CI: 0.7%–4.6%) in the North Simcoe Muskoka LHIN to 93% (95% CI: 90.2%– 95.8%) in the South East LHIN (p < .001), reflecting regional differences in DAU availability.
| LHIN | n | Diagnostic interval median (95% CI) | DAU coverage rateTable 2 Footnote a (95% CI) |
|---|---|---|---|
| Erie St. Clair | 412 | 27.5 (25.1–30.0) | 81.6 (77.8–85.3) |
| South West | 594 | 35.0 (30.6–39.4) | 81.6 (78.5–84.8) |
| Waterloo Wellington | 380 | 30.0 (27.9–32.1) | 51.3 (46.3–56.3) |
| Hamilton Niagara Haldimand Brant | 697 | 29.0 (27.7–30.3) | 53.4 (49.7–57.1) |
| Central West | 311 | 37.0 (33.7–40.3) | 12.9 (9.1–16.6) |
| Mississauga Halton | 571 | 36.0 (32.4–39.6) | 29.1 (25.3–32.8) |
| Toronto Central | 553 | 34.0 (30.8–37.2) | 37.4 (33.4–41.5) |
| Central | 863 | 36.0 (33.3–38.7) | 21.2 (18.5–23.9) |
| Central East | 740 | 35.5 (34.3–36.6) | 38.0 (34.5–41.5) |
| South East | 315 | 24.0 (20.6–27.4) | 93.0 (90.2–95.8) |
| Champlain | 758 | 29.0 (27.8–30.2) | 69.5 (66.2–72.8) |
| North Simcoe Muskoka | 266 | 29.8 (23.7–35.8) | 2.6 (0.7–4.6) |
| North East | 316 | 28.0 (25.3–30.7) | 45.6 (40.1– 51.1) |
| North West | 120 | 41.0 (34.7–47.3) | 80.8 (73.8–87.9) |
| Unknown/shared LHINs | — | — | — |
Abbreviations: CI, confidence interval; DAU, diagnostic assessment unit; ICES, Institute for Clinical Evaluative Services; LHIN, Local Health Integration Network. Note: — indicates cells with counts less than 10, which were not reported due to ICES privacy regulations.
|
|||
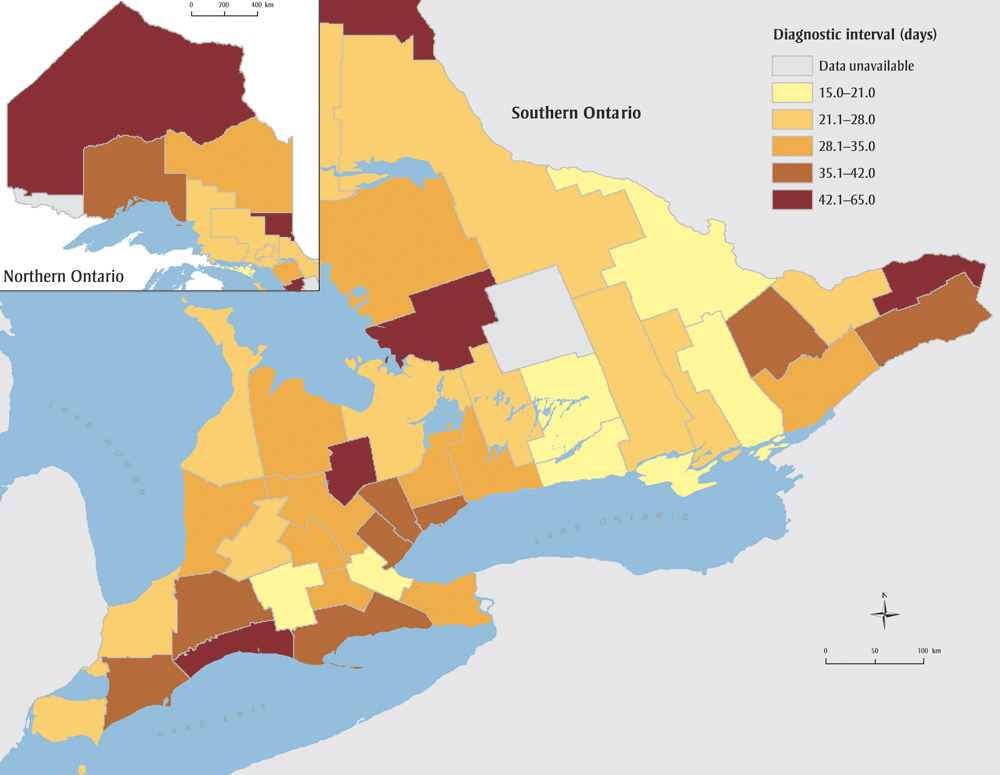
Figure 3 further maps the median diagnostic interval across Ontario counties. There was no evidence of a spatial correlation in the diagnostic interval (Global Moran's I = −0.02, p = .95), indicating that grouping neighbouring counties, as is done when reporting by LHIN, masks variation. Counties with the longest diagnostic intervals were scattered across the province, and patients in the most populous area (Greater Toronto Area) experienced waits in the second longest category. As Table 3 shows, 13 counties out of 47 (two counties with small numbers are not reported) had a median diagnostic interval greater than 7 weeks, and the median ranged from 15 days (95% CI: 7.6–22.4) to 65 days (95% CI: 39.6–90.4). This variation did not materially change with stage adjustment (results not shown).
Figure 3. Length of diagnostic interval among breast cancer patients across counties, Ontario, Canada, 2011
Text Description
| County | Diagnostic interval, in days (95% confidence interval) |
|---|---|
| Brant County | 31.0 (23.8–38.2) |
| Bruce County | 21.9 (14.6–29.2) |
| Dufferin County | 46.9 (32.5–61.3) |
| Elgin County | 49.0 (36.2–61.8) |
| Essex County | 25.0 (20.8–29.2) |
| Frontenac County | 21.0 (17.7–24.3) |
| Grey County | 30.0 (23.3–36.7) |
| Haldimand-Norfolk Regional Municipality | 37.8 (32.6–43.0) |
| Haliburton County | — |
| Halton Regional Municipality | 36.0 (30.1–41.9) |
| Hastings County | 22.0 (16.4–27.6) |
| Huron County | 30.1 (18.0–42.3) |
| Chatham-Kent Division | 40.5 (23.9–57.1) |
| Lambton County | 25.4 (15.5–35.3) |
| Lanark County | 38.0 (30.5–45.5) |
| Leeds and Grenville United Counties | 31.7 (26.1–37.3) |
| Lennox and Addington County | 27.0 (9.5–44.5) |
| Toronto Division | 38.0 (36.0–40.0) |
| Middlesex County | 42.0 (36.6–47.4) |
| Muskoka District Municipality | 65.0 (39.6–90.4) |
| Niagara Regional Municipality | 35.0 (31.3–38.7) |
| Northumberland County | 20.0 (13.7–26.3) |
| Durham Regional Municipality | 33.0 (28.6–37.4) |
| Ottawa Division | 28.0 (24.2–31.8) |
| Oxford County | 16.4 (10.7–22.1) |
| Peel Regional Municipality | 37.0 (34.0–40.0) |
| Perth County | 23.0 (15.5–30.5) |
| Peterborough County | 20.0 (14.3–25.7) |
| Prescott and Russell United Counties | 48.7 (36.9–60.5) |
| Prince Edward Division | 15.0 (7.6–22.4) |
| Renfrew County | 15.0 (6.8–23.2) |
| Simcoe County | 24.0 (19.4–28.6) |
| Stormont, Dundas, Glengary United Counties | 40.8 (32.3–49.2) |
| Kawartha Lakes Division | 23.0 (10.6–35.4) |
| Waterloo Regional Municipality | 30.0 (26.8–33.2) |
| Wellington County | 32.0 (27.5–36.5) |
| Hamilton Division | 19.7 (16.5–22.9) |
| York Regional Municipality | 32.0 (28.8–35.2) |
| Algoma District | 24.0 (13.5–34.5) |
| Cochrane District | 35.0 (28.0–41.9) |
| Kenora District | 50.0 (30.8–69.2) |
| Manitoulin District | 19.7 (6.3–33.2) |
| Nipissing District | 22.0 (13.2–30.8) |
| Parry Sound District | 32.5 (19.6–45.3) |
| Rainy River District | — |
| Greater Sudbury Division | 24.0 (18.1–29.9) |
| Sudbury District | 22.0 (2.9–41.1) |
| Thunder Bay District | 40.0 (34.8–45.2) |
| Timiskaming District |
|
| – indicates cell counts less than 10, which are not reported due to privacy regulations. | |
| County | n | Diagnostic interval median (95% CI) | DAU coverage rateTable 3 Footnote a (95% CI) |
|---|---|---|---|
| Brant CountyTable 3 Footnote b | 60 | 31.0 (23.8–38.2) | 6.6 (0.4–13.0) |
| Bruce CountyTable 3 Footnote b | 46 | 21.9 (14.6–29.2) | 73.9 (61.2–86.6) |
| Dufferin CountyTable 3 Footnote b | 30 | 46.9 (32.5–61.3) | 6.7 (−2.3–15.59) |
| Elgin CountyTable 3 Footnote b | 59 | 49.0 (36.2–61.8) | 18.6 (8.7–28.6) |
| Essex County | 251 | 25.0 (20.8–29.2) | 85.7 (81.3–90.0) |
| Frontenac County | 89 | 21.0 (17.7–24.3) | 98.9(96.7–101.1) |
| Grey County | 63 | 30.0 (23.3–36.7) | 76.2 (65.7–86.7) |
| Haldimand-Norfolk Regional MunicipalityTable 3 Footnote b | 68 | 37.8 (32.6–43.0) | 17.6 (8.6–26.7) |
| Haliburton CountyTable 3 Footnote b | — | — | — |
| Halton Regional MunicipalityTable 3 Footnote b | 215 | 36.0 (30.1–41.9) | 26.0 (20.2–31.9) |
| Hastings County | 89 | 22.0 (16.4–27.6) | 96.6 (92.9–100.4) |
| Huron CountyTable 3 Footnote b | 36 | 30.1 (18.0–42.3) | 88.9 (78.6–99.2) |
| Chatham-Kent Division | 62 | 40.5 (23.9–57.1) | 91.9 (85.2–98.7) |
| Lambton County | 98 | 25.4 (15.5–35.3) | 64.3 (54.8–73.8) |
| Lanark CountyTable 3 Footnote b | 41 | 38.0 (30.5–45.5) | 53.7 (38.4–68.9) |
| Leeds and Grenville United Counties | 68 | 31.7 (26.1–37.3) | 86.8 (78.7–94.8) |
| Lennox and Addington CountyTable 3 Footnote b | 19 | 27.0 (9.5–44.5) | 100.0 (100.0–100.0) |
| Toronto Division | 1289 | 38.0 (36.0–40.0) | 25.5 (23.1–27.9) |
| Middlesex County | 285 | 42.0 (36.6–47.4) | 94.0 (91.3–96.8) |
| Muskoka District MunicipalityTable 3 Footnote b | 49 | 65.0 (39.6–90.4) | 0.0 (0.0–0.0) |
| Niagara Regional Municipality | 241 | 35.0 (31.3–38.7) | 90.9 (87.2–94.5) |
| Northumberland County | 57 | 20.0 (13.7–26.3) | 94.7 (88.9–100.5) |
| Durham Regional Municipality | 283 | 33.0 (28.6–37.4) | 54.1 (48.3–59.9) |
| Ottawa Division | 549 | 28.0 (24.2–31.8) | 74.7 (71.0–78.3) |
| Oxford County | 62 | 16.4 (10.7–22.1) | 85.5 (76.7–94.3) |
| Peel Regional Municipality | 567 | 37.0 (34.0–40.0) | 27.5 (23.8–31.2) |
| Perth County | 43 | 23.0 (15.5–30.5) | 100.0 (100.0–100.0) |
| Peterborough County | 73 | 20.0 (14.3–25.7) | 41.1 (29.8–52.4) |
| Prescott and Russell United Counties | 52 | 48.7 (36.9–60.5) | 48.1 (34.5–61.7) |
| Prince Edward Division | 19 | 15.0 (7.6–22.4) | 94.7 (84.7–104.8) |
| Renfrew County | 51 | 15.0 (6.8–23.2) | 90.2 (82.0–98.4) |
| Simcoe County | 245 | 24.0 (19.4–28.6) | 4.1 (1.6–6.6) |
| Stormont, Dundas, Glengary United Counties | 74 | 40.8 (32.3–49.2) | 36.5 (25.5–47.5) |
| Kawartha Lakes Division | 45 | 23.0 (10.6–35.4) | 28.9 (15.6–42.1) |
| Waterloo Regional Municipality | 281 | 30.0 (26.8–33.2) | 61.9 (56.2–67.6) |
| Wellington CountyTable 3 Footnote b | 94 | 32.0 (27.5–36.5) | 19.1 (11.2–27.1) |
| Hamilton Division | 266 | 19.7 (16.5–22.9) | 41.0 (35.1–46.9) |
| York Regional Municipality | 528 | 32.0 (28.8–35.2) | 23.9 (20.2–27.5) |
| Algoma District | 68 | 24.0 (13.5–34.5) | 88.2 (80.6–95.9) |
| Cochrane District | 42 | 35.0 (28.0–41.9) | 38.1 (23.4–52.8) |
| Kenora DistrictTable 3 Footnote b | 31 | 50.0 (30.8–69.2) | 41.9 (24.6–59.3) |
| Manitoulin DistrictTable 3 Footnote b | 14 | 19.7 (6.3–33.2) | 50.0 (23.8–76.2) |
| Nipissing DistrictTable 3 Footnote b | 53 | 22.0 (13.2–30.8) | 13.2 (4.1–22.3) |
| Parry Sound DistrictTable 3 Footnote b | 28 | 32.5 (19.6–45.3) | 17.9 (3.7–32.0) |
| Rainy River DistrictTable 3 Footnote b | — | — | — |
| Greater Sudbury Division | 87 | 24.0 (18.1–29.9) | 46.0 (35.5–56.4) |
| Sudbury DistrictTable 3 Footnote b | 15 | 22.0 (2.9–41.1) | 40.0 (15.2–64.8) |
| Thunder Bay District | 84 | 40.0 (34.8–45.2) | 97.6 (94.4–100.9) |
| Timiskaming DistrictTable 3 Footnote b | 11 | 53.0 (14.2–91.8) | 36.4 (7.9–64.8) |
Note: — indicates cells with counts less than 10, which were not reported due to Institute for Clinical Evaluative Services (ICES) privacy regulations.
|
|||
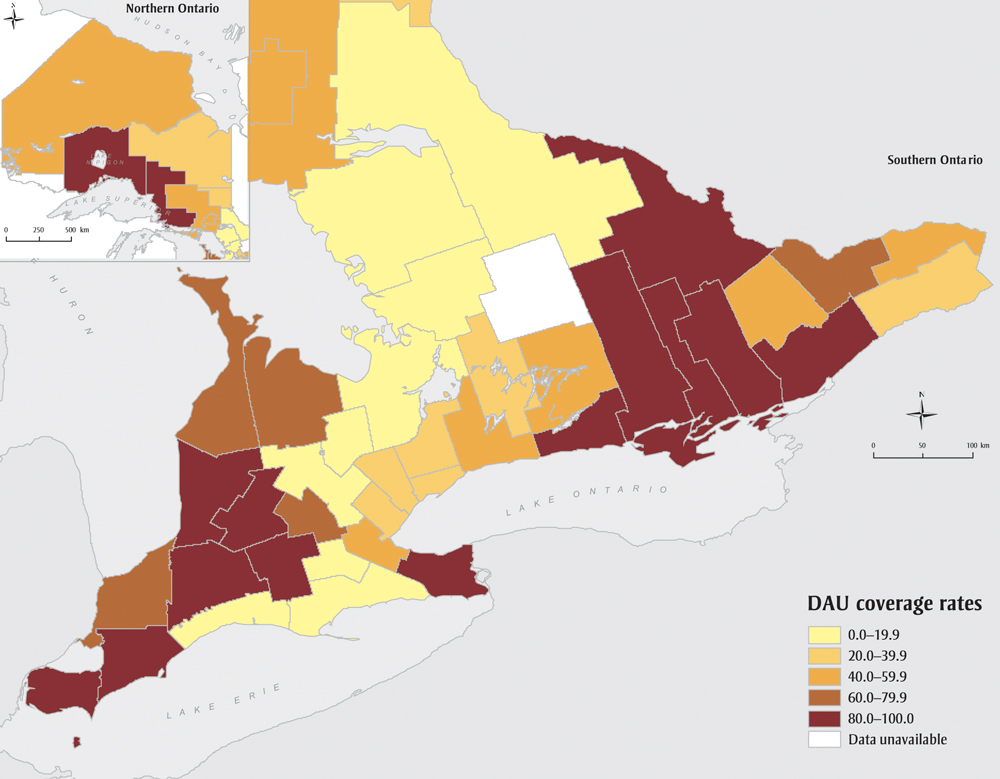
Figure 4 maps county-level DAU service use across Ontario. Rates range from 0% to 100%, partially reflecting that, at the time of this study, DAUs did not exist in 19 (38.8%) counties (see Table 3). Of these 19, 11 had a median diagnostic interval greater than or equal to the provincial median.
Figure 4. Ontario breast diagnostic assessment unit coverage rate among breast cancer patients across counties, Ontario, Canada, 2011
Text Description
| County | Diagnostic assessment unit coverage rate (95% confidence interval) |
|---|---|
| Brant County | 6.6 (0.4–13.0) |
| Bruce County | 73.9 (61.2–86.6) |
| Dufferin County | 6.7 (−2.3–15.59) |
| Elgin County | 18.6 (8.7–28.6) |
| Essex County | 85.7 (81.3–90.0) |
| Frontenac County | 98.9 (96.7–101.1) |
| Grey County | 76.2 (65.7–86.7) |
| Haldimand-Norfolk Regional Municipality | 17.6 (8.6–26.7) |
| Haliburton County | — |
| Halton Regional Municipality | 26.0 (20.2–31.9) |
| Hastings County | 96.6 (92.9–100.4) |
| Huron County | 88.9 (78.6–99.2) |
| Chatham-Kent Division | 91.9 (85.2–98.7) |
| Lambton County | 64.3 (54.8–73.8) |
| Lanark County | 53.7 (38.4–68.9) |
| Leeds and Grenville United Counties | 86.8 (78.7–94.8) |
| Lennox and Addington County | 100.0 (100.0–100.0) |
| Toronto Division | 25.5 (23.1–27.9) |
| Middlesex County | 94.0 (91.3–96.8) |
| Muskoka District Municipality | 0.0 (0.0–0.0) |
| Niagara Regional Municipality | 90.9 (87.2–94.5) |
| Northumberland County | 94.7 (88.9–100.5) |
| Durham Regional Municipality | 54.1 (48.3–59.9) |
| Ottawa Division | 74.7 (71.0–78.3) |
| Oxford County | 85.5 (76.7–94.3) |
| Peel Regional Municipality | 27.5 (23.8–31.2) |
| Perth County | 100.0 (100.0–100.0) |
| Peterborough County | 41.1 (29.8–52.4) |
| Prescott and Russell United Counties | 48.1 (34.5–61.7) |
| Prince Edward Division | 94.7 (84.7–104.8) |
| Renfrew County | 90.2 (82.0–98.4) |
| Simcoe County | 4.1 (1.6–6.6) |
| Stormont, Dundas, Glengary United Counties | 36.5 (25.5–47.5) |
| Kawartha Lakes Division | 28.9 (15.6–42.1) |
| Waterloo Regional Municipality | 61.9 (56.2–67.6) |
| Wellington County | 19.1 (11.2–27.1) |
| Hamilton Division | 41.0 (35.1–46.9) |
| York Regional Municipality | 23.9 (20.2–27.5) |
| Algoma District | 88.2 (80.6–95.9) |
| Cochrane District | 38.1 (23.4–52.8) |
| Kenora District | 41.9 (24.6–59.3) |
| Manitoulin District | 50.0 (23.8–76.2) |
| Nipissing District | 13.2 (4.1–22.3) |
| Parry Sound District | 17.9 (3.7–32.0) |
| Rainy River District | — |
| Greater Sudbury Division | 46.0 (35.5–56.4) |
| Sudbury District | 40.0 (15.2–64.8) |
| Thunder Bay District | 97.6 (94.4–100.9) |
| Timiskaming District | 36.4 (7.9–64.8) |
Discussion
To the best of our knowledge, this is the first Ontario study and among the first Canadian studies describing breast cancer screening detection rates and waiting time to diagnosis in a population-based breast cancer cohort.Footnote 24Footnote 25 Previous Ontario reports have been restricted to those seen within organized breast cancer screening programsFootnote 12Footnote 26 while our study also includes the 63.8% of breast cancer patients who were diagnosed symptomatically and the 7.4% detected through opportunistic screening.
Our observed screening detection rate (48.4% in those breast cancer patients aged 50–69 years) was lower than the general population screening participation rates reported by the OBSP. In calendar years 2007 and 2008, the OBSP calculated that 66.3% of the Ontario women aged 50 to 69 years had been screened (through OBSP or opportunistic screening),Footnote 27 and the coverage was estimated to be similar in 2011.Footnote 3 The discrepancy between screening program participation rates and screening detection rates aligns with evidence that those at higher risk with breast cancer risk factors such as higher age and lack of exercise are less likely to get screenedFootnote 28 and that some women are being diagnosed between screenings. To this latter point, Kirsh et al. estimated that 13.8% of breast cancer patients nested within a cohort of OBSP participants from 1994 to 2002 were diagnosed within 24 months after a negative screening mammogram (known as interval cancers).Footnote 29
The only other Canadian evidence on the breast cancer screening detection rate comes from two recent studies in Alberta, with one reporting that 44% of all breast cancers were detected through screening from 2007 to 2010Footnote 24 and the other reporting a screening detection rate of 38% from 2004 to 2010Footnote 25 (we observed 36% in Ontario in 2011). Screening eligibility criteria differ between the two provinces, as the Alberta Breast Cancer Screening Program additionally accepts patients aged 40 to 49 years.Footnote 30 However, the biennial breast cancer screening participation rate (programmatic and nonprogrammatic) for women aged 50 to 69 years is lower in Alberta (55.1%–57.3% in 2007–2010)Footnote 31 than Ontario (66.3% in years 2007–2008).Footnote 27
Two population-based studies conducted in United States reported the proportions of screen-detected cancer at 22% and 30.2%, respectively,Footnote 32Footnote 33 with the latter restricted to women aged 40 to 49 years. These lower rates may have changed since these studies were conducted in the 1990s. A more recent study in MexicoFootnote 34 reported a screening detection rate of 58.3% among breast cancer patients of all ages. This higher rate may be partly attributed to a more liberal definition of “screen-detected cancer”: cancer diagnosed within 270 days of a bilateral (both breasts) screening mammogram.
Waiting for a diagnosis can have considerable psychological consequences for patients and their families and wait time reductions can significantly reduce anxiety levels.Footnote 6 In Canada, there is little guidance about breast cancer diagnostic wait times; breast cancer screening timeliness targets at the time of this study recommended that 90% of abnormal screenings should be resolved within 5 weeks, or within 7 weeks if a tissue biopsy is performed.Footnote 9 Applying the more liberal 7-week cut, we observed that 68.3% of breast cancer patients in our study were diagnosed within 7 weeks. Our observed rate is similar to a 64% rate reported in 2010 for resolution of all Ontario abnormal breast cancer screens requiring a tissue biopsy.Footnote 30
In our study, the median breast cancer diagnostic interval for Ontario in 2011 was 4.6 weeks (32 days), and 690 patients (10%) waited 3.6 months or longer, which is a level of delay that has been associated with worse survival.Footnote 8 Our observed median was shorter than the reported median time from an abnormal screen to diagnosis requiring tissue biopsy for other Canadian provinces in the year 2010 (range: 5–7 weeks).Footnote 30 This is likely explained by our restriction to the cancer population. We reported the diagnostic interval separately for the screen-detected and the symptomatic breast cancer patients in two companion papers,Footnote 14Footnote 16 with medians of 29 days and 34 days, respectively. Our observations differed from findings in Alberta, which reported medians of 19 days for the screen-detected patients and 21 days for the symptomatic patients in the years 2004 to 2010.Footnote 25
Within Ontario, we observed significant regional variation in the diagnostic interval. The maximum difference was 2.4 weeks (17 days) between LHINs. Women who live in the North West, Central West and Mississauga Halton LHINs experienced the longest waits, exceeding 5 weeks. In 2011, the OBSP reported that these regions were among those that had the lowest 7-week tissue biopsy target rates.Footnote 3 Reasons for these low rates likely vary across these three LHINs as they are very different geographically and demographically. Further study is required to better understand these differences.
Compared to the LHIN-level analysis, we observed greater variation between counties; there was a maximum difference of 7.1 weeks (50 days) between counties, indicating intra-LHIN variation. Consistent with the LHIN-level findings, the longest diagnostic intervals were observed in both the most populous (Greater Toronto Area) and the least populous (northern Ontario) areas. We also observed significant variation in DAU service use across counties. The county with 0% of DAU use had the longest diagnostic interval at both the median (65 days) and 75th percentile (108 days), and the county where 100% of patients used DAU service had a median diagnostic interval (27 days) that was among the shortest.
We previously hypothesized that the variation in the diagnostic interval may be partially attributable to different DAU service availabilities across regions.Footnote 14Footnote 15 We found that DAU use was associated with reduced time-to-diagnosis for both screen-detected and symptomatic patients after control for potential confounders in multivariable analyses.Footnote 14Footnote 16 It should be noted that other regional factors such as patient demographics, care referral processes and local programs may have contributed to the variation that we have observed, since regions with high DAU coverage are not consistently associated with shorter diagnostic intervals. The World Health Organization has identified geographic variation as a health care quality concern pertinent to two dimensions: equity and accessibility.Footnote 35 Therefore, the reasons for this observed variation warrant further investigation in order to improve access and equity of breast cancer diagnostic care.
Strengths and limitations
This study has several strengths. We have demonstrated the feasibility of using routinely collected health administrative data to understand the breast cancer diagnostic process. Our approach provides methodological guidance for determining breast cancer detection method, diagnostic interval and use of specialized breast diagnostic assessment units that may be adapted for use over time in Ontario and in other Canadian provinces. This is the first Ontario study to provide population-based evidence on the breast cancer screening detection rate, diagnostic interval and use of diagnostic assessment units. This population-wide information highlighted the low screening detection rate (36%) when breast cancer patients of all ages are considered, and it provides a full picture of the breast cancer experience by including those who are opportunistically screened and those who presented symptomatically: groups who are routinely excluded from breast cancer diagnostic studies. Therefore, our findings provide a unique population perspective on the role of breast cancer screening in cancer detection, access to DAUs and the amount of time it takes for a diagnosis, which can inform cancer program policies and interventions and their evaluation. The geographic variations we observed provide important information for system administrators to compare across regions and identify successful regional initiatives for wider implementation. This information could prompt knowledge sharing and facilitate collaboration across regions aimed at improving the timeliness of care and, ultimately, patients’ experience. The existence of such wide variation at a county level is a caution to other health care systems.
This study also has a number of limitations. First, we did not estimate the time-to-diagnosis or time-to-resolution interval for all patients being investigated for breast cancer, but instead focussed on the group who were ultimately diagnosed with the disease. Although patients under investigation are identifiable in the screening program, they are much harder to find in administrative data, which we needed in order to include patients who presented symptomatically. Evidence suggests that women with invasive breast cancer get a quicker diagnosis compared to those with benign diseases,Footnote 36Footnote 37 so the intervals we report are likely shorter than the benign group would experience and therefore apply only to women with breast cancer.
Second, we did not have test results in the administrative databases, so a small portion of the 7.4% whom we considered as being opportunistically screened may have actually had a negative screening mammogram, making our estimate of their diagnostic interval longer than it actually was and erroneously labelling that small group as having been screen-detected. Conversely, a small proportion of apparently symptomatic patients may have had an abnormal opportunistic screening test more than 6 months before diagnosis, thereby underestimating their diagnostic interval (and erroneously labelling them as having been symptomatic at presentation).
Third, defining the symptomatic index contact date as the most recent referring physician visit preceding the earliest test procedure was a conservative choice regarding the calculation of the diagnostic interval because the actual referral may have occurred earlier.
Fourth, new physician billing codes that specify the reason for the mammogram (symptomatic vs. asymptomatic) were introduced on 1 October, 2010, and may not have been fully adopted by the time of our study. Therefore, some opportunistically screened patients may be misclassified as symptomatic and thus we may have underestimated the proportion of screen-detected patients. We expect this influence to be small, because the frequency of use of this new code increased dramatically during the first three months of its introduction and had levelled off by the time of this study.Footnote 38
Finally, the determination of DAU use was subject to misclassification, with the sensitivity estimated at 90.1% and specificity at 84.6%.Footnote 15
Conclusion
This report provides diagnostic access information about those who are ultimately diagnosed with a breast cancer. Among age-eligible breast cancer patients, we observed lower screening detection rates than screening participation rates in the general population. This result suggests that future cancer screening efforts should target women at increased risk of breast cancer and/or that the rate of interval cancers is in need of improvement. We also observed considerable variation in the length of diagnostic interval and DAU across geographic regions. There is a need for further research to understand the factors attributable to this variation and identify opportunities for system improvement. Finally, future efforts to understand diagnostic wait times and the influence of programs designed to mitigate them must occur at the population level rather than be restricted to organized screening programs.
Acknowledgements
The authors thank Ms. Marlo Whitehead for data linkage and data preparation, Dr. Marcy Winget for methodological advice, Mr. Peter Gozdyra for assistance with the geographic mapping and Ms. Melissa Enmore for assistance in circulating the survey. This research is funded by a grant from the Canadian Institutes of Health Research. Li Jiang was supported by an Ontario Graduate Scholarship and a Queen’s University Graduate Award. Parts of this material are based on data and information provided by CCO. The opinions, results, view and conclusions reported in this paper are those of the authors and do not necessarily reflect those of CCO. No endorsement by CCO is intended or should be inferred. Parts of this material are based on data and information compiled and provided by CIHI. However, the analyses, conclusions, opinions and statements expressed herein are those of the authors, and not necessarily those of CIHI. This study was supported by the Institute for Clinical Evaluative Sciences (ICES), which is funded by an annual grant from the Ontario Ministry of Health and Long-Term Care (MOHLTC). The opinions, results and conclusions reported in this paper are those of the authors and are independent of the funding sources. No endorsement by ICES or the Ontario MOHLTC is intended or should be inferred.
Conflicts of interest
The authors declare no conflicts of interest.
Authors’ contributions and statement
All authors contributed to study design, results interpretation and manuscript revision. PG oversaw the research methodology. LJ performed analysis and had a major role in drafting and revising the manuscript.
The content and views expressed in this article are those of the authors and do not necessarily reflect those of the Government of Canada.
References
- Footnote 1
-
Fletcher SW, Black W, Harris R, et al. Report of the International Workshop on Screening for Breast Cancer. JNCI. 1993;85(20):1644-56.
- Footnote 2
-
Canadian Partnership Against Cancer. Cancer screening in Canada: an overview of screening participation for breast, cervical and colorectal cancer [Internet]. Toronto (ON): Canadian Partnership Against Cancer; 2015 [cited 2017 July 15]. Available from: http://www.cancerview.ca/preventionandscreening/breastcancerscreening
- Footnote 3
-
Cancer Care Ontario. Ontario Breast Screening Program 2011 report [Internet]. Toronto (ON): Cancer Care Ontario; 2013 [cited 2017 Dec 15]. Available from: https://archive.cancercare.on.ca/common/pages/UserFile.aspx?fileId=288834
- Footnote 4
-
Arndt V, Stürmer T, Stegmaier C, et al. Provider delay among patients with breast cancer in Germany: a population-based study. J Clin Oncol. 2003;21(8):1440-6.
- Footnote 5
-
Morse JM, Pooler C, Vann-Ward T, et al. Awaiting diagnosis of breast cancer: strategies of enduring for preserving self. Oncol Nurs Forum. 2014;41(4):350-9.
- Footnote 6
-
Harcourt D, Rumsey N, Ambler N. Same-day diagnosis of symptomatic breast problems: psychological impact and coping strategies. Psychol Health Med. 1999;4(1):57-71.
- Footnote 7
-
Gilbert JE, Dobrow MJ, Kaan M, et al. Creation of a diagnostic wait times measurement framework based on evidence and consensus. J Oncol Pract. 2014;10(5):e373-e379.
- Footnote 8
-
Richards MA, Westcombe AM, Love SB, et al. Influence of delay on survival in patients with breast cancer: a systematic review. Lancet. 1999;353(9159):1119-26.
- Footnote 9
-
Public Health Agency of Canada. Report from the Evaluation Indicators Working Group: guidelines for monitoring breast screening program performance. 2nd ed. [Internet]. 2007 [cited 2017 July 15]. Available from: http://www.phac-aspc.gc.ca/publicat/2007/gmbspp-ldsppdcs/pdf/gmbspp-ldsppdcs_e.pdf
- Footnote 10
-
Palmieri F, DePeri E, Mincey B, et al. Comprehensive diagnostic program for medically underserved women with abnormal breast screening evaluations in an urban population. Mayo Clin Proc. 2009;84(4):317-22.
- Footnote 11
-
Dey P, Bundred N, Gibbs A, et al. Costs and benefits of a one stop clinic compared with a dedicated breast clinic: randomised controlled trial. BMJ. 2002;324(7336):507.
- Footnote 12
-
Quan ML, Shumak RS, Majpruz V, et al. Improving work-up of abnormal mammogram through organized assessment: results from the Ontario Breast Screening Program. J Oncol Pract. 2012;8(2):107-12.
- Footnote 13
-
Cancer Care Ontario. Ontario Breast Screening Program: Breast Assessment Initiative orientation. Toronto (ON): Cancer Care Ontario; 2004 [cited 2015 May 24]. 100 p.
- Footnote 14
-
Jiang L, Gilbert J, Langley H, et al. Effect of specialized diagnostic assessment units on the time to diagnosis in screen-detected breast cancer patients. Br J Cancer. 2015;112(11):1744-50.
- Footnote 15
-
Jiang L. Association between use of a specialized diagnostic assessment unit and the diagnostic interval in Ontario breast cancer patients [Internet]. Master’s thesis. Kingston (ON): Queen’s University; 2013 [cited 2017 Mar 22]. Available from: https://qspace.library.queensu.ca/jspui/bitstream/1974/8466/1/Jiang_Li_201311_MSc.pdf
- Footnote 16
-
Jiang L, Gilbert J, Langley H, et al. Is being diagnosed at a dedicated breast assessment unit associated with a reduction in the time to diagnosis for symptomatic breast cancer patients? Eur J Cancer Care. 2018;27:e12864. doi: 10.1111/ecc.12864.
- Footnote 17
-
Edge S, Byrd DR, Compton CC, et al, editors. AJCC cancer staging manual. 7th edition. New York (NY): Springer New York; 2009. 718 p.
- Footnote 18
-
Sobin LH, Gospodarowicz MK, Wittekind C, editors. The TNM classification of malignant tumours. 7th edition. Hoboken (NJ): Wiley-Blackwell; 2009. 332 p.
- Footnote 19
-
Canadian Partnership Against Cancer. Report from the Evaluation Indicators Working Group: guidelines for monitoring breast cancer screening program performance. 3rd edition. [Internet]. Toronto (ON): Canadian Partnership Against Cancer; 2013 [cited 2015 May 24]. Available from: https://content.cancerview.ca/download/cv/prevention_and_screening/screening_and_early_diagnosis/documents/guidelinemonitoringbreastpdf?attachment=0
- Footnote 20
-
Singh H, De Coster C, Shu E, et al. Wait times from presentation to treatment for colorectal cancer: a population-based study. Can J Gastroenterol. 2010;24(1):33-9.
- Footnote 21
-
Tonelli M, Connor Gorber S, Joffres M, et al. Recommendations on screening for breast cancer in average-risk women aged 40–74 years. CMAJ. 2011;183(17):1991-2001.
- Footnote 22
-
Sawada M. Global spatial autocorrelation indices—Moran’s I, Geary’s C and the general cross-product statistic [Internet]. 2009 [cited 2017 Mar 22]. Available from: http://www.lpc.uottawa.ca/publications/moransi/moran.htm
- Footnote 23
-
Williams DL, Tortu S, Thomson J. Factors associated with delays to diagnosis and treatment of breast cancer in women in a Louisiana urban safety net hospital. Women Health. 2010;50(8):705-18.
- Footnote 24
-
Yuan Y, Li M, Yang J, et al. Using administrative data to estimate time to breast cancer diagnosis and percent of screen-detected breast cancers — a validation study in Alberta, Canada. Eur J Cancer Care (Engl). 2015;24(3):367-75.
- Footnote 25
-
Yuan Y, Li M, Yang J, et al. Factors related to breast cancer detection mode and time to diagnosis in Alberta, Canada: a population-based retrospective cohort study. BMC Health Serv Res [Internet]. 2016 [cited 2017 Mar 20];16:65. doi: 10.1186/s12913-016-1303-z.
- Footnote 26
-
Olivotto IA, Bancej C, Goel V, et al. Waiting times from abnormal breast screen to diagnosis in 7 Canadian provinces. CMAJ. 2001;165(3):277-83.
- Footnote 27
-
Cancer Care Ontario. Ontario Breast Screening Program 20th Anniversary Report 1990–2010 [Internet]. Toronto: Cancer Care Ontario; 2010 [cited 2017 July 15]. Available from: http://www.ontla.on.ca/library/repository/mon/25001/307022.pdf
- Footnote 28
-
Hanson K, Montgomery P, Bakker D, et al. Factors influencing mammography participation in Canada: an integrative review of the literature. Curr Oncol. 2009;16(5):65-75.
- Footnote 29
-
Kirsh VA, Chiarelli AM, Edwards SA, et al. Tumor characteristics associated with mammographic detection of breast cancer in the Ontario Breast Screening Program. J Natl Cancer Inst. 2011;103(12):942-50.
- Footnote 30
-
Canadian Partnership Against Cancer. Breast cancer control in Canada: a system performance special focus report [Internet]. Toronto (ON): Canadian Partnership Against Cancer; 2012 [cited 2015 April 24]. Available from: https://content.cancerview.ca/download/cv/quality_and_planning/system_performance/documents/breastcancercontrolreppdf?attachment=0
- Footnote 31
-
Alberta Health Services. Alberta Health Services: Q4 performance report 2012/13 [Internet]. 2013 Jun 6 [cited 2017 July 15]. Available from: http://www.albertahealthservices.ca/Publications/ahs-pub-pr-2013-06-performance-report.pdf
- Footnote 32
-
Reeves MJ, Newcomb PA, Remington PL, et al. Body mass and breast cancer: relationship between method of detection and stage of disease. Cancer. 1996;77(2):301-7.
- Footnote 33
-
McPherson CP, Swenson KK, Jolitz G, et al. Survival of women ages 40-49 years with breast carcinoma according to method of detection. Cancer. 1997;79(10):1923-32.
- Footnote 34
-
Hill DA, Nibbe A, Royce ME, et al. Method of detection and breast cancer survival disparities in Hispanic women. Cancer Epidemiol Biomarkers Prev. 2010;19(10):2453-60.
- Footnote 35
-
World Health Organization. Quality of care: a process for making strategic choices in health systems. Geneva (CH): WHO Press; 2006. 50 p.
- Footnote 36
-
Borugian MJ, Kan L, Chu CC, et al. Facilitated “fast track” referral reduces time from abnormal screening mammogram to diagnosis. Can J Public Health. 2008;99(4):252-6.
- Footnote 37
-
Chiarelli AM, Mai V, Halapy EE, et al. Effect of screening result on waiting times to assessment and breast cancer diagnosis: results from the Ontario Breast Screening Program. Can J Public Health. 2005;96(4):259-63.
- Footnote 38
-
Institute for Clinical Evaluative Sciences. Fee codes descriptions and counts by year [Internet]. Toronto (ON): Institute for Clinical Evaluative Sciences. 2011 [cited 2013 September 30]. Available from: https://outside.ices.on.ca/Data%20Holdings/Health%20Services/ohip/Variables/feecode.html