
Effects on patients of variations in the implementation of a cardiometabolic risk intervention program in Montréal
Health Promotion and Chronic Disease Prevention in Canada
Marie-Ève Beauregard, MD, MScFootnote 1; Sylvie Provost, MD, MScFootnote 2,Footnote 3,Footnote 4; Raynald Pineault, MD, PhDFootnote 2,Footnote 3,Footnote 4,Footnote 5; Dominique Grimard, MScFootnote 2; José Pérez, MScFootnote 2,Footnote 3; Michel Fournier, MScFootnote 2
https://doi.org/10.24095/hpcdp.38.2.03
This original quantitative research article has been peer-reviewed.
Author references
- Endnote 1
-
Université de Montréal, Montréal, Quebec, Canada
- Endnote 2
-
Direction de santé publique du CIUSSS du Centre-Sud-de-l'Île-de-Montréal, Montréal, Quebec, Canada
- Endnote 3
-
Research Centre, Centre hospitalier de l'Université de Montréal, Montréal, Quebec, Canada
- Endnote 4
-
Institut de recherche en santé publique de l'Université de Montréal, Montréal, Quebec, Canada
- Endnote 5
-
Institut national de santé publique du Québec, Montréal, Quebec, Canada
Correspondence: Marie-Ève Beauregard, 5312 de Contrecœur St, Montréal, QC H1K 0K1; Tel: 514-265-7235; Email: marie-eve.beauregard@umontreal.ca
Abstract
Introduction: In 2011, the Agence de la santé et des services sociaux de Montréal (ASSSM), in partnership with the region's Centres de santé et de services sociaux (CSSS), coordinated the implementation of a program on cardiometabolic risk based on the Chronic Care Model. The program, intended for patients suffering from diabetes or hypertension, involved a series of individual follow-up appointments, group classes and exercise sessions. Our study assesses the impact on patient health outcomes of variations in the implementation of some aspects of the program among the six CSSSs taking part in the study.
Methods: The evaluation was carried out using a quasi-experimental "before and after" design. Implementation variables were constructed based on data collected during the implementation analysis regarding resources, compliance with the clinical process set out in the regional program, the program experience and internal coordination within the care team. Differences in differences using propensity scores were calculated for HbA1c results, achieving the blood pressure (BP) target, and two lifestyle targets (exercise level and carbohydrate distribution) at the 6- and 12-month follow-ups, based on greater or lesser patient exposure to the implementation of various aspects of the program under study.
Results: The results focus on 1185 patients for whom we had data at the 6-month follow-up and the 992 patients from the 12-month follow-up. The difference in differences analysis shows no clear association between the extent of implementation of the various aspects of the program under study and patient health outcomes.
Conclusion: The program produces effects on selected health indicators independent of variations in program implementation among the CSSSs taking part in the study. The results suggest that the effects of this type of program are more highly dependent on the delivery of interventions to patients than on the organizational aspects of its implementation.
Keywords: chronic disease, diabetes, hypertension, primary health care
Highlights
- The six CSSSs in the study implemented a program with moderate local variations.
- Local variations between the CSSSs with regard to program implementation do not appear to have had an impact on patient health outcomes.
- The results seem to indicate that the program's impact is more dependent on the patient's progress through the clinical process, which is based on aspects of the Chronic Care Model, rather than on the program's organizational aspects.
Introduction
The steady increase in prevalence of diabetes mellitus and high blood pressure (HBP) among Canadians is worrisome. Because the diseases share an etiology—and this is a major risk factor for heart diseaseFootnote 2,Footnote 1—it is logical to consider them jointly as part of a prevention and management approach.
The Chronic Care Model (CCM) is a chronic disease care model that can be used to guide health care reform to optimize the management of chronic disease.Footnote 3 In 2011, the Agence de la santé et des services sociaux de Montréal (ASSSM), in partnership with the region's Centres de santé et services sociaux (CSSS), coordinated the implementation of an integrated interdisciplinary cardiometabolic risk prevention and intervention program. The duration of the program was two years; it was inspired by the CCM and was aimed at making lifestyle changes, restoring biological indicators, preventing complications, and empowering patients with diabetes or hypertension (additional information on the program and the eligibility criteria is available from the authors).
A number of studies have shown that CCM-based interventions not only improve the process and health outcomes, but also reduce costs and service use among patients with chronic diseases,Footnote 4 particularly in the case of diabetes.Footnote 5 Although we attempted to assess the impact of the CCM's implementation on effects on patients in order to determine which specific elements or combination thereof yielded the best results, none have been identified to date.Footnote 6,Footnote 7 In addition, to our knowledge, no studies have focused on implementation context and variations in implementation of a CCM-inspired intervention among various local settings as regards the effects on patients.
The purpose of this study is to assess, as part of the implementation of the program in the various CSSSs, the effects of variations in the implementation of certain aspects of the program on patient health indicators.
Methods
Study design
Our study is a secondary analysis carried out as part of the assessment of the cardiometabolic risk program in Montréal.Footnote 8 A quasi-experimental approach was taken to assessing the effects of variations in the implementation of certain aspects of the program on patient health outcomes.Footnote 9
Six of the 12 CSSSs in Montréal took part in the evaluation. They were selected on a voluntary basis, as well as on their willingness to comply with the general program implementation framework suggested by the Agency. Patient recruitment was carried out by CSSS staff and took place from March 2011 to August 2013. The objective was to have each CSSS in the study recruit 300 patients per year for a total of 1500 patients per year, with anticipated attrition of approximately 15%.
Data sources and definition of variables
Data on program implementation were taken from the implementation analysis, whose purpose was to provide an overall assessment of the program. It was based on the program's logic model and the conceptual framework of factors that explain the degree of implementation. They are qualitative in nature and were collected in three phases (at the outset of program implementation in March 2011, or implementation T0; 20 months later, in November 2012, or implementation T20; and in June and July 2014, 40 months after implementation, or implementation T40) using a variety of methods: semi-formal interviews with local and regional officers, collection of official documents, questionnaires for the managers in charge and stakeholders involved in the program in each territory.
Independent variables
The study's independent variables are variations in the implementation of four aspects of the program between participating CSSSs at T40, i.e. once the implementation analysis was complete. We selected the variables that had the greatest likelihood of affecting patient health outcomes: resources, program compliance to the planned regional clinical process, internal coordination of the health team, and program experience. These "implementation variables" were dichotomized in order to compare results for two groups of patients: the group of patients exposed to the program in CSSSs where the characteristic under study had been implemented more strongly (which we will call the "high implementation variable exposure" group), and the group of patients exposed to the program in CSSSs where the characteristic was less strongly implemented (which we will call the "low implementation variable exposure" group). The resources are the number of patients seen per CSSS based on full-time staff (or their equivalent) on the core team (nurses, nutritionist and kinesiologist). Compliance with the clinical process means compliance with individual follow-ups, group classes and adherence to the calendar set out in the regional program. Internal coordination means team integration in terms of collaboration with other stakeholders and patient referrals among stakeholders. Program experience means the number of years since the implementation of the first program component (diabetes), but also greater stakeholder experience with the program as noted in the qualitative implementation analysis carried out prior to this study.
CSSS 1 was weak in its implementation of the four program components. CSSS 2 had more extensive program compliance. CSSS 3 was the strongest in implementing internal coordination. CSSSs 4, 5 and 6 were those that invested the most resources in the program and whose internal coordination was implemented most extensively. In addition, CSSS 6 had high compliance with the prescribed clinical process, and CSSS 5 distinguished itself with its program experience.
Each of the implementation variables was analyzed individually, as it was impossible to compare CSSSs that implemented all the variables with high intensity to those that implemented all the variables with lesser intensity (Table 1).
| Implementation variables | CSSS 1 | CSSS 2 | CSSS 3 | CSSS 4 | CSSS 5 | CSSS 6 |
|---|---|---|---|---|---|---|
| Resources | Low | Low | Low | High | High | High |
| Compliance with clinical process | Low | High | Low | Low | Low | High |
| Internal coordination | Low | Low | High | High | High | High |
| Program experience | Low | Low | Low | Low | High | Low |
| Abbreviation: CSSS, Centre de santé et de services sociaux. | ||||||
The conversion of implementation variables into dichotomous variables was done while taking into account their distribution, implementation analysis findings, the small number of CSSSs, moderate variability among CSSSs with regard to the extent of implementation of the program aspects studied and, lastly, choice of analysis method. The description of data sources and the variable construction details (including dichotomization) are set out in Table 2. The "high exposure to the implementation variable" and "low exposure to the implementation variable" groups differ for each of the implementation variables. Details of patient characteristics for each group are available upon request from the authors.
| Implementation variables | Variable composition | Data source | Measure | Variable construction |
|---|---|---|---|---|
| Resources | Number of patients seen per CSSS based on full-time employees (or full-time equivalents) on the core team (nurse, nutritionist and kinesiologist) | Manager questionnaires (T40) |
|
Step 1: Calculate the "number of patients seen per CSSS / FTE" ratio for each professional. Step 2: Dichotomization of the ratio calculated in step 1 for each type of professional (lower ratio = high resources for this professional). Step 3: Create a dichotomous variable combining the three ratios: at least 2/3 "high" ratios mean "high" resources. |
| Compliance with clinical process | Compliance with individual follow-up and group classes and compliance with the prescribed program timetable | Manager questionnaires (T40) and interviews with local and regional officers (T40) |
|
Step 1: Analyze the changes made to the basic program template for each CSSS. Step 2: Confirm the construction of a dichotomous variable for program compliance with the research officer who carried out the implementation analysis. |
| Internal coordination | Team integration: collaboration with other stakeholders and patient referrals among stakeholders | Team stakeholder questionnaires (T40) |
|
Step 1: Analyze the distribution of frequency of each subquestion and identify stakeholders who rate the achievement of these elements by grouping together 4 and 5 as high. Step 2: Categorize the level of achievement of each of the subquestions where stakeholders answered 4 or 5 (low meaning 50% or less, average 51 to 69%, and high 70% or more). Step 3: Create a dichotomous variable, with 1 average + 1 high or 2 high being equivalent to high, with other combinations equivalent to low. |
| Program experience | Year of implementation of the diabetes component of the programTable 2 footnote a | Manager questionnaires (T20) |
|
Step 1: Analyze the distribution of the program opening years in 6 CSSSs. Step 2: Create a dichotomous variable with high for before 2008 and low for after 2008. |
|
Abbreviations: CLSC, Centre local de services communautaires; CSSS, Centre de santé et de services sociaux; T20, implementation follow-up at 20 months; T40, implementation follow-up at 40 months. |
||||
Dependent variables
The four dependent variables correspond to four health indicators: two clinical indicators, namely glycosylated hemoglobin (HbA1c) and blood pressure (BP); and two lifestyle indicators, i.e. exercise (EX) level and carbohydrate distribution. Data on the biological parameters (HbA1c and BP) and lifestyle (EX level and carb distribution) for each patient taking part in the assessment were extracted from the regional computerized chronic disease registry created by the ASSSM and implemented in the CSSSs as part of the project. Sociodemographic and health characteristics were drawn from a self-administered questionnaire that took approximately 20 minutes to fill out, which was given to patients taking part in the assessment at the time of their entry into the program (T0).
Glycemic control was measured using HbA1c, which is expressed as a percentage and represents the proportion of glycosylated hemoglobin as compared to total hemoglobin.10 Achieving the BP target means the achievement (yes or no) of the treatment target (below 140/90 mm Hg for non-diabetics and below 130/80 mm Hg for diabetics). Achievement of the EX target, assessed by means of a brief questionnaire adapted from Enquête québécoise sur l'activité physique et la santé11 and administered to the patient at each visit, occurs when the EX level is 3 or 4 on a scale of 1 to 4, which corresponds to the number of days the patient did at least 30 minutes of EX, weighted by activity intensity. Achievement of the balanced carbohydrate distribution (BCD) is determined by the nutritionist's determination, following an assessment at each visit, of whether or not the patient achieved balanced carbohydrate distribution as determined by the patient's personalized food plan. Food plans are based on the document Meal Planning for People with Diabetes at a Glance.Footnote 12
Data analysis
The intervention unit is the same as the analysis unit: the patient exposed to implementation variables in his/her CSSS.
Prior to the analyses, missing data at T0 regarding the studied health indicators, or 10% to 15% of the data, underwent imputation using the Hot DeckFootnote 13 method in order to reduce bias associated with non-responsesFootnote 14.
Difference in differences (DID) were calculated to measure the impact of implementation variables on the studied health indicators.Footnote 15 A separate analysis model was constructed for each of the implementation variables studied, for each of the health outcomes studied, and for each analysis period.
Propensity scores were used in the DID analyses by including the following individual variables: age; sex; origins (Canadian or other); language spoken in the home (French or other); highest completed level of education (no high school diploma, high school diploma, college studies, university); professional activity in the past six months (working, unemployed, retired); number of comorbidities (none, one, two or more of the following: heart disease, asthma or COPD, bone and joint problems, history of stroke, mental health problems, and cancer); body mass index (BMI) on entry into the program; and type of front-line clinic of the general practitioner treating the patient for diabetes or HBP (family medicine group [FMG]; network clinic [NC]; FMG-NC; local community service centre [CLSC]; family medicine unit [FMU]; non-FMG, non-NC group clinic; solo practice; or orphaned patient). The propensity score, or the conditional likelihood of being a member of the "high exposure to the implementation variable" group based on individual characteristics, makes it possible to distribute these characteristics among the groups. Subject matching was done using the kernel matchingFootnote 16 method, which allows for almost complete matching by associating each subject with a fictitious counterpart representing the average weighted propensity scores of subjects with similar characteristics. A different propensity score was calculated for each analysis model. Our analyses have shown that this strategy has effectively made the "high exposure to the implementation variable" and "low exposure to the implementation variable" groups comparable on the basis of these characteristics. We can thus conclude that the effect observed between two different times in the "low exposure to the implementation variable" group would be comparable to the effect observed in the "high exposure to the implementation variable" if the group's subjects had had a lower exposure to the studied implementation variable.
The DID analyses, performed using the STATA-diffFootnote 17 module, were carried out on all patients and the various patient subgroups based on their comorbidity profile (with or without comorbidities), each taken separately. Because the program aims to manage (pre)diabetic and hypertensive patients, we can assume that the implementation impact is different for patients with comorbidities that do not fall within the program's specific focus.
Ethical approval
This research project received the approval of the ASSSM ethics research committee.
Results
Sample description
The initial sample was made up of the 1689 patients registered in the program who consented to take part in the evaluation (evaluation participation rate of 60%). At the 6-month (T6) and 12 month (T12) follow-ups from their individual date of entry into the program, 1185 and 992 patients, respectively, had provided data. The difference in the size of the cohorts available for analysis at the three moments can be explained by both withdrawals and delays in patient follow-up.
At T0, the majority (77%) of patients suffered from diabetes (or prediabetes) or high blood pressure (HBP). Patients in the samples from the 6-month and 12-month follow-ups did not differ from those in the initial sample as regards their characteristics (Table 3), except for the proportion of patients suffering from both chronic diseases on which the program focuses. This proportion was higher in the follow-up samples.
| Time | Sample at T0 | Sample at T6 | Sample at T12 | ||||
|---|---|---|---|---|---|---|---|
| Sociodemographic characteristics | n = 1689 | % | n = 1185 | % | n = 992 | % | |
| Average age (years) | 57.6 | 58.3 | 58.5 | ||||
| Sex | Male | 755 | 45 | 517 | 44 | 428 | 43 |
| Nationality | Canadian | 1183 | 72 | 840 | 72 | 706 | 72 |
| Primary language | French | 1323 | 80 | 944 | 81 | 796 | 81 |
| Education | No diploma | 250 | 15 | 156 | 14 | 124 | 13 |
| Secondary school diploma | 745 | 46 | 518 | 45 | 441 | 46 | |
| Diploma of college studies | 222 | 14 | 163 | 14 | 132 | 14 | |
| University degree | 413 | 25 | 312 | 27 | 266 | 28 | |
| Income (divided into quartiles) | Very low | 411 | 28 | 275 | 27 | 230 | 27 |
| Low | 319 | 22 | 221 | 21 | 182 | 21 | |
| High | 402 | 27 | 288 | 28 | 244 | 28 | |
| Very high | 331 | 23 | 248 | 24 | 204 | 24 | |
| Occupational activity | Working | 720 | 44 | 504 | 44 | 418 | 43 |
| Retired | 348 | 21 | 215 | 19 | 175 | 18 | |
| Unemployed | 575 | 35 | 439 | 38 | 376 | 39 | |
| Person living alone | 645 | 41 | 476 | 42 | 399 | 42 | |
| State of health on entry into the program | n = 1689 | % | n = 1185 | % | n = 992 | % | |
| Diagnosis(es) | Diabetes or prediabetes | 614 | 18 | 413 | 9 | 340 | 8 |
| Hypertension | 79 | 5 | 51 | 4 | 44 | 4 | |
| Both conditions | 996 | 77 | 721 | 87 | 608 | 88 | |
| Average HbA1c of (pre)diabetics (%) | 1485 | 7.15 | 1111 | 7.10 | 933 | 7.11 | |
| Average BP | Systolic (mm Hg) | 1570 | 129.9 | 1125 | 130.0 | 945 | 129.9 |
| Diastolic (mm Hg) | 75.8 | 75.5 | 75.3 | ||||
| Proportion of patients achieving the BP target | % | 1625 | 41.5 | 1173 | 40.5 | 983 | 41.0 |
| Number of comorbiditiesTable 3 footnote a | 0 | 544 | 32 | 401 | 34 | 337 | 34 |
| N/A | 1 | 611 | 36 | 435 | 37 | 371 | 37 |
| N/A | 2 or more | 534 | 32 | 349 | 29 | 284 | 29 |
| Receiving primary care | n = 1689 |
% | n = 1185 | % | n = 992 | % | |
| Type of primary care clinic | FMG/NC | 517 | 31 | 373 | 32 | 310 | 32 |
| FMG | 356 | 21 | 247 | 21 | 212 | 22 | |
| NC | 81 | 5 | 65 | 6 | 54 | 6 | |
| CLSC/FMU | 269 | 16 | 178 | 15 | 150 | 15 | |
| Group | 251 | 15 | 187 | 16 | 154 | 16 | |
| Solo | 97 | 6 | 65 | 6 | 53 | 5 | |
| Orphaned patients | 92 | 6 | 56 | 5 | 50 | 5 | |
|
Abbreviations: CLSC, centre local de services communautaires; FMG, family medicine group; FMU, family medicine unit; NC, network clinic; T6, patient follow-up at 6 months; T12, patient follow-up at 12 months. Note: The T0 sample consists of the 1689 for whom data is available upon their entry into the program; the T6 sample is the 1185 patients for whom we have data from the 6-month follow up; and the T12 sample is the 992 patients for whom we have data from the 12-month follow-up. |
|||||||
Descriptive findings
Generally speaking, the average of each health result appeared to improve over the course of the program follow-up for all patients. This was more marked between T0 and T6 (Figure 1). However, the study design did not make it possible to draw conclusions as to the program's impact on patient health outcomes, and that impact is not the subject of this study.
Figure 1. Changes in the four health outcomes studied in all patients at 0, 6 and 12 months, with 95% confidence intervals
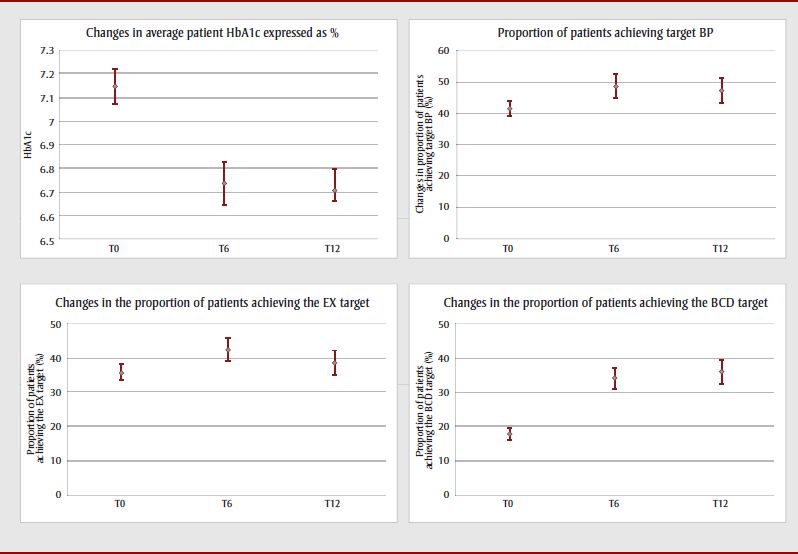
Figure 1: Changes in the four health outcomes studied in all patients at 0, 6 and 12 months, with 95% confidence intervals - Text Description
This figure depicts the changes in the four health outcomes (average HbA1c, achievement of target blood pressure, achievement of exercise target, achievement of balance carbohydrate distribution target) studied in all patients at 0,6 and 12 months, along with their 95% confidence intervals. Generally speaking, the average of each health result appeared to improve over the course of the program follow-up for all patients. This was more marked between T0 and T6, particularly for HbA1c and achievement of the balanced carbohydrate distribution target.
Abbreviations: BCD, balanced carbohydrate distribution; BP, blood pressure; EX, exercise; T0, patient entry into the program; T6, 6-month patient follow-up; T12, 12-month patient follow-up.
Impact of implementation variables on findings: results of the difference in differences analysis
Overall, most analyses showed no effect of implementation variables on the studied results (Table 4). Tables 5 and 6 show the difference in differences (DID) analysis results carried out on patient subgroups by comorbidity profile.
| N/A | Implementation variables | |||||||||||||||
|---|---|---|---|---|---|---|---|---|---|---|---|---|---|---|---|---|
| Resources | Clinical process compliance | Internal coordination | Program experience | |||||||||||||
| T6 | T12 | T6 | T12 | T6 | T12 | T6 | T12 | |||||||||
| Patient categories and health indicators | DID | p | DID | p | DID | p | DID | p | DID | p | DID | p | DID | p | DID | p |
| All patients | ||||||||||||||||
| Average patient HbA1c | p > 0.10 | p > 0.10 | p > 0.10 | p > 0.10 | p > 0.10 | p > 0.10 | p > 0.10 | p > 0.10 | ||||||||
| Proportion of patients achieving the target BP (%) | p > 0.10 | p > 0.10 | p > 0.10 | p > 0.10 | p > 0.10 | p > 0.10 | p > 0.10 | p > 0.10 | ||||||||
| Proportion of patients achieving the EX target (%) | p > 0.10 | p > 0.10 | p > 0.10 | p > 0.10 | p > 0.10 | p > 0.10 | p > 0.10 | p > 0.10 | ||||||||
| Proportion of patients achieving the BCD target (%) | p > 0.10 | −9.6Table 4 footnote ** | 0.040Table 4 footnote ** | p > 0.10 | p > 0.10 | p > 0.10 | p > 0.10 | p > 0.10 | −18.7Table 4 footnote ** | < 0.001Table 4 footnote ** | ||||||
| 0 comorbidity | ||||||||||||||||
| Average patient HbA1c | p > 0.10 | p > 0.10 | p > 0.10 | p > 0.10 | p > 0.10 | p > 0.10 | −0.42 | 0.085 | −0.72Table 4 footnote * | 0.034Table 4 footnote * | ||||||
| Proportion of patients achieving the target BP (%) | p > 0.10 | p > 0.10 | p > 0.10 | p > 0.10 | p > 0.10 | p > 0.10 | p > 0.10 | −23.7 | 0.096 | |||||||
| Proportion of patients achieving the EX target (%) | 20.7Table 4 footnote * | 0.020Table 4 footnote * | p > 0.10 | p > 0.10 | p > 0.10 | p > 0.10 | p > 0.10 | 26.3Table 4 footnote * | 0.002Table 4 footnote * | p > 0.10 | ||||||
| Proportion of patients achieving the BCD target (%) | p > 0.10 | −18.3Table 4 footnote ** | 0.038Table 4 footnote ** | p > 0.10 | p > 0.10 | p > 0.10 | p > 0.10 | −13.0 | 0.090 | p > 0.10 | ||||||
| 1+ comorbidity(ies) | ||||||||||||||||
| Average patient HbA1c | p > 0.10 | p > 0.10 | p > 0.10 | p > 0.10 | p > 0.10 | p > 0.10 | p > 0.10 | p > 0.10 | ||||||||
| Proportion of patients achieving the target BP (%) | p > 0.10 | p > 0.10 | p > 0.10 | p > 0.10 | p > 0.10 | p > 0.10 | p > 0.10 | p > 0.10 | ||||||||
| Proportion of patients achieving the EX target (%) | p > 0.10 | p > 0.10 | p > 0.10 | p > 0.10 | p > 0.10 | p > 0.10 | p > 0.10 | p > 0.10 | ||||||||
| Proportion of patients achieving the BCD target (%) | p > 0.10 | p > 0.10 | p > 0.10 | p > 0.10 | p > 0.10 | p > 0.10 | p > 0.10 | −21.3Table 4 footnote ** | < 0.001Table 4 footnote ** | |||||||
|
Abbreviations: BCD, balanced carbohydrate distribution; BP, blood pressure; DID, difference in differences; EX, exercise; T6, 6-month patient follow-up; T12, 12-month patient follow-up. Notes: HbA1c is expressed as a percentage. Data on personnel included in each of the analysis models and propensity scores are available from the authors upon request. |
||||||||||||||||
Significant DIDs (p < 0.05) are in dark grey and followed by a single asterisk, and accompanied in the tables by a "+" symbol when positive, i.e. favourable to the "high exposure to the implementation variable" group, and a "−" symbol in the opposite case, when negative. DIDs with a significance threshold between 0.05 and 0.10 are in white and followed by two asterisks, and are considered trends, with a "(+)" or "(−)" symbol to indicate direction.
Table 5 shows that the clinical results specific to the program, namely improvements in HbA1c and achievement of the BP targets, are influenced by implementation variables only for the subgroup of patients with no comorbidities and that this influence only involves the program experience variable. This has a positive impact on HbA1c at T12 (−0.72 percentage points). This impact is also present at the 6-month follow-up in the form of a trend. At that moment, the two groups ("high exposure to the implementation variable" and "low exposure to the implementation variable") show improvements in their HbA1c. Program experience appears to have a negative impact on the proportion of patients achieving the BP target. The scope of this trend is substantial (−23.7%), with the "high exposure to the implementation variable" group deteriorating and the "low exposure to the implementation variable" improving.
| Patient subgroups and health outcomes | Implementation variables | ||||||||||||||
|---|---|---|---|---|---|---|---|---|---|---|---|---|---|---|---|
| T6 | T12 | ||||||||||||||
| Baseline | Follow-up | DID | Baseline | Follow-up | DID | ||||||||||
| Group with low exposure to the implementation variable | Group with high exposure to the implementation variable | Group with low exposure to the implementation variable | Group with high exposure to the implementation variable | DID | p | Direction | Group with low exposure to the implementation variable | Group with high exposure to the implementation variable | Group with low exposure to the implementation variable | Group with high exposure to the implementation variable | DID | p | Direction | ||
| Resources | |||||||||||||||
| 0 comorbidity | Average patient HbA1c | 7.24 | 7.18 | 6.93 | 6.68 | −0.19 | 0.480 | N.S., p > 0.10 | 7.04 | 7.14 | 6.69 | 6.74 | −0.05 | 0.850 | N.S., p > 0.10 |
| Proportion of patients achieving the target BP (%) | 33.1 | 33.8 | 41.9 | 47.9 | 5.2 | 0.627 | N.S., p > 0.10 | 32.5 | 41.4 | 40.8 | 48.3 | −1.4 | 0.904 | N.S., p > 0.10 | |
| 1+ comorbidity(ies) | Average patient HbA1c | 6.87 | 7.18 | 6.65 | 6.84 | −0.12 | 0.527 | N.S., p > 0.10 | 6.84 | 7.25 | 6.50 | 6.95 | 0.04 | 0.832 | N.S., p > 0.10 |
| Proportion of patients achieving the target BP (%) | 41.3 | 34.6 | 51.8 | 43.4 | −1.7 | 0.808 | N.S., p > 0.10 | 43.3 | 39.7 | 48.6 | 48.8 | 3.7 | 0.606 | N.S., p > 0.10 | |
| Compliance with the clinical process | |||||||||||||||
| 0 comorbidity | Average patient HbA1c | 7.04 | 6.80 | 6.58 | 6.59 | 0.25 | 0.273 | N.S., p > 0.10 | 6.93 | 6.83 | 6.52 | 6.54 | 0.13 | 0.613 | N.S., p > 0.10 |
| Proportion of patients achieving the target BP (%) | 33.2 | 45.8 | 41.7 | 51.8 | −2.5 | 0.814 | N.S., p > 0.10 | 40.8 | 45.7 | 41.1 | 52.9 | 6.8 | 0.543 | N.S., p > 0.10 | |
| 1+ comorbidity(ies) | Average patient HbA1c | 6.92 | 6.98 | 6.72 | 6.59 | −0.19 | 0.272 | N.S., p > 0.10 | 6.95 | 6.95 | 6.62 | 6.59 | −0.04 | 0.796 | N.S., p > 0.10 |
| Proportion of patients achieving the target BP (%) | 28.8 | 50.0 | 44.3 | 58.4 | −7.1 | 0.302 | N.S., p > 0.10 | 40.0 | 50.8 | 42.6 | 54.2 | 0.7 | 0.920 | N.S., p > 0.10 | |
| Internal coordination | |||||||||||||||
| 0 comorbidity | Average patient HbA1c | 7.03 | 7.36 | 6.90 | 6.81 | −0.42 | 0.120 | N.S., p > 0.10 | 7.14 | 7.34 | 6.77 | 6.87 | −0.10 | 0.759 | N.S., p > 0.10 |
| Proportion of patients achieving the target BP (%) | 32.1 | 40.0 | 40.3 | 50.0 | 1.8 | 0.877 | N.S., p > 0.10 | 39.5 | 40.0 | 45.4 | 41.3 | −4.6 | 0.684 | N.S., p > 0.10 | |
| 1+ comorbidity(ies) | Average patient HbA1c | 6.86 | 7.17 | 6.55 | 6.84 | −0.02 | 0.897 | N.S., p > 0.10 | 6.86 | 7.23 | 6.50 | 6.86 | −0.01 | 0.945 | N.S., p > 0.10 |
| Proportion of patients achieving the target BP (%) | 41.3 | 36.7 | 58.8 | 45.0 | −9.2 | 0.183 | N.S., p > 0.10 | 41.2 | 39.6 | 55.2 | 44.3 | −9.3 | 0.197 | N.S., p > 0.10 | |
| Program experience | |||||||||||||||
| 0 comorbidity | Average patient HbA1c | 7.15Table 5 footnote ** | 7.44Table 5 footnote ** | 6.77Table 5 footnote ** | 6.64Table 5 footnote ** | −0.42Table 5 footnote ** | 0.085Table 5 footnote ** | (+) | 7.08Table 5 footnote * | 7.61Table 5 footnote * | 6.99Table 5 footnote * | 6.79Table 5 footnote * | −0.72Table 5 footnote * | 0.034Table 5 footnote * | + |
| Proportion of patients achieving the target BP (%) | 38.1 | 18.2 | 48.3 | 22.7 | −5.7 | 0.573 | N.S., p > 0.10 | 35.1Table 5 footnote ** | 40.0Table 5 footnote ** | 52.1Table 5 footnote ** | 33.3Table 5 footnote ** | −23.7Table 5 footnote ** | 0.096Table 5 footnote ** | (−) | |
| 1+ comorbidity(ies) | Average patient HbA1c | 6.94 | 7.04 | 6.80 | 6.82 | −0.08 | 0.644 | N.S., p > 0.10 | 6.99 | 6.89 | 6.64 | 6.76 | 0.22 | 0.244 | N.S., p > 0.10 |
| Proportion of patients achieving the target BP (%) | 43.4 | 20.6 | 52.9 | 28.6 | −1.6 | 0.819 | N.S., p > 0.10 | 41.7 | 29.8 | 50.6 | 44.7 | 6.0 | 0.469 | N.S., p > 0.10 | |
|
Abbreviations: BP, blood pressure; DID, difference in differences; N.S., not significant; T6, 6-month patient follow-up; T12, 12-month patient follow-up. Notes: HbA1c is expressed as a percentage. Patients' clinical disease control results are measured by average patient HbA1c and the proportion of patients achieving the BP target at the 6- and 12-month follow-ups. A (+) or (−) symbol indicates the direction of the change. Data on personnel included in each of the analysis models and propensity scores are available from the authors upon request. |
|||||||||||||||
Table 6 shows that the proportion of patients achieving lifestyle targets is also little dependent on implementation variables. Achievement of the EX target is only influenced in patients with no comorbidities. The two significant effects are associated with the "resources" and "program experience" variables and are positive, but only at T6: the "low exposure to the implementation variable" group deteriorated, while the "high exposure to the implementation variable" group improved. The scope of the effect was substantial (+20.7% for resources and +26.3% for program experience).
| Patient subgroups and health outcomes | Implementation variables | ||||||||||||||
|---|---|---|---|---|---|---|---|---|---|---|---|---|---|---|---|
| T6 | T12 | ||||||||||||||
| Baseline | Follow-up | DID | Baseline | Follow-up | DID | ||||||||||
| Group with low exposure to the implementation variable | Group with high exposure to the implementation variable | Group with low exposure to the implementation variable | Group with high exposure to the implementation variable | DID | p | Direction | Group with low exposure to the implementation variable | Group with high exposure to the implementation variable | Group with low exposure to the implementation variable | Group with high exposure to the implementation variable | DID | p | Direction | ||
| Resources | |||||||||||||||
| 0 comorbidity | Proportion achieving the EX target (%) | 49.3Table 6 footnote * | 35.9Table 6 footnote * | 41.2Table 6 footnote * | 48.5Table 6 footnote * | 20.7Table 6 footnote * | 0.020Table 6 footnote * | + | 44.5 | 30.3 | 52.3 | 40.8 | 2.8 | 0.784 | N.S., p > 0.10 |
| Proportion of patients achieving the BCD target (%) | 21.4 | 14.0 | 41.4 | 35.5 | 1.4 | 0.857 | N.S., p > 0.10 | 25.0Table 6 footnote * | 15.9Table 6 footnote * | 43.4Table 6 footnote * | 15.9Table 6 footnote * | −18.3Table 6 footnote * | 0.038Table 6 footnote * | − | |
| 1+ comorbidity(ies) | Proportion achieving the EX target (%) | 30.3 | 31.6 | 39.4 | 38.3 | −2.3 | 0.688 | N.S., p > 0.10 | 34.0 | 32.2 | 35.5 | 34.9 | 1.3 | 0.846 | N.S., p > 0.10 |
| Proportion of patients achieving the BCD target (%) | 24.2 | 10.9 | 34.7 | 25.4 | 4.0 | 0.439 | N.S., p > 0.10 | 25.8 | 9.2 | 42.6 | 20.9 | −5.0 | 0.377 | N.S., p > 0.10 | |
| Compliance with clinical process | |||||||||||||||
| 0 comorbidity | Proportion achieving the EX target (%) | 37.9 | 54.2 | 40.0 | 55.1 | −1.1 | 0.899 | N.S., p > 0.10 | 30.9 | 51.4 | 39.1 | 52.8 | −6.8 | 0.506 | N.S., p > 0.10 |
| Proportion of patients achieving the BCD target (%) | 14.6 | 31.7 | 34.4 | 48.5 | −2.9 | 0.717 | N.S., p > 0.10 | 12.2 | 32.9 | 30.8 | 44.7 | −6.8 | 0.466 | N.S., p > 0.10 | |
| 1+ comorbidity(ies) | Proportion achieving the EX target (%) | 33.8 | 37.0 | 38.7 | 39.6 | −2.2 | 0.707 | N.S., p > 0.10 | 33.8 | 39.3 | 38.0 | 36.2 | −7.3 | 0.272 | N.S., p > 0.10 |
| Proportion of patients achieving the BCD target (%) | 17.5 | 26.3 | 25.9 | 39.0 | 4.3 | 0.423 | N.S., p > 0.10 | 21.2 | 25.0 | 32.9 | 42.9 | 6.1 | 0.330 | N.S., p > 0.10 | |
| Internal coordination | |||||||||||||||
| 0 comorbidity | Proportion achieving the EX target (%) | 53.6 | 37.2 | 49.2 | 45.3 | 12.4 | 0.158 | N.S., p > 0.10 | 51.2 | 30.7 | 56.1 | 36.6 | 1.1 | 0.913 | N.S., p > 0.10 |
| Proportion of patients achieving the BCD target (%) | 22.9 | 17.3 | 50.2 | 33.8 | −10.8 | 0.177 | N.S., p > 0.10 | 18.8 | 18.9 | 32.7 | 28.8 | −3.9 | 0.652 | N.S., p > 0.10 | |
| 1+ comorbidity(ies) | Proportion achieving the EX target (%) | 29.7 | 31.8 | 37.5 | 38.7 | −0.9 | 0.872 | N.S., p > 0.10 | 33.8 | 33.1 | 28.7 | 36.0 | 8.1 | 0.199 | N.S., p > 0.10 |
| Proportion of patients achieving the BCD target (%) | 23.4 | 16.9 | 28.9 | 30.2 | 7.7 | 0.143 | N.S., p > 0.10 | 22.5 | 18.6 | 34.0 | 36.8 | 6.7 | 0.259 | N.S., p > 0.10 | |
| Program experience | |||||||||||||||
| 0 comorbidity | Proportion achieving the EX target (%) | 48.1Table 6 footnote * | 22.0Table 6 footnote * | 43.8Table 6 footnote * | 43.9Table 6 footnote * | 26.3Table 6 footnote * | 0.002Table 6 footnote * | + | 44.8 | 29.7 | 49.1 | 37.8 | 3.9 | 0.702 | N.S., p > 0.10 |
| Proportion of patients achieving the BCD target (%) | 21.0Table 6 footnote ** | 15.0Table 6 footnote ** | 41.5Table 6 footnote ** | 22.5Table 6 footnote ** | −13.0Table 6 footnote ** | 0.090Table 6 footnote ** | (−) | 30.8 | 17.6 | 30.4 | 14.7 | −2.5 | 0.775 | N.S., p > 0.10 | |
| 1+ comorbidity(ies) | Proportion achieving the EX target (%) | 31.7 | 25.5 | 40.0 | 34.0 | 0.2 | 0.979 | N.S., p > 0.10 | 37.4 | 25.4 | 39.6 | 29.9 | 2.2 | 0.742 | N.S., p > 0.10 |
| Proportion of patients achieving the BCD target (%) | 20.5 | 11.7 | 35.1 | 19.1 | −7.1 | 0.160 | N.S., p > 0.10 | 22.1Table 6 footnote * | 12.5Table 6 footnote * | 38.7Table 6 footnote * | 7.8Table 6 footnote * | −21.3Table 6 footnote * | < 0.001Table 6 footnote * | − | |
|
Abbreviations: BCD, balanced carbohydrate distribution; DID, difference in differences; EX, exercise; N.S., not significant; T6, 6-month patient follow-up; T12, 12-month patient follow-up. Notes: Intermediate results in terms of lifestyle improvement are measured by the proportion of patients achieving the EX and BCD targets. A (+) or (−) symbol indicates the direction of the change. Data on personnel included in each analysis model and propensity scores are available from the authors upon request. |
|||||||||||||||
Achievement of the BCD target is influenced negatively by certain implementation variables (resources and program experience), for both the subgroups of patients with and without comorbidities. These negative effects, detected at T12, are substantial (from −12.6% to −21.3%). In addition, in terms of the proportion of patients achieving the BCD target, the "high exposure to the implementation variable" group linked to the resources effect remained unchanged, while the "low exposure to the implementation variable" group improved among patients without comorbidities. The "high exposure to the implementation variable" linked to program experience deteriorated, while the "low exposure to the implementation variable" group improved among patients with comorbidities. The variable with the greatest influence appears to be program experience.
Discussion
Low impact of implementation on patient outcomes
The main objective of our study was to assess the influence of variations in the implementation of four program components on patient outcomes. The expected effects for at least three aspects ranged from neutral to positive for each of the studied health indicators. Greater compliance with the clinical process initially set out in the regional program might have generated more varied effects if we assume that adapting the program to patient needs, which would likely result in improved health outcomes, might not follow the prescribed clinical process.
The results of the DID analyses show that clinical indicators (HbA1c and achievement of the BP target) and lifestyle indicators are not much influenced by implementation variables when we consider all the patients taking part in the study.
In addition, some variables seem to negatively influence the proportion of patients achieving the BCD target. In the case of program experience, particularly with regard to the diabetes component, it is reasonable to assume that the CSSS nutritionists with the most experience have more experience in managing and monitoring diabetic patients, which may make them more conservative in their assessment of achievement of the BCG indicator in such patients. In the case of resources, some of these may be used for other purposes than the cardiometabolic risk program. CSSSs providing the fewest visits to patients may be providing potentially longer or higher-quality interventions. And lastly, barriers to service delivery may exist, particularly with regard to the complexities of managing appointments that follow the clinical process schedule.
Apart from a number of mitigated effects of implementation variables on the carbohydrate distribution indicator, very few effects of these variables were brought to light overall as regards health impacts for all patients. This is consistent with the results of systematic reviews showing that no CCM component has, to date, been demonstrated as being solely responsible for the CCM's positive effects.Footnote 6,Footnote 7 It is highly likely that the implementation variables used in our study had a synergistic effect when taken together.
Effects in patients with no comorbidity
More significant effects of implementation variables were observed in the subgroup of patients without comorbidities than in the subgroup with comorbidities, particularly with respect to the "program experience" and "resources" variables.
It is possible that as part of the program, patients with comorbidities are given particular attention to meet their specific needs, regardless of variations in the implementation of certain aspects of the program.
The positive impact of program experience on HbA1c in patients with no comorbidities indicates that those patients, when exposed to a more experienced program, are more inclined to improve their diabetes control than patients who have comorbidities. Program experience, which corresponds to the duration of the program since the implementation of the diabetes component, doubtless reflects characteristics pertaining to expertise, particularly with regard to managing diabetic patients. Our results suggest that this expertise is perhaps better adapted to the management of diabetic patients with no comorbidities. Although the proportion of patients achieving the BCG target in the most experienced CSSS appears to have dropped by the 6-month follow-up, nutritionists in the program appear to contribute to the final program objective of diabetes control as measured by improvements in the average HbA1c of patients without comorbidities.
Resources, like program experience, have the expected positive impact on the EX target at the 6-month follow-up. Patients without comorbidities doubtless tend to increase their exercise levels in response to increased access to health care professionals who provide support and encouragement in their efforts to make changes, as well as the program expertise developed if it is more extensive in their CSSS. Patients with comorbidities benefit less from resource availability, particularly if they are dealing with physical or mental obstacles to exercise related to the number and nature of the other health problems from which they suffer.Footnote 18
Moderate variations in implementation
The implementation analysis showed a few differences among the six participating CSSSs with regard to the program aspects implemented, but overall, the program was implemented fairly similarly across the board. The moderate variation observed can be explained by the fact that the program was very clearly defined and that the CSSSs agreed to follow the general implementation framework suggested by the Agency. Our analyses therefore compared a group with a low level of implementation to a group with a high level of implementation for each variable, but on the basis of variations that proved to be modest. This may in part explain why the variations observed had little effect on patient outcomes and, in some cases, even had unexpected impacts.
Program experience is probably the implementation variable that caused the greatest variations. A single CSSS was in the "high" category for this variable, which may explain its more substantial impact on patient results.
Strengths and limitations
Our study has a number of limitations. First, this is an exploratory study, involving post-hoc analyses. Also, the large number of analyses increases Type I errors. Since the purpose of the study was not to assess the program's effectiveness, we cannot make any determination in that regard but can only reach conclusions as to the impact of variations in the implementation of the characteristics studied. There is no control group, given the fact that the study was carried out in an actual program implementation context, which limits the interpretation of results. Moreover, the quasi-experimental design involves limitations with regard to its assumption that results for the "high exposure to the implementation variable" would have mirrored those of the "low exposure to the implementation variable" group had it not had such high exposure.
To our knowledge, there were no changes in practice in any of the CSSSs that may have affected the study's results, but we were unable to assess this component directly. We were also unable to assess the program's effectiveness on cardiometabolic risk across all program participants, since we used a non-probability sample, which prevents us from gauging its representativeness. However, according to the analysis of the data at our disposal, the patients who agreed to take part in the evaluation are identical in terms of age and sex to the patients participating in the program. We do not have any data characterizing the program's target population in the various CSSS territories.
The sample size was smaller than anticipated owing to the program's low coverage, which limited the breadth of our analyses. We did not use any interaction terms in the analyses (whose purpose was exploratory), which allowed us to gauge the impact of each variable on each of the subgroups but prevented us from comparing the impact of implementation variables between the two patient subgroups (patients with and without comorbidities). Measures linked to lifestyle indicators have more limited reliability than those associated with clinical indicators. The lack of a blind for assessing health indicators may generate information bias, but in our study neither the patients nor the health care professionals collecting information on the health indicators were aware of the group to which they belonged, as these were defined after the fact. Lastly, data collection proved more difficult than anticipated early in the project's implementation phase, as this period was mainly devoted to training new teams and learning new work methods, which affected the quality of the collected data (entry errors, missing data). Imputation of missing data nonetheless allowed us to enhance the quality of all the data and reduce the non-response bias.Footnote 14
The type of analysis selected is one of this study's major strengths. The analysis of difference in differences, with the use of propensity scores, is a method that did indeed make it possible to test causal relationships by comparing two groups over time: one group exposed to a program with a more strongly implemented aspect and another group where the implementation of that same program aspect was weaker. The groups were therefore comparable to one another because the effect of the exposure was isolated.
Another of the study's strengths is that it attempted to draw a connection between the variations related to local environments in the implementation of certain aspects of the program to patient impacts, while also linking them to contextual elements stemming from the implementation analysis conducted at the time of the program's implementation. Quantification of qualitative variables is rarely found in the literature, and this is an innovative practice. However, the identification of variables that, when taken independently, may have a direct impact on patient results is a challengeFootnote 19 and it is likely that the aspects selected in our analyses as being more likely to directly influence patient outcomes acted synergistically.
The patients taking part in the evaluation entered the program at different times throughout the assessment period. We elected to consider implementation T40, or the evaluation conclusion, as the best approximation of program implementation levels for each of the aspects under study. This strategy may, however, have caused a certain underestimation of the association between variations in aspects of program implementation and patient impacts. The implementation analysis showed that changes under way mid-program (implementation T20) were heading toward the program's status at implementation T40, justifying this methodology choice.
As mentioned previously, the implementation analysis showed differences among the CSSSs as regards program implementation, but those differences remained fairly modest. Consequently, for each dichotomized implementation variable, the difference between categories is moderate, limiting our ability to draw connections between implementation variables and patient outcomes.
Lastly, it should be mentioned that the implementation variables each carry wording that represents the aspect on which the CSSSs varied and that the groups were divided on this basis for analysis purposes. We must bear in mind that, for each implementation variable, the two CSSS groups can also differ in other characteristics than those indicated in the wording. This means that we cannot state that the effect of an implementation variable observed via our analysis is exclusively due to the concept reflected in the wording of the variable and not, at least in part, due to another, unmeasured characteristic that varies among CSSSs in a manner similar to the selected variable.
Linking variations in cardiometabolic risk program implementation to patient health outcomes is one of the study's great strengths. It allows us to gauge the extent to which variations in program implementation in the field, related to differing local contexts, have an impact on patient results. The combination of results presented in this study with the information on the contextual elements collected during the implementation analysis make it possible to enhance the external validity of the results and the possibility that they can be used in similar contexts, in whole or in part. These results can guide decision-making with regard to the implementation of future CCM-based projects addressing other chronic diseases in populations in Montréal, in Quebec, or elsewhere in Canada.
Conclusion
The results of this study show that some variations in the implementation of various aspects of the cardiometabolic risk program have little influence on patients' health outcomes, particularly on the clinical indicators of HbA1c and the achievement of blood pressure treatment targets.
Generally speaking, knowing that 6 CSSSs in the study implemented a program that was fairly similar, the moderate differences observed in this study do not appear to have had an impact on patient outcomes.
These results are an incentive to continue research to assess with greater accuracy the impact of variations in program implementation in various settings. The integration of qualitative and quantitative methods is a contribution that enriches the interpretation of our results and is a research direction to be pursued and improved. In that respect, greater cohesion between the qualitative and quantitative processes, particularly with regard to collecting data on the implementation of the intervention and on patient outcomes, is needed in conducting this type of research, in order to be able to better assess the impact of implementation extent on patient health outcomes.
Acknowledgments
The research project from which the content of this article was drawn was funded by the Canadian Institutes of Health Research and the Pfizer-FRSQ-MSSS (Fonds de recherche en santé du Québec – Ministère de la Santé et des Services sociaux) Chronic Disease Fund. The authors would like to highlight the contributions of collaborators associated with the project at the Agence de la santé et des services sociaux de Montréal and in participating Centres de santé et des services sociaux (Sud-Ouest–Verdun, Jeanne-Mance, Cœur-de-l'Île, Pointe-de-l'Île, St Léonard–St-Michel, Bordeaux–Cartierville–St-Laurent).
Conflicts of interest
The authors have no conflicts of interest to declare.
Authors' contributions and statement
All authors took part in designing and drafting the manuscript and interpreting the data. All authors also took part in the critical review and read and approved the final manuscript.
The contents of this article and opinions expressed therein are those of the authors and do not necessarily represent the position of the Government of Canada.
References
- Footnote 1
-
Ransom T, Goldenberg R, Mikalachki A, Prebtani APH, Punthakee, Z. Clinical practice guidelines: reducing the risk of developing diabetes. Canadian Journal of Diabetes, 2013;37(Suppl 1):S16-S19. Available from: http://guidelines.diabetes.ca/app_themes/cdacpg/resources/cpg_2013_full_en.pdf
- Footnote 2
-
Campbell NS, Lackland D, Niebylski N. Why prevention and control are urgent and important: a 2014 fact sheet from the World Hypertension League and the International Society of Hypertension [Internet]. World Hypertension League (US) and International Society of Hypertension (UK);2014. Available from: http://ish-world.com/data/uploads/WHL_ISH_2014_Hypertension_Fact_Sheet_logos.pdf
- Footnote 3
-
Wagner EH, Austin BT, Davis C, Hindmarsh M, Schaefer J, Bonomi A. Improving chronic illness care: translating evidence into action. Health Affairs. 2001;20(6):64-78. doi: 10.1377/hlthaff.20.6.64.
- Footnote 4
-
Coleman K, Austin BT, Brach C, Wagner EH. Evidence on the chronic care model in the new millennium. Health Aff. 2009; 28(1):75-85. doi: 10.1377/hlthaff.28.1.75.
- Footnote 5
-
Bodenheimer T, Wagner EH, Grumbach K. Improving primary care for patients with chronic illness. The Chronic Care Model, Part 2. JAMA. 2002;288(15):1909-1914. doi: 10.1001/jama.288.15.1909.
- Footnote 6
-
Davy C, Bleasel J, Liu H, Tchan M, Ponniah S, Brown A. Effectiveness of chronic care models: opportunities for improving healthcare practice and health outcomes: a systematic review. BMC Health Services Research. 2015;15(194). doi: 10.1186/s12913-015-0854-8.
- Footnote 7
-
Stellefson M, Dipnarine K, Stopka C. The Chronic Care Model and diabetes management in US primary care settings: a systematic review. Prev Chronic Dis. 2013;10(120180). doi: 10.5888/pcd10.120180.
- Footnote 8
-
Provost S, Pineault R, Tousignant P, Hamel M, Borgès Da Silva R. Evaluation of the implementation of an integrated primary care network for prevention and management of cardiometabolic risk in Montréal. BMC Fam Pract. 2011;12(126). doi: 10.1186/1471-2296-12-126.
- Footnote 9
-
Shadish WR, Cook TD, Campbell DT. Experimental and quasi-experimental designs for generalized causal inference. 2nd ed. Belmont, CA: Wadsworth; 2002. 656 p.
- Footnote 10
-
Peterson KP, Pavlovich JG, Goldstein D, Little R, England J, Peterson CM. What is hemoglobin A1c? An analysis of glycated hemoglobins by electrospray ionization mass spectrometry. Clinical Chemistry, 1998;44(9):1951-1958. Available from: http://clinchem.aaccjnls.org/content/44/9/1951
- Footnote 11
-
Nolin B, Prud'Homme D, Godin G, Hamel D. Enquête québécoise sur l'activité physique et la santé 1998. Québec (Canada): Institut national de santé publique du Québec et Kino-Québec; 2002. 137 p.
- Footnote 12
-
Blanchet C, Trudel J, Plante C. Résumé du rapport La consommation alimentaire et les apports nutritionnels des adultes québécois: Coup d'œil sur l'alimentation des adultes québécois. Québec (Québec): Institut national de santé publique du Québec; 2009. 12 p.
- Footnote 13
-
Andridge RR and Little RJA. A review of hot deck imputation for survey non-response. Int Stat Rev. 2010;78(1):40-64. doi: 10.1111/j.1751-5823.2010.00103.x.
- Footnote 14
-
Haziza, D. Inférence en présence d'imputation: un survol. 8es Journées de méthodologie statistique, Paris; 2002, 16-17 décembre. Available from: http://jms.insee.fr/files/documents/2002/330_1-JMS2002_SESSION2_HAZIZA_INFERENCE-PRESENCE-IMPUTATION-UN-SURVOL_ACTES.PDF
- Footnote 15
-
Gertler PJ, Martinez S, Premand P, Waylings LB, Vermeersch CMJ. Impact evaluation in practice [Internet]. Washington (DC): The World Bank; 2011. 244 p. Available from: http://siteresources.worldbank.org/EXTHDOFFICE/Resources/5485726-1295455628620/Impact_Evaluation_in_Practice.pdf
- Footnote 16
-
Caliendo M, Kopeinig S. Some practical guidance for the implementation of propensity score matching. Bonn (Allemagne): Forschungsinstitut zur Zukunft der Arbeit [Institut de recherche sur l'avenir du travail]; 2005. 29 p. no 1588.
- Footnote 17
-
Villa JM. DIFF: Stata module to perform differences in differences estimation [Internet]. Boston (US): Boston College Department of Economics; 2009. Available from: https://econpapers.repec.org/software/bocbocode/s457083.htm
- Footnote 18
-
Piette JD, Kerr EA. The Impact of comorbid chronic conditions on diabetes care. Diabetes Care. 2006;29(3):725-731. doi: 10.2337/diacare.29.03.06.dc05-2078.
- Footnote 19
-
Brousselle A, Champagne F, Contandriopoulos A-P, Hartz Z. L'Évaluation: concepts et méthodes. 2nd edition. Montréal (QC): Presses de l'Université de Montréal; 2011. 336 p.