
Addition of food group equivalents to the Canadian Diet History Questionnaire II for the estimation of the Canadian Healthy Eating Index-2005
Health Promotion and Chronic Disease Prevention in Canada
Maria McInerney, MSc Footnote 1; Vikki Ho, PhD Footnote 2; Anita Koushik, PhD Footnote 2; Isabelle Massarelli, RD, Footnote 3; Isabelle Rondeau, RD, Footnote 3; Gavin R. McCormack, PhD Footnote 1; Ilona Csizmadi, PhD Footnote 1
https://doi.org/10.24095/hpcdp.38.3.03
This original quantitative research article has been peer reviewed.
Correspondence: Maria McInerney, Department of Community Health Sciences, Cumming School of Medicine, University of Calgary, 3280 Hospital Drive NW, Calgary, AB T2N 4Z6; Email: mcmciner@ucalgary.ca
Abstract
Introduction: Poor diet quality has been shown to increase the risk of common chronic diseases that can negatively impact quality of life and burden the healthcare system. Canada’s Food Guide evidence-based recommendations provide dietary guidance aimed at increasing diet quality. Compliance with Canada’s Food Guide can be assessed with the Canadian Healthy Eating Index (C-HEI), a diet quality score. The recently designed Canadian Diet History Questionnaire II (C-DHQ II), a comprehensive food frequency questionnaire could be used to estimate the C-HEI in Canadian populations with the addition of food group equivalents (representing Canada’s Food Guide servings) to the C-DHQ II nutrient database. We describe methods developed to augment the C-DHQ II nutrient database to estimate the C-HEI.
Methods: Food group equivalents were created using food and nutrient data from existing published food and nutrient databases (e.g. the Canadian Community Health Survey —Cycle 2.2 Nutrition [2004]). The variables were then added to the C-DHQ II companion nutrient database. C-HEI scores were determined and descriptive analyses conducted for participants who completed the C-DHQ II in a cross-sectional Canadian study.
Results: The mean (standard deviation) C-HEI score in this sample of 446 adults aged 20 to 83 was 64.4 (10.8). Women, non-smokers, and those with more than high school education had statistically significant higher C-HEI scores than men, smokers and those with high school diplomas or less.
Conclusion: The ability to assess C-HEI using the C-DHQ II facilitates the study of diet quality and health outcomes in Canada.
Keywords: diet quality, healthy eating index, food frequency questionnaire, dietary assessment, nutrient database
Highlights
- High diet quality is important for chronic disease prevention.
- The Canadian Healthy Eating Index (C-HEI), a dietary pattern score which reflects age- and sex-specific dietary recommendations in the 2007 Eating Well with Canada’s Food Guide (CFG), can be used to measure and monitor diet quality.
- Food group equivalents (representing CFG servings) are required to derive the C-HEI, however, these variables are absent from most Canadian nutrient databases.
- This study demonstrates a rigorous yet feasible approach for adding food group equivalents to the Canadian Diet History Questionnaire II nutrient database.
- Now, the Canadian Diet History Questionnaire II can be used to derive the C-HEI to quantify diet quality in Canadian populations.
Introduction
Dietary pattern indices are multidimensional measures that capture several components of diet and can be used to assess diet quality.Footnote 1 There is growing interest in the development, estimation, and application of dietary pattern indices because of the relation between diet and chronic diseasesFootnote 2,Footnote 3,Footnote 4,Footnote 5 and mortality risk.Footnote 6 From a surveillance perspective, some dietary pattern indices are useful in determining how well populations meet national dietary recommendations.Footnote 7,Footnote 8
The Healthy Eating Index (HEI)Footnote 9 is a diet quality score originally developed by the United States Department of Agriculture. Similarities between the dietary recommendations for Canada and the United States facilitate the adaptation of the American HEI for Canada.Footnote 8,Footnote 10,Footnote 11,Footnote 12,Footnote 13 In one adaptationFootnote 8, the Canadian Healthy Eating Index 2005 (C-HEI) was created using the 2007 Eating Well with Canada’s Food Guide (CFG)Footnote 14 recommendations and serving equivalents, thus reflecting the Canadian age- and sex-specific dietary recommendations. The C-HEI is therefore appropriate for monitoring and evaluating the diet quality of Canadians.Footnote 8,Footnote 10
C-HEI scores range from 0 to 100, representing total diet quality through adequacy and moderation componentsFootnote 8 with higher scores representing closer alignment with CFG recommendations. The C-HEI adequacy components reflect intakes of total fruits and vegetables, whole fruit, dark green and orange vegetables, milk and alternatives, meat and alternatives, total grain products, whole grain products and unsaturated fats. The moderation components reflect intakes of sodium, saturated fats, and other foods not recommended in CFG. Table 1 outlines the C-HEIFootnote 8 scoring criteria.
| Component (food group) | Range of scores | Scoring criteria |
|---|---|---|
| AdequacyTable 1 - Footnote a | 0 to 60 points | Table 1 - Footnote – |
| Total vegetables and fruit | 0 to 10 points | Minimum: 0 Maximum: 4 to 10 servingsTable 1 - Footnote b |
| Whole fruit | 0 to 5 points | Minimum: 0 Maximum: 0.8 to 2.1 servings (21% of recommendation for total vegetables and fruit)Table 1 - Footnote b |
| Dark green and orange vegetables | 0 to 5 points | Minimum: 0 Maximum: 0.8 to 2.1 servings (21% of recommendation for total vegetables and fruit)Table 1 - Footnote b |
| Total grain products | 0 to 5 points | Minimum: 0 Maximum: 3 to 8 servingsTable 1 - Footnote b |
| Whole grain products | 0 to 5 points | Minimum: 0 Maximum: 1.5 to 4 servings (50% of recommendation for total grain products)Table 1 - Footnote b |
| Milk and alternatives | 0 to 10 points | Minimum: 0 Maximum: 2 to 4 servingsTable 1 - Footnote b |
| Meat and alternatives | 0 to 10 points | Minimum: 0 Maximum: 1 to 3 servings (75 to 225 grams)Table 1 - Footnote b |
| Unsaturated fats | 0 to 10 points | Minimum: 0 Maximum: 30 to 45 gramsTable 1 - Footnote b |
| ModerationTable 1 - Footnote c | 0 to 40 points | Table 1 - Footnote – |
| Saturated fats | 8 to 10 points 0 to 8 points |
Maximum 7% to 10% of total energy intake |
| Sodium | 8 to 10 points 0 to 8 points |
Adequate intake to tolerable upper intake level |
| “Other food” | 0 to 20 points | Minimum: 5% or less of total energy intake Maximum: 40% or total energy intake |
| Source: Garriguet D. Diet quality in Canada. Health Rep. 2009;20(3):41-52. | ||
The Canadian Diet History Questionnaire II (C-DHQ II), a comprehensive food frequency questionnaire, was recently adapted for use in Canada from the US National Cancer Institute’s DHQ II, using dietary intake data reported in the Canadian Community Health Survey, Cycle 2.2, Nutrition (2004)Footnote 15 to create the 331 C-DHQ II database food categories. The C-DHQ II is available onlineFootnote 16,Footnote 17 and is used in numerous Canadian studies currently in progressFootnote 18,Footnote 19 and there is growing interest in using it to assess diet quality as was an earlier version of the questionnaire.Footnote 20
We describe methods used to create food group equivalents (representing CFG servings) required to derive the C-HEI (total fruits and vegetables, whole fruit, dark green and orange vegetables, milk and alternatives, meat and alternatives, total grain products, whole grain products and other foods) for foods queried on the C-DHQ II. We also present food group equivalents and C-HEI scores derived from the C-DHQ II for a sample of Canadian adults enrolled in the “Pathways to Health Study.”Footnote 21 This article is based on a larger study reported in the graduate thesis Associations between the Neighbourhood Food Environment, Neighbourhood Socioeconomic Status and Diet Quality in Canadian Adults.Footnote 22
Methods
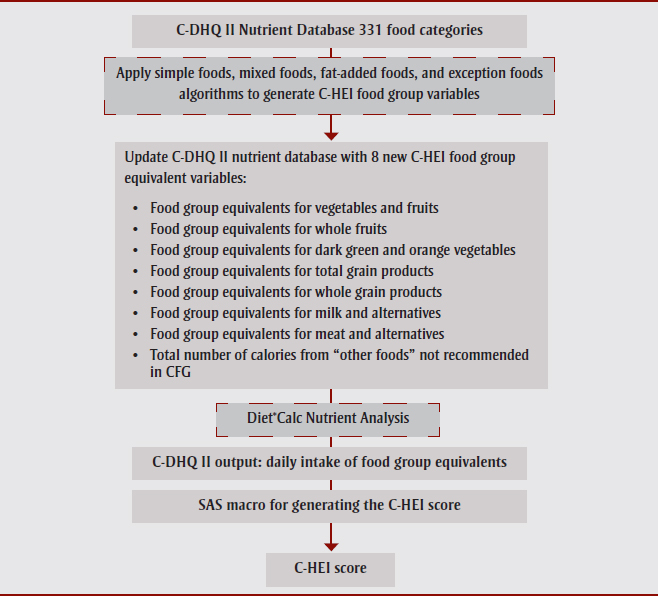
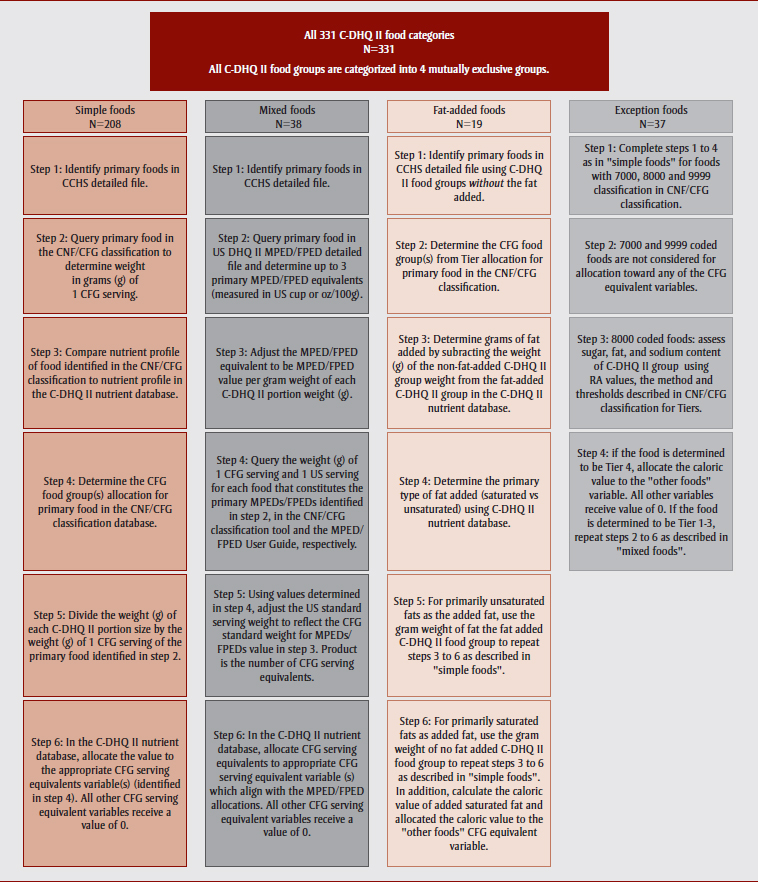
An overview of the steps required to derive the C-HEI from the C-DHQ II is presented in Figure 1. Eight new variables representing food group equivalents (CFG servings) for total fruits and vegetables, whole fruit, dark green and orange vegetables, milk and alternatives, meat and alternatives, total grain products, whole grains and other foods, were created for each of the 331 C-DHQ II nutrient database food categories. Algorithm steps for creating the new variables from Canadian Community Health Survey foods are shown in Figure 2.
Abbreviations: C-DHQ II, Canadian Diet History Questionnaire II; CFG, Eating Well with Canada’s Food Guide; C-HEI, Canadian Healthy Eating Index; SAS, Statistical Analysis System Software.
Figure 1 - Text Description
This figure depicts an overview of the steps required to derive the Canadian Healthy Eating Index (C-HEI) from the Canadian Diet History Questionnaire II (C-DHQ II):
C-DHQ II Nutrient Database 331 food categories
Apply simple foods, mixed foods, fat-added foods, and exception food algorithms to generate C-HEI food group variables
Update C-DHQ II nutrient database with 8 new C-HEI food group equivalent variables:
- Food group equivalents for vegetables & fruits
- Food group equivalents for whole fruits
- Food group equivalents for dark green and orange vegetables
- Food group equivalents for total grain products
- Food group equivalents for whole grain products
- Food group equivalents for milk & alternatives
- Food group equivalents for meat & alternatives
- Total number of calories from “other foods” not recommended in CFG
Diet*Calc Nutrient Analysis
C-DHQ II output: daily intake of food group equivalents
SAS macro for generating the C-HEI score
C-HEI score
Abbreviations: CCHS, Canadian Community Health Survey; C-DHQ II, Canadian Diet History Questionnaire II; CFG, Eating Well with Canada’s Food Guide; C-HEI, Canadian Healthy Eating Index; CNF/CFG, Health Canada’s Canadian Nutrient File/Canada’s Food Guide Classification Tool; DHQ II, Diet History Questionnaire II; FPED, Food Patterns Equivalents Database; MPED, MyPyramid Equivalents Database; RA, Reference Amounts (from CNF/CFG).
Notes: N = 29 food groups did not follow any of the algorithms because the foods were either not found in the CNF/CFG, the foods comprising the C-DHQ II group could not be determined, or there was substantial conflict in Tier allocation for the most frequently reported foods. These food groups were considered on an individual basis and reviewed by at least 3 reviewers.
According to the CNF/CFG Tool: 7000 = “other foods recommended in the CFG”; 8000 = “recipes not classified”; 9999 = “food and beverage not classified”.
Figure 2 - Text Description
This figure presents the basic algorithms steps for creating the new variables from Canadian Community Health Survey foods.
All 331 C-DHQ II food categories
N=331
All C-DHQ II food groups are categorized into 4 mutually exclusive groups.
For simple foods
Simple foods
N=208
- Step 1: Identify primary foods in CCHS detailed file.
- Step 2: Query primary food in the CNF/CFG classification to determine weight in grams (g) of 1 CFG serving.
- Step 3: Compare nutrient profile of food identified in the CNF/CFG classification to nutrient profile in the C-DHQ II nutrient database.
- Step 4: Determine the CFG food group(s) allocation for primary food in the CNF/CFG classification database.
- Step 5: Divide the weight (g) of each C-DHQ II portion size by the weight (g) of 1 CFG serving of the primary food identified in step 2.
- Step 6: In the C-DHQ II nutrient database, allocate the value to the appropriate CFG serving equivalents variable(s) (identified in step 4). All other CFG serving equivalent variables receive a value of 0.
For mixed foods
Mixed foods
N=38
- Step 1: Identify primary foods in CCHS detailed file.
- Step 2: Query primary food in US DHQ II MPED/FPED detailed file and determine up to 3 primary MPED/FPED equivalents (measured in US cup or ozs/100g).
- Step 3: Adjust the MPED/FPED equivalent to be MPED/FPED value per gram weight of each C-DHQ II portion weight (g).
- Step 4: Query the weight (g) of 1 CFG serving and 1 US serving for each food that constitutes the primary MPEDs/FPEDs identified in step 2, in the CNF/CFG classification tool and the MPED/FPED User Guide, respectively.
- Step 5: Using values determined in step 4, adjust the US standard serving weight to reflect the CFG standard weight for MPEDs/FPEDs value in step 3. Product is the number of CFG serving equivalents.
- Step 6: In the C-DHQ II nutrient database, allocate CFG serving equivalents to appropriate CFG serving equivalent variable(s) which align with the MPED/FPED allocations. All other CFG serving equivalent variables receive a value of 0.
For fat added foods
Fat added foods
N=19
- Step 1: Identify primary foods in CCHS detailed file using C-DHQ II food groups without the fat added.
- Step 2: Determine the CFG food group(s) from Tier allocation for primary food in the CNF/CFG classification.
- Step 3: Determine grams of fat added by subracting the weight (g) of the non fat added C-DHQ II group weight from the fat added C-DHQ II group in the C-DHQ II nutrient database.
- Step 4: Determine the primary type of fat added (saturated vs unsaturated) using C-DHQ II nutrient database.
- Step 5: For primarily unsaturated fats as the added fat, use the gram weight of fat the fat added
C-DHQ II food group to repeat steps 3 to 6 as described in "simple foods".
Step 6: For primarily saturated fats as added fat, use the gram weight of no fat added C-DHQ II food group to repeat steps 3 to 6 as described in "simple foods". In addition, calculate the caloric value of added saturated fat and allocated the caloric value to the "other foods" CFG equivalent variable.
For exception foods
Exception foods
N=37
- Step 1: Complete steps 1 to 4 as in "simple foods" for foods with 7000, 8000 and 9999 classification in CNF/CFG classification.
- Step 2: 7000 and 9999 coded foods are not considered for allocation toward any of the CFG equivalent variables.
- Step 3: 8000 coded foods: assess sugar, fat, and sodium content of C-DHQ II group using RA values, the method and thresholds described in CNF/CFG classification for Tiers.
- Step 4: if the food is determined to be Tier 4, allocate the caloric value to the "other foods" variable. All other variables receive value of 0. If the food is determined to be Tier 1-3, repeat steps 2 to 6 as described in "mixed foods".
Multiple data sources were used to compute the new variables: the C-DHQ II nutrient database, the most recent US DHQ II nutrient database, Health Canada’s Classification of Foods in the Canadian Nutrient File According to Eating Well with Canada’s Food Guide report and accompanying database (hereafter referred to as CNF/CFG Classification)Footnote 23,Footnote 24, the detailed food and recipe file derived from the Canadian Community Health SurveyFootnote 15 and used in the development of the C-DHQ II nutrient database, the National Health and Nutrition Examination Survey food and nutrient database used to create the US DHQ II nutrient database, and the US Food Patterns Equivalent Database.Footnote 25
Of the 331 food categories in the C-DHQ II nutrient database, 302 were divided into four broad groups based on their composition (ingredients). Algorithms of varying complexity were required to disaggregate the food categories according to the components of the C-HEI (food group equivalents). The four algorithm groups were: 1) simple foods; 2) mixed foods; 3) fat-added foods; and 4) exception foods (Figure 2). The 29 remaining food groups were allocated on an individual basis. The simple foods category represented C-DHQII foods that comprise mainly single food items (e.g. milk, bananas, peppers, breads, and meats). The mixed foods category represented C-DHQII foods that comprise multiple foods (e.g. pasta with meat sauce, chicken mixtures [sandwiches], pizza with vegetables and meat). The fat-added foods category represented C-DHQII foods that comprise simple food items identified in the C-DHQII as having fat added in the cooking or preparation process (e.g. peppers with fat added). The exception foods category represented C-DHQII foods that were usually not consumed as stand-alone foods (e.g. sauces, spreads, and condiments).
For each of the 302 food categories we identified the top one to three most frequently reported foods in the Canadian Community Health Survey food and recipe file (hereafter referred to as the primary foods) to represent the corresponding C-DHQ II food category for deriving food group equivalents. The top two or three foods were examined if multiple foods with similar nutrient profiles were reported at similar frequencies of intake. In cases of multiple primary foods, we estimated the average standard CFG serving weight in grams and then weighted the food group allocations accordingly.
The primary food(s) identified in the Canadian Community Health Survey food and recipe file were further examined to confirm that they were sufficiently representative of corresponding C-DHQ II food categories by comparing their nutrient profiles to the category-specific nutrient profiles in the C-DHQ II nutrient database. Nutrient content for key nutrients [energy (kcal), total sugar (g), total fat (g), total saturated fat (g), and sodium (mg)] were compared for 100 gram equivalents of food. The primary food was deemed sufficiently representative if the key nutrient values from the Canadian Community Health Survey file and the C-DHQ II nutrient database profile differed by ≤ 5%. In cases where the difference was > 5%, the next most frequently reported foods were additionally considered until a sufficient representation was found (exploring up to three top reported foods per C-DHQ II food category). This approach, while conservative, was considered reasonable based on the expert opinion of the authors (MM, IR, IM and IC).
In reality, the number of nutrient profiles examined to identify a primary food varied when the top most frequently reported foods were reported at similar frequencies. In such cases, the key nutrients of all the top reported foods were examined to determine similarities amongst their nutrient profiles. If the nutrient profiles differed by ≥ 10%, then up to five foods were considered for analysis. We then calculated food group equivalents for each food and then averaged the nutrient values to determine a final value. Other exceptions occurred in the mixed foods algorithm where up to 20 nutrient profiles could be examined to determine the most representative primary food(s) by consensus established amongst co-authors. This was done to account for the diversity of foods included in C-DHQ II mixed foods. Two co-authors (IM and IR) randomly reviewed 10% of the food group equivalent variables as a quality assurance check by manually recalculating the food group equivalents to ensure the algorithms were correctly applied.
The CNF/CFG classification was designed by Health Canada to assess the Canadian population’s adherence to the CFG recommendation for food group intakes for healthy eating.Footnote 23,Footnote 24 The CFG classification was applied to the Canadian Nutrient File (2001b)Footnote 26 which was the nutrient composition database linked to reported foods in the Canadian Community Health Survey. The CNF/CFG classification assigns each CNF food to a CFG food group and subgroup. For the four major CFG food groups (vegetables and fruits, grain products, milk and alternatives, meat and alternatives) CNF foods are classified into “Tiers” according to the quality of their alignment with CFG recommendations with additional consideration given to fat, sugar, and sodium content.Footnote 23,Footnote 24 Tier 1 and 2 are “foods in line with CFG guidance”; Tier 3 foods are “foods partially in line with CFG guidance”; and Tier 4 food are “foods not in line with CFG guidance.”Footnote 23,Footnote 24
We used the CNF/CFG classification and accompanying database to identify the weight of one standard CFG serving size of the primary food and the CFG food group(s) to which the primary food belonged (i.e. where the food group equivalent should be allocated). All Tier 4 foods and those coded in the CNF/CFG classification as “other foods”; “meal replacements and supplements” and, “foods and beverages not classified” were allocated to the food group equivalent for “other foods”. In cases where the primary food was not found in the CNF/CFG classification, or if the exact type of food was unknown (e.g. “bread” with no further descriptors) the standard weight for such foods in the CFGFootnote 14 was used (e.g. in CFG the serving weight for bread is 30 g). For primary food(s) not found in the CNF/CFG classification or in the US DHQII or National Health and Nutrition Examination Survey database, consultation among authors determined the most appropriate CFG food group allocation(s).
For multiple primary foods and where there was discrepancy in Tier classification between the primary foods, the Tier classification that best represented the primary food was assumed (i.e. the Tier allocation that appeared most frequently). When the predefined algorithms could not be used due to missing information (e.g. primary food was not found in the CNF/CFG classification database), and for foods coded in the CNF/CFG classification as “recipes”, similar foods or ingredients, were identified to determine an appropriate Tier allocation for the C-DHQ II category. In such cases, authors discussed and decided on appropriate group allocation.
For the mixed food algorithm, we employed the US Food Patterns Equivalents (FPED) and MyPyramid Equivalent Database (MPED) food group allocations in the National Health and Nutrition Examination Survey foods and recipes database to guide food group equivalent allocation. MPEDs were used for grain products (instead of FPEDs) since the methods employed to derive their values aligned more closely with the current method for deriving food group equivalents.Footnote 26
To determine the ingredients of mixed foods (e.g. type of meat, vegetable, grain), the descriptors of the primary food(s) found in the Canadian Community Health Survey food and recipe file were used. In some cases, assumptions were based on the authors’ knowledge of ingredients typically included in mixed food recipes (e.g. for vegetable spring rolls, cabbage was assumed as the primary contributor to the vegetables and fruit CFG food group). To confirm acceptability of assumptions, we compared the nutrient profiles of primary food(s) in the National Health and Nutrition Examination Survey database to nutrient profiles for the food category in the C-DHQ II nutrient database, with attention to key nutrients previously mentioned. An approximate threshold of 20% difference between the two nutrient profiles was deemed acceptable given the difference in food composition between the US and Canada.Footnote 17 For each primary food, the three highest contributing FPED (and in the case of grains, MPED) values were adjusted to reflect the total gram weight of each ingredient of the mixed food found in each of the six C-DHQ II portion sizes. The gram weights were then adjusted from US standard serving weightsFootnote 26 to standard CFG serving weights.Footnote 24
There were 29 C-DHQ II food categories that could not be allocated according to the four mutually exclusive food groups because either the foods were not found in the CNF/CFG classification, the foods comprising the C-DHQ II food categories could not be determined, there was substantial conflict in Tier allocation for the most frequently reported foods, or the food was not relevant for C-HEI estimation (e.g. spices, coffee, tea). We reviewed these 29 C-DHQ II food categories on an individual basis.
Because no brand names were available in the Canadian Community Health Survey foods and recipes file for ready-to-eat breakfast cereals, they could not be identified in the CNF/CFG classification to determine if they contributed to whole grains. As such, an algorithm was designed to minimize the under-estimation of whole grains. To determine a standard gram weight for ‘ready-to-eat’ breakfast cereals in the C-DHQ II food categories, an average weight from all ‘ready-to-eat’ breakfast cereals in the CNF/CFG classification database was calculated. To ensure that an accurate amount of whole grains were allocated, the US DHQ II databases allocation of whole grains for ‘ready-to-eat’ breakfast cereals was used. The MPED groups considered were “total grains” and “whole grains” and used in the formula:
Whole grain MPED ÷ Total grain MPED × 100 = % whole grain in total grain MPED
We then multiplied the percent whole grain in total grain MPED by the Canadian total grains value (using the simple foods algorithm) to estimate the value to be assigned to whole grains food group equivalent variable.
Completed food group equivalents for all C-DHQ II food categories were added to the C-DHQ II nutrient database. Daily intake of food group equivalents for each food group was estimated by the DietCalc software (version 1.5.1), the nutrient analysis program for the C-DHQ II. SAS was used to analyze the C-DHQ II output and to derive the C-HEI (the SAS code to derive the C-HEI is available from authors).
Test sample and procedure
Participants recruited from the “Pathways to Health Study”Footnote 21, a study aimed at investigating the relation between diet quality and neighbourhood environments in adults, completed the C-DHQ II. The study began in April 2014 and included a two-staged stratified random sample of adults from 12 Calgary neighbourhoods, in Alberta, Canada. The 446 participants who responded to mailed invitations to complete the online C-DHQ II are included in this analysis.
All analyses were stratified by sex. Descriptive statistics (means, standard deviations, median, minimums, and maximum) were computed for: C-HEI total score, C-HEI component scores, energy intake, and the number of CFG servings. Mean energy intake and CFG servings were examined to determine the plausibility of results based on ‘a priori’ knowledge of food intakes in comparable populations.
Previous reports suggest that C-HEI scores vary by socio-demographic characteristics (e.g. sex, age, ethnicity, immigrant status, household income, education level, and smoking status).Footnote 8 We used ANOVA with post-hoc Bonferroni adjustments to estimate differences in total C-HEI scores by: age group, marital status, level of education, gross household income, smoking status, and ethnicity in the total population and by sex. In addition, we assessed the linear trend in C-HEI scores for household income category and education level in the total population and by sex. We used independent t-tests to estimate differences in C-HEI component scores, by sex. Statistical significance was set at α < 0.05. All significance testing was completed using Stata statistical software: Release 13.0 (StataCorp LP, College Station, TX, US).
Results
The study sample consisted of 172 men and 274 women. A majority of the participants were married/living with a partner, had at least a high-school diploma, had a household income above $60 000, were non-smokers, and were white (Table 2).
| Total | Men | Women | ||||||||||
|---|---|---|---|---|---|---|---|---|---|---|---|---|
| % | Mean (SD) | Median | Min, max | n | Mean (SD) | Median | Min, max | n | Mean (SD) | Median | Min, max | |
| Overall C-HEI scores | N = 446 | 64.4 (10.8) | 65.3 | 30.2, 88.5 | 172 | 61.5 (10.5) | 62.9 | 31.4, 79.2 | 274 | 66.3 (10.6)Table 2 - Footnote a | 67.5 | 30.2, 88.5 |
| Age (years) | ||||||||||||
21–39 |
20.4 | 65.6 (10.1) | 66.4 | 37.1, 88.5 | 23 | 60.0 (10.5) | 62.9 | 37.1, 77.4 | 68 | 67.4 (9.4)Table 2 - Footnote b | 68.4 | 46.1, 88.5 |
40–59 |
44.8 | 64.2 (10.8) | 65.4 | 30.2, 85.1 | 68 | 61.6 (10.2) | 62.9 | 31.5, 78.6 | 132 | 65.6 (10.9) | 67.0 | 30.2, 85.1 |
60+ |
34.8 | 64.1 (11.0) | 65.1 | 31.4, 84.2 | 81 | 61.9 (11.0) | 63.0 | 31.4, 79.2 | 74 | 66.5 (10.7) | 67.6 | 7.1, 84.2 |
| Marital status | ||||||||||||
Married or living with partner |
78.5 | 65.1 (10.6) | 65.7 | 31.4, 88.5 | 141 | 61.8 (10.3) | 62.1 | 31.4, 79.2 | 209 | 67.3 (10.3)Table 2 - Footnote b | 68.5 | 36.9, 88.5 |
All other arrangements
|
21.5 | 62.1 (11.0) | 64.2 | 30.2, 84.0 | 31 | 60.1 (11.8) | 63.9 | 31.5, 75.8 | 65 | 62.1 (11.0) | 64.2 | 30.1, 84.0 |
| Education | ||||||||||||
High school diploma or less |
12.6 | 60.9 (9.8) | 60.3 | 39.9, 79.6 | 21 | 59.4 (9.4) | 59.9 | 41.0, 79.2 | 35 | 61.7 (10.1) | 60.8 | 39.9, 79.6 |
College/vocation/trade/certificate |
17.5 | 64.2 (11.8) | 65.5 | 31.4, 84.3 | 31 | 61.7 (11.6) | 63.2 | 31.4, 78.0 | 47 | 65.9 (11.7) | 67.0 | 37.0, 84.3 |
University
|
70.0 | 65.2 (10.6)Table 2 - Footnote c | 66.3 | 30.2, 88.5 | 120 | 61.8 (10.5) | 63.3 | 31.5, 79.2 | 192 | 67.2 (10.1)Table 2 - Footnote b,Table 2 - Footnote c | 68.5 | 30.2, 88.5 |
| Gross household income | ||||||||||||
0–$59 999 |
8.7 | 63.1 (10.4) | 63.0 | 43.3, 84.2 | 18 | 64.7 (10.6) | 64.7 | 43.3, 79.2 | 21 | 61.7 (10.3) | 59.6 | 45.0, 59.6 |
$60 000–$119 999 |
33.9 | 63.5 (10.7) | 65.5 | 31.4, 85.1 | 61 | 59.0 (10.6) | 60.1 | 31.4, 79.2 | 90 | 66.6 (9.6)Table 2 - Footnote b | 68.2 | 31.4, 79.2 |
≥ $120 000 |
43.3 | 65.7 (10.7) | 67.0 | 30.2, 88.5 | 76 | 62.6 (10.4) | 63.5 | 31.4 ,78.9 | 117 | 67.7 (10.5)Table 2 - Footnote b | 68.9 | 30.2, 88.5 |
Refused
|
14.1 | 65.6 (10.1) | 62.8 | 40.5, 84.8 | 17 | 62.3 (10.0) | 58.9 | 3.5, 75.7 | 46 | 64.0 (11.5) | 63.2 | 40.5, 84.8 |
| Smoking status | ||||||||||||
Non-smoker |
6.4 | 64.7 (10.6)Table 2 - Footnote d | 65.5 | 30.2, 88.5 | 166 | 61.8 (10.6) | 63.0 | 31.4, 79.2 | 264 | 66.6 (10.3)Table 2 - Footnote b,Table 2 - Footnote d | 67.5 | 30.2, 88.5 |
Smoker |
.6 | 56.9 (11.8) | 54.2 | 36.9, 73.2 | 6 | 54.7 (8.6) | 51.6 | 44.6, 67.0 | 10 | 58.2 (13.7) | 61.8 | 36.9, 73.2 |
| Race | ||||||||||||
White
|
93.5 | 64.4 (10.8) | 65.3 | 30.2, 88.5 | 5 | 61.3 (10.8) | 62.9 | 31.4, 79.2 | 14 | 66.2 (10.4)Table 2 - Footnote b | 67.5 | 30.2, 88.5 |
All other |
6.5 | 65.4 (10.0) | 66.1 | 40.0, 79.3 | 57 | 63.8 (7.8) | 64.2 | 49.6, 76.6 | 260 | 67.1 (12.0) | 69.7 | 40.0, 73.3 |
| Abbreviations: C-HEI, Canadian Healthy Eating Index; SD, standard deviation. | ||||||||||||
The distribution of C-HEI scores was approximately normal (data not shown). The mean daily C-HEI score was 64.4 (standard deviation: 10.8) (Table 2). Men (61.5 [10.5]) and smokers (56.9 [11.8]) had lower C-HEI scores than women (66.3 [10.6]), and non-smokers (64.7[10.6]), respectively. Further, there was a statistically significant increasing linear trend with level of education. Non-smoking status and higher education was also associated with higher C-HEI scores amongst women but only non-smoking status was associated with a higher C-HEI score in men.
The mean (standard deviation) daily energy intake was 1650 (717) kcal (Table 3). The highest mean number of average daily CFG servings was reported for total vegetables and fruit 6.3 (3.2) and the lowest was for whole grains 0.4 (0.4). For every CFG food group, the mean number of daily servings was below the CFG age and sex-specific recommendations.
| Total (n = 446) | Men (n = 172) | Women (n = 274) | |||||||||
|---|---|---|---|---|---|---|---|---|---|---|---|
| CFG serving | Mean (SD) | Median | Min, max | CFG rangeTable 3B - Footnote a |
Mean (SD) | Median | Min, max | CFG rangeTable 3B - Footnote a |
Mean (SD) | Median | Min, max |
| Total vegetables and fruits |
6.3 (3.2) | 5.7 | 0.7, 22.8 | 7–10 | 6.3 (3.3) | 5.5 | 1.6, 22.8 | 7–8 | 6.3 (3.2) | 5.8 | 0.7, 19.1 |
| Whole fruits | 1.8 (1.1) | 1.7 | 0.0, 5.9 | - | 1.7 (1.1) | 1.4 | 0.1, 5.9 | - | 1.9 (1.1) | 1.7 | 0.0, 5.8 |
| Dark green and orange vegetables |
2.0 (1.8) | 1.5 | 0.0, 15.8 | - | 1.6 (1.2) | 1.3 | 0.2, 7.7 | - | 2.2 (2.1) | 1.6 | 0.0, 15.8 |
| Total grains | 3.2 (1.9) | 3.0 | 0.1, 12.8 | 7–8 | 3.9 (2.2) | 3.6 | 0.4, 12.8 | 6–7 | 2.8 (1.6) | 2.6 | 0.1, 9.11 |
| Whole grains | 0.4 (0.4) | 0.3 | 0.0, 2.7 | 3.5–4 | 0.5 (0.5) | 0.4 | 0.0, 2.7 | 3–3.5 | 0.4 (0.4) | 0.3 | 0.0, 2.6 |
| Milk and alternatives | 1.6 (1.2) | 1.3 | 0.0, 7.0 | 2–3 | 1.7 (1.1) | 1.4 | 0.1, 1.4 | 2–3 | 1.5 (1.2) | 1.2 | 0.0, 7.0 |
| Meat and alternatives | 1.9 (1.1) | 1.6 | 0.1, 10.3 | 2–3 | 2.1 (1.3) | 1.8 | 0.3, 10.3 | 2 | 1.7 (1.0) | 1.5 | 0.1, 9.4 |
| Sodium (mg) | 2344 (922) | 2158 | 570, 7384 | - | 2690 (1180) | 2373 | 723, 7384 | - | 2128 (781) | 2004 | 570, 4893 |
| Saturated fat (g) | 19.9 (9.4) | 17.6 | 4.2, 64.7 | - | 22.5 (10.2) | 18.5 | 5.4, 64.7 | - | 18.6 (8.5) | 16.3 | 4.2, 60.9 |
| Energy (calories) | 1650 (717) | 1545 | 483, 4514 | - | 1989 (717) | 1734 | 538, 4514 | - | 1440 (505) | 1433 | 483, 3899 |
| Calories from other foods | 339 (219) | 283 | 21, 1926 | - | 422 (253) | 356 | 43, 1721 | - | 287 (177) | 255.3 | 21, 1926 |
| Calories from other foods (%) | 20.3 (8.8) | 19.1 | 3.3, 55.8 | - | 22.1 (9.6) | 21.1 | 3.7, 55.8 | - | 19.1 (8.1) | 17.7 | 3.3, 49.5 |
| Total (n = 446) | Men (n = 172) | Women (n = 274) | |||||||||
|---|---|---|---|---|---|---|---|---|---|---|---|
| C–HEI components scores |
Mean (SD) | Median | Min, max | Scale | Mean (SD) | Median | Min, max | Scale | Mean (SD) | Median | Min, max |
| Total vegetables and fruits | 7.6 (2.4) | 7.8 | 0.8, 10.0 | 0–10 | 7.4 (2.5) | 7.6 | 2.1, 10.0 | 0–10 | 7.7 (2.3) | 8.1 | 0.8, 10.0 |
| Whole fruits | 4.1 (1.3) | 5.0 | 0.1, 5.0 | 0–5 | 3.9 (1.4) | 4.5 | 0.2, 5.0 | 0–5 | 4.3 (1.2) | 5.0 | 0.1, 5.0 |
| Dark green and orange vegetables | 3.9 (1.4) | 4.8 | 0.1, 5.0 | 0–5 | 3.7 (1.5) | 4.0 | 0.5, 5.0 | 0–5 | 4.0 (1.3) | 5.0 | 0.1, 5.0 |
| Total grains | 2.4 (1.2) | 2.3 | 0.1, 5.0 | 0–5 | 2.6 (1.2) | 2.5 | 0.3, 5.0 | 0–5 | 2.3 (1.2) | 2.1 | 0.1, 5.0 |
| Whole grains | 0.6 (0.6) | 0.5 | 0.0, 4.3 | 0–5 | 0.7 (0.6) | 0.5 | 0.0, 3.7 | 0–5 | 0.6 (0.6) | 0.4 | 0.0, 4.3 |
| Milk and alternatives | 5.5 (3.1) | 5.2 | 0.0, 10.0 | 0–10 | 5.5 (3.0) | 5.4 | 0.3, 10.0 | 0–10 | 5.4 (3.1) | 5.1 | 0.0, 10.0 |
| Meat and alternatives | 6.9 (2.5) | 6.9 | 0.7, 10.0 | 0–10 | 6.3 (2.5) | 6.0 | 1.1, 10.0 | 0–10 | 7.3 (2.5)Table 3B - Footnote b | 7.6 | 0.7, 10.0 |
| Unsaturated fats | 8.5 (1.9) | 10.0 | 1.8, 10.0 | 0–10 | 7.9 (2.2) | 8.4 | 1.8, 10.0 | 0–10 | 8.9 (1.7)Table 3B - Footnote b | 10.0 | 2.8, 10.0 |
| Saturated fats | 6.3 (2.9) | 7.0 | 0.0, 10.0 | 0–10 | 6.7 (2.6) | 7.4 | 0.0, 10.0 | 0–10 | 6.0 (3.0) | 6.7 | 0.0, 10.0 |
| Sodium | 7.3 (2.6) | 8.3 | 0.0, 10.0 | 0–10 | 6.5 (3.0) | 7.7 | 0.0, 10.0 | 0–10 | 7.9 (2.1)Table 3B - Footnote b | 8.5 | 0.0, 10.0 |
| Other foods | 11.4 (4.7) | 12.0 | 0.0, 20.0 | 0–20 | 10.5 (4.9) | 10.8 | 0.0, 20.0 | 0–20 | 12.0 (4.5)Table 3B - Footnote b | 12.7 | 0.0, 10.0 |
| Abbreviations: CFG, Eating Well with Canada’s Food Guide; C-HEI, Canadian Healthy Eating Index; SD, standard deviation. Note: CFG range = recommended number of food guide servings per day, adults 19 years and older. |
|||||||||||
C-HEI component scores are presented in Table 3. Compared to men, women had significantly (p < .05) higher ‘unsaturated fat’, ‘sodium’, ‘meat and alternatives’, and ‘other food’ component scores while men had significantly (p < .05) higher ‘saturated fat’ component scores.
Figure 3 illustrates the multidimensional aspect of the C-HEI and the variation in compliance with recommendations for adequacy of food group intakes and moderation in the intake of not recommended dietary components. On average, none of the recommendations for these components are met 100%, and men and women follow similar patterns of alignment with C-HEI component intakes. The lowest scoring component was whole grains while the highest scoring components were unsaturated fat, whole fruits, dark green and orange vegetables, and total fruits and vegetables.
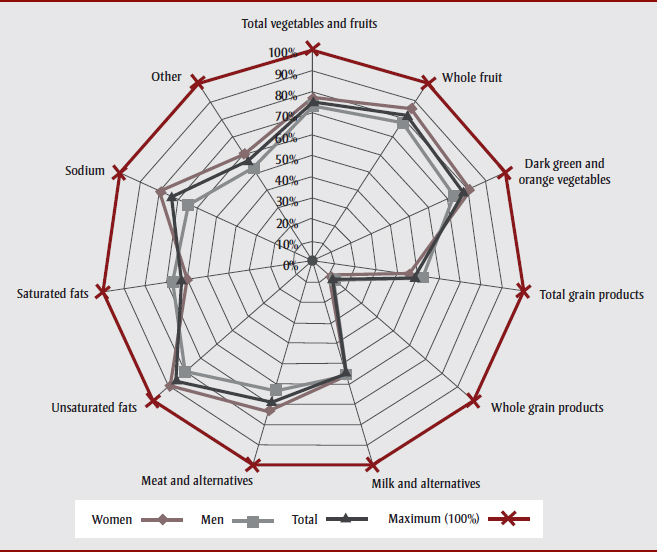
Figure 3 - Text Description
This figure illustrates the multidimensional aspect of the Canadian Healthy Eating Index (C-HEI) and the variation in compliance with recommendations for adequacy of food group intakes and moderation in the intake of not recommended dietary components. On average, none of the recommendations for these components are met 100%, and men and women follow similar patterns of alignment with C-HEI component intakes. The lowest scoring component was whole grains while the highest scoring components were unsaturated fat, whole fruits, dark green and orange vegetables, and total fruits and vegetables.
Discussion
We describe methods for creating food group equivalents (CFG serving variables) for the C-DHQ II nutrient database estimation of the C-HEI. Algorithms were developed to create the food group equivalent variables and applied to the most commonly consumed foods from the Canadian Community Health Survey food and recipes file which were linked to food questions on the C-DHQ II. This approach was an efficient and robust strategy since the C-DHQ II food category nutrient profiles were weighted most heavily on foods that contributed substantially to Canadian dietsFootnote 15 and hence were foods that were most representative of C-DHQ II food categories. The mean C-HEI in the participants from the Pathways to Health study was comparable, albeit somewhat higher, than values previously reported for the Canadian population.Footnote 8 Consistent with findings from previous Canadian dataFootnote 8 we found differences in the C-HEI by sex, smoking status, and education.
The range and normal distribution of the mean daily food group equivalent intakes observed suggest that the method applied yielded reasonable estimates of intake given their similarities to previous reports in the Canadian population.Footnote 8 The intakes of the number of total fruits and vegetables, whole fruits, dark green and orange vegetables, and meat servings were slightly left skewed which is expected given that North American diets tend to be high in animal proteinFootnote 27,Footnote 28 and over-reporting of fruit and vegetable consumption is common due to social desirability.Footnote 29 Consistent with previously reported Canadian dietary patterns, women reported a higher median number of fruit and vegetable servings per day compared with menFootnote 30,Footnote 31, while men reported a higher median number of meat and alternatives servings per day.Footnote 30 Intake of grains and whole grains as measured by mean daily CFG equivalent intake was low. A potential explanation for low total grain and whole grains intakes may be the increase in non-celiac gluten sensitivityFootnote 32 and a trend toward the adoption of gluten-free and low-carbohydrate dietsFootnote 33,Footnote 34,Footnote 35 which can limit the intake of grain products. Finally, the food group equivalents intake distributions were similar to what has been previously observed in Alberta.Footnote 20
The mean daily C-HEI score (64.4) was somewhat higher than what has been previously observed nationally (58.8)Footnote 8 and in Alberta (men: 51; women: 56).Footnote 20 The differences between the C-HEI scores reported in this study population and those reported by others likely reflect differences in the study sample designs and data collection strategies. Nevertheless, the differences in C-HEI scores across levels of socio-demographic characteristics in our study were consistent with findings from another Canadian study that reported differences in C-HEI by sex, smoking status, and education level.Footnote 8 For the C-HEI component scores, with the exception of total vegetables and fruits, meat and alternatives, and whole grains, all possible minimum and maximum values were observed, demonstrating that the primary food method allowed a full spectrum of component scores to be obtained.
Limitations
Underreporting is known to exist with most methods of dietary assessment Footnote 36,Footnote 37 and is expected to have played a role in our study.Footnote 38 Food frequency questionnaires have been observed to be associated with substantial energy intake underreporting when compared with the objective measure doubly labelled waterFootnote 38,Footnote 39,Footnote 40; and hence underreporting is also expected with the C-DHQ II. Underreporting of the C-DHQ II likely led to the underestimation of overall energy intake. However, evidence suggests there is also differential misreporting by food type on food frequency questionnaires.Footnote 41,Footnote 42 For example, vegetables and fruits tend to be overestimated while sugars, sweets, jams and some grain products are underestimated.Footnote 42 Additionally, social desirability response bias is plausible given that those who chose to respond to the questionnaire may have underreported food groups labeled as ‘unhealthy’ in popular media (e.g. grain products). Hence, dietary misreporting may lead to the under- or over-estimation of C-HEI adequacy and moderation components, and total C-HEI scores. Although the average daily food group equivalents and C-HEI estimates in the current study are generally consistent with existing CFG food group servingsFootnote 30 and C-HEI distributionsFootnote 8, some estimates may be low (particularly grain and whole grain estimates). This could be an artefact of not being able to identify the primary food given the lack of name brands and the difficulty of estimating the grain component of mixed foods or using only the most commonly consumed foods reported in the Canadian Community Health Survey and linked to food questions on the C-DHQ II.
The cut-off values for confirming sufficient representativeness of the primary foods (≤ 5% difference) and the difference in compositions of mixed foods using the US MPED and FPEDs (~20%) were determined by the authors. If the cut-offs were too liberal or conservative, it could have resulted in misclassification of the C-DHQ II food group into the C-HEI variables.
Conclusion
The addition of food group equivalents to the C-DHQ II nutrient database allows researchers to compare average daily food group intakes to the healthy eating recommendations of the CFG. Further, the derivation of the C-HEI allows Canadian researchers to examine the relation between diet quality and chronic disease risk using a questionnaire designed specifically for Canadian populations.
Acknowledgements
This research was supported by funds to the Canadian Research Data Centre Network (CRDCN) from the Social Sciences and Humanities Research Council (SSHRC), the Canadian Institutes of Health Research (CIHR), the Canadian Foundation for Innovation (CFI), and Statistics Canada.
Stipend support to MM funded by the CIHR Training Grant in Population Intervention for Chronic Disease Prevention: A Pan-Canadian Program (Grant #53893); CIHR Canada Graduate Student–Masters Award; and the William H Davies Medical Research Scholarship. GRM is supported by a CIHR New Investigator award. AK was supported by the Fonds de recherche du Québec-Santé (FRQS) Research Scholar Program and the CIHR New Investigator program.VH received a postdoctoral fellowship from the CIHR and Lung Cancer Canada to conduct this work and is currently supported by the Cancer Research Society, FRQS and Ministère de l'Économie, de la Science et de l'Innovation du Québec (MESI).
Conflicts of interest
The authors have no conflicts of interest to disclose.
Authors’ contributions and statement
MM/IC conceived the methodologies and algorithms used to create Canada’s Food Guide variables in the Canadian Diet History Questionnaire II nutrient database. MM led the Canada’s Food Guide variable creation. IM/IR/AK/VH reviewed the algorithms and methodologies. VH modified the SAS code for deriving the Canadian Healthy Eating Index from Canadian Diet History Questionnaire II data. IM/IR conducted quality checks of the newly created variables. GRM advised on the analysis. MM led the writing, drafting, and editing of the manuscript. All authors contributed to the interpretation of findings and writing of the manuscript. All authors read and approved the final manuscript.
The content and views expressed in this article are those of the authors and do not necessarily reflect those of the Government of Canada. Although the research and analysis are based on data from Statistics Canada, the opinions expressed do not represent the views of Statistics Canada.