
At-a-glance – Hospitalizations and emergency department visits due to opioid poisoning in Canada
Health Promotion and Chronic Disease Prevention in Canada
Shannon O'Connor, MA; Vera Grywacheski, MPH; Krista Louie, MSc
https://doi.org/10.24095/hpcdp.38.6.04
Author reference:
Canadian Institute for Health Information, Ottawa, Ontario, Canada
Correspondence: Shannon O'Connor, Canadian Institute for Health Information, 495 Richmond Road, Suite 600, Ottawa, ON K2A 4H6; Tel: 613-694-6580; Email: soconnor@cihi.ca
Abstract
The rise in opioid-related harms is an issue of increasing public health importance in Canada. This analysis used data from the Hospital Morbidity Database and the National Ambulatory Care Reporting System to determine the number of opioid poisoning hospitalizations and emergency department visits in Canada. Opioid poisoning hospitalizations have increased over the past 10 years, reaching 15.6 per 100 000 population in 2016/17. Emergency department visits due to opioid poisoning have also increased in Alberta and Ontario, the two provinces that collect emergency department data at the level of detail required for this analysis. These findings highlight the importance of pan-Canadian surveillance of opioid-related harms, as well as the need for evidence-based policies to help reduce these harms.
Keywords: analgesics, opioid, public health, hospitalization, emergency service, hospital
Highlights
- Opioid poisonings result in an average of 16 hospitalizations a day in Canada, as well as 11 emergency department visits a day in Alberta and 13 emergency department visits a day in Ontario.
- Over the past 10 years, seniors aged 65 and older and adults aged 45 to 64 have had the highest rates of opioid poisoning hospitalizations, while youth aged 15 to 24 and adults aged 25 to 44 had the fastest growing hospitalization rates.
- While opioid poisoning hospitalization rates have increased in most jurisdictions, the highest rates are in northern and western Canada.
- Most of the increases in both hospitalizations and emergency department visits due to opioid poisoning have occurred over the past three years.
Introduction
Canada is having a serious public health crisis due to the harms associated with opioids. Recent data from the Public Health Agency of Canada indicate that there were 2861 apparent opioid-related deaths in Canada in 2016 and at least 1460 deaths from January to June 2017.Reference 1 Despite the urgent nature of this crisis, there is very little information regarding the number of Canadians who experience nonfatal opioid-related harms. Therefore, pan-Canadian measures that provide a better understanding of the harms associated with opioids, including hospitalizations and emergency department visits, are a high priority.
Methods
This analysis identified hospitalizations and emergency department visits due to opioid poisoning using ICD-10-CA (the International Statistical Classification of Diseases and Related Health Problems, 10th Revision) codes (T40.0, T40.1, T40.2, T40.3, T40.4 and T40.6). The analysis included 10 years (2007/08 to 2016/17) of hospitalization data from the Canadian Institute for Health Information's (CIHI) Hospital Morbidity Database for all Canadian provinces and territories (except Quebec and Nunavut, where the most recent data available was from 2015/16). The hospitalization analysis was limited to "significant opioid poisoning" cases, defined as cases in which opioid poisoning was considered influential to the time that the patient spent in hospital and to the treatment that they received while they were there. To identify significant opioid poisoning hospitalizations, the analysis included diagnosis types M (most responsible diagnosis), 1 (pre-admit comorbidity), 2 (post-admit comorbidity), 6 (proxy most-responsible diagnosis), W, X, Y (service transfer diagnoses) and C (CIHI-assigned value for Quebec).
The analysis also included five years (2012/13 to 2016/17) of emergency department (ED) data from CIHI's National Ambulatory Care Reporting System for Alberta and Ontario, the two provinces that require mandatory coding of full ICD-10-CA codes. While Yukon also collects ED data at this level of detail, it was excluded from the analysis due to the small number of counts. The analysis of ED data included any documented diagnosis of an opioid poisoning.
The direct standardization process was used to calculate standardized rates, with the 2011 Canadian population being used as the reference year.
Results
Hospitalizations due to opioid poisoning
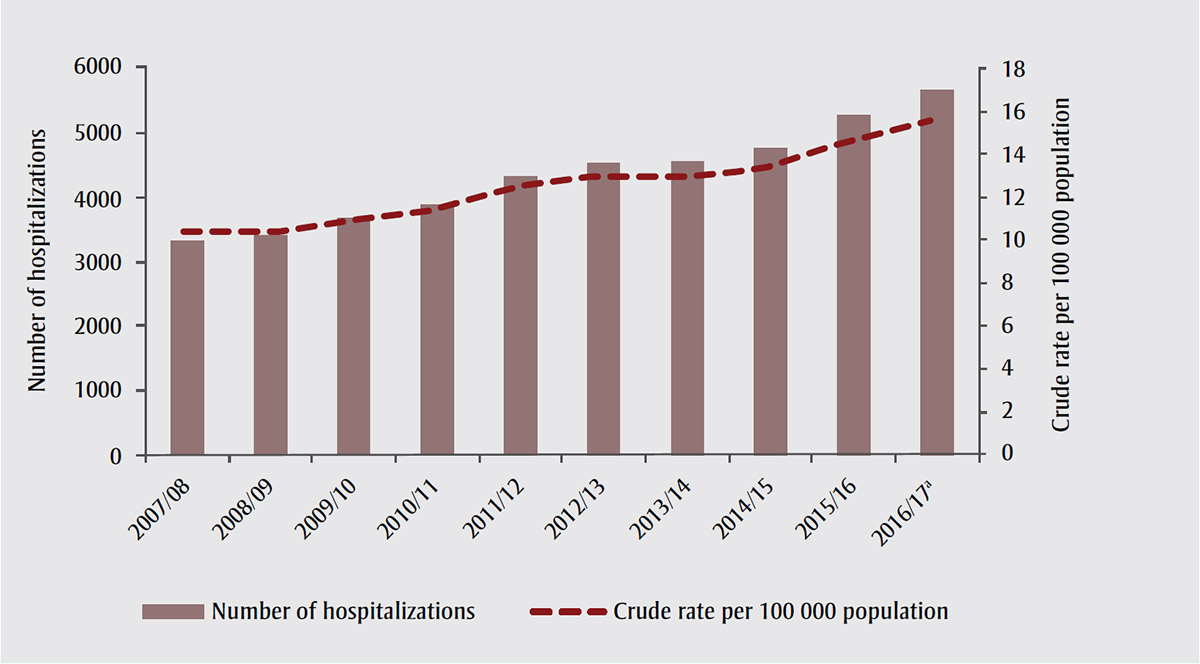
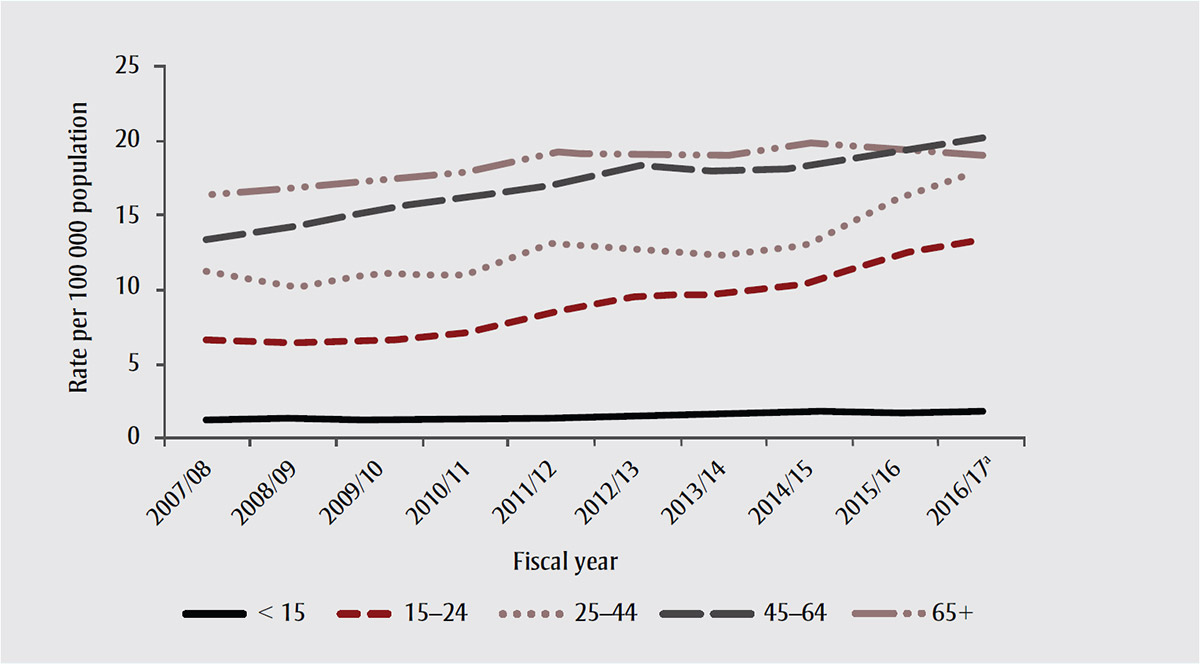
In 2016/17, there were 5670 hospitalizations due to opioid poisoning in Canada, an average of 16 hospitalizations each day. Over the past 10 years, the rate of hospitalizations due to opioid poisoning increased by 53%, to 15.6 per 100 000 population (Figure 1). Nearly half of this increase occurred over the last three years. Hospitalization rates due to opioid poisoning have increased across all age groups, with seniors aged 65 and older and adults aged 45 to 64 consistently having the highest rates (Figure 2). The fastest growing hospitalization rates, however, were observed in youth aged 15 to 24 and in adults aged 25 to 44. While opioid poisoning hospitalization rates have historically been higher among females, 2016/17 was the first year in which the hospitalization rate was slightly higher for males (15.8 per 100 000 population) than it was for females (15.5 per 100 000 population) (Table 1).
Source: Reprinted with permission from Canadian Institute for Health Information. Opioid-related harms in Canada: chartbook, September 2017. Ottawa (ON): CIHI; 2017. Available from: https://www.cihi.ca/sites/default/files/document/opioid-harms-chart-book-en.pdf
Figure 1 notes
- Figure 1 note a
-
Quebec and Nunavut data are from 2015/16 (the most recent year of data available).
Figure 1 note a
Figure 1 - Text description
This figure shows that in 2016-2017, there were 5670 hospitalizations due to opioid poisoning in Canada, an average of 16 hospitalizations each day (compared to 3344 in 2007-2008). Over the past 10 years, the rate of hospitalizations due to opioid poisoning increased by 53%, to 15.6 per 100 000 population. Nearly half of this increase occurred over the last 3 years. It is worthy to note that Quebec and Nunavut data are from 2015/16, the most recent year of data available.
Source: Reprinted with permission from Canadian Institute for Health Information. Opioid-related harms in Canada: chartbook, September 2017. Ottawa (ON): CIHI; 2017. Available from: https://www.cihi.ca/sites/default/files/document/opioid-harms-chart-book-en.pdf
Figure 2 notes
- Figure 2 note a
-
Quebec and Nunavut data are from 2015/16 (the most recent year of data available).
Figure 2 note a
Figure 2 - Text description
Hospitalization rates due to opioid poisoning, as presented in this figure, have increased across all age groups, with seniors age 65 and older and adults age 45 to 64 consistently having the highest rates. The fastest growing hospitalization rates, however, were observed in youth age 15 to 24 and in adults age 25 to 44. While opioid poisoning hospitalization rates have historically been higher among females, 2016-2017 was the first year in which the hospitalization rate was slightly higher for males (15.8 per 100,000 population) than it was for females (15.5 per 100,000 population). It is worthy to note that Quebec and Nunavut data are from 2015/16, the most recent year of data available.
| Sex | 2007/08 | 2008/09 | 2009/10 | 2010/11 | 2011/12 | 2012/13 | 2013/14 | 2014/15 | 2015/16 | 2016/17table 1 note a |
|---|---|---|---|---|---|---|---|---|---|---|
| Female | 11.2 | 11.3 | 11.8 | 12.3 | 13.5 | 13.7 | 13.8 | 14.1 | 14.8 | 15.5 |
| Male | 9.1 | 9.1 | 10.0 | 10.4 | 11.5 | 12.3 | 12.0 | 12.7 | 14.6 | 15.8 |
|
Source: Reprinted with permission from Canadian Institute for Health Information. Opioid-related harms in Canada: data tables, September 2017. Ottawa (ON): CIHI; 2017. Available from: https://www.cihi.ca/sites/default/files/document/opioid-harms-data-tables-en.xlsx Note: Records with unknown/other sex are not reported. Table 1 Notes
|
||||||||||
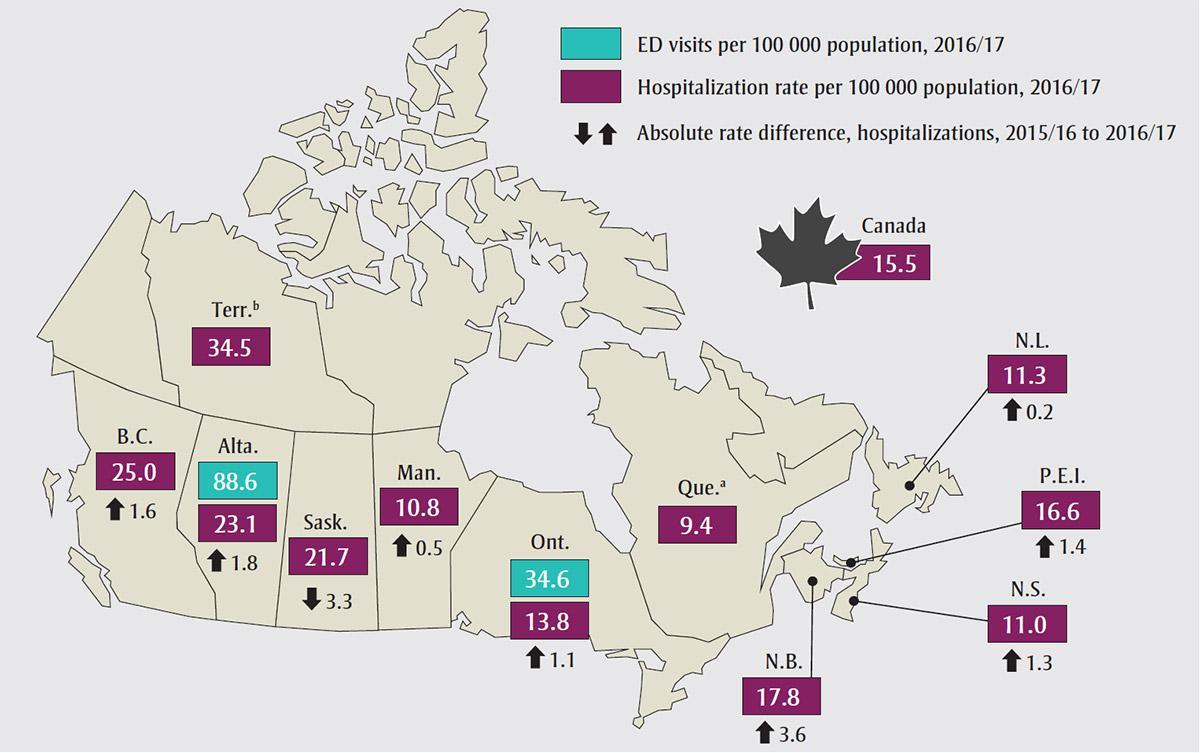
The analysis also revealed that while opioid poisoning hospitalization rates vary across Canada, they are increasing in almost all jurisdictions. In 2016/17, hospitalization rates were highest in northern and western Canada, with the territories, British Columbia and Alberta having the highest rates (Figure 3).
Source: Adapted with permission from Canadian Institute for Health Information. Opioid-related harms in Canada: chartbook, September 2017. Ottawa (ON): CIHI; 2017. Available from: https://www.cihi.ca/sites/default/files/document/opioid-harms-chart-book-en.pdf
Abbreviations: Alta., Alberta; B.C., British Columbia; ED, emergency department; Man., Manitoba; N.B., New Brunswick; N.L., Newfoundland and Labrador; N.S., Nova Scotia; Ont., Ontario; P.E.I., Prince Edward Island; Que., Quebec; Sask., Saskatchewan; Terr., Territories (Yukon, Northwest Territories and Nunavut).
Figure 3 notes
- Figure 3 note a
-
Quebec hospitalization data are from 2015/16 (the most recent year of data available); therefore, there is no absolute rate difference shown.
Figure 3 note a
- Figure 3 note b
-
Yukon, Northwest Territories and Nunavut hospitalization data are grouped together due to low volumes. These data should be interpreted with caution. Nunavut data are from 2015/16 (the most recent year of data available); therefore, there is no absolute rate difference shown.
Figure 3 note b
Figure 3 - Text description
In this figure, we see that while opioid poisoning hospitalization rates vary across Canada, they are increasing in almost all jurisdictions. In 2016-2017, hospitalization rates were highest in Northern and Western Canada, with the territories (34.5 per 100 000), British Columbia (25.0 per 100 000) and Alberta (23.1 per 100 000) having the highest rates.
- Saskatchewan: 21.7 per 100 000
- Manitoba: 10.8 per 100 000
- Ontario: 13.8 per 100 000
- Quebec: 9.4 per 100 000 (please note that Quebec hospitalization data are from 2015/16 [the most recent year of data available]; therefore, there is no absolute rate difference shown)
- New Brunswick: 17.8 per 100 000
- Nova Scotia: 11.0 per 100 000
- Prince Edward Island: 16.6 per 100 000
- Newfoundland and Labrador: 11.3 per 100 000
- Canada: 15.5 per 100 000
It is worthy to note that Yukon, Northwest Territories and Nunavut hospitalization data are grouped together due to low volumes. These data should be interpreted with caution. Nunavut data are from 2015/16 (the most recent year of data available); therefore, there is no absolute rate difference shown.
Emergency department visits due to opioid poisoning
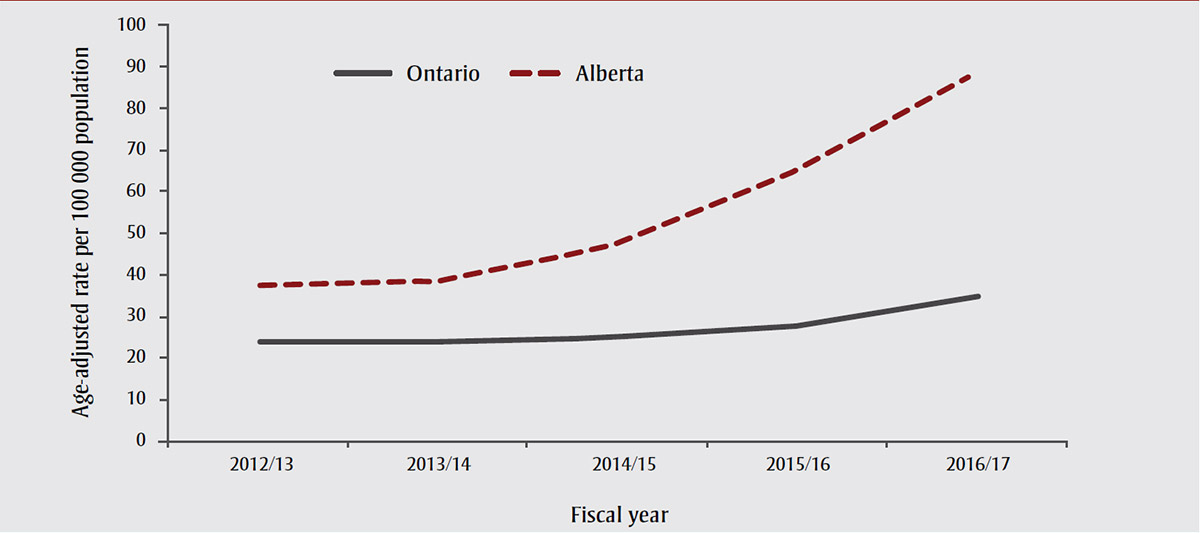
In 2016/17, there were 3894 ED visits in Alberta and 4831 ED visits in Ontario due to opioid poisoning, an average of 11 ED visits in Alberta and 13 in Ontario each day. Over the past five years, the age-adjusted rate of ED visits due to opioid poisoning has more than doubled in Alberta, from 37.6 per 100 000 population in 2012/13 to 88.6 per 100 000 population in 2016/17 (Figure 4). In Ontario, the age-adjusted rate of ED visits due to opioid poisoning has increased by 47%, from 23.5 per 100 000 population in 2012/13 to 34.6 per 100 000 population in 2016/17. Like hospitalizations, most of the increases in both provinces occurred over the last three years.
Source: Reprinted with permission from Canadian Institute for Health Information. Opioid-related harms in Canada: chartbook, September 2017. Ottawa (ON): CIHI; 2017. Available from: https://www.cihi.ca/sites/default/files/document/opioid-harms-chart-book-en.pdf
Abbreviation: ED, emergency department.
Figure 4 - Text description
In 2016-2017, there were 3,894 ED visits in Alberta and 4,831 ED visits in Ontario due to opioid poisoning, an average of 11 ED visits in Alberta and 13 in Ontario each day. Over the past 5 years, the age-adjusted rate of ED visits due to opioid poisoning has more than doubled in Alberta, from 37.6 per 100,000 population in 2012-2013 to 88.6 per 100,000 population in 2016-2017. In Ontario, the age-adjusted rate of ED visits due to opioid poisoning has increased by 47%, from 23.5 per 100,000 population in 2012-2013 to 34.6 per 100,000 population in 2016-2017. Like hospitalizations, most of the increases in both provinces occurred over the last 3 years.
In Alberta, youth aged 15 to 24 and adults aged 25 to 44 had the highest and fastest growing rates of ED visits due to opioid poisoning, tripling over the past five years (Table 2). In Ontario, adults aged 25 to 44 had the highest and fastest growing rates, increasing by 85% over the past five years. In both provinces, rates of ED visits due to opioid poisoning were higher among males than females (Table 3). This difference was particularly striking in Alberta, where the rate of opioid poisoning ED visits was 110.0 per 100 000 population for males and 72.6 per 100 000 population for females in 2016/17.
| Age group (years) | Ontario | Alberta | ||||||||
|---|---|---|---|---|---|---|---|---|---|---|
| 2012/13 | 2013/14 | 2014/15 | 2015/16 | 2016/17 | 2012/13 | 2013/14 | 2014/15 | 2015/16 | 2016/17 | |
| <15 | 3.2 | 3.4 | 3.1 | 3.9 | 3.8 | 6.2 | 8.5 | 6.9 | 6.0 | 4.8 |
| 15-24 | 30.1 | 29.7 | 32.4 | 32.2 | 41.8 | 50.9 | 57.9 | 72.5 | 115.2 | 162.1 |
| 25-44 | 30.8 | 29.8 | 33.6 | 40.9 | 56.9 | 49.8 | 49.6 | 68.6 | 100.0 | 151.0 |
| 45-64 | 27.1 | 27.5 | 27.8 | 30.3 | 34.5 | 41.3 | 41.1 | 46.3 | 58.9 | 72.5 |
| 65+ | 19.2 | 19.5 | 20.6 | 21.9 | 22.1 | 30.7 | 29.7 | 32.3 | 36.3 | 35.1 |
Source: Reprinted with permission from Canadian Institute for Health Information. Opioid-related harms in Canada: data tables, September 2017. Ottawa (ON): CIHI; 2017. Available from: https://www.cihi.ca/sites/default/files/document/opioid-harms-data-tables-en.xlsx Abbreviation: ED, emergency department. Note: Records with unknown age are not reported. |
||||||||||
| Sex | Ontario | Alberta | ||||||||
|---|---|---|---|---|---|---|---|---|---|---|
| 2012/13 | 2013/14 | 2014/15 | 2015/16 | 2016/17 | 2012/13 | 2013/14 | 2014/15 | 2015/16 | 2016/17 | |
| Female | 22.6 | 22.4 | 22.7 | 26.5 | 29.1 | 41.0 | 41.2 | 45.7 | 59.0 | 72.6 |
| Male | 24.4 | 24.2 | 27.1 | 29.2 | 40.1 | 34.4 | 36.4 | 50.3 | 74.3 | 110.0 |
Source: Reprinted with permission from Canadian Institute for Health Information. Opioid-related harms in Canada: data tables, September 2017. Ottawa (ON): CIHI; 2017. Available from: https://www.cihi.ca/sites/default/files/document/opioid-harms-data-tables-en.xlsx Abbreviation: ED, emergency department. Note: Records with unknown/other sex are not reported. |
||||||||||
Discussion
This analysis found that hospitalizations and emergency department visits due to opioid poisoning have increased in recent years, with the greatest increases in rates over the past three years.
Strengths and limitations
This study provides the most up-to-date analysis of pan-Canadian trends in opioid poisoning hospitalizations and emergency department visits. However, the analysis included only opioid poisonings that received treatment in a hospital or emergency department setting, and does not capture individuals who received treatment in other environments (e.g. supervised consumption sites). The results, therefore, likely underestimate the number of Canadians who have experienced harms related to opioids. In addition, the analysis relied on administrative data sources which are based on patients' chart documentation. Deficiencies in chart documentation and/or failure to provide hospital coders with appropriate documents can affect data quality and lead to underreporting.
Conclusion
The rise in opioid-related harms highlights the importance of establishing comparable data to support public health surveillance at local, provincial and federal levels. The results of this analysis also underscore the importance of evidence-based strategies to help reduce opioid-related harms, including access to opioid agonist treatment, improved prescribing practices, prescription monitoring programs and increased access to naloxone. Moving forward, CIHI intends to update this analysis on a regular basis as more data becomes available, including ED data for additional jurisdictions.
Acknowledgements
CIHI would like to acknowledge the input and advice of the Canadian Centre on Substance Use and Addiction and of the Public Health Agency of Canada. Please note that the analyses and conclusions in this publication do not, necessarily, reflect the views of the organizations mentioned above.
Conflicts of interest
CIHI has received five years of funding from Health Canada for work related to the monitoring and surveillance of prescription drug abuse in Canada. The authors have no other conflicts of interest to disclose.
Authors' contributions and statement
SO, KL and VG were involved in the design and conceptualization of the work, as well as in the analysis and interpretation of the data. SO and KL were involved in drafting and revising the paper. All authors have approved the final manuscript for publication.
The content and views expressed in this article are those of the authors and do not necessarily reflect those of the Government of Canada.
Reference
- Reference 1
-
Government of Canada. Apparent opioid-related deaths. Ottawa (ON): Government of Canada; [cited 2018 Jan 3]. Available from: https://www.canada.ca/en/health-canada/services/substance-abuse/prescription-drug-abuse/opioids/apparent-opioid-related-deaths
Page details
- Date modified: