At-a-glance – The role of opioid toxicity in suicide deaths in Alberta, 2000 to 2016
Health Promotion and Chronic Disease Prevention in Canada
Elaine Y.L. Chan, MPHAuthor reference 1Author reference 2; Bruce M. McDonald, MPHAuthor reference 1; Elizabeth Brooks-Lim, MBChB, FRCPathAuthor reference 3; Graham R. Jones, PhDAuthor reference 3; Kristin B. Klein, MD, FRCPCAuthor reference 4; Lawrence W. Svenson, PhDAuthor reference 1Author reference 5Author reference 6Author reference 7
https://doi.org/10.24095/hpcdp.38.9.07
Author references:
- Author reference 1
-
Analytics and Performance Reporting Branch, Alberta Ministry of Health, Edmonton, Alberta, Canada
- Author reference 2
-
Public Health Agency of Canada, Ottawa, Ontario, Canada
- Author reference 3
-
Office of the Chief Medical Examiner, Alberta Ministry of Justice and Solicitor General, Edmonton, Alberta, Canada
- Author reference 4
-
Office of the Chief Medical Officer of Health, Alberta Ministry of Health, Edmonton, Alberta, Canada
- Author reference 5
-
Division of Preventive Medicine, Faculty of Medicine and Dentistry, University of Alberta, Edmonton, Alberta, Canada
- Author reference 6
-
School of Public Health, University of Alberta, Edmonton, Alberta, Canada
- Author reference 7
-
Department of Community Health Sciences, Cumming School of Medicine, University of Calgary, Calgary, Alberta, Canada
Correspondence: Larry Svenson, Alberta Health, 10025 - Jasper Avenue, Edmonton, AB T5J 1S6; Tel: 780-422-4767; Email: Larry.Svenson@gov.ab.ca
Abstract
Given the current opioid crisis in Canada, there is interest in the role of opioid toxicity in suicide deaths, particularly in whether any observed patterns are similar to those of unintentional deaths. The present analysis examined characteristics of opioid-toxicity suicide, and its role in relation to other suicide methods, from 2000 to 2016 in Alberta. It does not appear that the opioid crisis has resulted in a disproportionately higher number of suicides in Alberta. Individuals who die from unintentional opioid toxicity and those who die by opioid-toxicity suicide are likely distinct populations, requiring nuanced public health responses for prevention.
Keywords: opioids, opioid analgesics, suicide, public health surveillance, Canada
Highlights
- From 2000 to 2016, approximately 20% of suicides in Alberta were suicides by drug toxicity, of which 22% were opioid related.
- More females than males completed suicide by opioid toxicity, and older age predicted the use of opioids among suicides by drug toxicity.
- The average rate of suicide by opioid toxicity was 0.61 per 100 000 person-years for females and 0.57 per 100 000 for males. There was no substantial increase in rates of suicide by opioid toxicity from 2000 to 2016.
- The most commonly used opioids for suicide included morphine, codeine, hydromorphone and oxycodone.
Introduction
Canada is in the midst of a nation-wide opioid crisis, spurred in part by an increase in opioid prescribing frequency, dosage and potency from the 1990s onward,Footnote 1Footnote 2 with increasing rates of opioid-related harms and deaths. In 2016, there were over 2800 arguably preventable opioid-related deaths in Canada.Footnote 3Footnote 4 Although there is no long-term, national-level mortality data, opioid-related deaths in Ontario reportedly doubled between 1991 and 2004.Footnote 2 In the past 10 years, the rate of hospitalizations in Canada due to opioid poisoning increased by 53%.Footnote 4
While the majority of opioid-related harms and deaths are unintentional, opioids may also be involved where a death is intentional.Footnote 5Footnote 6Footnote 7 Approximately 30% of hospitalizations for opioid poisonings in Canada in 2016 were the result of self-inflicted harm, including suicide attempts.Footnote 4 Further, 16% of all opioid-related deaths in Ontario from 2006 to 2008 were suicides.Footnote 5
It is known that opioids are commonly used for suicide (e.g. a Toronto-based study found opioids to be in 30% of suicides by overdose—the most frequently detected drug class—between 1998 and 2007Footnote 8), and that individuals with chronic pain, who historically have frequently received opioid prescriptions, may be more likely to die by suicide.Footnote 6Footnote 9Footnote 10 However, there is a lack of information on the use of opioids for suicide in the context of Canada’s opioid crisis, such as whether the number of suicides by opioid toxicity has increased and whether patterns in opioid use for suicide are similar to those for unintentional deaths due to opioids. The present analysis aimed to address this knowledge gap by examining the demographics and opioid types used for suicide by opioid toxicity, as well as the role of opioid toxicity in relation to other methods of suicide, in Alberta over a 17-year period.
Methods
We examined de-identified data from Alberta Vital Statistics for suicide deaths in Alberta from 2000 to 2016. We identified manner (e.g. intentional/suicide) and method (e.g. poisoning) of death using International Statistical Classification of Diseases and Related Health Problems 10th Revision (ICD-10) codes. Data were extracted where the underlying cause of death indicated death by suicide (ICD-10 codes X60–X84, Y87.0). Suicides for which the underlying cause of death was coded as ICD-10 X60 to X64 were considered suicides by drug toxicity. We broke down drug toxicity further using the following ICD-10 codes: T40.0 (opium), T40.1 (heroin), T40.2 (other opioids), T40.3 (methadone), T40.4 (other synthetic narcotics) and T40.6 (other and unspecified narcotics). Deaths with these codes were considered suicide deaths by opioid toxicity, regardless of the presence of other nonopioid drugs. We calculated descriptive statistics and performed logistic regression analyses with sex and age as predictors, for suicide by drug toxicity and suicide by opioid toxicity. We examined trends over time for patterns and tested for significance using chi-square and ANOVA tests.
Results
Demographics and trends over time
Between 2000 and 2016, there were 8344 deaths by suicide in Alberta; 2049 (24.5%) were females and 6295 (75.4%) were males. While the majority of suicide deaths (80%) were nondrug suicides, 20% were suicides by drug toxicity, of which 52.9% occurred in females. Approximately 22% of suicides by drug toxicity involved opioid toxicity; 51.4% of these opioid-toxicity suicides occurred among females. In a model fitting sex and age, females had 5.7 times the odds (95% confidence interval [CI]: 5.02–6.36) of suicide by drug toxicity compared to males (p < .0001). However, sex did not significantly predict opioid toxicity among suicides by drug toxicity.
Individuals who died by drug-toxicity suicide were older than individuals who completed suicide by nondrug means (average age 47.4 [standard deviation (SD) 14.2] vs. 42.0 [SD 17.0] years, respectively). In a model adjusting for sex, the odds of suicide by drug toxicity versus nondrug means increased by 2.4% (95% CI: 2.0–2.7%) for every one-year increase in age (p < .0001). The sex-adjusted odds of opioid-toxicity death among suicides by drug toxicity also increased by 0.8% (95% CI: 0–1.7%) for every additional year of age (p < .05). The mean age for individuals dying by opioid-toxicity suicide was 48.8 (SD 14.4) years.
The proportion of females to males for overall suicide (p = .35), suicide by drug toxicity (p = .71) and suicide by opioid toxicity (p = .62) remained fairly constant from 2000 to 2016. Mean age for overall suicide (p = .063), suicide by drug toxicity (p = .36) and suicide by opioid toxicity (p = .43) were stable over the 17-year period examined.
Methods of suicide over time
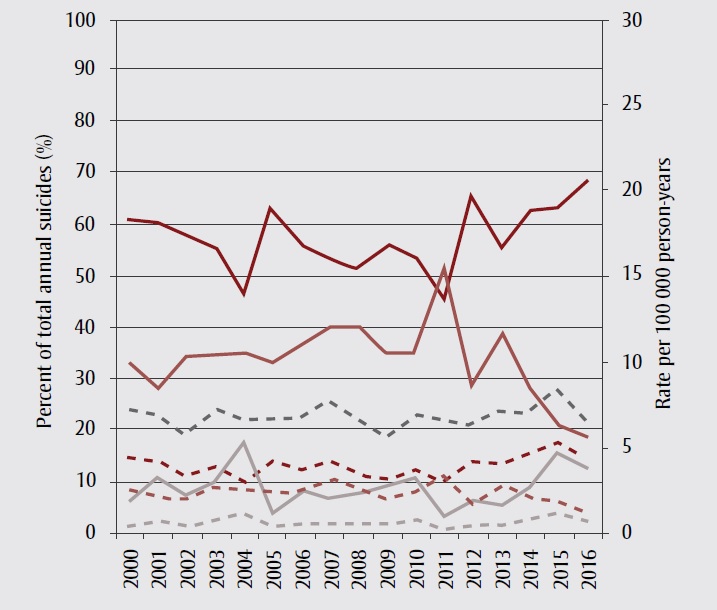
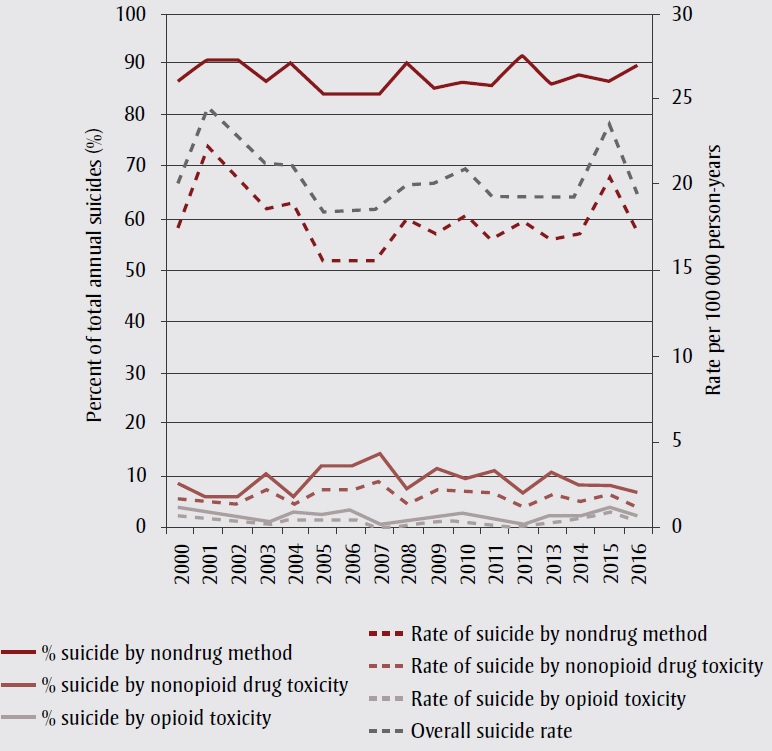
Suicide by nondrug causes was generally more common than suicide by drug toxicity in Alberta from 2000 to 2016. Among females, nondrug methods accounted for 57% of annual suicides, on average, and represented a higher proportion of suicides than drug toxicity (using any drug) in every year except 2004 and 2011, when drug toxicity accounted for 53% and 55% of suicides, respectively. The average annual rate of suicide by nondrug methods in females was 3.9 per 100 000 person-years. In males, nondrug methods were the primary means of suicide death, accounting for an average of 88% of annual suicides and an average annual rate of 17.9 per 100 000 person-years. The average rate of suicide by nonopioid drug toxicity was slightly higher for females compared to males (2.3 vs. 1.9 per 100 000 person-years) but nonopioid drug toxicity accounted for a much higher average percentage of suicide deaths in females than males (34% vs. 10%) (Figure 1). Similarly, the average rate of suicide by opioid toxicity per 100 000 person-years was 0.61 for females and 0.57 for males, while the average annual percentage of suicides attributed to opioid toxicity was 9% in females versus 3% in males.
Figure 1. Overall suicide rates, and rates and percentages of suicide methods used, Alberta, 2000–2016, by sex
Figure 1A Females

Text Description
| Year | % Suicide by non-drug method | % Suicide by non-opioid drug toxicity | % Suicide by opioid toxicity | Rate of suicide by non-drug method | Rate of suicide by non-opioid drug toxicity | Rate of suicide by opioid toxicity | Overall suicide rate |
|---|---|---|---|---|---|---|---|
| 2000 | 60.74766355 | 32.71028037 | 6.54205607 | 4.371882 | 2.35409 | 0.470818 | 7.19679 |
| 2001 | 60.57692308 | 28.84615385 | 10.5769231 | 4.165295 | 1.983474 | 0.727274 | 6.876042 |
| 2002 | 57.77777778 | 34.44444444 | 7.77777778 | 3.364156 | 2.005555 | 0.452867 | 5.822578 |
| 2003 | 55.35714286 | 34.82142857 | 9.82142857 | 3.942746 | 2.480115 | 0.699519 | 7.12238 |
| 2004 | 46.66666667 | 35.23809524 | 18.0952381 | 3.064958 | 2.314356 | 1.188453 | 6.567767 |
| 2005 | 62.96296296 | 33.33333333 | 3.7037037 | 4.149132 | 2.196599 | 0.244067 | 6.589798 |
| 2006 | 55.75221239 | 36.28318584 | 7.96460177 | 3.739851 | 2.433871 | 0.534264 | 6.707987 |
| 2007 | 52.98507463 | 40.29850746 | 6.71641791 | 4.111523 | 3.127074 | 0.521179 | 7.759776 |
| 2008 | 51.72413793 | 40.51724138 | 7.75862069 | 3.397836 | 2.661638 | 0.509675 | 6.569149 |
| 2009 | 55.88235294 | 35.29411765 | 8.82352941 | 3.154433 | 1.992273 | 0.498068 | 5.644774 |
| 2010 | 53.54330709 | 35.43307087 | 11.023622 | 3.70118 | 2.44931 | 0.762008 | 6.912498 |
| 2011 | 45.45454545 | 51.23966942 | 3.30578512 | 2.94264 | 3.317158 | 0.21401 | 6.473808 |
| 2012 | 65.04065041 | 28.45528455 | 6.50406504 | 4.182668 | 1.829917 | 0.418267 | 6.430851 |
| 2013 | 55.31914894 | 39.0070922 | 5.67375887 | 3.966002 | 2.79654 | 0.406769 | 7.169312 |
| 2014 | 62.67605634 | 28.16901408 | 9.15492958 | 4.408057 | 1.981149 | 0.643874 | 7.03308 |
| 2015 | 63.15789474 | 21.05263158 | 15.7894737 | 5.255935 | 1.751978 | 1.313984 | 8.321897 |
| 2016 | 68.42105263 | 18.79699248 | 12.7819549 | 4.357641 | 1.197154 | 0.814065 | 6.368859 |
Figure 1B Males

Text Description
| Year | % Suicide by non-drug method | % Suicide by non-opioid drug toxicity | % Suicide by opioid toxicity | Rate of suicide by non-drug method | Rate of suicide by non-opioid drug toxicity | Rate of suicide by opioid toxicity | Overall suicide rate |
|---|---|---|---|---|---|---|---|
| 2000 | 86.92810458 | 8.823529 | 4.248366 | 17.52971 | 1.779331 | 0.856715 | 86.92810458 |
| 2001 | 90.47619048 | 6.349206 | 3.174603 | 22.12753 | 1.552809 | 0.776405 | 90.47619048 |
| 2002 | 90.6779661 | 6.779661 | 2.542373 | 20.28366 | 1.516535 | 0.568701 | 90.6779661 |
| 2003 | 87.17201166 | 10.78717 | 2.040816 | 18.56746 | 2.297646 | 0.43469 | 87.17201166 |
| 2004 | 89.88439306 | 6.936416 | 3.179191 | 18.96723 | 1.463709 | 0.670867 | 89.88439306 |
| 2005 | 84.5659164 | 12.54019 | 2.893891 | 15.62925 | 2.317646 | 0.534841 | 84.5659164 |
| 2006 | 83.90092879 | 12.6935 | 3.405573 | 15.60339 | 2.360661 | 0.633348 | 83.90092879 |
| 2007 | 84.03614458 | 14.75904 | 1.204819 | 15.61121 | 2.741754 | 0.223817 | 84.03614458 |
| 2008 | 90.19073569 | 7.901907 | 1.907357 | 18.08817 | 1.584764 | 0.382529 | 90.19073569 |
| 2009 | 85.67639257 | 11.67109 | 2.65252 | 17.25325 | 2.350288 | 0.534156 | 85.67639257 |
| 2010 | 86.64987406 | 10.32746 | 3.02267 | 18.14995 | 2.163221 | 0.633138 | 86.64987406 |
| 2011 | 86.25336927 | 11.32075 | 2.425876 | 16.65692 | 2.186221 | 0.468476 | 86.25336927 |
| 2012 | 91.62303665 | 7.329843 | 1.04712 | 17.78363 | 1.42269 | 0.203241 | 91.62303665 |
| 2013 | 86.54822335 | 10.91371 | 2.538071 | 16.78779 | 2.116936 | 0.492311 | 86.54822335 |
| 2014 | 88.11881188 | 8.910891 | 2.970297 | 17.03847 | 1.722992 | 0.574331 | 88.11881188 |
| 2015 | 86.77354709 | 8.617234 | 4.609218 | 20.39842 | 2.02571 | 1.083519 | 86.77354709 |
| 2016 | 89.7810219 | 7.055961 | 3.163017 | 17.178 | 1.350033 | 0.605187 | 89.7810219 |
Method of suicide fluctuated more for females than males, while the overall suicide rate fluctuated more in males (Figure 1). In females, from 2014 onwards, there was a downward trend in suicide by nonopioid drug toxicity to previously unobserved levels, and concurrent upward trends in nondrug and opioid-toxicity suicides. In males, rate and percentage contribution of suicide by opioid toxicity also rose, peaking in 2015.
Types of opioids used in opioid-related suicides over time
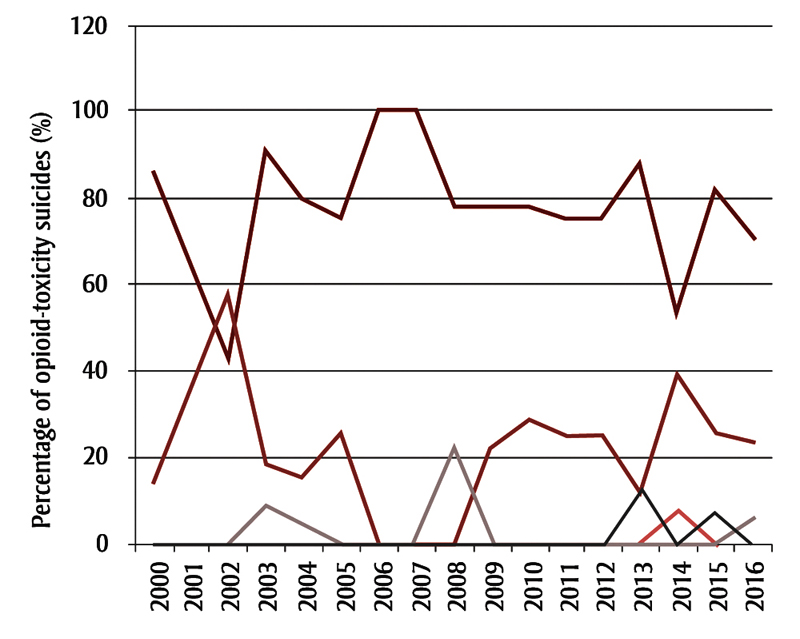
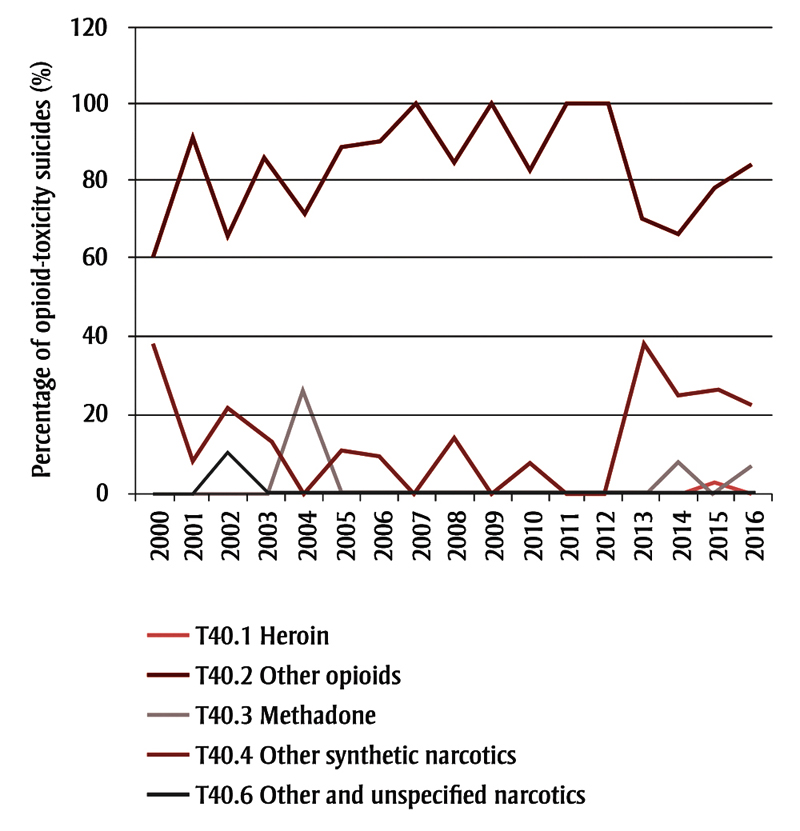
In both females and males, the most commonly used opioids for suicide by opioid toxicity included morphine, codeine, hydromorphone and oxycodone (Figure 2). The second most common opioids recorded were “other synthetic narcotics,” which include fentanyl and U-47700. The early 2000s (for both sexes), 2013 (for males) and 2014 (for females) all saw an increased percentage of “other synthetic narcotics” use, and a decreased percentage of “other opioids” use for suicide.
Figure 2. Types of opioids used for opioid-toxicity suicides, Alberta, 2000–2016, by sex
Figure 2A. Females

Text Description
| Year | T40.1 Heroin | T40.2 Other opioids | T40.3 Methadone | T40.4 Other synthetic narcotics | T40.6 Other and unspecified narcotics |
|---|---|---|---|---|---|
| 2000 | 0 | 85.71428571 | 0 | 14.28571429 | 0 |
| 2001 | 0 | 63.63636364 | 0 | 36.36363636 | 0 |
| 2002 | 0 | 42.85714286 | 0 | 57.14285714 | 0 |
| 2003 | 0 | 90.90909091 | 9.090909091 | 18.18181818 | 0 |
| 2004 | 0 | 78.94736842 | 5.263157895 | 15.78947368 | 0 |
| 2005 | 0 | 75 | 0 | 25 | 0 |
| 2006 | 0 | 100 | 0 | 0 | 0 |
| 2007 | 0 | 100 | 0 | 0 | 0 |
| 2008 | 0 | 77.77777778 | 22.22222222 | 0 | 0 |
| 2009 | 0 | 77.77777778 | 0 | 22.22222222 | 0 |
| 2010 | 0 | 78.57142857 | 0 | 28.57142857 | 0 |
| 2011 | 0 | 75 | 0 | 25 | 0 |
| 2012 | 0 | 75 | 0 | 25 | 0 |
| 2013 | 0 | 87.5 | 0 | 12.5 | 12.5 |
| 2014 | 7.692307692 | 53.84615385 | 0 | 38.46153846 | 0 |
| 2015 | 0 | 81.48148148 | 0 | 25.92592593 | 7.407407407 |
| 2016 | 5.882352941 | 70.58823529 | 5.882352941 | 23.52941176 | 0 |
Figure 2B. Males

Text Description
| Year | T40.1 Heroin | T40.2 Other opioids | T40.3 Methadone | T40.4 Other synthetic narcotics | T40.6 Other and unspecified narcotics |
|---|---|---|---|---|---|
| 2000 | 0 | 61.53846 | 0 | 38.46154 | 0 |
| 2001 | 0 | 91.66667 | 0 | 8.333333 | 0 |
| 2002 | 0 | 66.66667 | 0 | 22.22222 | 11.11111 |
| 2003 | 0 | 85.71429 | 0 | 14.28571 | 0 |
| 2004 | 0 | 72.72727 | 27.27273 | 0 | 0 |
| 2005 | 0 | 88.88889 | 0 | 11.11111 | 0 |
| 2006 | 0 | 90.90909 | 0 | 9.090909 | 0 |
| 2007 | 0 | 100 | 0 | 0 | 0 |
| 2008 | 0 | 85.71429 | 14.28571 | 14.28571 | 0 |
| 2009 | 0 | 100 | 0 | 0 | 0 |
| 2010 | 0 | 83.33333 | 8.333333 | 8.333333 | 0 |
| 2011 | 0 | 100 | 0 | 0 | 0 |
| 2012 | 0 | 100 | 0 | 0 | 0 |
| 2013 | 0 | 70 | 0 | 40 | 0 |
| 2014 | 0 | 66.66667 | 8.333333 | 25 | 0 |
| 2015 | 4.347826 | 78.26087 | 0 | 26.08696 | 0 |
| 2016 | 0 | 84.61538 | 7.692308 | 23.07692 | 0 |
Notes: International Statistical Classification of Diseases and Related Health Problems 10th Revision (ICD-10) codes were used to identify opioid types. T40.0 “Opium” was not used for suicide in Alberta from 2000 to 2016. T40.2 “Other opioids” include morphine, codeine, hydromorphone and oxycodone. T40.4 “Other synthetic narcotics” include synthetic opioids such as fentanyl and U-47700.
Discussion
Individuals in Alberta who died from unintentional opioid toxicity deaths in 2016 were predominantly male (73%) and between 30 and 39 years of age.Footnote 11 In comparison, suicide deaths by opioid toxicity were observed in slightly more females, with a mean age of 49 years. These data suggest that unintentional and suicide opioid-toxicity deaths occur in distinct populations, and may thereby represent different public health concerns. Previous study results have also shown more opioid-toxicity suicides among females and more opioid-misuse toxicity deaths among males.Footnote 12
There was no substantial increase in rates of suicide by opioid toxicity from 2000 to 2016 like that observed in unintentional deaths in Alberta between 2011 and 2016,Footnote 7 nor was there a significant change in suicide decedent demographics over time. The varied proportions of suicide method and stable overall suicide rate in females suggest a substitution of suicide methods rather than changes in frequency of suicide. The increased proportion of suicide by opioid toxicity around 2014 and 2015 may be a result of individuals utilizing an increased availability of synthetic opioids such as fentanyl.
Suicide deaths by opioid toxicity show a different opioid-type usage pattern compared to unintentional opioid toxicity deaths; fentanyl is the main contributor to unintentional opioid toxicity deaths,Footnote 7 but other opioids (morphine, codeine, hydromorphone and oxycodone) are predominantly used for suicides. Combined with the differences in demographics, it is likely that opioid-related suicides and unintentional deaths largely occur in different population groups in Alberta, with differing access to various types of opioids.
Strengths and limitations
Strengths of this study include the use of Alberta Vital Statistics data to capture all suicide deaths in Alberta over a 17-year span. However, only suicides for which the main cause of death was drug toxicity were considered drug-toxicity suicides; suicides for which the main cause of death was another method (e.g. hanging, firearm), but that also involved drug toxicity, were excluded. In addition, the use of ICD-10 codes prevented identification of the contribution of specific opioids, limiting the level of detail to that inherent in the code. Further, the contribution of opioids to drug toxicity deaths may also be underestimated, especially in earlier years, as coding practices occasionally do not identify specific drugs contributing to drug toxicity. There is potential for confounding in using administrative data over a long time period, whereby observed differences could reflect changes in coding practices over time and in response to known crises rather than true differences.
Conclusion
There are differences in population demographics, observed patterns and the types of opioids used for opioid-related unintentional and suicide deaths in Alberta, which suggests that these are separate phenomena within the opioid crisis. Prevention of suicide by opioid toxicity likely requires a public health response separate to the current response used to prevent predominantly illicit fentanyl-driven and unintentional opioid-toxicity deaths.
Acknowledgements
The authors would like to thank Sean L’Heureux and Alberta Vital Statistics for their support.
Conflicts of interest
The authors have no conflicts of interest to report.
Authors’ contributions and statement
EC, BM and LS conceived and designed the study. BM extracted and de-identified the data for analysis, and EC conducted the analysis. All authors were involved in drafting the manuscript and interpreting the data. All authors read and approved the final manuscript.
The content and views expressed in this article are those of the authors and do not necessarily reflect those of the Government of Canada.
References
- Footnote 1
-
King NB, Fraser V, Boikos C, et al. Determinants of increased opioid-related mortality in the United States and Canada, 1990–2013: a systematic review. Am J Public Health [Internet]. 2014 Aug [cited 2018 Jan 15];104(8):e32-e42. doi: 10.2105/AJPH.2014.301966.
- Footnote 2
-
Dhalla IA, Mamdani MM, Sivilotti MLA, et al. Prescribing of opioid analgesics and related mortality before and after the introduction of long-acting oxycodone. CMAJ [Internet]. 2009 Dec 8 [cited 2018 Jan 15];181(12):891-6. doi: 10.1503/cmaj.090784.
- Footnote 3
-
Special Advisory Committee on the Epidemic of Opioid Overdoses. National report: apparent opioid-related deaths in Canada (December 2017) [Internet]. Ottawa (ON): Public Health Agency of Canada; 2017 Dec [cited 2018 Jan 15]. Available from: https://www.canada.ca/en/public-health/services/publications/healthy-living/apparent-opioid-related-deaths-report-2016-2017-december.html
- Footnote 4
-
Canadian Institute for Health Information. Opioid crisis having “significant” impact on Canada’s health care system [Internet]. Ottawa (ON): CIHI; 2017. Available from: https://www.cihi.ca/en/opioid-crisis-having-significant-impact-on-canadas-health-care-system
- Footnote 5
-
Madadi P, Hildebrandt D, Lauwers AE, et al. Characteristics of opioid-users whose death was related to opioid-toxicity: a population-based study in Ontario, Canada. PLoS ONE [Internet]. 2013 Apr 5 [cited 2018 Jan 16];8(4):e60600. doi: 10.1371/journal.pone.0060600.
- Footnote 6
-
Madadi P, Persaud N. Suicide by means of opioid overdose in patients with chronic pain. Curr Pain Headache Rep [Internet]. 2014 Sep 24 [cited 2018 Jan 16];18(11):460. doi: 10.1007/s11916-014-0460-1.
- Footnote 7
-
Alberta Health Analytics and Performance Reporting Branch. Opioids and substances of misuse, Alberta report, 2017 Q3 [Internet]. Edmonton (AB): Government of Alberta; 2017 Nov 27 [cited 2018 Jan 16]. 26 p. Available from: https://open.alberta.ca/dataset/1cfed7da-2690-42e7-97e9-da175d36f3d5/resource/e69ffcb0-6d34-4e2b-bf35-7d13ec35de59/download/Opioids-Substances-Misuse-Report-2017-Q3.pdf
- Footnote 8
-
Sinyor M, Howlett A, Cheung AH, et al. Substances used in completed suicide by overdose in Toronto: an observational study of coroner’s data. Can J Psychiatry [Internet]. 2012 Mar 1 [cited 2018 Jan 16];57(3):184-91. Available from: http://journals.sagepub.com/doi/abs/10.1177/070674371205700308
- Footnote 9
-
Deyo RA, Von Korff M, Duhrkoop D. Opioids for low back pain. BMJ [Internet]. 2015 Jan 5 [cited 2018 Jan 16];350:g6380. doi: 10.1136/bmj.g6380.
- Footnote 10
-
Demidenko MI, Dobscha SK, Morasco BJ, et al. Suicidal ideation and suicidal self-directed violence following clinician-initiated prescription opioid discontinuation among long-term opioid users. Gen Hosp Psychiatry [Internet]. 2017 Apr 27 [cited 2018 Jan 16];47:29-35. doi: 10.1016/j.genhosppsych.2017.04.011.
- Footnote 11
-
Special Advisory Committee on the Epidemic of Opioid Overdoses. National report: Apparent opioid-related deaths in Canada (January 2016 to March 2017) [Internet]. Ottawa (ON): Public Health Agency of Canada; 2017 Sep [cited 2018 Jan 16]. Available from: https://www.canada.ca/en/public-health/services/publications/healthy-living/apparent-opioid-related-deaths-report-2016.html
- Footnote 12
-
Caupp S, Steffan J, Shi J, et al. Opioid drug poisonings in Ohio adolescents and young adults, 2002–2014. Clin Toxicol (Phila) [Internet]. 2018 Jan 11 [cited 2018 Jan 16]:1-8. doi: 10.1080/15563650.2018.1424889.