
Evidence synthesis – A systematized literature review on the associations between neighbourhood built characteristics and walking among Canadian adults
Health Promotion and Chronic Disease Prevention in Canada, Vol 39, No 1, January 2019
Brenlea Farkas, MSc Author reference 1; Daniel J. Wagner, MSc Author reference 1; Alberto Nettel-Aguirre, PhD Author reference 1, Author reference 2, Author reference 3; Christine Friedenreich, PhD Author reference 1, Author reference 4, Author reference 5; Gavin R. McCormack, PhDAuthor reference 1
https://doi.org/10.24095/hpcdp.39.1.01
This article has been peer reviewed.
Correspondence: Gavin McCormack, Department of Community Health Sciences, Cumming School of Medicine, University of Calgary, 3280 Hospital Drive, N.W. Calgary, AB T2N 4Z6; Tel: 403-220-8193; Email: gmccorma@ucalgary.ca
Abstract
Introduction: Evidence to date suggests that the built environment has the potential to facilitate and even discourage physical activity. A limitation of previous reviews is that they have typically not been country-specific. We conducted a systematized literature review of quantitative studies that estimated associations between the built environment—which were objectively measured—and walking among Canadian adults.
Methods: Five scientific databases were searched for peer-reviewed studies published in all years up to December 31, 2016, that estimated the association between the built environment (i.e. objectively measured using audits and Geographic Information Systems [GIS]) and physical activity among a sample of Canadian adults. The database searches, title and abstract screen, full-text review and data extraction were undertaken by two reviewers.
Results: Of 4140 articles identified, 25 met the inclusion criteria. Most studies included data from a single Canadian province. All but two studies were cross-sectional. Most studies captured self-reported walking for transportation and walking for any purpose. Overall walkability and land use were consistently associated with walking for transportation, while proximity to destinations was associated with walking for any purpose.
Conclusion: Our review findings suggest that the built environment is potentially important for supporting adult walking. Overall walkability, land use and proximity to destinations appear to be important given their association with transportation walking and walking for any purpose.
Keywords: built environment, walking, pedestrian, neighbourhood, physical activity, walkability, transportation, recreation
Highlights
- Among Canadian studies investigating the association between the objectively measured built environment and walking, recreational walking is studied less frequently than transportation walking or walking for any purpose.
- Objectively measured walkability, land use mix and destination proximity are associated with walking outcomes among Canadian adults.
- In Canadian neighbourhoods, objectively measured built characteristics are more consistently associated with transportation walking than with recreational walking.
- Except for two longitudinal studies, all Canadian studies investigating the association between the objectively measured built environment and walking are cross-sectional.
Introduction
Walking is a popular physical activity that requires no special ability, skill or equipment and incurs a minimal cost to undertake. By contributing to physical activity levels, walking helps to reduce the risk of chronic health conditions including cardiovascular disease,Footnote 1 diabetes,Footnote 1 hypertension,Footnote 2 depression,Footnote 3 cancer,Footnote 4 Footnote 5 and obesity.Footnote 6 Footnote 7 The treatment and management of chronic health conditions resulting from a lack of physical activity place a significant economic burden on Canada's health care systemFootnote 7 Footnote 8 Footnote 9 and elsewhere. Despite the known health benefits,Footnote 10 11 many Canadian adults do not undertake enough physical activity.Footnote 12 Creating neighbourhood built environments that support physical activity may be one approach to increasing physical activity at the population level and, in turn, decrease the economic burden of chronic health conditions in Canada.
The built environment includes all characteristics of the physical environment that have been planned, constructed or modified by humans.Footnote 13 Evidence from systematic reviews suggests that the neighbourhood built environment is associated with physical activity.Footnote 14 Footnote 15 Footnote 16 Findings from these reviews also suggest that the neighbourhood built environment is more supportive of walking than of any other physical activity, and that built environment correlates may differ depending on the purpose of walking (e.g. transportation walking, recreational walking, dog walking).Footnote 14 Footnote 16 Footnote 17 Studies have consistently found an association between land use mix, destination mix and proximity, residential or population density, street and pedestrian connectivity, and overall levels of walkability and walking.Footnote 14 Footnote 16 Footnote 18 Footnote 19 Footnote 20 Footnote 21 Footnote 22 However, it is not known whether there is a link between these findings and the exact geographical location or region (e.g. city or country) in which the study was undertaken.
To date, systematic reviews exploring the relationship between the built environment and physical activity have typically combined findings from studies undertaken in multiple geographical contexts.Footnote 14 Footnote 19 Footnote 21 The findings from these literature reviews have been heavily informed by studies undertaken in Australia, European countries, and the United States; these studies suggest that the findings may not be generalizable to a specific geographic location. Given that the prevalence of physical activity differs between countries,Footnote 23 Footnote 24 Footnote 25 we might also expect that the same built characteristics have different impacts on physical activity depending on the geographical location and context. Pucher and Buehler Footnote 25 found higher levels of cycling among Canadians than Americans, and concluded that this difference was the result of the differences in the built environment (levels of residential density and land use mix, safer cycling conditions and difference in cycling infrastructure), incomes, costs associated with car ownership and cycling training programs. While Sugiyama et al.Footnote 26 found consistent associations between several self-reported built characteristics and walking among people in 12 countries, the authors also noted that the relationship between self-reported neighbourhood aesthetics and recreational walking differed between countries. Cerin et al.Footnote 27 also found that associations between self-reported aesthetics and street connectivity and objectively measured physical activity differed between countries. Moreover, Ding et al.Footnote 28 found some differences across countries between self-reported residential density, proximity to transit, bicycle facilities and safety from crime and the likelihood of meeting physical activity recommendations. These findings suggest that consideration should be given to the country in which the evidence is derived, especially if this evidence is used to inform local urban policy or practice.
Given that the associations between the built environment and physical activity are likely country-specific, it might be useful to review the evidence and develop recommendations that can help inform local urban and transportation policy and planning decisions. The strong emphasis on self-reported measures of the built environmentFootnote 16 Footnote 19 Footnote 22 in some studies is also cause for concern, as self-report and objective measures of the same built environment characteristics do not always correspond.Footnote 29 Footnote 30 Thus, the aim of this study was to undertake a systematized literature review of quantitative studies that estimate the associations between the objectively measured built environment and walking for different purposes among Canadian adults.
Methods
Search strategy
The Preferred Reporting Items for Systematic Reviews and Meta-Analysis (PRISMA) guidelinesFootnote 31 informed the methods used for this investigation. Given that not all elements of a systematic review, such as a quantitative assessment of each study's internal validity, were included, this review is referred to as a "systematized literature review."Footnote 32 To identify relevant literature, queries were developed for five databases that had been used in previous built environment-physical activity reviewsFootnote 14 Footnote 16 Footnote 19: MEDLINE; Cumulative Index to Nursing and Allied Health Literature (CINAHL); SPORTDiscus; Transport Research International Documentation (TRID); and Environment Complete. Our broad and comprehensive search of peer-reviewed articles spanning all years up to December 31, 2016, covered all relevant studies that looked at the association between the built environment and all types of physical activity, and not only walking.
As per best-practice recommendations for systematic reviews of observational studies, a standardized approach was used to identify potentially relevant studies.Footnote 18 The database search comprised three components: (1) identifying relevant terms related to the built environment, with the first Boolean search using "or" to explode (search by subject heading) and map (search by keyword) the medical subject headings "built environment," "urban design," "urban form" or "neighbourhood" or "landscape architecture"; (2) identifying relevant terms related to the physical activity, with the second Boolean search using "or" to explode and map the terms "physical activity," "recreation," "leisure," "transportation," "physical exertion," "exercise," "walking," "cycling" or "jogging"; and (3) identifying studies in the Canadian context, using a final Boolean search using "or" to explode and map the medical subject headings, with keywords that included "Canada," "Canadian," "Alberta," "British Columbia," "Manitoba," "New Brunswick," "Newfoundland and Labrador," "Nova Scotia," "Northwest Territories," "Nunavut," "Ontario," "Prince Edward Island," "Quebec," "Saskatchewan" or "Yukon." These three search strings were then combined using the Boolean operator "and" for all possible combinations.
In addition to the database searches, we scanned the reference lists of relevant literature reviews as well as all articles that were deemed eligible for a comprehensive review.
Study selection
One reviewer (BF) screened the titles of identified abstracts (n = 4140) to exclude non-relevant articles. Of those identified, 796 abstracts were initially reviewed. Abstracts reporting on the association between the built environment and physical activity were selected for full-text review. Comprehensive reviews were also done on articles where the abstracts were unclear. A random sample of 270 abstracts were double screened (by BF and DW) to estimate interrater agreement of included studies (percent of overall agreement = 87.0%) and to validate inclusion criteria. Both researchers then independently reviewed half (n = 263) of the remaining 526 abstracts. Literature reviews, commentaries, conference abstracts and proceedings, and pilot studies identified at the abstract or full-text screening stages were excluded from the review.
Articles were retained if they met the inclusion criteria for research design (quantitative), study population (Canadian adults aged ≥18 years), exposure (objectively measured built characteristics related to destinations or land uses, population or residential density, pedestrian amenities or infrastructure, pedestrian or street connectivity, personal or traffic safety, aesthetics, neighbourhood typology or walkability) and outcome (any self-reported or objectively measured physical activity such as walking, running, cycling, sports or overall measures of physical activity, such as moderate-to-vigorous physical activity). The final inclusion criterion for the review was that a study had to have estimated an association between an objective measure of the built environment and physical activity. For the full-text review, interrater agreement was acceptable (percent of overall agreement = 87.0%). Articles that included studies measuring self-reported built characteristics only were excluded from the review.
Data extraction
From each eligible article, the two reviewers (BF and DW) extracted author details (name and year of publication), study design (cross-sectional, longitudinal, experiment), sample design (random or non-random and size), geographical location of data collection, sample characteristics (demographic and socioeconomic), physical activity outcomes, built environment characteristics, estimated associations between built environment characteristics and physical activity outcomes and, where applicable, details on the confounders adjusted for in the analysis. Where possible, the final model, or the most (or fully) covariate-adjusted estimates of association between the built environment and physical activity, were extracted. The estimated associations between each built environment characteristic and physical activity outcome were coded as follows: null, for non-significant associations; or positive or negative, for significant associations based on the direction of association. Purely descriptive statistics that did not include (inferential) tests of statistical significance were not extracted or synthesized in this review.
Where available, we extracted all information on physical activity participation or prevalence including achievement of physical activity recommendations or guidelines (e.g. 150 minutes of moderate to vigorous physical activity per weekFootnote 33 or reaching recommended number of steps/day), frequency (e.g. number of walking trips per week), duration and volume (e.g. number of steps per day or energy expenditure). To help in the extraction and synthesis of the built environment characteristics,Footnote 34 we used an existing framework that combines built environment characteristics posited to be associated with walking into four broad categories or features: functional, safety, aesthetic and destination. These features-functional, destination, safety and aesthetic-have been used in previous literature reviews:Footnote 35 Footnote 36 Footnote 37 Footnote 38
- Functional features include characteristics such as overall walkability (e.g. summary indices, Walk Score) and neighbourhood typology (e.g. urban, suburban, new urbanist), pedestrian and street connectivity (e.g. density of intersections, street pattern) and residential or population density.
- Destination features included characteristics such as land use or destination mix, proximity to transportation or recreational destinations and quality of destinations.
- Safety features included measures of traffic (e.g. speed, volume) and personal or crime-related (e.g. evidence of disorder or incivilities) safety.
- Aesthetic features included measures of attractive, interesting or comfort-related built characteristics (e.g. manicured gardens and lawns, architecture, monuments, water features).
Although we allocated each association between the built environment and walking into one of these features, we acknowledge that in some cases built characteristics could fall into more than one feature. For example, the presence of a park could be considered as either an aesthetic or destination feature. To determine the most appropriate category, we considered what element of the built characteristic had been assessed. For example, a park described as a component of land use mix was categorized as a destination feature,Footnote 39 whereas a park described in terms of attractiveness or aesthetics was categorized as an aesthetic feature.Footnote 40
Synthesis and analysis
Descriptive statistics (counts and frequencies) in addition to a narrative description were used where possible to summarize the study's methodological strengths and limitations as well as the association between built characteristics and walking. Built environment and walking associations were summarized by feature (functional, destination, safety and aesthetic) and walking outcome (i.e. participation, frequency, achievement of sufficient physical activity, duration and volume). Our summary findings are presented in tabular and graphical form. Given the heterogeneity of the study designs, the built environment and walking variables, and the statistical procedures used, a meta-analysis of our review findings was not possible.
Results
Identification of studies
The initial search yielded 4140 unique records (Figure 1). After completion of title and abstract screening, 157 articles underwent full-text review, with 55 studies identified as satisfying the inclusion criteria review. Thirty of these 55 studies, which looked at non-walking physical activity (e.g. total physical activity, moderate to vigorous intensity physical activity, cycling, and walking and cycling combined), were subsequently excluded-leaving only 25 studies that met the inclusion criteria (Table 1).
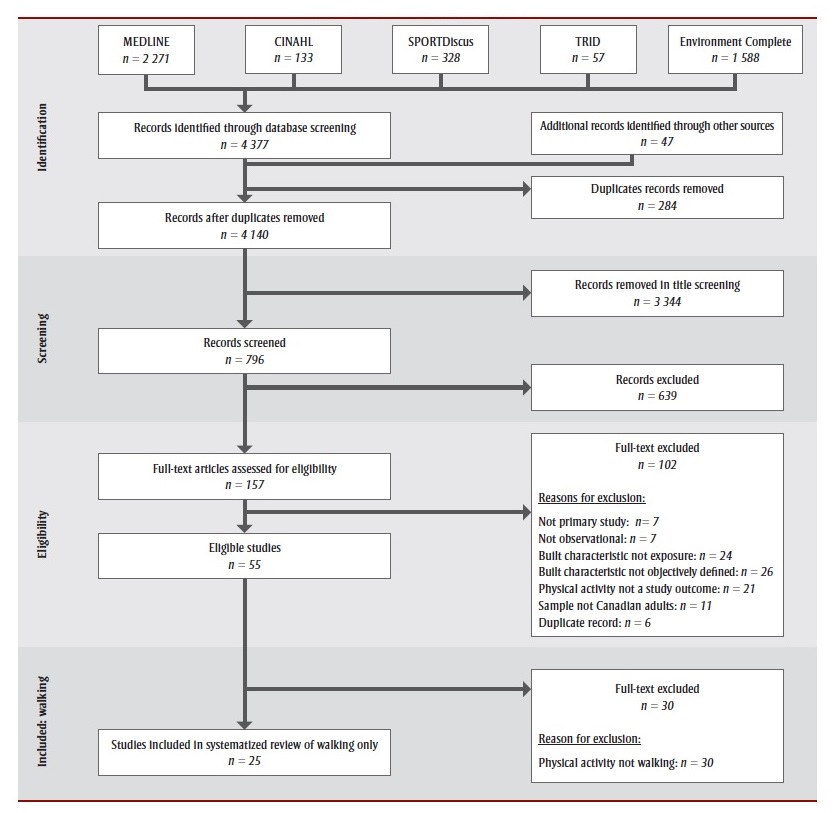
Figure 1 - Description
The selection process for the studies included in the review is depicted in this figure.
In the identification phase, studies were identified in MEDLINE (n = 2271), CINAHL (n = 133), SPORTDiscus (n = 328), TRID (n = 57) and Environment Complete (n = 1588), for a total of 4377 records identified through a database screening. 47 records were identified through other sources. Duplicate records (n = 284) were removed, which left 4140 records.
In the screening phase, 3344 records were removed after title screening, which left 796 records to be screened. The screening led to 639 records to be excluded.
In the eligibility phase, the remaining 157 full-text articles were assessed for eligibility. 102 full-text articles were excluded, for the following reasons: not primary study (n = 7), not observational (n = 7), built characteristic not exposure (n = 24), built characteristic not objectively measured (n = 26), physical activity not a study outcome (n = 21), sample not Canadian adults (n = 11), and duplicate record (n = 6).
In the included phase, 55 studies were included in the systematic review.
In the “included: walking” phase, 30 full-text articles were excluded due to the physical activity not walking. A total of 25 studies were therefore included in the walking review.
| Study | Design | Province | Sample size | Age range (years) | Female (%) | Built environment characteristicsTable Note a | Type of walkingTable Note a |
|---|---|---|---|---|---|---|---|
| Chiu et al. (2015)Footnote 53 | Cross-sectional | ON | 106 337 | 20+ | 51.2 | Walkability (2005-2008) | Walk for transportation (1996, 1997, 2001, 2003, 2005, 2007, 2008) |
| Chudyk et al. (2015)Footnote 48 | Cross-sectional | BC | 150 | 70-79 | 66 | Walkability | Walk for transportation |
| Craig et al. (2002)Footnote 41 | Cross-sectional | ON, QC, AB | 10 983 | NR | NR | Walkability (1999-2000) | Walk for transportation (1996) |
| Frank et al. (2015)Footnote 42 | Cross-sectional | BC, ON | 2 748 | 25+ | 58.2 | Walkability (2011) | Walk for recreation, walk for transportation (2011) |
| Gauvin et al. (2008)Footnote 54 | Cross-sectional | QC | 2 614 | 44-65+ | 61.1 | Proximity to destination, connectivity, personal safety | Walk for recreation, walk for any purpose (2005) |
| Gauvin et al. (2012)Footnote 50 | Cohort | QC | 521 | 67-84 | 53.4 | Proximity to destination | Walk for any purpose (2006) |
| Hajna et al. (2015)Footnote 43 | Cross-sectional | All (excluding Nunavut) | 2 949 | 18+ | 51.4 | Walk Score and Walkability (2006, 2009, 2015) | Walk for any purpose, walk for transportation (2007-2009) |
| Hajna et al. (2016)Footnote 60 | Cross-sectional | QC | 201 | 18+ | 48.1 | Walk Score and Walkability (2006, 2008, 2009) | Walk for any purpose (2006-2008) |
| Hirsch et al. (2016)Footnote 49 | Cross-sectional | BC | 77 | 65-80+ | 66.2 | Land use, proximity to destination (2013) | Walk for any purpose (2012) |
| Jack et al. (2014)Footnote 55 | Cross-sectional | AB | 1 875 | 18-60+ | 62.2 | Walkability | Walk for transportation, walk for recreation (2007-2008) |
| Manaugh et al. (2011)Footnote 59 | Cross-sectional | QC | 17 394 | NR | NR | Walk Score and Walkability | Walk for transportation (2003) |
| McCormack et al. (2012)Footnote 17 | Cross-sectional | AB | 4 034 | 18+ | 59.7 | Walkability | Walk for transportation, walk for recreation (2007-2008) |
| McCormack et al. (2011)Footnote 62 | Cross-sectional | AB | 506 | 18+ | 64.2 | Walkability, proximity to destination | Walk for recreation (2007-2008) |
| Miranda-Moreno et al. (2013)Footnote 51 | Cross-sectional | QC | NRTable Note b | NR | NR | Land use | Walk for any purpose (2010-2011) |
| Miranda-Moreno et al. (2011)Footnote 52 | Cross-sectional | QC | NRTable Note b | NR | NR | Connectivity, population density, land use, proximity to destination | Walk for any purpose (2011) |
| Moniruzzaman et al. (2015)Footnote 58 | Cross-sectional | QC | 13 127 | 55+ | NR | Proximity to destination, land use, population density (2009) | Walk for transportation (2008) |
| Oliver et al. (2011)Footnote 61 | Cross-sectional | BC | 1 602 | 19+ | 61.8 | Land use | Walk for transportation, walk for recreation (2006) |
| Oliver et al. (2007)Footnote 63 | Cross-sectional | BC | 1 311 | 20-60 | 61.4 | Land use (2006) | Walk for transportation, walk for recreation (2006) |
| Riva et al. (2009)Footnote 57 | Cross-sectional | QC | 2 923 | 45-65+ | 61.8 | Walkability | Walk for transportation, walk for recreation, walk for any purpose (2005) |
| Schopflocher et al. (2014)Footnote 40 | Cross-sectional | AB | 2 042 | NR | NR | Connectivity, land use, proximity to destination, aesthetics, personal safety, traffic safety (2008) | Walk for transportation, walk for recreation, walk for any purpose (2010) |
| Thielman et al. (2015)Footnote 44 | Cross-sectional | All | 151 318 | 12-65+ | 48.4 | Walk Score (2012, 2014) | Walk for transportation (2007-2012) |
| Toohey et al. (2013)Footnote 56 | Cross-sectional | AB | 884 | 50+ | 60.1 | Walkability, population density, aesthetics (2006) | Walk for any purpose (2007) |
| Wasfi et al. (2013)Footnote 46 | Cross-sectional | QC | 6 913 | 18+ | 57 | Connectivity, land use, population density (2006) | Walk for transportation (2003) |
| Wasfi et al. (2016)Footnote 45 | Cohort | All (excluding territories) | 2 976 | 18-55 | 52 | Walk Score (2012) | Walk for transportation (1994, 1996, 1998, 2000, 2002, 2004, 2006) |
| Winters et al. (2015)Footnote 47 | Cross-sectional | BC | 1 309 | 65+ | 55 | Walk Score (2013) | Walk for any purpose (2008-2009) |
|
Abbreviations: AB, Alberta; All, all provinces and territories; BC, British Columbia; NR, not reported; ON, Ontario; QC, Quebec.
|
|||||||
Summary of study characteristics
Samples
Included studies were published between 2002 and 2016, with more than 80% (n = 21) published in 2011 or later. Most studies were undertaken in a single province (n = 20); two studies included data from multiple provinces;Footnote 41 Footnote 42 and three studies included national dataFootnote 43 Footnote 44 Footnote 45. Quebec was the most frequent study location (n = 13), followed by Alberta and British Columbia (n = 9) and Ontario (n = 6). Three studies included data from each Saskatchewan, Manitoba, Newfoundland, Nova Scotia, PEI and New Brunswick. No studies were specifically undertaken in the three territories (Nunavut, Northwest Territories or Yukon), though data from the territories were included in two studies that used national data.Footnote 43 Footnote 44 Among studies that reported mean age (n = 11), the lowest mean age was 33.6 yearsFootnote 46 and the highest mean age was 75 yearsFootnote 47. Six study samples involved only older adults (≥50 years). Of the studies that reported response rate, the lowest rate was 8%Footnote 48 and the highest was 74%Footnote 47. Sample sizes ranged from n = 77 Footnote 49 to n = 151 318Footnote 44. Most studies used a simple random sampling strategy (n = 20); three studies used stratified sampling,Footnote 45 Footnote 49 Footnote 50; and two studies used automated pedestrian count data.Footnote 51 Footnote 52
Study design
Most studies used a cross-sectional design (n = 23). Two longitudinal studies were included. A longitudinal study conducted by Gauvin et al.Footnote 50 captured changes in the built environment and walking among older adults over a three-year period. Wasfi et al. Footnote 45 examined how residential relocation (e.g. moving to a neighbourhood with a higher or lower Walk Score) was associated with duration of transportation walking. The authors explored transportation walking and neighbourhood exposure time over the same 12-year period. Footnote 45 Of the 14 studies that indicated the dates of data collection, ten studies captured the walking and built environment data within three years of each other.Footnote 40 Footnote 41 Footnote 42 Footnote 44 Footnote 46 Footnote 49 Footnote 56 Footnote 58 Footnote 60 Footnote 63
Measurement of walking
Walking was assessed most frequently using self-report (n = 22). Five studies measured walking using the International Physical Activity Questionnaire (IPAQ), which captured physical activity in the past seven daysFootnote 40 Footnote 54 Footnote 55 Footnote 56 Footnote 57; two used the Neighbourhood Physical Activity Questionnaire (NPAQ), which captured neighbourhood-based physical activity undertaken in a usual weekFootnote 17 Footnote 42. Other studies included walking data collected for the Canadian Community Health SurveyFootnote 44 Footnote 47 Footnote 53, Canadian CensusFootnote 41 and National Population Health Survey Footnote 45 Footnote 53. Six studies included walking (e.g. trips by foot) reported in travel diaries.Footnote 40 Footnote 46 Footnote 48 Footnote 49 Footnote 58 Footnote 59 Three studies measured walking using self-reports and accelerometers;Footnote 40 Footnote 43 Footnote 49 one study captured steps/day using pedometersFootnote 60; and two studies audited pedestrian activity using automated countersFootnote 51 Footnote 52.Walking undertaken in the past seven days was most often assessed (n = 16), although walking in the previous day (n = 3), previous 14 days (n = 1) and previous three months (n = 3) were also captured.
With respect to the purpose of walking, 17 studies included transportation walking, 10 included walking for any purpose and 9 included recreational walking. While all 25 studies included in this review estimated associations between the built environment and walking, 4 studies also estimated associations between the built environment and other physical activities such as leisure timeFootnote 44 Footnote 49 Footnote 53 and moderate-to-vigorous physical activityFootnote 61.
Measurement of the built environment
The objectively measured built environment characteristics related to walking included walkability or overall built environment indices (n = 15), proximity or density of destinations (n = 8), land use (n = 7), pedestrian or street connectivity (n = 4), population density (n = 4), aesthetics (n = 2), personal safety (n = 2) and traffic safety (n = 1). Built environment characteristics were estimated using GIS primarily (n = 21); however, four studies also collected built environment data using in-person street audits.Footnote 40 Footnote 41 Footnote 54 Footnote 60 Eight studies included Walk Score, while 10 studies used their own walkability indices.
Neighbourhoods or geographical areas or locations used to estimate built environment characteristics were typically delineated using census tract (n = 3), postal code (n = 5) or 400-1600 m buffers, pedsheds or polygons (n = 17) in which the participant's residential address was located. Line-based network buffers (n = 10) and circular network buffers (n = 6) were commonly used, while two studies used polygonal buffersFootnote 43 Footnote 60 and one study created 805 × 805 m grids to delineate a neighbourhood.Footnote 40 Buffers were most often created around the centroid of the participant's geocoded postal code or census tract (n = 11) or the participant's geocoded complete household address (n = 3).
Adjustment for confounders
Among the 25 included studies, only 3 cross-sectional studies statistically adjusted for residential self-selection (i.e. a person's walking preferences, attitudes or behaviour that informs their decision to reside in a neighbourhood).Footnote 17 Footnote 42 Footnote 55 These studies captured residential self-selection via questionnaires where participants self-reported the importance of walking-related built characteristics in their decision to move to their current neighbourhoods. Length of exposure to the environment (i.e. tenure in neighbourhood) was adjusted for in six studies. Footnote 17 Footnote 45 Footnote 50 Footnote 54 Footnote 55 Footnote 56 Demographic (e.g. age, gender, marital status, car ownership and number of dependents) and socioeconomic (e.g. income and education level) characteristics were adjusted for in all but three studies.Footnote 48 Footnote 51 Footnote 52 In addition, studies also adjusted for self-reported health and weight status (n = 13), smoking status and/or other physical activity behaviours (n = 6), weather or seasonality (n = 6) and other environmental characteristics (e.g. urbanicity) (n = 5).
Associations between the built environment and walking
Functional characteristics
Overview
Twenty studiesFootnote 17 Footnote 40 Footnote 41 Footnote 42 Footnote 43 Footnote 44 Footnote 45 Footnote 46 Footnote 47 Footnote 48 Footnote 52 Footnote 53 Footnote 54 Footnote 55 Footnote 56Footnote 57 Footnote 58 Footnote 59 Footnote 60,Footnote 62 reported 144 comparisons between functional characteristics and walking (Table 2). The most common functional characteristics examined included walkability (n = 15 studies; n = 116 comparisons), connectivity (n = 4 studies; n = 20 comparisons) and population density (n = 4 studies; n = 8 comparisons). Of the 144 estimated associations between functional characteristics and walking, 86 (59.7%) associations were null, 54 (37.5%) were positive and 4 (2.8%) were negative.
| Characteristics | Walking for transportation | Walking for recreation | Walking for any purpose | Total | ||||||||
|---|---|---|---|---|---|---|---|---|---|---|---|---|
| − | Null | + | − | Null | + | − | Null | + | − | Null | + | |
| Participation | ||||||||||||
| Overall walkability | 0 | 5 | 25 | 0 | 12 | 0 | 0 | 0 | 0 | 0 | 17 | 25 |
| Connectivity | 0 | 0 | 0 | 0 | 0 | 0 | 0 | 0 | 3 | 0 | 0 | 3 |
| Population density | 0 | 0 | 0 | 0 | 0 | 0 | 0 | 0 | 1 | 0 | 0 | 1 |
| Subtotal | 0 | 5 | 25 | 0 | 12 | 0 | 0 | 0 | 4 | 0 | 17 | 29 |
| Duration | ||||||||||||
| Overall walkability | 0 | 8 | 10 | 0 | 4 | 0 | 0 | 0 | 0 | 0 | 12 | 10 |
| Subtotal | 0 | 8 | 10 | 0 | 4 | 0 | 0 | 0 | 0 | 0 | 12 | 10 |
| Achieve sufficient physical activity | ||||||||||||
| Overall walkability | 0 | 1 | 1 | 0 | 2 | 0 | 0 | 3 | 5 | 0 | 6 | 6 |
| Connectivity | 0 | 0 | 0 | 0 | 2 | 0 | 0 | 2 | 0 | 0 | 4 | 0 |
| Population density | 0 | 0 | 0 | 0 | 0 | 0 | 0 | 4 | 0 | 0 | 4 | 0 |
| Subtotal | 0 | 1 | 1 | 0 | 4 | 0 | 0 | 9 | 5 | 0 | 14 | 6 |
| Frequency | ||||||||||||
| Overall walkability | 0 | 4 | 3 | 1 | 7 | 0 | 0 | 6 | 0 | 1 | 17 | 3 |
| Population density | 0 | 2 | 0 | 0 | 0 | 0 | 0 | 0 | 0 | 0 | 2 | 0 |
| Subtotal | 0 | 6 | 3 | 1 | 7 | 0 | 0 | 6 | 0 | 1 | 19 | 3 |
| Volume | ||||||||||||
| Overall walkability | 0 | 0 | 4 | 0 | 0 | 0 | 3 | 10 | 2 | 3 | 10 | 6 |
| Connectivity | 0 | 5 | 0 | 0 | 4 | 0 | 0 | 4 | 0 | 0 | 13 | 0 |
| Population density | 0 | 1 | 0 | 0 | 0 | 0 | 0 | 0 | 0 | 0 | 1 | 0 |
| Subtotal | 0 | 6 | 4 | 0 | 4 | 0 | 3 | 14 | 2 | 3 | 24 | 6 |
| Grand total | 0 | 26 | 43 | 1 | 31 | 0 | 3 | 29 | 11 | 4 | 86 | 54 |
|
||||||||||||
Walking for transportation
Walking for transportation was the most common walking outcome examined (n = 14 studies). Of the 69 associations estimated between functional characteristics and walking for transportation, 43 (62%) were positive, 26 (38%) were null and 0 were negative (Table 2). In terms of functional characteristics, walking for transportation was associated with overall walkability. Specifically, positive associations were found between functional characteristics and transportation walking participation (n = 25 comparisons), duration (n = 10 comparisons), volume (n = 4 comparisons), frequency (n = 3 comparisons) and achievement of sufficient physical activity (n = 1 comparison).
Walking for recreation
Seven studies estimated associations between functional characteristics and walking for recreation. Of the 32 associations estimated, 31 (97%) were null and 1 (3%) was negative (Table 2). These studies estimated associations between functional characteristics and recreation walking participation (n = 12 comparisons), frequency (n = 8 comparisons), duration (n = 4 comparisons), volume (n = 4 comparisons) and achievement of sufficient physical activity via walking (n = 4 comparisons). All studies that examined associations between functional characteristics and walking for recreation captured walking data using the IPAQ (n = 5 studies) or NPAQ (n = 2 studies).
Walking for any purpose
Eight studies estimated associations between functional characteristics and walking for any purpose (non-purpose specific). Of the 43 associations estimated, 29 (67%) were null, 11 (26%) were positive and 3 (7%) were negative (Table 2). Walkability was positively associated with achievement of sufficient physical activity via walking (n = 5 comparisons) and walking volume (n = 2 comparisons), while pedestrian or street connectivity (n = 3 comparisons) and population density (n = 1 comparison) were positively associated with walking participation. Among the three associations reported between walkability and walking volume, all were in a negative direction.
Destination-related characteristics of the built environment
Overview
Eleven studiesFootnote 40 Footnote 46 Footnote 49 Footnote 50 Footnote 51 Footnote 52 Footnote 54 Footnote 58 Footnote 61 Footnote 62 Footnote 63 reported 98 comparisons between destination-related features and walking (Table 3).The most common destination-related feature examined was land use (n = 38 comparisons). Thirty-one comparisons were reported between proximity to destinations and walking. Of the 98 estimated associations, 69 (70%) associations were null, 23 (24%) were positive and 6 (6%) were negative. All negative associations were found in studies that captured walking using self-reported questionnaires (n = 4 studies). Of the studies that explored an association between proximity to destinations and walking (n = 6), almost all studies focused on adults 44 years or older (n = 5).
| Characteristics | Walking for transportation | Walking for recreation | Walking for any purpose | Total | ||||||||
|---|---|---|---|---|---|---|---|---|---|---|---|---|
| − | Null | + | − | Null | + | − | Null | + | − | Null | + | |
| Participation | ||||||||||||
| Land use | 3 | 16 | 9 | 1 | 14 | 3 | 0 | 0 | 2 | 4 | 30 | 14 |
| Proximity to destination | 0 | 0 | 1 | 1 | 0 | 0 | 0 | 0 | 3 | 1 | 0 | 4 |
| Subtotal | 3 | 16 | 10 | 2 | 14 | 3 | 0 | 0 | 5 | 5 | 30 | 18 |
| Achieve sufficient physical activity | ||||||||||||
| Land use | 0 | 0 | 0 | 0 | 0 | 0 | 0 | 4 | 0 | 0 | 4 | 0 |
| Proximity to destination | 0 | 0 | 0 | 0 | 2 | 0 | 0 | 5 | 1 | 0 | 7 | 1 |
| Subtotal | 0 | 0 | 0 | 0 | 2 | 0 | 0 | 9 | 1 | 0 | 11 | 1 |
| Frequency | ||||||||||||
| Land use | 0 | 1 | 0 | 0 | 0 | 0 | 0 | 0 | 0 | 0 | 1 | 0 |
| Proximity to destination | 1 | 4 | 2 | 0 | 1 | 0 | 0 | 2 | 1 | 1 | 7 | 3 |
| Subtotal | 1 | 5 | 2 | 0 | 1 | 0 | 0 | 2 | 1 | 1 | 8 | 3 |
| Volume | ||||||||||||
| Land use | 0 | 3 | 0 | 0 | 2 | 0 | 0 | 5 | 1 | 0 | 10 | 1 |
| Proximity to destination | 0 | 2 | 0 | 0 | 2 | 0 | 0 | 6 | 0 | 0 | 10 | 0 |
| Subtotal | 0 | 5 | 0 | 0 | 4 | 0 | 0 | 11 | 1 | 0 | 20 | 1 |
| Grand total | 4 | 26 | 12 | 2 | 21 | 3 | 0 | 22 | 8 | 6 | 69 | 23 |
|
||||||||||||
Walking for transportation
Walking for transportation was the most common walking outcome examined (n = 6 studies). Of the 42 estimated associations, 12 (29%) were positive, 26 (62%) were null and 4 (10%) were negative (Table 3). In terms of destination-related characteristics, walking for transportation was associated with both land use and proximity to destinations. Specifically, positive associations were found between functional characteristics and transportation walking participation (n = 10 comparisons) and frequency (n = 2 comparison).
Walking for recreation
Five studies estimated associations between destination-related characteristics and walking for recreation. Of the 26 estimated associations, 3 (12%) were positive, 21 (81%) were null and 2 (8%) were negative (Table 3). Specifically, estimated associations were found between destination-related characteristics and recreational walking participation (n = 19 comparisons), volume (n = 4 comparisons), achievement of sufficient physical activity via walking (n = 2 comparisons) and frequency (n = 1 comparison). Positive associations were found between land use and recreational walking (n = 3 comparisons).
Walking for any purpose
Six studies estimated associations between destination-related characteristics and walking for any purpose. Of the 30 estimated associations, 8 (27%) were positive and 22 (73%) were null (Table 3). Proximity to destinations was positively associated with participation (n = 3 comparisons), achievement of sufficient physical activity via walking (n = 1 comparison), walking frequency (n = 1 comparison) and walking volume (n = 1 comparison), while land use was associated with walking participation (n = 2 comparisons).
Safety characteristics of the built environment
Overview
Two studiesFootnote 40 Footnote 54 reported 16 comparisons between safety characteristics and walking (Table 4). The safety characteristics examined were personal safety (n = 10 comparisons) and traffic safety (n = 6 comparisons). Of the 16 estimated associations, 2 were positive and 14 were null.
| Characteristics | Walking for transportation | Walking for recreation | Walking for any purpose | Total | ||||||||
|---|---|---|---|---|---|---|---|---|---|---|---|---|
| − | Null | + | − | Null | + | − | Null | + | − | Null | + | |
| Achieve sufficient physical activity | ||||||||||||
| Personal safety | 0 | 0 | 0 | 0 | 2 | 0 | 0 | 2 | 0 | 0 | 4 | 0 |
| Subtotal | 0 | 0 | 0 | 0 | 2 | 0 | 0 | 2 | 0 | 0 | 4 | 0 |
| Volume | ||||||||||||
| Personal safety | 0 | 1 | 1 | 0 | 2 | 0 | 0 | 1 | 1 | 0 | 4 | 2 |
| Traffic safety | 0 | 2 | 0 | 0 | 2 | 0 | 0 | 2 | 0 | 0 | 6 | 0 |
| Subtotal | 0 | 3 | 1 | 0 | 4 | 0 | 0 | 3 | 1 | 0 | 10 | 2 |
| Grand total | 0 | 3 | 1 | 0 | 6 | 0 | 0 | 5 | 1 | 0 | 14 | 2 |
|
||||||||||||
Walking for transportation
Walking for transportation was the least common walking outcome examined (n = 4 comparisons) (Table 4). Of the 4 estimated associations, 1 was positive and 3 were null. Positive association was found between personal safety and volume of transportation walking.
Walking for recreation
Two studiesFootnote 40 Footnote 54 estimated associations between safety characteristics and walking for recreation. All 6 of the estimated associations were null (Table 4). Studies estimated associations between safety characteristics and recreational walking volume (n = 4 comparisons) and achievement of sufficient physical activity via recreational walking (n = 2 comparisons).
Walking for any purpose
Two studiesFootnote 40 Footnote 54 estimated associations between safety characteristics and walking for any purpose. Of the 6 estimated associations, 5 were null and 1 was positive (Table 4). Personal safety was positively associated with volume of walking for any purpose. Studies estimated associations between safety characteristics and volume of walking for any purpose (n = 4 comparisons) and achievement of sufficient physical activity via walking (n = 2 comparisons).
Aesthetic characteristics of the built environment
Overview
Two studiesFootnote 40 Footnote 56 reported 10 comparisons between aesthetic characteristics and walking (Table 5). Of the 10 estimated associations, 1 (10%) was positive and 9 (90%) were null.
| Characteristics | Walking for transportation | Walking for recreation | Walking for any purpose | Total | ||||||||
|---|---|---|---|---|---|---|---|---|---|---|---|---|
| − | Null | + | − | Null | + | − | Null | + | − | Null | + | |
| Achieve sufficient physical activity | ||||||||||||
| Aesthetics | 0 | 0 | 0 | 0 | 0 | 0 | 0 | 4 | 0 | 0 | 4 | 0 |
| Subtotal | 0 | 0 | 0 | 0 | 0 | 0 | 0 | 4 | 0 | 0 | 4 | 0 |
| Volume | ||||||||||||
| Aesthetics | 0 | 2 | 0 | 0 | 1 | 1 | 0 | 2 | 0 | 0 | 5 | 1 |
| Subtotal | 0 | 2 | 0 | 0 | 1 | 1 | 0 | 2 | 0 | 0 | 5 | 1 |
| Grand total | 0 | 2 | 0 | 0 | 1 | 1 | 0 | 6 | 0 | 0 | 9 | 1 |
|
||||||||||||
Walking for transportation
One studyFootnote 40 examined the association between aesthetic characteristics and walking for transport. Both associations estimated were null (Table 5).
Walking for recreation
One studyFootnote 40 examined the association between aesthetic characteristics and walking for recreation. Of the 2 estimated associations, 1 was positive and 1 was null (Table 5).
Walking for any purpose
Two studiesFootnote 40 Footnote 56 estimated associations between aesthetic characteristics and walking for any purpose. All 6 estimated associations were null (Table 5). The association between aesthetic characteristics and walking for any purpose was estimated between achievement of sufficient physical activity via walking (n = 4 comparisons) and volume (n = 2 comparisons).
Discussion
This is the first review conducted into the relationship between objective measures of the built environment and physical activity (walking) in the Canadian context. The pattern in publication dates among the reviewed studies suggests that this relationship is an emerging research area in Canada. While findings to date are promising, gaps in evidence still exist-specifically with respect to rural areas and the territories (Northwest Territories, Nunavut and Yukon). Moreover, all but two studies had a cross-sectional study design, suggesting that the evidence pointing to an association between the built environment and physical activity is still preliminary and exploratory; thus, it is not possible to infer causation based on our review findings. Canadian studies to date have rarely adjusted for residential self-selection, which may lead to an overestimation of the association between the built environment and walking. As expected based on previous reviews,Footnote 14 Footnote 21 most studies used self-reported measures of physical activity, measured the built environment using GIS instead of street audits or relied on publicly available walkability data (i.e. Walk Score). Nevertheless, as with other reviews,Footnote 14 Footnote 16 Footnote 19 Footnote 20 Footnote 21 our findings do suggest that the neighbourhood built environment is associated with walking, particularly walking for transportation among adults, and that some built characteristics may be more important for supporting certain types of walking.
Consistent with findings from other reviews,Footnote 14 Footnote 16 Footnote 20 Footnote 21 there was a distinct association between overall neighbourhood walkability (e.g. Walk Score) and transportation walking. Specifically, we found that a higher level of neighbourhood walkability was positively associated with participation, duration, frequency and volume of transportation walking. These findings are important given that active transportation, which includes walking, is inversely associated with overweight/obesity, Footnote 64 as well as positively associated with decreased prevalence of adults with type 2 diabetesFootnote 65 and reduced cardiovascular risk. Footnote 66 The importance of land use and destinations for encouraging and supporting walking in adult population has been noted elsewhere. Footnote 14 Footnote 16 Our review findings suggest that land use (e.g. having a mix of destinations) is important for encouraging participation across all walking domains. Proximity to destinations was associated with frequency of walking for transportation, as well as participation and frequency of walking for any purpose. Improving the walkability of neighbourhoods overall and increasing land use mix and proximity to destinations can potentially increase the physical activity levels of Canadian adults-in turn improving population health.
Unlike other reviews,Footnote 14 Footnote 16 Footnote 20 our findings suggest that the association between connectivity and population density with walking were non-significant, though very few comparisons were made between these built characteristics and walking. Of the few included studies that explored the association between connectivityFootnote 40 Footnote 46 Footnote 52 Footnote 54 or population densityFootnote 46 Footnote 52 Footnote 56 Footnote 58 with walking, only one study found positive associations between population density and connectivity with walking for any purpose, measured by automatized pedestrian counters.Footnote 52 Future studies into these associations in the Canadian context could help determine if improving connectivity and increasing population density would enhance the ability of neighbourhoods to support physical activity. These studies could also provide a better understanding of how this association may differ in Canada compared to other countries.
Fewer studies included in our review captured walking for recreation, relative to walking for transport or walking for any purpose. The extent to which non-significant or negative associations between the built environment and walking for recreation were not published (i.e., publication bias) could not be determined from our review. Study findings estimating the association between the built environment and walking for recreation were mixed. Our study findings did, however, find less consistency in associations between the built environment and walking for recreation compared to associations between the built environment and walking for transportation.Footnote 14 Footnote 16 Footnote 20 Footnote 21 It is possible that measures of the built environment included in the reviewed studies are tailored more towards walking for transportation. Manaugh et al.Footnote 59 found small but notable differences in the magnitude of estimated associations between non-work trips by foot and walkability that were related to trip purpose, the population subgroup examined and the definition of walkability used. Some evidence from our review suggested that built characteristics, including land use and aesthetics, were positively associated with participation and volume of walking for recreation. More research identifying which built characteristics are supportive of recreation versus transportation walking-and for whom-is needed.
Evidence from the Canadian studies did not find a significant association between safety and aesthetic characteristics of the built environment and walking, Moreover, safety and aesthetics were the least studied built characteristics within our review, which might be a consequence of our focus on objective measures of the built environment. Traffic and personal safety can be objectively measured (e.g. via crime and accident statistics and presence of incivilities). However, perceived safety likely informs people's decisions to walk, and these perceptions can be independent of, or unrepresentative, of the actual safety of a neighbourhood.Footnote 67 Further, studies that estimate safety from existing statistics may miss the micro-scale built characteristics (e.g. graffiti, drug paraphernalia, litter) associated with sense of safety that might be better captured via street audits-few of which existed in the studies we reviewed. Footnote 40 Footnote 41 Footnote 54 Footnote 60
With evidence suggesting that physical activity behaviours differ between countries, it was important to explore how the built environment is associated with walking in the Canadian context. Findings from this review are supported by other systematic reviews of evidence from the United States, Australia and Europe.Footnote 14 Footnote 21 Cross-sectional study designs are frequently used and measures of walking are mostly self-reported. Footnote 14 Footnote 16 Footnote 20 Footnote 21 A review by McCormack et al.Footnote 14 reported that there was wide variation in how the built environment is operationalized, but GIS tended to be the most commonly used technique among studies incorporating objective measures of the built environment, which was similar to our findings. Consistency in the measurement of the built environment and walking across studies would provide a better understanding of this association, and may make it possible to pool and synthesize findings using meta-analysis.
There are several limitations to this review that must be considered. Due to limited resources, a comprehensive systematic review (e.g. double-screening at all stages of the search process and validity assessment) was not feasible; nevertheless, steps were taken to ensure scientific rigour. Due to the broad range of built environment characteristics that were measured and defined across studies, we used an established theoretical frameworkFootnote 34 to classify characteristics into four categories (functional, safety, aesthetic, destination). It is possible that some built characteristics were associated with multiple categories from this theoretical framework. Due to the small number of Canadian studies included in the review, we were not able to stratify our findings based on smaller geographical scales (i.e. within and across provinces or cities). This more granular focus may be possible in the future as Canadian studies investigating the relationship between the built environment and physical activity continue to accumulate. Moreover, our review only included studies that statistically tested an association between the built environment and walking. Despite providing important contributions to the field, several Canadian studies were excluded: either the nature and/or significance of the associations between the built environment and walking was not clearly described or they had a specific methodological focus.Footnote 68 Footnote 69 Footnote 70 Footnote 71 The predominance of cross-sectional studies included in our review meant that we were not able to draw causal inferences. As suggested in previous reviews,Footnote 14 Footnote 16 Footnote 21 Footnote 22 evidence from more rigorous study designs (i.e. natural and quasi-experiments) are needed. While our focus was the associations between the built environment and walking, the built environment could be an important correlate for other physical activities (e.g. cycling, leisure activity or moderate to vigorous activity).Footnote 14 Footnote 20 Footnote 21
Conclusion
Within the Canadian context, current evidence suggests that the neighbourhood built environment is associated with walking and, in particular, walking for transportation. Improving neighbourhood walkability, land use and proximity to destinations may enable or support higher levels of transportation walking, and in turn contribute to better health outcomes among Canadian adults. Future research is needed on the relationship between the built environment and walking in non-urban locations as well as in the territories. Moreover, study designs that estimate the causal relationship between the built environment and walking and other physical activities are needed to better inform urban and transportation policy and planning decisions in Canada.
Acknowledgements
The authors would like to thank Dr. Karen Tang for her assistance in the literature search. Brenlea Farkas is supported by the Queen Elizabeth II Graduate Scholarship. Gavin McCormack was supported by a Canadian Institutes of Health Research (CIHR) New Investigator Award (MSH-130162). Christine Friedenreich was supported by an Alberta Innovates Health Solutions Health Senior Scholar Award and an Alberta Cancer Foundation Weekend to End Women's Cancers Breast Cancer Chair.
Conflicts of interest
The authors declare that there is no conflict of interest regarding the publication of this article.
Authors' contributions and statement
BF, DW and GM conceived the study. BF and DW undertook the database search and article selection and data extraction. All authors contributed to interpretation of the results. BF, GM and DW wrote the article. All authors read and approved the final manuscript.
The content and views expressed in this article are those of the authors and do not necessarily reflect those of the Government of Canada.