
Evidence synthesis – Neighbourhood retail food outlet access, diet and body mass index in Canada: a systematic review
Health Promotion and Chronic Disease Prevention in Canada
Andrew C. Stevenson, MScPHAuthor reference 1; Anne-Sophie Brazeau, PhDAuthor reference 2; Kaberi Dasgupta, MD, MScAuthor reference 3Author reference 4Author reference 5; Nancy A. Ross, PhDAuthor reference 1Author reference 3
https://doi.org/10.24095/hpcdp.39.10.01
This article has been peer reviewed.
Author references:
- Author reference 1
-
Department of Geography, McGill University, Montréal, Quebec, Canada
- Author reference 2
-
School of Human Nutrition, McGill University, Ste-Anne-de-Bellevue, Quebec, Canada
- Author reference 3
-
Department of Epidemiology, Biostatistics and Occupational Health, McGill University, Montréal, Quebec, Canada
- Author reference 4
-
Department of Medicine, McGill University Health Centre, McGill University, Montréal, Quebec, Canada
- Author reference 5
-
Centre for Outcomes Research and Evaluation (CORE), Research Institute of the McGill University Health Centre, McGill University, Montréal, Quebec, Canada
Correspondence: Nancy A. Ross, Department of Geography, McGill University, 805 Sherbrooke St. West, Montréal, QC H3A 0B9; Tel: 514-398-4307; Email: nancy.ross@mcgill.ca
Abstract
Introduction: There is growing interest in the role of food environments in suboptimal diet and overweight and obesity. This review assesses the evidence for the link between the retail food environment, diet quality and body mass index (BMI) in the Canadian population.
Methods: We conducted a systematic keyword search in two bibliometric databases. We tabulated proportions of conclusive associations for each outcome and exposure of interest. Absolute and relative measures of exposure to the food environment were compared and theoretical framing of the associations noted. We assessed two key methodological issues identified a priori—measurement of BMI, and validation of the underlying retail food environment data.
Results: Seventeen studies were included in the review. There was little evidence of a food environment–diet quality relationship and modest evidence of a food environment–BMI relationship. Relative measures of the food environment were more often associated with an outcome in the expected direction than absolute measures, but many results were inconclusive. Most studies adopted ecological theoretical frameworks but methodologies were similar regardless of stated theoretical approaches. Self-reported BMI was common and there was no "gold standard" database of food outlets nor a consensus on best ways to validate the data.
Conclusion: There was limited evidence of a relationship between the food environment and diet quality, but stronger evidence of a relationship between the food environment and BMI for Canadians. Studies with broad geographic scope that adopt innovative methods to measure diet and health outcomes and use relative measures of the food environment derived in geographic information systems are warranted. Consensus on a gold standard food environment database and approaches to its validation would also advance the field.
Keywords: retail food environment, body mass index, diet quality, systematic review, Canada
Highlights
- Seventeen studies that investigated the food environment and its relationship to diet quality or body mass index in Canada met inclusion criteria for systematic review.
- There was little evidence of a relationship between the neighbourhood food environment and diet, possibly due to error and bias in diet quality measurement.
- There was modest evidence of a relationship between the neighbourhood food environment and body mass index.
- Relative measures perform better than absolute measures of food environment exposure.
- There is no consensus on a "gold standard" food outlet database nor on approaches to field validation of these databases.
Introduction
Despite the decline of diseases of undernutrition in developed countries, dietary quality remains suboptimal in Canada.Footnote 1 Evidence from the 2004 Canadian Community Health Survey – Nutrition confirms that a majority of Canadians do not meet their minimum recommended intake of fruits and vegetables, and many exceed the upper recommended limit of sodium and fat intake and have high total energy intake.Footnote 2Footnote 3 Modern food production enables excess consumption of nutrient-poor and energy-dense foodFootnote 4 and Canadians rank high among the world's top consumers of unhealthy foods.Footnote 5 This diet may pose a large health burden on the population, given the importance of dietary quality to disease prevention and management.
Diet is among the most important modifiable risk factors for morbidity and mortality worldwide because of its impact on chronic disease development.Footnote 6 In Canada, high rates of overweight and obesity and a secular trend of rising type 2 diabetes prevalence have persisted over the past decade.Footnote 7Footnote 8 There are growing calls for multilevel interventions to optimize diet considering that individual dietary choices are likely to be constrained by "upstream" determinants such as socioeconomic status (SES), market structures and environments.Footnote 4 It is suggested that the retail food environment supports or impedes people's capacity to make healthy eating choices, making them a target for intervention. First, however, we need to establish if retail food environments are associated with eating behaviour and body mass index (BMI). We are now able to examine this on a large scale with geographic information systems (GIS) and other statistical software. Dimensions of the food environment include availability and quality of food within retailers, accessibility of food outlets within a geographic area, food affordability and media and advertising related to food products.Footnote 9
Scoping reviews rapidly describe key concepts and underpinnings of a research area and often provide an overview of the type, extent and quantity of research in a particular field, while systematic reviews examine a more focussed question, adding quality evaluation and recommendations based on a synthesis of the evidence.Footnote 10 Minaker and colleagues recently published a scoping reviewFootnote 11 on Canadian food environment research. The authors assessed quantitative and qualitative studies, conceptual papers and commentaries, and included 88 papers in their review. They reported that studies typically address the socioeconomic patterning of food environments or the association between food environments and diet, weight or health outcomes such as cardiovascular disease. The literature is characterized by measurement inconsistency, a lack of longitudinal and intervention studies and little geographic variability, with a scarcity of studies on rural and Indigenous communities. Another scoping reviewFootnote 12 on urban form and health in Canada found that most studies that examined food environment access measures and health outcomes such as weight status, cardiovascular disease and diabetes reported at least one statistically significant association.
There have been five international systematic reviews since 2010Footnote 13Footnote 14Footnote 15Footnote 16Footnote 17 on the associations between neighbourhood food environments and health-related outcomes. These reviews suggest low to moderate evidence of an association between the food environment and outcomes such as obesity and diet, with predominately null results, wide variation in the measurement of the food environment and a focus on the United States. Canadian and American food environments differ importantly. For example, low-income areas devoid of healthy food outlets are less widespread in Canada than in the United States.Footnote 11 However, low-income areas with an overabundance of already prepared, easily accessible, calorie-dense foods are common in Canada.Footnote 11 To date, there has been no systematic review on the food environment and its relationship to diet quality or BMI in Canada. The neighbourhood retail food environment is an object of study internationally, and this review will add to the literature with a Canadian focus.
The aim of this paper is to systematically review the evidence on relationships between neighbourhood access to food outlets, diet quality and BMI in the Canadian context. A second aim is to compare the utility of absolute measures (e.g. proximity of an outlet type to home, density of an outlet type within a geographic area) and relative measures (e.g. proportion of healthy food outlets within a geographic area) of the food environment.
Methods
Search strategy
We developed a search strategy in consultation with a librarian and in compliance with PRISMA guidelines. Title, abstract and MeSH terms were searched in PubMed and title and abstract terms were searched in Scopus, not restricting the start point and including published articles through to January 2019. PubMed specializes in biomedical and public health literature from MEDLINE and Scopus provides a range of peer-reviewed articles from a variety of disciplines. We developed three independent search blocks to address articles relating to diet, BMI and cardiometabolic disease (Table 1). While we were only interested in diet and BMI outcomes, we used the cardiometabolic search block for completeness to identify any studies that may have been missed in the diet and BMI search blocks.
Table 1. Search blocks developed for the systematic search of the literature on the food environment, diet and body mass index in Canada
- Diet
- ((((fruit* [Title/Abstract] OR vegetable* [Title/Abstract] OR diet [Title/Abstract] OR diets [Title/Abstract] OR dietary [Title/Abstract] OR eating [Title/Abstract] OR nutrition [Title/Abstract] OR consumption [Title/Abstract] OR intake [Title/Abstract]) AND ((food environment [Title/Abstract] OR nutrition environment [Title/Abstract] OR retail food [Title/Abstract] OR food desert [Title/Abstract] OR food swamp [Title/Abstract] OR food availability [Title/Abstract] OR foodscape [Title/Abstract] OR local food [Title/Abstract] OR (("neighbourhood" [All Fields] OR "residence characteristics" [MeSH Terms] OR ("residence" [All Fields] AND "characteristics" [All Fields]) OR "residence characteristics" [All Fields] OR "neighborhood" [All Fields]) AND food [Title/Abstract]) OR "neighborhood food" [Title/Abstract] OR fast food access [Title/Abstract] OR food access [Title/Abstract]) OR "fast foods" [MeSH Terms])) AND "canada" [MeSH Terms]) NOT school [Title/Abstract])
- BMI
- (((((obesity [Title/Abstract] OR body mass index [Title/Abstract] OR waist circumference [Title/Abstract]) OR "overweight" [MeSH Terms]) AND ((food environment [Title/Abstract] OR nutrition environment [Title/Abstract] OR retail food [Title/Abstract] OR food desert [Title/Abstract] OR food swamp [Title/Abstract] OR food availability [Title/Abstract] OR foodscape [Title/Abstract] OR local food [Title/Abstract] OR (("neighbourhood" [All Fields] OR "residence characteristics" [MeSH Terms] OR ("residence" [All Fields] AND "characteristics" [All Fields]) OR "residence characteristics" [All Fields] OR "neighborhood" [All Fields]) AND food [Title/Abstract]) OR "neighborhood food" [Title/Abstract] OR fast food access [Title/Abstract] OR food access [Title/Abstract]) OR "fast foods" [MeSH Terms])) AND "canada" [MeSH Terms]) NOT school [Title/Abstract])
- CVD
- ((((cardiovascular [Title/Abstract] OR diabetes [Title/Abstract] OR hypertension [Title/Abstract] OR cardiometabolic [Title/Abstract] OR heart [Title/Abstract]) AND ((food environment [Title/Abstract] OR nutrition environment [Title/Abstract] OR retail food [Title/Abstract] OR food desert [Title/Abstract] OR food swamp [Title/Abstract] OR food availability [Title/Abstract] OR foodscape [Title/Abstract] OR local food [Title/Abstract] OR (("neighbourhood" [All Fields] OR "residence characteristics" [MeSH Terms] OR ("residence" [All Fields] AND "characteristics"[All Fields]) OR "residence characteristics" [All Fields] OR "neighborhood" [All Fields]) AND food [Title/Abstract]) OR "neighborhood food" [Title/Abstract] OR fast food access [Title/Abstract] OR food access [Title/Abstract]) OR "fast foods" [MeSH Terms])) AND "canada" [MeSH Terms]) NOT school [Title/Abstract])
Abbreviations: BMI, body mass index; CVD, cardiovascular diseases.
Note: The variation of search string for Scopus is not shown in this table.
Inclusion and exclusion criteria
ACS and AB reviewed titles and abstracts using EndNote X7 software (Clarivate Analytics, Philadelphia, PA, USA). Articles were included if (1) the study population was Canadian; (2) both an access-related measure of the food environment derived from GIS and a diet or BMI outcome were assessed; (3) the effect estimates were reported; and (4) the exposure to food outlets represented the home neighbourhood. To avoid double counting results, we excluded articles if they reported associations on the same cohort as an included study and used a similar methodology. Either the most recent or most comprehensive study was used. We then reviewed full texts based on the inclusion and exclusion criteria, and identified additional references through citation tracking.
Quality assessment and data extraction
Data were extracted using a standardized form. Included results were based on the authors' final model or the model with the most relevant covariates, as judged by the reviewer. We assessed the type of conceptual framework that the authors used and we considered whether studies were alert to some quality concerns of food environment studies raised by Cobb et al.,Footnote 13 namely the issue of self-reported BMI and validation of the food outlet dataset. Cobb et al. included self-selection as important for quality assessment in studies with a neighbourhood-level potential determinant, but food environment studies rarely, if ever, account for the purposeful choice of individuals to move into an area with a favourable or an unfavourable food environment. We return to this point in the discussion section.
We considered markers of diet quality (continuous diet quality scores, fruit and vegetable intake (FVI) and fast food consumption) and BMI as separate outcomes. The exposures of interest for this review were less healthy retail food outlets (fast food restaurants, convenience stores and summary measures of "less healthy food retail"), healthier retail food outlets (grocery stores, supermarkets, fruit and vegetable stores, and summary measures of "healthier food retail"), and non–fast food restaurants. Our expectation was that greater exposure to less healthy retail food outlets would be associated with poorer diet quality and higher BMI, and that greater exposure to healthier retail food outlets would be associated with better diet and lower BMI. For studies that reported effect sizes between levels of exposure, we considered the two most extreme groupings (i.e. the highest vs. the lowest quartile). We then compared the associations between absolute and relative food environment measures. Recent studies have argued that relative measures provide a better conceptualization of the food environment by allowing for the simultaneous exposure of healthier and less healthy retail food outlets.Footnote 18Footnote 19
We were principally interested in main full-sample effects to synthesize the literature with clarity owing to the many different ways that results were stratified. There is a tendency in the Canadian food environment literature to stratify results based on common attributes (e.g. sex, city), but we recognize that it is possible to generate findings with multiple tests and we were concerned that the reduction in sample size might result in a reduction in study power. Therefore, we reported the full sample associations when they were provided and calculated pooled full sample results if only stratified results were reported. This means that the pooled full sample results that we calculated for this review are not found in the original papers. We also calculated the 95% confidence intervals for studies that reported the effect size with standard deviations or standard errors.
Results
The search yielded a total of 430 unique abstracts, and two additional articles were identified through citation tracking. After reviewing titles and abstracts, we identified 24 for full-text review, of which 17 fulfilled eligibility criteria (Figure 1). Mercille et al. (2016)Footnote 20 was excluded because the authors reported associations for the same cohort as the original Mercille et al. (2012)Footnote 21 study. Lebel et al.Footnote 22 was excluded because the authors reported associations for the same cohort as Kestens et al.Footnote 23 and used a similar methodology, although it included fewer exposure measures.
Figure 1. PRISMA flow diagram of included studies
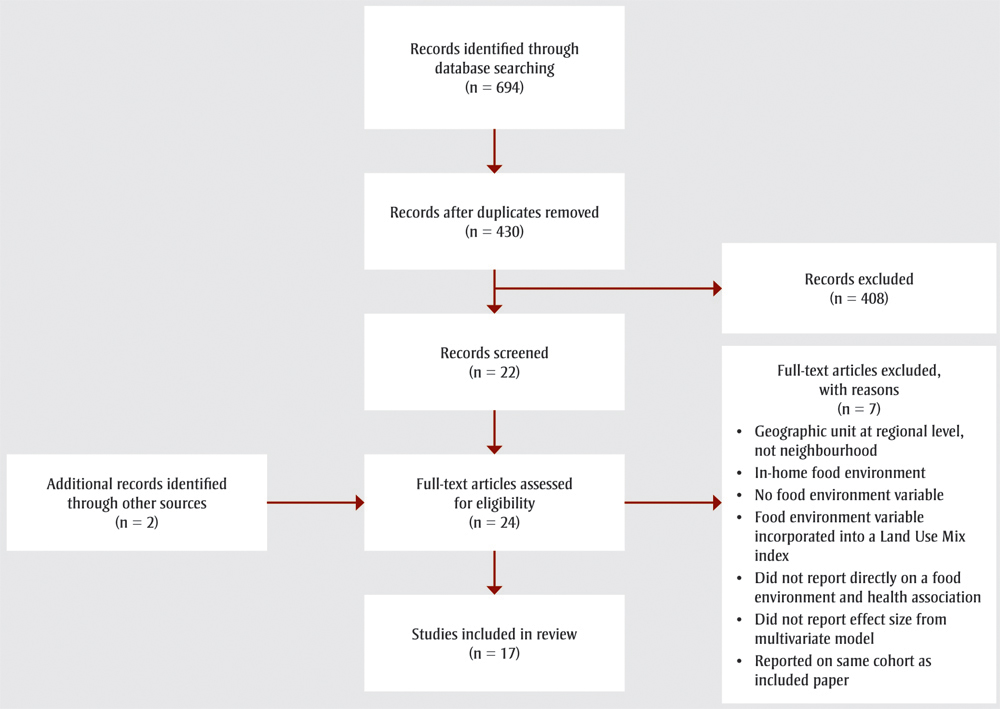
Text description
Figure 1 illustrates the PRISMA flow diagram of included studies. There were 694 records identified through database searching. After duplicates were removed, 430 records remained of which 408 were excluded, leaving 22 records to be screened plus 2 additional records which were identified through other sources. The 24 full-text articles were assessed for eligibility whereby 7 full-text articles were excluded for reasons such as geographic unit at regional level, not neighbourhood; in-home food environment; no food environment variable; food environment variable incorporated into a Land Use Mix index; not reporting directly on a food environment and health association; not reporting effect size from multivariate model; or reporting on same cohort as included paper. 17 studies fulfilled eligibility criteria and were included in the review.
Of the 17 studies retained, 13 examined adultsFootnote 18Footnote 19Footnote 21Footnote 23Footnote 24Footnote 25Footnote 26Footnote 27Footnote 28Footnote 29Footnote 30Footnote 31Footnote 32 and four examined children or adolescents.Footnote 33Footnote 34Footnote 35Footnote 36 All employed a cross-sectional design. Eight studies investigated diet-related outcomes,Footnote 18Footnote 21Footnote 24Footnote 26Footnote 27Footnote 28Footnote 33Footnote 36 eight studies investigated BMIFootnote 19Footnote 23Footnote 25Footnote 29Footnote 30Footnote 31Footnote 34Footnote 35 and one study investigated both diet-related and BMI outcomes.Footnote 32 Twelve studies examined the food environment within one city,Footnote 24Footnote 26Footnote 27Footnote 28Footnote 29Footnote 30Footnote 31Footnote 32Footnote 33Footnote 34Footnote 35Footnote 36 two in two citiesFootnote 21Footnote 23 and two in four to five cities.Footnote 18Footnote 19 One study examined the food environment across Canada.Footnote 25
All of the studies employed GIS-derived measures of the food environment. Thirteen studies included density measuresFootnote 18Footnote 19Footnote 23Footnote 24Footnote 25Footnote 28Footnote 29Footnote 30Footnote 32Footnote 33Footnote 34Footnote 35Footnote 36 (e.g. count, count per area), four included proximity measuresFootnote 32Footnote 33Footnote 34Footnote 36 (e.g. distance to nearest supermarket), two included presence measures,Footnote 26Footnote 27 and seven included relative measuresFootnote 18Footnote 19Footnote 21Footnote 23Footnote 31Footnote 32Footnote 36 (e.g. proportion of healthier outlets). Seven of the studies used a combination of these measures.Footnote 18Footnote 19Footnote 23Footnote 32Footnote 33Footnote 34Footnote 36
Data sources for food outlets and their locations were proprietary business databases (n = 10)Footnote 18Footnote 19Footnote 21Footnote 23Footnote 25Footnote 26Footnote 28Footnote 29Footnote 30Footnote 36 or municipal health or planning lists (n = 7).Footnote 24Footnote 27Footnote 31Footnote 32Footnote 33Footnote 34Footnote 35 Of the proprietary business databases, four used the 2005 Tamec Inc. Zipcom database,Footnote 21Footnote 23Footnote 28Footnote 36 two used Enhanced Points of Interest Files distributed by DMTI Spatial,Footnote 18Footnote 26 one used Infogroup Canada,Footnote 25 one used Dun & Bradstreet Canada,Footnote 19 and two studies combined multiple data sources.Footnote 29Footnote 30 Geographic units to characterize the neighbourhood food environment exposure measures consisted of buffers around participants' home addresses, postal codes or larger neighbourhood units such as census tracts or forward sortation areas. Buffer sizes ranged from 400 m to 1600 m.
Five studiesFootnote 27Footnote 29Footnote 30Footnote 34Footnote 36 implied or specified the use of an ecological model that assumes multilevel determinants of behaviour, including environmental influences. Ten studiesFootnote 18Footnote 19Footnote 21Footnote 23Footnote 24Footnote 25Footnote 26Footnote 31Footnote 33Footnote 35 implied or specified the use of an ecological model and included at least some discussion about how the food environment fits into this model. Two studiesFootnote 28Footnote 32 described and referenced a food environment–specific ecological model that has been previously established in the literature. One of these referenced the model developed by Glanz et al.,Footnote 9 distinguishing between the community nutrition environment (food outlet access) and the consumer nutrition environment (e.g. in-store food availability, food affordability and food quality) and highlighting perceptions of the food environment as a possible mediator of associations. The other considered Cohen and Farley'sFootnote 37 work on eating behaviour as a response to cues for eating in modern food environments, highlighting reward sensitivity as an important individual attribute that may encourage people to respond to unhealthy cues.
Diet quality scores
Studies that investigated associations between the food environment and diet quality scores are shown in Table 2. Participants in He et al.Footnote 33 completed the Block Kids 2004 Food Frequency Questionnaire to assess diet over the past 12 months and create modified Healthy Eating Index − 2005 scores. Participants in McInerney et al.Footnote 26 completed the online Canadian Diet History Questionnaire II for food consumed in the past 12 months and participants in Minaker et al.Footnote 32 completed diet records to obtain Healthy Eating Index scores adapted for Canada. Participants in Nash et al.Footnote 27 completed a food frequency questionnaire for the past month to obtain Diet Quality Index for Pregnancy scores, modified for Canadian dietary guidelines. Participants in Mercille et al. (2012)Footnote 21 completed a food frequency questionnaire to assess food consumption over the previous 12 months and generate "Western" and "prudent" diet scores.
| Author (year)/study/population (n) | Outcome | Exposure operationalization | Findings (CI) | Covariates | Validity of food outlet database reported? Author comments |
|---|---|---|---|---|---|
| LESS HEALTHY FOOD OUTLET EXPOSURE (Fast food restaurant [FFR], convenience store [CS], "less healthy food retail") | |||||
| Absolute measures (1/7 results are associated with continuous diet quality scores in the expected direction) | |||||
McInerney et al. (2016)Footnote 26 Pathways to Health, adults 20+ (n = 446) |
Continuous diet quality score (HEI-C) (higher is better) |
Presence of CS or multiproduct stores (yes/no) within 400 m network buffer |
β = 0.44 (−2.37, 3.25) No conclusive association was identified between the presence of a CS or multiproduct store and the diet quality score. |
Sex, age, ethnic origin, marital status, dependant at home, highest education, gross household income, smoking status, car available, dog ownership, self reported mental and physical health, hours spent sitting per day, hours spent in the neighbourhood during a typical week |
Yes (done by a secondary study in Montréal). "Montréal researchers found approximately a 77% reliability (agreement between the database and ground audit for destination existence, name, and location)." |
Minaker et al. (2013)Footnote 32 NEWPATH, adults 19+ (n = 1170) |
Continuous diet quality score (HEI-C) (higher is better) |
Distance (km) from FFR |
β = 0.84 (−1.43, 3.11)Table 2 Footnote a No conclusive association was identified between living an additional km away from a FFR and the diet quality score. |
Age, education level, household income, household car ownership |
No. "Follow up direct observation was employed to ensure accuracy." |
Distance (km) from CS |
β = 2.06 (−0.49, 4.61)Table 2 Footnote a No conclusive association was identified between living an additional km away from a CS and the diet quality score. |
||||
Nash et al. (2013)Footnote 27 Prenatal Health Project, pregnant women (n = 2086) |
Canadian Diet Quality Index for Pregnancy (higher is better) |
Presence of FFR (yes/no) within 500 m of home |
β = −1.26, p < .09 No conclusive association was identified between the presence of a FFR and the diet quality score. |
Residency in Canada, marital status, parity, education level, nausea severity, exercise, smoking during pregnancy, anxiety, social support from family, social support from friends |
No. "Locations were previously verified by site visits and alternative directory listings, and the accuracy of the geocoding was confirmed using 30-cm resolution orthophotography." |
He et al. (2012)Footnote 33 Survey, students 11–14 (n = 632) |
Continuous diet quality score (HEI) (higher is better) |
Distance (km) from FFR |
β = 1.10 (−0.17, 2.37) No conclusive association was identified between living 1 km or more from a FFR vs. less than 1 km away and the diet quality score. |
Gender, education, neighbourhood distress scores |
No. "Validated by researchers through telephone calls, field surveys and inspection of aerial photographs, and geocoded to the building's address." |
Distance (km) from CS |
β = 1.80 (0.25, 3.35)Table 2 Footnote c Living 1 km or more from a CS vs. living less than 1 km away is associated with a 1.80 unit higher diet quality score. |
||||
Count of FFR within 1 km buffer of home |
β = 0.80 (−0.67, 2.27) No conclusive association was identified between a decrease from 3+ to 0 FFRs and the diet quality score. |
||||
Relative measures (1/3 results are associated with continuous diet quality scores in the expected direction) |
|||||
Minaker et al. (2013)Footnote 32 NEWPATH, adults 19+ (n = 1170) |
Continuous diet quality score (HEI-C) (higher is better) |
RFEI (FFR + CS / supermarkets + produce vendors) within 1 km of home |
β = −0.10 (−0.20, 0.00)Table 2 Footnote a The upper bound of the confidence interval is just above zero (before rounding), so an additional unit increase in RFEI may be associated with a 0.10 unit lower diet quality score. |
Age, education level, household income, household car ownership |
No. "Follow up direct observation was employed to ensure accuracy." |
Mercille et al. (2012)Footnote 21 VoisiNuAge, older adults 68–84 (n = 751) |
Continuous prudent diet score (higher is better) |
FFR/all restaurants within 500 m network buffer |
β = −0.96 (−1.85, −0.08)Table 2 Footnote c An increase in the percentage of restaurants that are FFRs is associated with a 0.96 unit lower prudent diet score. |
Sex, age, country of birth, marital status, education, family income, SF-36 (quality of life) Physical Component, depression, functional status, SF-36 Social Functioning, index of social support, number of children living nearby, % in area below low income cut-off, % in area speaking neither French nor English, % in area with university degree |
Yes (done by a secondary study in Montréal). "A validation study of this database indicated percentage agreement of 0.77, sensitivity of 0.84 and positive predictive value of 0.90 for food stores relative to field visits to verify or refute the presence of listed commercial outlets." |
Continuous Western diet score (lower is better) |
FFR/all restaurants within 500 m network buffer |
β = 0.10 (−0.75, 0.95) No conclusive association was identified between an increase in the percentage of restaurants that are FFRs and Western diet score. |
|||
| HEALTHIER FOOD OUTLET EXPOSURE (grocery store [GS], supermarket [S], fruit & vegetable store [FVS], "healthier food outlet") | |||||
| Absolute measures (1/3 results are associated with continuous diet quality scores in the expected direction) | |||||
McInerney et al. (2016)Footnote 26 Pathways to Health, adults 20+ (n = 446) |
Continuous diet quality score (HEI-C) (higher is better) |
Presence of S or GS (yes/no) within 400 m network buffer |
β = −0.86 (−4.50, 2.77) No conclusive association was identified between the presence of a S or GS and the diet quality score. |
Sex, age, ethnic origin, marital status, dependant at home, highest education, gross household income, smoking status, car available, dog ownership, self reported mental and physical health, hours spent sitting per day, hours spent in the neighbourhood during a typical week |
Yes (done by a secondary study in Montréal). "Montréal researchers found approximately a 77 % reliability (agreement between the database and ground audit for destination existence, name, and location)." |
Minaker et al. (2013)Footnote 32 NEWPATH, adults 19+ (n = 1170) |
Continuous diet quality score (HEI-C) (higher is better) |
Distance (km) from GS |
β = −1.46 (−2.67, −0.25)Table 2 Footnote aTable 2 Footnote c An additional km away from a GS is associated with a 1.46 unit lower diet quality score. |
Age, education level, household income, household car ownership |
No. "Follow up direct observation was employed to ensure accuracy." |
He et al. (2012)Footnote 33 Survey, students 11–14 (n = 632) |
Diet quality score (HEI) (higher is better) |
Distance (km) from S |
β = 0.16 (−1.64, 1.96) No conclusive association was identified between living in the highest compared to the lowest tertile of distance away from a S and the diet quality score. |
Gender, education, neighbourhood distress scores |
No. "Validated by researchers through telephone calls, field surveys and inspection of aerial photographs, and geocoded to the building's address." |
| Relative measures (0/2 results are associated with continuous diet quality scores in the expected direction) | |||||
Mercille et al. (2012)Footnote 21 VoisiNuAge, older adults 68–84 (n = 751) |
Continuous prudent diet score (higher is better) |
Healthy/all food stores within 500 m network buffer |
β = −0.25 (−0.96, 0.45) No conclusive association was identified between an increase in the percentage of healthy food stores and the prudent diet score. |
Sex, age, country of birth, marital status, education, family income, SF-36 Physical Component, depression, functional status, SF-36 Social Functioning, index of social support, number of children living nearby, % in area below low-income cut-off, % in area speaking neither French nor English, % in area with university degree |
Yes (done by a secondary study in Montréal). "A validation study of this database indicated percentage agreement of 0.77, sensitivity of 0.84 and positive predictive value of 0.90 for food stores relative to field visits to verify or refute the presence of listed commercial outlets." |
Continuous Western diet score (lower is better) |
Healthy/all food stores within 500 m network buffer |
β = −0.28 (−0.96, 0.41) No conclusive association was identified between an increase in the percentage of healthy food stores and the Western diet score. |
|||
| NON–FAST FOOD RESTAURANT EXPOSURE | |||||
| Absolute measures (0/2 results are associated with continuous diet quality scores) | |||||
McInerney et al. (2016)Footnote 26 Pathways to Health, adults 20+ (n = 446) |
Continuous diet quality score (HEI-C) (higher is better) |
Presence of restaurantsTable 2 Footnote b (yes/no) within 400 m network buffer |
β = −0.71 (−3.11, 1.68) No conclusive association was identified between the presence of a restaurant and the diet quality score. |
Sex, age, ethnic origin, marital status, dependant at home, highest education, gross household income, smoking status, car available, dog ownership, self reported mental and physical health, hours spent sitting per day, hours spent in the neighbourhood during a typical week |
Yes (done by a secondary study in Montréal). "Montréal researchers found approximately a 77 % reliability (agreement between the database and ground audit for destination existence, name, and location)." |
Minaker et al. (2013)Footnote 32 NEWPATH, adults 19+ (n = 1170) |
Continuous diet quality score (HEI-C) (higher is better) |
Non–fast food restaurant count within 1 km of home |
β = 0.03 (−0.03, 0.09)Table 2 Footnote a No conclusive association was identified between an additional non–fast food restaurant and the diet quality score. |
Age, education level, household income, household car ownership |
No. "Follow up direct observation was employed to ensure accuracy." |
Abbreviations: CI, confidence interval; CS, convenience store; FFR, fast food restaurant; FVS, fruit and vegetables store; GS, grocery store; HEI-C, Healthy Eating Index adapted for Canada; NEWPATH, Neighbourhood Environments in Waterloo Region: Patterns of Transportation and Health; RFEI, Retail Food Environment Index; S, supermarket; SF-36, 36-Item Short Form Health Survey.
|
|||||
Absolute measures of exposure to outlets hypothesized to be less healthy were associated with diet quality scores in the expected direction one of seven times (14%) and relative measures representing the proportion of unhealthy outlets were associated with diet quality scores in the expected direction one of three times (33%). Absolute measures of exposure to outlets hypothesized to be healthier were associated with diet quality scores in the expected direction one of three times (33%) and relative measures of exposure representing the proportion of healthier outlets were associated with diet quality scores in the expected direction zero of two times (0%). Absolute measures of exposure to non–fast food restaurants were not associated with a diet quality score in the two associations tested (0%). The results that were not associated with diet quality score outcomes in the expected direction were either inconclusive or close to being conclusive in the expected direction.
Fruit and vegetable intake
Studies that investigated associations between the food environment and fruit and vegetable intake are shown in Table 3. Clary et al.Footnote 18 and Chum et al.Footnote 24 both assessed FVI using questions that are found in the Canadian Community Health Survey Food Frequency Questionnaire. Van Hulst et al.Footnote 36 used mean values of three 24-hour dietary recalls. Clary et al.Footnote 18 transformed the results into daily consumptions to obtain a FVI variable, while Chum et al.Footnote 24 and Van HulstFootnote 36 categorized FVI into less than five or greater than or equal to five times per day.
| Author (year)/study/population (n) | Outcome | Exposure operationalization | Findings (CI) | Covariates | Validity of food outlet database reported? Author comments |
|---|---|---|---|---|---|
| LESS HEALTHY FOOD OUTLET EXPOSURE (fast food restaurant [FFR], convenience store [CS], "less healthy food retail") | |||||
| Absolute measures (1/10 results are associated with fruit and vegetable intake in the expected direction) | |||||
Chum et al. (2015)Footnote 24 NEHW, adults 25−65 (n = 2411) |
Odds of eating 5 or more fruits and vegetables servings per day |
FFR count within 10 min walking distance network buffer |
OR = 1.08 (0.73, 1.60) No conclusive association was identified between a decrease from 3+ to 0 FFRs and the odds of eating 5 or more fruits and vegetables per day. |
Gender, age, education, self-rated health, marital status, visible minority status, family income |
No. |
FFR count within 15 min walking distance network buffer |
OR = 1.13 (0.67, 1.93) No conclusive association was identified between a decrease from 3+ to 0 FFRs and the odds of eating 5 or more fruits and vegetables per day. |
||||
Less healthy food outlet count within 10 min walking distance network buffer |
OR = 1.05 (0.71, 1.54) No conclusive association was identified between a decrease from 3+ to 0 less healthy food outlets and the odds of eating 5 or more fruits and vegetables per day. |
||||
Less healthy food outlet count within 15 min walking distance network buffer |
OR = 1.05 (0.71, 1.54) No conclusive association was identified between a decrease from 3+ to 0 less healthy food outlets and the odds of eating 5 or more fruits and vegetables per day. |
||||
Clary et al. (2015)Footnote 18 2007, 2008, 2009, 2010 CCHS 18+ (n = 49 403) |
Fruit and vegetable (portions per day) |
FFR kernel density linked with home postal code |
β = −0.04 (−0.06, −0.02)Table 3 Footnote a An additional FFR per km2 was associated with a 0.04 decrease in the portions of fruits and vegetables consumed per day. |
Gender, age, education level, marital status, ethnic origin, household size adjusted income, CMA of residence, neighbourhood material and social deprivations, and overall outlet density |
Yes (done by a secondary study in Montréal). "Representativity of the dataset, that is, concordance between outlets present on the EPOI list and outlets observed on the field was 77.7% when relaxing on business names, small imprecisions in location (i.e. within the same census tract), and when compensating false negatives with false positives within the same outlet category and census tract." |
Sum of less healthy outlets (FFR + CS) kernel density linked with home postal code |
β = −0.01 (−0.03, 0.01) No conclusive association was identified between an additional less healthy outlet per km2 and the portions of fruits and vegetables consumed per day. |
||||
Van Hulst et al. (2012)Footnote 36 QUALITY, children Grades 2–5 (n = 498) |
Odds of eating 5 or more fruits and vegetables per day |
Distance (m) away from a FFR |
OR = 1.39 (0.81, 2.40) No conclusive association was identified between living the farthest vs. the shortest distance away from a FFR and the odds of eating 5 or more fruits and vegetables per day. |
Child's age and sex, mother's BMI, highest parental education attainment, total household income (adjusted for number of people in household) |
Yes (done by a secondary study in Montréal). "A validity study of food establishments from this list, verified by onsite field visits, showed good agreement (0.77), sensitivity (0.84) and positive predictive value (0.90)." |
Distance (m) away from a CS |
OR = 0.99 (0.57, 1.72) No conclusive association was identified between living the farthest vs. the shortest distance away from a CS and the odds of eating 5 or more fruits and vegetables per day. |
||||
Kernel FFR density within 1 km street buffer of home |
OR = 1.22 (0.68, 2.22) No conclusive association was identified between a decrease from the highest to the lowest tertile of FFR density and the odds of eating 5 or more fruits and vegetables per day. |
||||
Kernel CS density within 1 km street buffer of home |
OR = 1.02 (0.55, 1.91) No conclusive association was identified between a decrease from the highest to the lowest tertile of CS density and the odds of eating 5 or more fruits and vegetables per day. |
||||
| Relative measures (0/1 results are associated with fruit and vegetable intake in the expected direction) | |||||
Van Hulst et al. (2012)Footnote 36 QUALITY, children Grades 2–5 (n = 498) |
Odds of eating 5 or more fruits and vegetables per day |
RFEI (FFR + CS / S + specialty food stores) within 1 km of home |
OR = 0.90 (0.58, 1.42) No conclusive association was identified between a RFEI score greater or equal to the approximate 75th percentile versus a RFEI score less than the approximate 75th percentile and the odds of eating 5 or more fruits and vegetables per day. |
Child's age and sex, mother's BMI, highest parental education attainment, total household income (adjusted for number of people in household) |
Yes (done by a secondary study in Montréal). "A validity study of food establishments from this list, verified by onsite field visits, showed good agreement (0.77), sensitivity (0.84) and positive predictive value (0.90)." |
| HEALTHIER FOOD OUTLET EXPOSURE (grocery store [GS], supermarket [S], fruit & vegetable store [FVS], "healthier food outlet") | |||||
| Absolute measures (1/7 results are associated with fruit and vegetable intake in the expected direction) | |||||
Chum et al. (2015)Footnote 24 NEHW, adults 25–65 (n = 2411) |
Odds of eating 5 or more fruits and vegetables per day |
Healthier outlet count within 10 min walking distance network buffer |
OR = 1.25 (0.80, 1.96) No conclusive association was identified between an increase from 0 to 3+ healthier outlets and the odds of eating 5 or more fruits and vegetables per day. |
Gender, age, education, self-rated health, marital status, visible minority status, family income |
No. |
Healthier outlet count within 15 min walking distance network buffer |
OR = 1.18 (0.94, 1.50) No conclusive association was identified between an increase from 0 to 3+ healthier outlets and the odds of eating 5 or more fruits and vegetables per day. |
||||
Clary et al. (2015)Footnote 18 2007, 2008, 2009, 2010 CCHS 18+ (n = 49 403) |
Fruit and vegetable (servings per day) |
S kernel density linked with home postal code |
β = 0.12 (−0.01, 0.25) The lower bound of the confidence interval is just below zero, so an additional S per km2 may be associated with a 0.122 increase in servings of fruits and vegetables per day. |
Gender, age, education level, marital status, ethnic origin, household size adjusted income, CMA of residence, neighbourhood material and social deprivations, and overall outlet density |
Yes (by a secondary study in Montréal). "Representativity of the dataset, that is, concordance between outlets present on the EPOI list and outlets observed on the field was 77.7% when relaxing on business names, small imprecisions in location (i.e. within the same census tract), and when compensating false negatives with false positives within the same outlet category and census tract." |
FVS kernel density linked with home postal code |
β = 0.03 (0.00, 0.05), p < .05Table 3 Footnote a An additional FVS per km2 was associated with a 0.03 increase in servings of fruits and vegetables consumed per day. |
||||
Sum of healthier outlets (S + FVS + GS + natural food store) kernel density linked with home postal code |
β = 0.01 (0.00, 0.03) No conclusive association was identified between an additional healthier outlet per km2 and the servings of fruits and vegetables consumed per day. |
||||
Van Hulst et al. (2012)Footnote 36 QUALITY, children Grades 2–5 (n = 498) |
Odds of eating 5 or more fruits and vegetables per day |
Distance (m) away from a S |
OR = 1.09 (0.62, 1.91) No conclusive association was identified between living the farthest vs. the shortest distance away from a S and the odds of eating 5 or more fruits and vegetables per day. |
Child's age and sex, mother's BMI, highest parental education attainment, total household income (adjusted for number of people in household) |
Yes (done by a secondary study in Montréal). "A validity study of food establishments from this list, verified by onsite field visits, showed good agreement (0.77), sensitivity (0.84) and positive predictive value (0.90)." |
Kernel S density within 1 km street buffer of home |
OR = 1.11 (0.63, 1.93) No conclusive association was identified between a decrease from the highest to the lowest tertile of S density and the odds of eating 5 or more fruits and vegetables per day. |
||||
| Relative measures (1/1 results are associated with fruit and vegetable intake in the expected direction) | |||||
Clary et al. (2015)Footnote 18 2007, 2008, 2009, 2010 CCHS 18+ (n = 49 403) |
Fruit and vegetable (portions per day) |
Healthier/healthier + less healthy stores linked with home postal code |
β = 0.01 (0.00, 0.01), p < .001Table 3 Footnote a A unit increase in the proportion of healthy food stores is associated with a 0.01 increase in the portions of fruits and vegetables consumed per day. |
Gender, age, education level, marital status, ethnic origin, household size adjusted income, CMA of residence, neighbourhood material and social deprivations, and overall outlet density |
Yes (done by a secondary study in Montréal). "Representativity of the dataset, that is, concordance between outlets present on the EPOI list and outlets observed on the field was 77.7% when relaxing on business names, small imprecisions in location (i.e. within the same census tract), and when compensating false negatives with false positives within the same outlet category and census tract." |
Abbreviations: CCHS, Canadian Community Health Survey; CI, confidence interval; CMA, census metropolitan area; CS, convenience store; EPOI, Enhanced Points of Interest; FFR, fast food restaurant; FVS, fruit and vegetables store; GS, grocery store; NEHW, Neighbourhood Effects on Health and Well-being; OR, odds ratio; QUALITY, Quebec Adipose and Lifestyle Investigation in Youth; RFEI, Retail Food Environment Index; S, supermarket.
|
|||||
Absolute measures of exposure to outlets hypothesized to be less healthy were associated with FVI in the expected direction one out of ten times (10%) and relative measures of exposure representing the proportion of less healthy outlets were not associated with FVI in the lone study that tested this association (0%). Absolute measures of exposure to outlets hypothesized to be healthier were associated with FVI in the expected direction one out of seven times (14%) and relative measures of exposure representing the proportion of healthier outlets were associated with FVI in the expected direction in the lone study that assessed this association (100%). The results that were not associated with FVI outcomes in the expected direction were either inconclusive or close to being conclusive in the expected direction.
Fast food consumption
Studies that investigated associations between the food environment and fast food consumption are shown in Table 4. Participants in Paquet et al.Footnote 28 reported the number of times they had visited a fast food restaurant in their neighbourhood in the previous seven days, and results were dichotomized as one or more visits or no visits. Participants in Van Hulst et al.Footnote 36 reported if they had consumed delivery or take-out food in the previous week. Absolute measures of exposure to outlets hypothesized to be less healthy were not associated with fast food consumption in the five associations tested (0%) and relative measures of exposure representing the proportion of less healthy outlets were not associated with fast food consumption in the lone study that tested this association (0%). Absolute measures of exposure to outlets hypothesized to be healthier were not associated with fast food consumption in the two associations tested (0%). All of the results were inconclusive.
| Author (year)/study/population (n) | Outcome | Exposure operationalization | Findings (CI) | Covariates | Validity of food outlet database reported? Author comments |
|---|---|---|---|---|---|
| LESS HEALTHY FOOD OUTLET EXPOSURE (fast food restaurant [FFR], convenience store [CS], "less healthy food retail") | |||||
| Absolute measures (0/5 results are associated with fast food consumption in the expected direction) | |||||
Paquet et al. (2010)Footnote 28 MNSLH, adults 18–55 (n = 415) |
Odds of having consumed fast food in the past 7 days (self-reported) |
FFR count within 500 m circular buffer |
OR = 0.92 (0.80, 1.05) No conclusive association was identified between an additional FFR and the odds of having consumed fast food in the past 7 days. |
Age, sex, education, household income |
Yes (done by a secondary study in Montréal). "A validation study of this commercial database in the Montréal CMA showed that it was valid in terms of the likelihood that a listed establishment was present in the field (positive predictive value = 0.90) and that a food establishment present in the field was correctly listed in the database (sensitivity = 0.84)." |
Van Hulst et al. (2012)Footnote 36 QUALITY, children Grades 2–5 (n = 506) |
Odds of eating delivery or takeout in the past week |
Distance (m) away from a FFR |
OR = 1.03 (0.61, 1.73) No conclusive association was identified between living the farthest vs. the shortest distance away from a FFR and the odds of eating delivery or takeout in the past week. |
Child's age and sex, mother's BMI, highest parental education attainment, total household income (adjusted for number of people in household) |
Yes (done by a secondary study in Montréal). "A validity study of food establishments from this list, verified by onsite field visits, showed good agreement (0.77), sensitivity (0.84) and positive predictive value (0.90)." |
Distance (m) away from a CS |
OR = 0.93 (0.55, 1.56) No conclusive association was identified between living the farthest vs. the shortest distance away from a CS and the odds of eating delivery or takeout in the past week. |
||||
Kernel FFR density within 1 km street buffer of home |
OR = 1.11 (0.63, 1.98) No conclusive association was identified between a decrease from the highest to the lowest tertile of FFR density and the odds of eating delivery or takeout in the past week. |
||||
Kernel CS density within 1 km street buffer of home |
OR = 0.93 (0.51, 1.70) No conclusive association was identified between a decrease from the highest to the lowest tertile of CS density and the odds of eating delivery or takeout in the past week. |
||||
| Relative measures (0/1 results are associated with fast food consumption in the expected direction) | |||||
Van Hulst et al. (2012)Footnote 36 QUALITY, children Grades 2–5 (n = 506) |
Odds of eating delivery or takeout in the past week |
RFEI (FFR + CS / S + specialty food stores) within 1 km of home |
OR = 1.35 (0.89, 2.05) No conclusive association was identified between a RFEI score greater or equal to the approximate 75th percentile vs. a RFEI score less than the approximate 75th percentile and the odds of eating delivery or takeout in the past week. |
Child's age and sex, mother's BMI, highest parental education attainment, total household income (adjusted for number of people in household) |
Yes (done by a secondary study in Montréal). "A validity study of food establishments from this list, verified by onsite field visits, showed good agreement (0.77), sensitivity (0.84) and positive predictive value (0.90)." |
| HEALTHIER FOOD OUTLET EXPOSURE (grocery store [GS], supermarket [S], fruit and vegetable store [FVS], "healthier food outlet") | |||||
| Absolute measures (0/2 results are associated with fast food consumption in the expected direction) | |||||
Van Hulst et al. (2012)Footnote 36 QUALITY, children Grades 2–5 (n = 506) |
Odds of eating delivery or takeout in the past week |
Distance (m) away from a S |
OR = 0.96 (0.56, 1.65) No conclusive association was identified between living the farthest vs. the shortest distance away from a S and the odds of eating delivery or takeout in the past week. |
Child's age and sex, mother's BMI, highest parental education attainment, total household income (adjusted for number of people in household) |
Yes (done by a secondary study in Montréal). "A validity study of food establishments from this list, verified by onsite field visits, showed good agreement (0.77), sensitivity (0.84) and positive predictive value (0.90)." |
Kernel S density within 1 km street buffer of home |
OR = 0.91 (0.53, 1.58) No conclusive association was identified between a decrease from the highest to the lowest tertile of S density and the odds of eating delivery or takeout in the past week. |
||||
| Abbreviations: BMI, body mass index; CI, confidence interval; CMA, census metropolitan area; CS, convenience store; FFR, fast food restaurant; GS, grocery store; FVS, fruit and vegetable store; MNSLH, Montreal Neighbourhood Survey of Lifestyle and Health; OR, odds ratio; QUALITY, Quebec Adipose and Lifestyle Investigation in Youth; RFEI, Retail Food Environment Index; S, supermarket. | |||||
Body mass index (continuous and categorical overweight/obesity)
Studies that investigated associations between the food environment and body mass index are shown in Table 5. Eight studies assessed BMI using self reports and one study assessed BMI using non–self reported measurements. Absolute measures of exposure to outlets hypothesized to be less healthy were associated with BMI outcomes in the expected direction 3 of 17 times (18%) and in the unexpected direction 2 of 17 times (12%). Relative measures of exposure representing the proportion of unhealthy outlets were associated with BMI outcomes in the expected direction 4 of 6 times (67%). Absolute measures of exposure to outlets hypothesized to be healthier were associated with BMI outcomes in the expected direction 4 of 8 times (50%). Absolute measures of exposure to non–fast food restaurants were associated with more favourable BMI outcomes 6 out of 10 times (60%). The remaining results that were not associated with the BMI outcomes were mostly inconclusive or close to being conclusive in the expected direction.
| Author (year)/study/population (n) | Outcome | Exposure operationalization | Findings (CI) | Covariates | Validity of food outlet database reported? Author comments |
|---|---|---|---|---|---|
| LESS HEALTHY FOOD OUTLET EXPOSURE (fast food restaurant [FFR], convenience store [CS], "less healthy food retail") | |||||
| Absolute measures (3/17 results are associated with BMI in the expected direction) | |||||
Polsky et al., (2016)Footnote 19 2005, 2007/08, 2009/10 CCHS, adults 18+ (n = 10 199) |
Odds of obesity (BMI ≥ 30) |
FFR density within 10 min walking buffer |
OR = 1.03 (0.95, 1.12) No conclusive association was identified between a one IQR increase (between 25th and 75th percentile) in FFR per km2 and the odds of obesity. |
Age, marital status, cultural/ethnic group, immigration status, educational attainment, city of residence, survey cycle, area material deprivation, walkability |
Yes. "We were also able to validate a subset of our final restaurant list for Toronto against a contemporaneous public health inspectors' list ... and results revealed a high level of agreement (all intra-class correlation coefficients > 0.80; data not shown)." |
Continuous BMI |
β = 0.11 (−0.02, 0.24) The lower bound of the confidence interval is just below zero, so a one IQR increase (between 25th and 75th percentile) in FFR per km2 may be associated with a 0.11 kg/m2 higher BMI. |
||||
Larsen et al. (2015)Footnote 34 BEAT, Grade 5 and 6 students (n = 1035) |
Odds of overweight or obesity |
FFR density within 1 km network buffer |
OR = 0.98 (0.95, 1.00) No conclusive association was identified between an additional FFR per km2 and the odds of overweight or obesity. |
Gender, age, median household income |
No. |
Distance (km) from FFR |
OR = 1.26 (0.87, 1.83) No conclusive association was identified between an additional km away from a FFR and the odds of overweight or obesity. |
||||
Density of "less healthy food retail" within 1 km network buffer |
OR = 0.98 (0.96, 1.00) No conclusive association was identified between an additional less healthy outlet per km2 and the odds of overweight or obesity. |
||||
Distance (km) from "less healthy food retail" |
OR = 1.00 (1.00, 1.00) No association was identified between an additional km away from a less healthy outlet and the odds of overweight or obesity. |
||||
Hollands et al. (2014)Footnote 25 2007/08 CCHS, adults 18–65 (n = 84 341) |
Continuous BMI |
FFR density within forward sortation area |
β = 0.03 (0.02, 0.05)Table 5 Footnote c An additional FFR per 10 000 people is associated with a 0.03 kg/m2 higher BMI. |
Smoking, alcohol use, physical activity, fruit and vegetable consumption, sedentary activity, immigration, ethnic origin, labour market, income, education, food security, sex, marital status, having children, urban region, province |
No. |
Minaker et al. (2013)Footnote 32 NEWPATH, adults 19+ (n = 4102) |
Continuous BMI |
Distance (km) from FFR |
β = −0.74 (−1.48, 0.01)Table 5 Footnote a The upper bound of the confidence interval is just above zero, so an additional km away from a FFR may be associated with a 0.74kg/m2 lower BMI. |
Age, education level, household income, household car ownership |
No. "Follow up direct observation was employed to ensure accuracy." |
Distance (km) from CS |
β = −0.85 (−1.63, −0.07)Table 5 Footnote aTable 5 Footnote c An additional km away from a CS is associated with a 0.85 kg/m2lower BMI. |
||||
Kestens et al. (2012)Footnote 23 2003, 2005 CCHS, adults 18+ (n = 5578) |
Odds of overweight or obesity (BMI ≥ 25) |
Kernel FFR density with adaptive bandwidth |
OR = 0.68 (0.58, 0.80)Table 5 Footnote b An increase from the lowest to the highest quartile of FFR density is associated with 32% lower odds of overweight or obesity. |
Age, gender, occupation, household type, household size, income, educational attainment |
Yes (done by a secondary study in Montréal). "An on-site ground truthing study showed good validity of the foodstore registry." |
Kernel CS density with adaptive bandwidth |
OR = 0.59 (0.49, 0.70)Table 5 Footnote b An increase from the lowest to the highest quartile of CS density is associated with 41% lower odds of overweight or obesity. |
||||
Prince et al. (2012)Footnote 30 2000/01, 2003, 2005, 2007 CCHS, adults 18+ (n = 4727) |
Odds of overweight or obesity (BMI ≥ 25) |
FFR density within neighbourhood (most neighbourhoods ≥ 4000 people) |
OR = 1.31 (1.11, 1.52)Table 5 Footnote aTable 5 Footnote c An additional FFR per 1000 people is associated with 31% higher odds of overweight or obesity. |
Age, education, household income, smoking status, season of data collection, leisure-time physical activity |
No (some outlets verified but dataset not validated). |
CS density within neighbourhood (most neighbourhoods ≥ 4000 people) |
OR = 1.03 (0.94, 1.12)Table 5 Footnote a No conclusive association was identified between an additional CS per 1000 people and the odds of overweight or obesity. |
||||
Gilliland et al. (2012)Footnote 35 Survey, students aged 10–14 (n = 891) |
Age-specific BMI z-score |
FFR count within 500 m network buffer around home |
β = 0.01 (−0.23, 0.25) No conclusive association was identified between an additional FFR and age specific BMI z-score. |
Age, sex |
Yes. "To 'ground truth' the database, trained research assistants performed on-site environmental audits within a 1000 m buffer around six of the sample schools during the same period as the surveys and confirmed 100% accuracy of the database." |
CS count within 500 m network buffer around home |
β = 0.19 (−0.05, 0.43) The lower bound of the confidence interval is just below zero, so an additional CS may be associated with a 0.19kg/m2 higher age-specific BMI z-score. |
||||
Prince et al. (2011)Footnote 29 ONS, adults 18+ (n = 5025) |
Odds of overweight or obesity (BMI ≥ 25) |
FFR density within neighbourhood (most neighbourhoods > 4000 people) |
OR = 1.09 (0.97, 1.23)Table 5 Footnote a The lower bound of the confidence interval is just below one, so an additional FFR per 1000 people may be associated with 9% higher odds of overweight or obesity. |
Age, education, household income, smoking status, season of collection |
No (some outlets verified but dataset not validated). |
CS density within neighbourhood (most neighbourhoods > 4000 people) |
OR = 1.17 (0.87, 1.57)Table 5 Footnote a No conclusive association was identified between an additional CS per 1000 people and the odds of overweight or obesity. |
||||
| Relative measures (4/6 results are associated with BMI in the expected direction) | |||||
Polsky et al. (2016)Footnote 19 2005, 2007/08, 2009/10 CCHS, adults 18+ (n = 10 199) |
Odds of obesity (BMI ≥ 30) |
FFR/all restaurants within 10 min walking buffer |
OR = 1.15 (1.02, 1.29)Table 5 Footnote c A one IQR increase (between 25th and 75th percentile) in the proportion of FFRs of all restaurants is associated with 15% higher odds of obesity. |
Age, marital status, cultural/ethnic group, immigration status, educational attainment, city of residence, survey cycle, area material deprivation, walkability |
Yes. "We were also able to validate a subset of our final restaurant list for Toronto against a contemporaneous public health inspectors' list ... and results revealed a high level of agreement (all intra-class correlation coefficients > 0.80; data not shown)." |
Continuous BMI |
β = 0.21 (0.00, 0.41), p < .05Table 5 Footnote c A one IQR increase (between 25th and 75th percentile) in the proportion of FFRs of all restaurants is associated with a 0.21 kg/m2 higher BMI. |
||||
Minaker et al. (2013)Footnote 32 NEWPATH, adults 19+ (n = 4102) |
Continuous BMI |
RFEI (FFR + CS / S + produce vendors) within 1 km of home |
β = 0.06 (0.00, 0.11)Table 5 Footnote a The lower bound of the confidence interval is just below zero (before rounding), so an additional unit increase in RFEI may be associated with a 0.06 kg/m2 higher BMI. |
Age, education level, household income, household car ownership |
No. "Follow up direct observation was employed to ensure accuracy." |
Kestens et al. (2012)Footnote 23 2003, 2005 CCHS, adults 18+ (n = 5578) |
Odds of overweight or obesity (BMI ≥ 25) |
FFR/all restaurants with adaptive bandwidth |
OR = 1.44 (1.21, 1.73)Table 5 Footnote bTable 5 Footnote c An increase from the lowest to the highest quartile of proportion of FFR is associated with 44% higher odds of overweight or obesity. |
Age, gender, occupation, household type, household size, income, educational attainment |
Yes (done by a secondary study in Montréal). "An on-site ground truthing study showed good validity of the foodstore registry." |
Spence et al. (2009)Footnote 31 PHS-2002, adults 18+ (n = 2900) |
Odds of obesity (BMI ≥ 30) |
RFEI (FFR + CS/GS) within 800 m buffer |
OR = 0.74 (0.59, 0.94)Table 5 Footnote c A RFEI score in the lowest category vs. the highest category is associated with 26% lower odds of obesity. |
Age, sex, education level, neighbourhood SES |
No. |
RFEI (FFR + CS/GS) within 1600 m buffer |
OR = 0.85 (0.66, 1.10) No conclusive association was identified between the lowest category of RFEI score vs. the highest category and the odds of obesity. |
||||
| HEALTHIER FOOD OUTLET EXPOSURE (grocery store [GS], supermarket [S], fruit and vegetable store [FVS], "healthier food outlet") | |||||
| Absolute measures (4/8 results are associated with BMI in the expected direction) | |||||
Larsen et al. (2015)Footnote 34 Project BEAT, Grade 5 and 6 students (n = 1035) |
Odds of overweight or obesity |
GS + S density within 1 km network buffer |
OR = 1.05 (0.91, 1.12) No conclusive association was identified between an additional GS or S per km2 and the odds of overweight or obesity. |
Gender, age, median area household income |
No. |
Distance (km) from GS + S |
OR = 1.48 (1.06, 2.06)Table 5 Footnote c An additional km away from an outlet is associated with 48% higher odds of overweight or obesity. |
||||
Density of "healthier food outlets" within 1 km network buffer |
OR = 0.90 (0.85, 0.96)Table 5 Footnote c An additional healthier outlet per km2 is associated with 10% lower odds of overweight or obesity. |
||||
Distance (km) to nearest "healthier food outlet" |
OR = 0.98 (0.74, 1.30) No conclusive association was identified between an additional km away from a healthier outlet and the odds of overweight or obesity. |
||||
Minaker et al. (2013)Footnote 32 NEWPATH, adults 19+ (n = 4102) |
Continuous BMI |
Distance (km) from GS + S |
β = 0.39 (0.05, 0.73)Table 5 Footnote aTable 5 Footnote c An additional km away from an outlet is associated with a 0.39 kg/m2 increase in BMI. |
Age, education level, household income, household car ownership |
No. "Follow up direct observation was employed to ensure accuracy." |
Kestens et al. (2012)Footnote 23 2003, 2005 CCHS, adults 18+ (n = 5578) |
Odds of overweight or obesity (BMI ≥ 25) |
Kernel FVS + S density with adaptive bandwidth |
OR = 0.68 (0.58, 0.79)Table 5 Footnote bTable 5 Footnote c An increase from the lowest to the highest quartile of FVS or S density is associated with 32% lower odds of overweight or obesity. |
Age, gender, occupation, household type, household size, income, educational attainment |
Yes (done by a secondary study in Montréal). "An on-site ground truthing study showed good validity of the foodstore registry." |
Prince et al. (2012)Footnote 30 2000/01, 2003, 2005, 2007 CCHS, adults 18+ (n = 4727) |
Odds of overweight or obesity (BMI ≥ 25) |
GS + S density within neighbourhood |
OR = 1.00 (0.90, 1.11)Table 5 Footnote a No conclusive association was identified between an additional GS or S per 1000 people and odds of overweight or obesity. |
Age, education, household income, smoking status, season of data collection, leisure-time physical activity |
No (some outlets verified but dataset not validated). |
Prince et al. (2011)Footnote 29 ONS, adults 18+ (n = 5025) |
Odds of overweight or obesity (BMI ≥ 25) |
GS + S density within neighbourhood |
OR = 1.29 (0.66, 2.54)Table 5 Footnote a No conclusive association was identified between an additional GS or S per 1000 people and odds of overweight or obesity. |
Age, education, household income, smoking status, season of collection |
No (some outlets verified but dataset not validated). |
| NON–FAST FOOD RESTAURANT EXPOSURE | |||||
| Absolute measures (6/10 results are associated with a BMI outcome) | |||||
Polsky et al. (2016)Footnote 19 2005, 2007/08, 2009/10 CCHS, adults 18+ (n = 10 199) |
Odds of obesity (BMI ≥ 30) |
Density of full-service restaurants within 10 min walking buffer |
OR = 0.97 (0.90, 1.04) No conclusive association was identified between a one IQR increase (between 25th and 75th percentile) in full-service restaurant density and the odds of obesity. |
Age, marital status, cultural/ethnic group, immigration status, educational attainment, city of residence, survey cycle, area material deprivation, walkability |
Yes. "We were also able to validate a subset of our final restaurant list for Toronto against a contemporaneous public health inspectors' list ... and results revealed a high level of agreement (all intra-class correlation coefficients > 0.80; data not shown)." |
Continuous BMI |
β = 0.01 (−0.12, 0.13) No conclusive association was identified between a one IQR increase (between 25th and 75th percentile) in full-service restaurant density and BMI. |
||||
Odds of obesity (BMI ≥ 30) |
Density of other restaurants (e.g. café, coffee shop, snack shop) within 10 min walking buffer |
OR = 0.97 (0.91, 1.05) No conclusive association was identified between a one IQR increase (between 25th and 75th percentile) in other restaurant density and the odds of obesity. |
|||
Continuous BMI |
β = 0.02 (−0.10, 0.13) No conclusive association was identified between a one IQR increase (between 25th and 75th percentile) in other restaurant density and the odds of obesity. |
||||
Hollands et al. (2014)Footnote 25 2007/08 CCHS, adults 18–65 (n = 84 341) |
Continuous BMI |
Full-service restaurant density within forward sortation area |
β = −0.06 (−0.11, −0.01)Table 5 Footnote c An additional full-service chain restaurant per 10 000 people is associated with a 0.06 kg/m2 decrease in BMI. |
Smoking, alcohol use, physical activity, fruit and vegetable consumption, sedentary activity, immigration, ethnic origin, labour market, income, education, food security, sex, marital status, having children, urban region, province |
No. |
Other-service restaurant density within forward sortation area |
β = −0.01 (−0.02, −0.01)Table 5 Footnote c An additional other non-chain restaurant per 10 000 people is associated with a 0.01 kg/m2 decrease in BMI. |
||||
Minaker et al. (2013)Footnote 32 NEWPATH, adults 19+ (n = 4102) |
Continuous BMI |
Restaurant count within 1 km circular buffer |
β = −0.03 (−0.05, −0.01)Table 5 Footnote aTable 5 Footnote c An additional restaurant within a 1 km radius from home is associated with a 0.03 kg/m2 decrease in BMI. |
Age, education level, household income, household car ownership |
No. "Follow up direct observation was employed to ensure accuracy." |
Kestens et al. (2012)Footnote 23 2003, 2005 CCHS, adults 18+ (n = 5578) |
Odds of overweight or obesity (BMI ≥ 25) |
Kernel full-service restaurant density with adaptive bandwidth |
OR = 0.62 (0.53, 0.72)Table 5 Footnote bTable 5 Footnote c An increase from the lowest to the highest quartile of full-service restaurant density is associated with 38% lower odds of overweight or obesity. |
Age, gender, occupation, household type, household size, income, educational attainment |
Yes (done by a secondary study in Montréal). "An on-site ground truthing study showed good validity of the foodstore registry." |
Prince et al. (2012)Footnote 30 2000/01, 2003, 2005, 2007 CCHS, adults 18+ (n = 4727) |
Odds of overweight or obesity (BMI ≥ 25) |
Full-service restaurant density within neighbourhood |
OR = 0.77 (0.61, 0.98)Table 5 Footnote aTable 5 Footnote c An additional full-service restaurant per 1000 people is associated with 23% lower odds of overweight or obesity. |
Age, education, household income, smoking status, season of data collection, leisure-time physical activity |
No (some outlets verified but dataset not validated). |
Prince et al. (2011)Footnote 29 ONS, adults 18+ (n = 5025) |
Odds of overweight or obesity (BMI ≥ 25) |
Full-service restaurant density within neighbourhood |
OR = 0.74 (0.63, 0.88)Table 5 Footnote aTable 5 Footnote c An additional full-service restaurant per 1000 people is associated with 26% lower odds of overweight or obesity. |
Age, education, household income, smoking status, season of collection |
No (some outlets verified but dataset not validated). |
Abbreviations: BEAT, Built Environment and Active Transport; BMI, body mass index; CCHS, Canadian Community Health Survey; CI, confidence interval; CS, convenience store; FFR, fast food restaurant; FVS, fruit and vegetables store; GS, grocery store; IQR, interquartile range; NEWPATH, Neighbourhood Environments in Waterloo Region: Patterns of Transportation and Health; ONS, Ottawa Neighbourhood Study; OR, odds ratio; PHS-2002, Population Health Survey 2002; RFEI, Retail Food Environment Index; S, supermarket; SES, socioeconomic status.
|
|||||
Absolute versus relative measures of the retail food environment
For the diet outcomes, associations with absolute measures were found to be in the expected direction 12% of the time (4/34) and associations with relative measures were found to be in the expected direction 25% of the time (2/8). For the BMI outcomes, associations with absolute measures went in the expected direction 28% of the time (7/25) and associations with relative measures went in the expected direction 67% of the time (4/6). Across all of the outcomes, associations with absolute measures were found to be in the expected direction 19% of the time (11/59) and associations with relative measures were found to be in the expected direction 43% of the time (6/14).
Study quality
All of the studies were cross-sectional, which limited our ability to draw causal conclusions. The vast majority of studiesFootnote 19Footnote 23Footnote 25Footnote 29Footnote 30Footnote 31Footnote 32Footnote 35 (89%) investigating BMI relied on self-reported heights and weights. Self-reporting of height and weight can be an efficient approach when large datasets are used and corrections for misreporting are taken into consideration.Footnote 38 Nine studiesFootnote 24Footnote 25Footnote 27Footnote 29Footnote 30Footnote 31Footnote 32Footnote 33Footnote 34 (53%) did not report how well the retail food data represented actual food outlets present in the field. Of the eight studies reporting validation results, one studyFootnote 35 performed street audits on a small subset of their dataset and determined 100% accuracy; six studiesFootnote 18Footnote 21Footnote 23Footnote 26Footnote 28Footnote 36 referenced secondary validation studies and reported moderate to substantial validity, and one studyFootnote 19 validated a subset of retail food outlets against a public health inspectors' list and determined a high level of agreement.
Discussion
This study was motivated by the desire to systematically examine the body of evidence on the role of food environments in diet quality and BMI-related outcomes for Canadians. Heterogeneity in the exposure measurement and the ascertainment of outcomes made comparing effect sizes difficult; we focussed on the general trends of the associations for what are thought to be less healthy retail outlets, healthier retail outlets and restaurants with diet quality and BMI-related outcomes. Overall, this body of literature is characterized by a large number of inconclusive results. We found limited evidence supporting the hypothesis that the food environment influences diet quality. The percent of associations that went in an expected direction were below 33% for all but one of the exposure categories and diet quality outcomes. The one association that tested the relationship between a relative measure (proportion of healthier outlets) and FVI went in the expected direction.
Absolute measures of exposure to outlets hypothesized to be healthier were associated with BMI in the expected direction 50% of the time, relative measures of exposure representing the proportion of unhealthy outlets were associated with BMI in the expected direction 67% of the time, and absolute measures of non–fast food restaurant exposure were associated with a more favourable BMI profile 60% of the time. The associations that were not in the expected direction were either inconclusive or close to being conclusive in an expected direction and do not preclude the possibility of an association. Given that some studies might have been able to make conclusive statements if they had had a larger sample size, the percentages of the associations that we tallied as conclusive in the expected direction may be conservative.
In contrast, absolute measures of exposure to outlets thought to be less healthy were associated with BMI in the expected direction only 18% of the time and, counterintuitively, Kestens et al.Footnote 23 found higher absolute densities of fast food outlets and corner stores to be protective for BMI. This may be because areas with a high density of restaurants and retail are generally more walkableFootnote 19Footnote 39 and these areas may also have a higher density of healthier outlets, attenuating or outweighing potentially harmful effects of fast food and convenience outlets.
One interpretation of the predominately inconclusive relationship between food environment and exposure and diet is that no real association exists. Another is that associations may exist for some subpopulations, such as those with low income or limited mobility, but were diluted by looking at broader populations. We suspect that the inconclusive relationship is mainly a result of the difficulty in accurately ascertaining diet quality through self-reported dietary assessments. In studies using self-reported instruments such as food records and food frequency questionnaires, the error in estimated dietary intake is often substantial and likely larger than other exposures and outcomes commonly investigated in epidemiological studies.Footnote 40 Errors can arise in different ways, including recall bias, social desirability bias, interviewer bias, day-to-day variability in diet and inaccurate translation of self-reported statements into specific nutrient amounts.Footnote 40Footnote 41 The implications of these errors are often an attenuation of the effect size, a loss of statistical power and false negative results.Footnote 40 A systematic review of dietary assessment in food environment research concluded that studies that used higher-quality instruments, such as 24-hour dietary recalls or food diaries, showed more consistent associations with food environment exposures in the expected direction than studies that used brief instruments, such as dietary screeners.Footnote 42 We are now in a new era when the digitization of food is possible through photographs and barcode scanning; creative new approaches to ascertaining diet quality are an interesting avenue for future research.
We identified stronger evidence for a food environment–BMI relationship. This finding may speak to a more accurate ascertainment of the outcome when compared against diet quality assessment. Even self-reported BMI, which suffers from reporting bias,Footnote 43 is relatively easy to understand, easy to measure, does not vary greatly day-to-day and is easier to remember than diet.
Relative measures of the food environment consistently outperformed absolute measures. The association between relative measures of the food environment, BMI and diet quality were found to be in the expected direction 43% of the time versus 19% of the time for absolute measures. Our findings align with a review from the United States that also found that relative food environment measures were more consistently associated with health-related outcomes than absolute measures of food outlets.Footnote 13 Relative measures may provide a better conceptualization of the food environment because they consider the competitive food outlet choices that people face.Footnote 18 As an illustration, consider that two neighbourhoods may have the same absolute density of grocery stores; however, if one of the neighbourhoods is swamped with fast food outlets and the other has none, the food environment realities will be very different. A relative measure of the proportion of healthy outlets would capture the difference.Footnote 21
All of the studies were cross-sectional, making causal inference difficult. Self-selection of healthy individuals into neighbourhoods with healthy food environments was not included in our quality filter because studies tend not to account for it. Past research in the built environment–health domain has shown that selection bias, when measured, is not a major driver of associations.Footnote 44 Most studies adjusted for SES at the individual level rather than at the area level, which reduces residual confounding. Twelve studies investigated the food environment within only one city. This can be an issue if the limited geographic regions under investigation lead to a lack of variability in the food environment exposure, which may in turn attenuate or mask true associations. While it was not informative to compare studies with self-reported height and weight to the one study with measured height and weight because the population was specific (grade school children) and methodologies differed, it is established in the literature that self-report introduces bias—men and women underestimate their corresponding BMI.Footnote 43 Underreporting without proper correction would bias the results towards the null.
More than half of the studies did not report the validity of the food outlet dataset that they used, and errors in databases may lead to inaccurate exposure ascertainment. There is no standard for validating food outlet datasets in the Canadian literature, which is an important issue given that the opening and closure of retail outlets can influence measures. Studies that included validation results used various techniques, and despite some evidence showing moderate to high validity, these studies were small and localized. One study performed a limited number of in-field audits; six studies referred to two secondary validation studies that took place within 12 census tracts in Montreal; and one validated a subsample of its dataset with a city's public health inspection list. The small sample sizes used for validation may not reflect the validity of the entire dataset and therefore results may not be generalizable to different places. There does not appear to be a consensus on which measures of validity to use. This lack of uniformity and the possible limited applicability, along with the paucity of studies reporting validation results mean that concerns about errors in food outlet datasets persist and a consensus "gold standard" dataset that can be used in different regions has not been identified. Larger validation studies with measures adapted to spatial exposures and food environment studies would provide better insight into which datasets are the least error prone. Representativity,Footnote 45 a novel measure that compensates false negatives with false positives within the same outlet category and geographic unit, may be a useful measure for this domain.
Most studies in our review operated under general ecological models that consider the multiple factors and contexts that are determinants of behaviour. Several of the studies incorporated the role of the food environment into these models to differing extents. Some studies appeared to be informed by established food environment models, but did not describe them in detail. One study referred to and described the conceptual model developed by Glanz et al.Footnote 9 in detail, outlining the dimensions of the food environment, and highlighting residents' perceptions of their food environment as a potential mediator of associations. Another incorporated Cohen and Farley'sFootnote 37 work, identifying cues associated with palatable food in modern food environments as drivers of food consumption, with reward sensitivity as a potential important individual attribute for responding to these cues. Generally, methodologies were similar across studies regardless of stated or unstated theoretical underpinnings. Authors that raised a particular attribute as important in their framework (e.g. residents' perceptions of their food environment, reward sensitivity, or time spent at home) did, however, tend to target it for investigation in their study.
Strengths and limitations
This is the first systematic review on the food environment and its relationship to diet quality or BMI in Canada. Strengths of this review include the synthesis of the literature by each association of interest; the calculation of 95% confidence intervals for studies that reported effect size with standard deviations or standard errors; the assessment of key quality issues identified a priori; and the comparison of absolute and relative measures of the retail food environment. The heterogeneity between the studies in exposure measurement, outcome ascertainment and study population made direct comparison between studies difficult and a meta-analysis unfeasible. To assess evidence of a relationship, we tallied the number of conclusive results for each outcome and exposure of interest; however, this does not take into account results that were almost conclusive nor does it account for the size of the effect. Additionally, certain subpopulations may experience differential effects of the neighbourhood food environment on diet or BMI; however, due to the numerous ways that analyses were stratified across the studies, we were not able to take these into account and synthesize the body of literature with clarity. Therefore, we only considered the pooled results. Finally, we cannot exclude the possibility of publication bias. Studies with conclusive relationships may be more likely to be published than studies with inconclusive or null results.
Conclusion
This systematic review looked at pooled results of 17 studies and found limited evidence supporting the hypothesis that the food environment influences diet quality. It may be difficult to show a food environment–diet relationship using commonly used self-reported dietary assessment tools because of problems with error and bias. The review identified stronger evidence for a relationship between the food environment and BMI. While there was wide heterogeneity in measurements used to characterize the food environment, it appears that relative measures perform better than absolute measures. Large-scale studies with wide geographic coverage using innovative diet assessment tools, measured BMI and other clinical markers of cardiometabolic health, together with GIS-based relative measures of the retail food environment and a gold standard dataset of food outlets, would advance our knowledge of the role of the food environment in shaping the health of Canadians.
Acknowledgements
NAR was supported by the Canada Research Chairs Program. KD was supported by a Senior Clinician Scientist career award from the Fonds de recherche du Québec – Santé (FRQS).
Conflicts of interest
The authors have no conflicts of interest to declare.
Authors' contributions and statement
ACS, AB, KD, and NAR were all involved in the study design, the analysis and interpretation of the data, the drafting and revising of the paper and the approval of the final manuscript for submission. ACS and AB reviewed the titles and abstracts of articles identified in the systematic search.
The content and views expressed in this article are those of the authors and do not necessarily reflect those of the Government of Canada.
References
- Footnote 1
-
Garriguet D. Overview of Canadians' eating habits, 2004. Ottawa (ON): Statistics Canada [Catalogue No. 82-620-MIE, No. 2]; 2006. 47 p.
- Footnote 2
-
Garriguet D. Canadians' eating habits. Health Rep. 2007;18(2):17-32.
- Footnote 3
-
Health Canada. Do Canadian adults meet their nutrient requirements through food intake alone? Ottawa (ON): Government of Canada; 2012. [Catalogue. No.: H164-112/3-2012E-PDF].
- Footnote 4
-
Caraher M, Coveney J. Public health nutrition and food policy. Public Health Nutr. 2004;7(5):591-8.
- Footnote 5
-
Imamura F, Micha R, Khatibzadeh S, et al. Dietary quality among men and women in 187 countries in 1990 and 2010: a systematic assessment. Lancet Glob Health. 2015;3(3):e132-e142.
- Footnote 6
-
Forouzanfar MH, Alexander L, Anderson HR, et al. Global, regional, and national comparative risk assessment of 79 behavioural, environmental and occupational, and metabolic risks or clusters of risks in 188 countries, 1990-2013: a systematic analysis for the Global Burden of Disease Study 2013. Lancet. 2015;386(10010):2287-323.
- Footnote 7
-
Statistics Canada. Health Fact Sheets—Overweight and obese adults (self-reported), 2014. Ottawa (ON): Statistics Canada; 2015 [Catalogue No.: 82-625-X].
- Footnote 8
-
Canadian Diabetes Association (CDA). 2015 Report on diabetes: driving change. Toronto (ON): Canadian Diabetes Association; 2015.
- Footnote 9
-
Glanz K, Sallis JF, Saelens BE, et al. Healthy nutrition environments: concepts and measures. Am J Health Promot. 2005;19(5):330-3.
- Footnote 10
-
Arksey H, O'Malley L. Scoping studies: towards a methodological framework. Int J Soc Res Methodol. 2005;8(1):19-32.
- Footnote 11
-
Minaker LM, Shuh A, Olstad DL, et al. Retail food environments research in Canada: a scoping review. Can J Public Health. 2016;107(Suppl 1):eS4-eS13.
- Footnote 12
-
McCormack GR, Cabaj J, Orpana H, et al. A scoping review on the relations between urban form and health: a focus on Canadian quantitative evidence. Health Promot Chronic Dis Prev Can. 2019;39(5):187-200.
- Footnote 13
-
Cobb LK, Appel LJ, Franco M, et al. The relationship of the local food environment with obesity: a systematic review of methods, study quality, and results. Obesity. 2015;23(7):1331-44.
- Footnote 14
-
Caspi CE, Sorensen G, Subramanian SV, et al. The local food environment and diet: a systematic review. Health Place. 2012;18(5):1172-87.
- Footnote 15
-
Gamba RJ, Schuchter J, Rutt C, et al. Measuring the food environment and its effects on obesity in the United States: a systematic review of methods and results. J Community Health. 2015;40(3):464-75.
- Footnote 16
-
Engler-Stringer R, Le H, Gerrard A, et al. The community and consumer food environment and children's diet: a systematic review. BMC Public Health [Internet]. 2014 [cited 2017 Jun 9];14(1):522. Available from: https://bmcpublichealth.biomedcentral.com/articles/10.1186/1471-2458-14-522
- Footnote 17
-
Rahmanian E, Gasevic D, Vukmirovich I, et al. The association between the built environment and dietary intake - a systematic review. Asia Pac J Clin Nutr. 2014;23(2):183-96.
- Footnote 18
-
Clary CM, Ramos Y, Shareck M, et al. Should we use absolute or relative measures when assessing foodscape exposure in relation to fruit and vegetable intake? Evidence from a wide-scale Canadian study. Prev Med. 2015;71:83-7.
- Footnote 19
-
Polsky JY, Moineddin R, Dunn JR, et al. Absolute and relative densities of fast-food versus other restaurants in relation to weight status: does restaurant mix matter? Prev Med. 2016;82:28-34.
- Footnote 20
-
Mercille G, Richard L, Gauvin L, et al. The food environment and diet quality of urban-dwelling older women and men: assessing the moderating role of diet knowledge. Can J Public Health. 2016;107(Suppl 1):eS34-eS41.
- Footnote 21
-
Mercille G, Richard L, Gauvin L, et al. Associations between residential food environment and dietary patterns in urban-dwelling older adults: results from the VoisiNuAge study. Public Health Nutr. 2012;15(11):2026-39.
- Footnote 22
-
Lebel A, Kestens Y, Pampalon R, et al. Local context influence, activity space, and foodscape exposure in two Canadian metropolitan settings: is daily mobility exposure associated with overweight? J Obes [Internet]. 2012 [cited 2017 Jun 9];2012:912645. Available from: https://www.hindawi.com/journals/jobe/2012/912645/
- Footnote 23
-
Kestens Y, Lebel A, Chaix B, et al. Association between activity space exposure to food establishments and individual risk of overweight. PloS One [Internet]. 2012 [cited 2017 Jun 9];7(8):e41418. Available from: https://journals.plos.org/plosone/article?id=10.1371/journal.pone.0041418
- Footnote 24
-
Chum A, Farrell E, Vaivada T, et al. The effect of food environments on fruit and vegetable intake as modified by time spent at home: a cross-sectional study. BMJ Open [Internet]. 2015 [cited 2017 Jun 9];5(6):e006200. Available from: https://bmjopen.bmj.com/content/5/6/e006200.info
- Footnote 25
-
Hollands S, Campbell MK, Gilliland J, et al. Association between neighbourhood fast-food and full-service restaurant density and body mass index: a cross-sectional study of Canadian adults. Can J Public Health. 2014;105(3):e172-e178.
- Footnote 26
-
McInerney M, Csizmadi I, Friedenreich CM, et al. Associations between the neighbourhood food environment, neighbourhood socioeconomic status, and diet quality: an observational study. BMC Public Health [Internet]. 2016 [cited 2017 Jun 9];16(1):984. Available from: https://bmcpublichealth.biomedcentral.com/articles/10.1186/s12889-016-3631-7
- Footnote 27
-
Nash DM, Gilliland JA, Evers SE, et al. Determinants of diet quality in pregnancy: sociodemographic, pregnancy-specific, and food environment influences. J Nutr Educ Behav. 2013;45(6):627-34.
- Footnote 28
-
Paquet C, Daniel M, Knäuper B, et al. Interactive effects of reward sensitivity and residential fast-food restaurant exposure on fast-food consumption. Am J Clin Nutr. 2010;91(3):771-6.
- Footnote 29
-
Prince SA, Kristjansson EA, Russell K, et al. A multilevel analysis of neighbourhood built and social environments and adult self-reported physical activity and body mass index in Ottawa, Canada. Int J Environ Res Public Health. 2011;8(10):3953-78.
- Footnote 30
-
Prince SA, Kristjansson EA, Russell K, et al. Relationships between neighborhoods, physical activity, and obesity: a multilevel analysis of a large Canadian city. Obesity. 2012;20(10):2093-100.
- Footnote 31
-
Spence JC, Cutumisu N, Edwards J, et al. Relation between local food environments and obesity among adults. BMC Public Health [Internet]. 2009 [cited 2017 Jun 9];9:192. Available from: https://bmcpublichealth.biomedcentral.com/articles/10.1186/1471-2458-9-192
- Footnote 32
-
Minaker LM, Raine KD, Wild TC, et al. Objective food environments and health outcomes. Am J Prev Med. 2013;45(3):289-96.
- Footnote 33
-
He M, Tucker P, Irwin JD, et al. Obesogenic neighbourhoods: the impact of neighbourhood restaurants and convenience stores on adolescents' food consumption behaviours. Public Health Nutr. 2012;15(12):2331-9.
- Footnote 34
-
Larsen K, Cook B, Stone MR, et al. Food access and children's BMI in Toronto, Ontario: assessing how the food environment relates to overweight and obesity. Int J Public Health. 2015;60(1):69-77.
- Footnote 35
-
Gilliland JA, Rangel CY, Healy MA, et al. Linking childhood obesity to the built environment: a multi-level analysis of home and school neighbourhood factors associated with body mass index. Can J Public Health. 2012;103(9 Suppl 3):eS15-eS21.
- Footnote 36
-
Van Hulst A, Barnett TA, Gauvin L, et al. Associations between children's diets and features of their residential and school neighbourhood food environments. Can J Public Health. 2012;103(9 Suppl 3):eS48-eS54.
- Footnote 37
-
Cohen D, Farley TA. Eating as an automatic behavior. Prev Chronic Dis [Internet]. 2008 [cited 2019 May 20];5(1):A23. Available from: https://www.ncbi.nlm.nih.gov/pmc/articles/PMC2248777/
- Footnote 38
-
Dutton DJ, McLaren L. The usefulness of "corrected" body mass index vs. self-reported body mass index: comparing the population distributions, sensitivity, specificity, and predictive utility of three correction equations using Canadian population-based data. BMC Public Health [Internet]. 2014 [cited 2018 Jan 5];14:430. Available from: https://bmcpublichealth.biomedcentral.com/articles/10.1186/1471-2458-14-430
- Footnote 39
-
Glazier RH, Creatore MI, Weyman JT, et al. Density, destinations or both? A comparison of measures of walkability in relation to transportation behaviors, obesity and diabetes in Toronto, Canada. PloS One [Internet]. 2014 [cited 2018 Jan 05];9(1):e85295. Available from: https://journals.plos.org/plosone/article?id=10.1371/journal.pone.0085295
- Footnote 40
-
Freedman LS, Schatzkin A, Midthune D, et al. Dealing with dietary measurement error in nutritional cohort studies. J Natl Cancer Inst. 2011;103(14):1086-92.
- Footnote 41
-
Lachat C, Hawwash D, Ocké MC, et al. Strengthening the Reporting of Observational Studies in Epidemiology-Nutritional Epidemiology (STROBE-nut): an extension of the STROBE statement. PLoS Med [Internet]. 2016 [cited 2018 Feb 20];13(6):e1002036. Available from: https://journals.plos.org/plosmedicine/article?id=10.1371/journal.pmed.1002036
- Footnote 42
-
Kirkpatrick SI, Reedy J, Butler EN, et al. Dietary assessment in food environment research: a systematic review. Am J Prev Med. 2014;46(1):94-102.
- Footnote 43
-
Merrill RM, Richardson JS. Validity of self-reported height, weight, and body mass index: findings from the National Health and Nutrition Examination Survey, 2001-2006. Prev Chronic Dis [Internet]. 2009 [cited 2018 Jan 5];6(4):A121. Available from: https://www.ncbi.nlm.nih.gov/pmc/articles/PMC2774635/
- Footnote 44
-
Hajna S, Kestens Y, Daskalopoulou SS, et al. Neighbourhood walkability and home neighbourhood-based physical activity: an observational study of adults with type 2 diabetes. BMC Public Health [Internet]. 2016 [cited 2018 Jan 5];16:957. Available from: https://bmcpublichealth.biomedcentral.com/articles/10.1186/s12889-016-3603-y
- Footnote 45
-
Clary CM, Kestens Y. Field validation of secondary data sources: a novel measure of representativity applied to a Canadian food outlet database. Int J Behav Nutr Phys Act [Internet]. 2013 [cited 2018 Feb 15];10:77. Available from: https://ijbnpa.biomedcentral.com/articles/10.1186/1479-5868-10-77