
Original quantitative research – Identifying trajectories of alcohol use in a sample of secondary school students in Ontario and Alberta: longitudinal evidence from the COMPASS study
Health Promotion and Chronic Disease Prevention in Canada
Mahmood R. Gohari, PhD Author reference 1; Joel A. Dubin, PhD Author reference 1, Author reference 2; Richard J. Cook, PhD Author reference 2; Scott T. Leatherdale, PhD Author reference 1
https://doi.org/10.24095/hpcdp.39.8/9.02
This article has been peer reviewed.
Author references:
- Author reference 1
-
School of Public Health and Health Systems, University of Waterloo, Waterloo, Ontario, Canada
- Author reference 2
-
Department of Statistics and Actuarial Science, University of Waterloo, Waterloo, Ontario, Canada
Correspondence: Mahmood R. Gohari, University of Waterloo, 200 University Ave West, Waterloo, ON N2L 3G1; Tel: 226-972-0771; Email: mgohari@uwaterloo.ca
Abstract
Introduction: Despite evidence indicating a rapid progression in use of alcohol during adolescence, little is known about the ways patterns of drinking develop over time. This study investigated patterns of alcohol use within a cohort of youth in Ontario and Alberta and the probability of changes between patterns.
Methods: The sample consists of two-year linked longitudinal data (school year 2013/14 to 2014/15) from 19 492 students in Grades 9 to 12 in 89 secondary schools across Ontario and Alberta, Canada, who participated in the COMPASS study. The latent class analysis used two self-reported items about the frequency of drinking (measured as none, monthly, weekly, or daily use) and the frequency of binge drinking (measured as none, less than or once a month, 2–4 times a month or more than once week) to characterize patterns of alcohol use. The effects of gender, ethnicity and cannabis and cigarette use on alcohol use patterns were examined.
Results: The study identified four drinking patterns: non-drinker, periodic drinker (reported monthly drinking and no binge drinking), low-risk drinker (reported monthly drinking and limited binge drinking) and high-risk regular drinker (reported drinking 1–3 times a week and binge drinking 2–4 times a month). Non-drinker was the most prevalent pattern at baseline (55.7%) and follow-up (39.7%). Periodic drinkers had the highest likelihood of an increase in alcohol consumption, with 40% moving to the low-risk pattern. A notable proportion of participants returned to a lower severity pattern or transitioning out of drinking.
Conclusion: There are four distinct youth alcohol-use patterns. The high probability of transitioning to drinking during the secondary school years suggests the need for preventive interventions in earlier stages of use, before drinking becomes habitual.
Keywords: youth substance use, alcohol use, latent transition analysis, longitudinal study
Highlights
- Four distinct classes of youth alcohol use were identified: non-drinkers, periodic drinkers, low-risk drinkers and high-risk regular drinkers.
- Youth had a moderate likelihood of staying in the same class of drink consumption from baseline to follow-up.
- Periodic drinkers had the highest risk of increasing alcohol consumption.
- A notable proportion of drinkers returned to a lower alcohol-use class or quit drinking.
- Cigarette use and cannabis use were associated with membership in high alcohol-use classes.
Introduction
Alcohol use is common among Canadian youth and its excessive consumption is a major public health concern. By the time they graduate from secondary school, 60% of Canadian students report consuming alcohol in the past year, 46% of whom undertake binge drinking (5 or more drinks on one occasion).Footnote 1 Youth who drink alcohol are more likely than others to experience health and social consequences, including motor vehicle accidents,Footnote 2 unprotected sexual activity,Footnote 3 suicide,Footnote 4 and mental health disorders.Footnote 5 Furthermore, longitudinal studies indicate that alcohol-related consequences are not limited to adolescence; early drinkers tend to drink more as adults and therefore continue to be at higher risk of adverse outcomes,Footnote 6 and of using other substances such as cigarette and cannabis.Footnote 7
Existing empirical evidence indicates that youth alcohol-use behaviours are not static over time and consumption of alcohol typically increases throughout adolescence.Footnote 8 Recent longitudinal studies have captured such developmental changes in alcohol-use patterns and suggest this progression differs greatly between individuals in terms of timing and severity of escalation. For example, Peterson and colleaguesFootnote 9 identified five trajectories among students in Grades 5 to 10: non-drinkers, middle onset drinkers, late onset drinkers, moderate drinkers and early high drinkers. Shin and colleaguesFootnote 10 explored trajectories of drinking among students at 29 secondary schools in the USA and found four prominent alcohol patterns: non-drinker, potential drinker, experimenter and regular drinker. Such alcohol patterns are distinguished by frequency and quantity of alcohol use (e.g., number of days the individual undertakes drinking or binge drinking).Footnote 11
Although longitudinal research has characterized developmental patterns of alcohol use in youth over time, the number and types of identified patterns (or classes) are inconsistent. In addition, individuals may transition between classes over time, for example, a non-drinker may begin drinking, a drinker may cease drinking or an individual may move from a high-risk to a lower-risk drinking class. Youth-related substance use theories and models of development such as the gateway theoryFootnote 12 and the common liability modelFootnote 13 emphasize understanding youth alcohol-use classes and how distinct classes develop over time. This knowledge is critical for establishing interventions that aim to help youth stay in the non-drinker class or promote transitions to lower-risk or non-drinker classes. Despite longitudinal studies documenting youth alcohol trajectories, only a few studies have investigated transitions between classes.Footnote 14,Footnote 15 Moreover, most of the relevant studies examined American or European youth populations and not Canadian youth. In Canada, Rawana and AmesFootnote 16 studied protective factors of the alcohol-use trajectories in a sample of Aboriginal youth aged 12 to 23. They found a relatively stable frequency of heavy drinking over time with the peak at age 21 and the lowest rate at age 16. Since alcohol trajectories are extremely dependent on contextual factors, such as alcohol control and access policies and cultural norms, identifying changes in drinking patterns of Canadian youth is a key step to informing future intervention development.
This study adds to the literature by investigating whether there are distinct patterns of alcohol use within a cohort of youth in Ontario and Alberta, and, if so, what the likelihoods are of maintaining or changing drinking patterns over time. We used latent transition analysis (LTA) to characterize the profiles of drinking based on the frequency of alcohol use and binge drinking. LTA is a longitudinal extension of latent class modelling in which unobserved heterogeneity in the population is allowed by identifying homogenous groups of individuals in a sample based on similar responses to a set of questions.Footnote 17 LTA, as a person-oriented modelling approach, can model changes in drinking behaviours over time and predict for whom, and in what direction, a change may occur.Footnote 18 This knowledge can be used by prevention programs to target the individuals at the highest risk of problematic drinking and to test the effectiveness of an intervention.
Considering previous research, we expected that a large proportion of youth would abstain during their secondary school years, but also that a considerable proportion would be engaged in drinking at different levels of consumption. We also hypothesized that a notable proportion of youth would either reduce their levels of alcohol use or quit drinking. As some previous studies documented higher rates of alcohol use among higher-grade students and male students,Footnote 19,Footnote 20 we assessed the influence of these factors on subgroup membership and transitions between different latent classes. Furthermore, as it has been shown that changes in alcohol-use behaviour may be influenced by the use of other substances such as cigarettes and cannabis,Footnote 21,Footnote 22 we evaluated the effect of other substance use on the likelihood of transitions between latent classes over the two years of follow-up.
Methods
Sample
The sample was drawn from year 2 (baseline; school year 2013-2014) and year 3 (follow-up, school year 2014-15) of the COMPASS study. COMPASS is a longitudinal study designed to annually collect hierarchical data from a cohort of Canadian students in Grades 9 through 12. A full description of the COMPASS study and its methods are available in printFootnote 23 or online.
The COMPASS study purposefully recruited 89 secondary schools across Ontario (n = 79) and Alberta (n = 10). Participants from the schools were recruited using an active-information passive-consent procedure. The resulting baseline sample consisted of 34 839 students in Grades 9 to 11. The average participation rate was 79.2% across schools. The sample in the follow-up year consisted of 31 060 students in Grades 10 to 12 with an average participation rate of 78.7%. The main reasons for non-participation were absenteeism and spare or co-op education periods; a small number of parents or students refused participation (1.2%). Data were linked between two consecutive years based on responses of participants to six questions that was used to create a unique code for each student.Footnote 24 The linkage algorithm merged 19 492 students’ data over two years, but could not match 11 568 (33.2%) individuals. In addition, 554 (1.6%) individuals were excluded because they reported being in the same grade as the previous year. As previously reported, students with non-linked data were more likely to use alcohol, cigarettes or cannabis compared to the linked students (data not shown).Footnote 24The linked data was evenly distributed in terms of gender (53.1% female) and school years: 38.8% (n = 7556) in Grade 9, 34.6% (n = 6738) in Grade 10, and 26.6% (n = 5165) in Grade 11.
Alcohol measures
The study used two self-reported items about the frequency of drinking and frequency of binge drinking that are currently used in Canadian surveillance of youth substance use.Footnote 25 The frequency of drinking alcohol was measured by responses to the question, “In the last 12 months, how often did you have a drink of alcohol that was more than just a sip?” The response options were on a scale of 1 to 10. Considering the distribution of responses and in keeping with the World Health Organization alcohol use identification test (AUDIT) system of recording the frequency of drinking,Footnote 26 the responses were classified into four outcomes: no drink; up to 3 times a month (monthly use); 1 to 3 times a week (weekly use); and more than 3 times a week (nearly daily use). Binge drinking was assessed using the question, “In the last 12 months, how often did you have 5 drinks of alcohol or more on one occasion?” Responses in an original scale of 8 options were coded into four outcomes: no binge drinking; less than or once a month; 2 to 4 times a month; and more than once a week.
Students self-reported their demographic characteristics, including gender (female = 1, male = 2); school year (Grades 9 to 12); and ethnicity (White, Black, Asian, Aboriginal, Latin American, Other). Ethnicity was classified as a binary variable (White = 1, non-White = 0) because of the low frequency of students that were Black (n=617, 3.2%); Asian (n=993, 5.1%); Aboriginal (n = 490, 2.5%); Latin American (n = 308, 1.6%); or other ethnicities (n = 1965, 10.2%). Students’ cigarette use was assessed by asking students, “On how many of the last 30 days did you smoke one or more cigarettes?” Responses were recorded for analysis into a binary variable (none = 0, use in any day during the past 30 days = 1). Cannabis use was assessed by asking students, “In the last 12 months, how often did you use marijuana or cannabis?” Responses were also classified into a binary variable (none = 0, use in any day during the last year = 1).
Statistical analysis
We employed LTA on frequency of drinking and frequency of binge drinking in past year to group similar individuals based on their levels of drinking and binge drinking. A two-stage analytical approach was used. In the first stage, two to six class solutions were tested. These models were compared using the Bayesian information criteria (BIC) as the goodness-of-fit statistic, which includes a penalty for over-fitting; lower BIC values are therefore indicative of a better model for the data. To ensure that global, rather than local, maxima was found for the likelihood function, we ran each model with 50 different starting values for the parameters.Footnote 27 The quality of group separation was measured in terms of entropy statistics, which is a weighted average of group membership probabilities on a (0,1) scale.Footnote 28 The closer the entropy statistic is to 1, the greater the distinction between latent classes. Once the most appropriate latent class model was selected, we examined the measurement invariance of latent classes over the two years of the study to see if the structure of latent classes remained stable over time.
In the second stage, we investigated the association between latent class membership and covariates of gender, ethnicity and cigarette and cannabis use. We also explored the association between probability of transitions between different latent classes and gender and school grade. To test the effect of covariates, individuals were assigned to latent classes based on the maximum posterior probability of class membership. A set of multinomial logistic regressions was then fitted. The outcome variable in the multinomial regression was membership in each class with the non-drinker class as the reference category. All models were fitted using PROC LTA in SAS 9.4.1.Footnote 29 Procedure LTA allows for missing values on the outcome variables, but excludes participants with missing covariate data. In the current study, LTA with covariates excluded 368 participants out of 19 492 linked data because of missing data on gender or other substance use (78 missing gender, 290 missing other substance use and 31 missing both covariates). The structure of the latent classes did not change as a result of this reduction.
Results
Table 1 presents the levels of alcohol and other substance use by participants in the study. The number of alcohol users and binge drinkers had increased at the follow-up. The rate of binge drinking increased from 28.7% in the baseline year to 43% in the follow-up year. At the baseline, 5.7% of participants reported use of cigarettes, which increased to 9.5% at the follow-up. During the two years, the rate of cannabis use increased by 67.2%, rising from 15.6% at the baseline to 26.1% at the follow-up.
| Variable | Baseline 2013-14 (%) |
Follow-up 2014-15 (%) |
Relative change |
|---|---|---|---|
| Alcohol drinking | |||
| None | 10 327 (53.9) | 7386 (38.4) | −28.5% |
| Up to 3 times a month | 7534 (39.3) | 9740 (50.6) | 29.3% |
| 1–3 times a week | 1116 (5.8) | 1804 (9.4) | 61.6% |
| 3+ times a week | 186 (1.0) | 302 (1.6) | 62.4% |
| Binge drinking | |||
| None | 13 848 (71.3) | 11 082 (57.0) | −20.0% |
| Less than or once a month | 3855 (19.8) | 5439 (28.0) | 41.1% |
| 2–4 times a month | 1492 (7.7) | 2512 (12.9) | 68.4% |
| More than once a week | 242 (1.2) | 405 (2.1) | 67.4% |
| Cigarette use | 1115 (5.7) | 1860 (9.5) | 66.8% |
| Cannabis use | 2999 (15.6) | 5015 (26.1) | 67.2% |
Table 2 reports changes in the levels of alcohol use and binge drinking between the two waves of the study according to school years (Grade 9, 10 or 11). Of 5083 Grade 9 non-drinkers, 3374 (66.4%) reported abstinence when they moved to Grade 10. The results in Table 2 indicate that the rate of abstinence between baseline and follow-up years was quite similar over the school years with rates of 66.4%, 62.2% and 61.4% for Grades 9, 10 and 11, respectively. During the two years, rates of increase in the frequency of drinking changed similarly. For example, non-drinkers in Grades 9, 10 and 11 initiated monthly drinking at rates of 31.0%, 35.1% and 35.6%.
| Baseline (2013-14) levels of drinking | Follow-up (2014-15) levels of drinking | |||||||||||
|---|---|---|---|---|---|---|---|---|---|---|---|---|
| Grade 9 to 10 n (%) |
Grade 10 to 11 n (%) |
Grade 11 to 12 n (%) |
||||||||||
| Drinking | None | Monthly | Weekly | Daily | None | Monthly | Weekly | Daily | None | Monthly | Weekly | Daily |
| None | 3374 (66.4) | 1576 (31.0) | 100 (2.0) | 33 (0.6) | 2021 (62.2) | 1142 (35.1) | 65 (2.0) | 22 (0.7) | 1122 (61.4) | 651 (35.6) | 46 (2.5) | 8 (0.5) |
| Up to 3 times month (monthly) | 232 (11.6) | 1452 (72.4) | 292 (14.5) | 30 (1.5) | 238 (8.5) | 2149 (76.7) | 366 (13.1) | 48 (1.7) | 183 (6.9) | 2086 (79.1) | 330 (12.5) | 38 (1.5) |
| 1–3 times a week (weekly) | 15 (7.6) | 85 (42.9) | 83 (41.9) | 15 (7.6) | 15 (3.7) | 167 (40.8) | 202 (49.4) | 25 (6.1) | 13 (2.7) | 202 (41.5) | 238 (48.9) | 34 (6.9) |
| 3+ times a week (daily) | 11 (29.0) | 8 (21.0) | 12 (31.6) | 7 (18.4) | 7 (10.6) | 33 (50.0) | 14 (21.2) | 2 (18.2) | 5 (6.6) | 23 (30.3) | 29 (38.1) | 19 (25.0) |
| Binge drinking | None | Up to 3 times a month | 1–3 times a week | 3+ times a week | None | Up to 3 times a month | 1–3 times a week | 3+ times a week | None | Up to 3 times a month | 1-3 times a week | 3+ times a week |
| None | 4889 (76.9) | 1136 (17.9) | 283 (4.4) | 52 (0.8) | 3300 (71.7) | 1032 (22.4) | 232 (5.0) | 40 (0.9) | 2021 (71.5) | 651 (23.0) | 127 (4.5) | 27 (1.0) |
| Less than or once a month | 184 (21.2) | 405 (46.5) | 260 (29.9) | 21 (2.4) | 232 (16.1) | 813 (56.3) | 365 (25.3) | 34 (2.3) | 233 (15.3) | 897 (59.0) | 362 (23.8) | 29 (1.9) |
| 2–4 times a month | 34 (13.7) | 77 (31.0) | 115 (46.4) | 22 (8.9) | 57 (10.1) | 170 (30.0) | 290 (51.2) | 49 (8.7) | 57 (8.5) | 189 (28.2) | 367 (54.9) | 56 (8.4) |
| More than once a week | 13 (32.5) | 5 (12.5) | 12 (30.0) | 10 (25.0) | 12 (14.1) | 16 (18.8) | 35 (41.2) | 22 (25.9) | 14 (11.9) | 18 (15.4) | 45 (38.5) | 40 (34.2) |
|
||||||||||||
Identifying alcohol use patterns
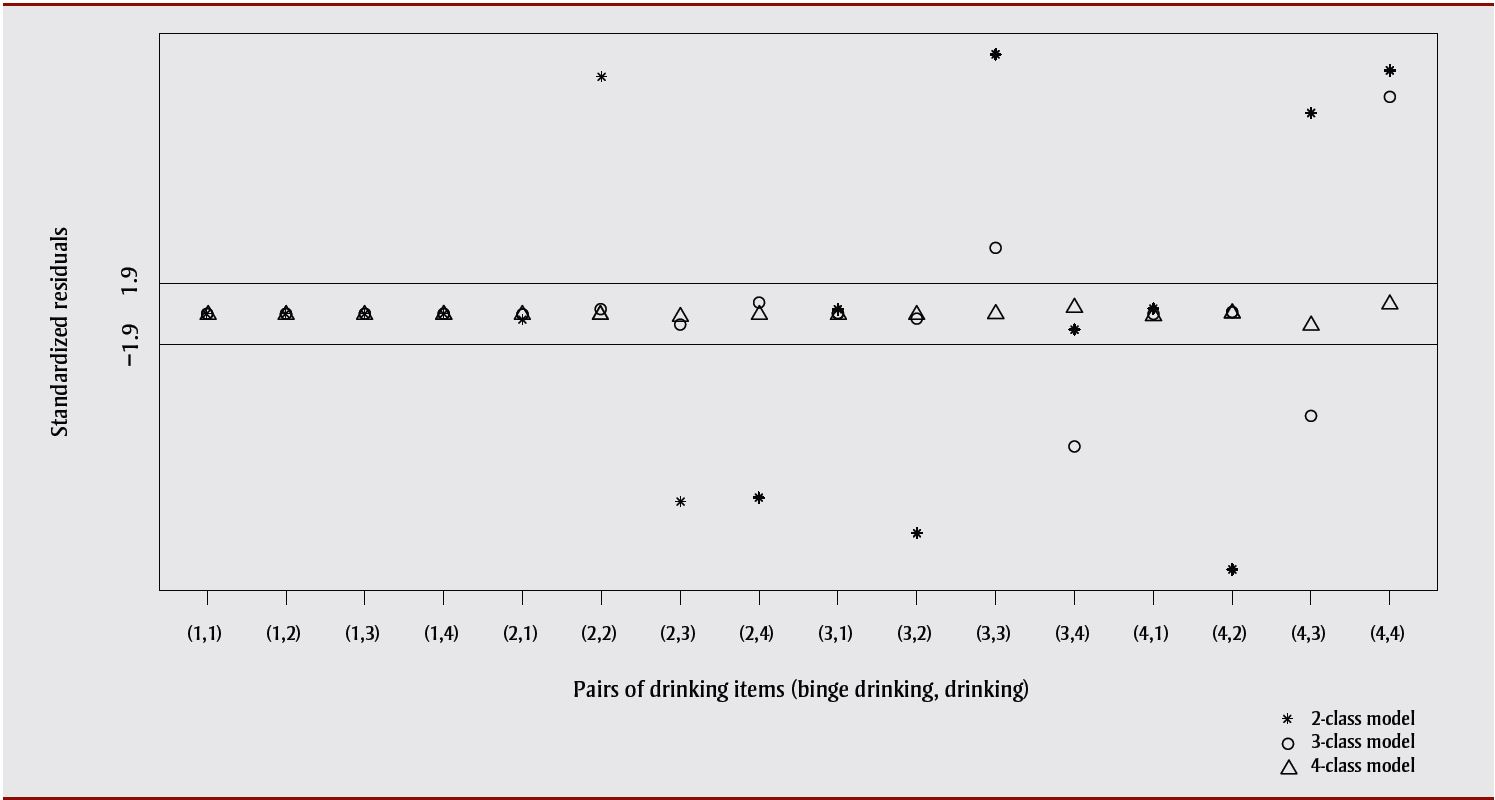
LTAs were conducted to identify distinct latent classes of drinking characterized by alcohol use patterns at the baseline. The model fitting procedure began with fitting latent transition models ranging from two to six latent classes to the data. Our decision on the number of latent classes was made according to goodness-of-fit statistics of BIC and also parsimony and interpretability of latent class structure (Table 3 represents fit statistics). BIC decreased substantially from 2- to 5-class solutions and then began to increase from the 6-class solution (BIC2=8809, BIC3=2665, BIC4=1306, BIC5=919, BIC6=1012). Despite the lower BIC value, there was considerable overlap between two latent classes identified by the 5-class model. Comparing the degree to which the latent classes were distinguished by 4-class and 5-class models using average posterior probabilities indicated a slightly better recognition of classes by the 4-class model. The overall entropy estimates for the 4-class model were 0.91 and 0.89 at baseline and follow-up, respectively (range: 0.45–0.99), compared to the 5-class estimates of 0.91 and 0.87, respectively (range: 0.35–0.99). We also found that the classes identified by the 4-class model were more conceptually meaningful and interpretable relative to those of the 5-class model. We examined the local independence of latent variable items following Reboussin’sFootnote 30 approach. The results of a correlation analysis of latent variable items showed that despite the presence of structural zero in binge drinking responses for non-drinkers, standardized residuals decreased substantially from the 2-class model to the 4-class model (Figure 1), indicating that local independence is not violated for the final model. Given these considerations, we selected the 4-class model, which generates clearly distinct and interpretable classes of alcohol use with substantial class sizes.
| Model | Log-Likelihood | df | Adjusted BIC | BIC | Entropy | BLRTFootnote a p value |
|---|---|---|---|---|---|---|
| 2-class | −56 561 | 240 | 8761.4 | 8809.1 | 0.95 | < .001 |
| 3-class | −53 434 | 229 | 2582.9 | 2665.5 | 0.95 | < .001 |
| 4-class | −52 778 | 216 | 1357.0 | 1480.9 | 0.93 | < .001 |
| 5-class | −52 401 | 201 | 703.1 | 874.5 | 0.91 | .302 |
| 6-class | −52 377 | 148 | 1011.7 | 1351.7 | 0.88 | .950 |
Abbreviations: BIC, Bayesian information criteria; BLRT, bootstrap likelihood ratio test.
|
||||||
Figure 1. Standardized residuals of bivariate correlations in frequency of drinking and binge-drinking levels used for creating latent classes
Text Description - Figure 1:Goharie
| 2-class model | 3-class model | 4-class model |
| 0.008 | 0 | 0 |
| −0.012 | 0 | 0 |
| 0.006 | 0 | 0 |
| 0.004 | 0 | 0 |
| −0.356 | −0.03 | −0.039 |
| 15.329 | 0.171 | −0.07 |
| −12.077 | −0.691 | −0.082 |
| −11.83 | 0.725 | 0.051 |
| 0.286 | 0.008 | 0.049 |
| −14.14 | −0.31 | −0.056 |
| 16.706 | 4.25 | 0.060 |
| −1.028 | −8.543 | 0.448 |
| 0.319 | −0.009 | −0.073 |
| −16.468 | 0.105 | 0.118 |
| 12.903 | −6.575 | −0.695 |
| 15.667 | 13.977 | 0.680 |
According to the conditional probabilities of the final model, shown in Table 4, we assigned the following labels to the latent classes: non-drinkers (had never drunk or did not use alcohol in past year); periodic drinkers (reported monthly drinking and no binge drinking); low-risk drinkers (reported some steady monthly drinking but limited binge drinking); and high-risk regular drinkers (reported drinking 1 to 3 times a week and binge drinking 2 to 4 times a month). Non-drinkers were the largest subgroup in both waves (55.7% of baseline to 39.7% of follow-up), although the prevalence of this group decreased by 16% at follow-up. The number of periodic drinkers increased slightly from 22.9% at baseline to 26.3% at follow-up. The prevalence of the remaining of the two classes of low-risk drinkers and high-risk regular drinkers increased approximately 50% at follow-up.
| Latent class characteristics | Non- drinker |
Periodic drinker |
Low- risk drinker |
High-risk regular drinker |
|---|---|---|---|---|
| Prevalence at baseline [2013-14] (%) | 55.7 | 22.9 | 15.8 | 5.6 |
| Prevalence at follow-up [2014-15] (%) | 39.7 | 26.3 | 24.6 | 9.4 |
| Drinking | ||||
| None | 0.963 | 0.007 | 0.001 | 0.000 |
| Up to 3 times a month | 0.036 | 0.970 | 0.943 | 0.400 |
| 1–3 times a week | 0.000 | 0.019 | 0.053 | 0.585 |
| More than 3 times a week | 0.000 | 0.004 | 0.002 | 0.015 |
| Binge drinking | ||||
| None | 0.999 | 0.701 | 0.000 | 0.031 |
| Less than or once a month | 0.001 | 0.287 | 0.864 | 0.127 |
| 2–4 times a month | 0.000 | 0.011 | 0.136 | 0.827 |
| More than once a week | 0.000 | 0.003 | 0.000 | 0.014 |
To examine the stability of identified latent classes over time, we compared the fit of the 4-class model, constraining item-response probabilities to be equivalent across two years with the unconstrained model. The BIC of the restricted model (1509.6) was lower than the BIC of the unrestricted model (1640.1), indicating that the same classes across waves would represent the same characteristics.
Transition probabilities in alcohol-use patterns
Table 5 shows latent transition probabilities based on the LTA model adjusted for the school year and cigarette and cannabis use. The probabilities on the diagonal reflect the probability of membership in the same latent class at both time points, which is high for all classes. Low-risk drinkers and high-risk regular drinkers had a higher likelihood of maintaining the same class at follow-up relative to non-drinkers and periodic drinkers. In contrast, the periodic drinkers were most likely to transition into the low-risk drinker class. In particular, 40% of the students in the periodic drinker class at baseline moved to the low-risk drinker class at follow-up. Non-drinkers demonstrated a 24% chance of transitioning to periodic drinking. Also, despite 65% of high-risk regular drinkers maintaining their class at follow-up, a notable proportion of individuals in this group lowered their alcohol consumption. Specifically, 18% of high-risk regular drinkers moved to the low-risk class and 8% reported complete cessation of alcohol drinking (Table 5). Individuals within the low-risk drinker and high-risk regular drinker classes had the same probability (8%) of becoming non-drinkers at follow-up. In total, 17% of drinkers at baseline quit drinking at follow-up.
| Baseline (2013-14) class | Follow-up (2014-15) class | |||
|---|---|---|---|---|
| Non- drinker |
Periodic drinker |
Low-risk drinker |
High-risk regular drinker |
|
| Non-drinker | 0.64 | 0.24 | 0.09 | 0.03 |
| Periodic drinker | 0.01 | 0.54 | 0.40 | 0.05 |
| Low-risk drinker | 0.08 | 0.02 | 0.69 | 0.20 |
| High-risk regular drinker | 0.08 | 0.09 | 0.18 | 0.65 |
Note: Adjusted for school year, cigarette and cannabis use. |
||||
Predictors of membership in latent class and transition probabilities
After determining latent classes, we examined the potential effects of gender and ethnicity in predicting the membership of individuals in the four latent classes at the baseline. Comparison fit of the model with gender and without gender showed that gender significantly related to latent class membership (2(loglikelihoodwithout gender − likelihoodwith gender = 58.2, df = 3, p < .001)). The odds ratios (ORs) in Table 6 suggest that male students were more likely to be in the high-risk regular drinker class than female students (OR = 1.2, 95% confidence interval [CI]: 1.04–1.36). Ethnicity was also found to be a significant predictor of class membership (2(likelihoodwithout ethnicity − likelihoodwith ethnicity = 37.2, df = 3, p < .001)), and White students were at a significantly higher risk of engaging in alcohol use than their non-White peers.
Table 6 presents the OR associated with transitions from each latent class relative to remaining in the same class. Male non-drinkers had a 2.4 (95% CI: 1.76–3.27) times greater chance of engaging in high-risk regular drinking. The odds of transition from the high-risk drinking to abstinence was also higher for male students (OR = 1.33, 95% CI: 0.78–2.28). Results of Table 6 indicate that Grade 9 students were more likely to move to higher-risk drinking classes than Grade 11 students, while there were no significant differences between Grade 10 and Grade 11 students in transitioning to higher-risk drinking classes.
| Covariate | Non-drinker OR (95% CI) |
Periodic drinker OR (95% CI) |
Low-risk drinker OR (95% CI) |
High-risk regular drinker OR (95% CI) |
|---|---|---|---|---|
| Class membership covariate | ||||
| Males | Reference | 0.85 (0.79–0.93) | 0.86 (0.80–0.93) | 1.20 (1.04–1.36) |
| White | Reference | 1.51 (1.37–1.65) | 1.72 (1.57–1.89) | 1.26 (1.08–1.49) |
| Smoking | Reference | 4.44 (3.50–5.63) | 12.63 (10.31-15.47) | 22.85 (14.24–33.62) |
| Cannabis | Reference | 5.98 (5.17–6.91) | 10.88 (8.34–13.75) | 19.24 (9.81–30.47) |
| Transition covariates | ||||
| Males | ||||
| Non-drinker | Reference | 0.83 (0.76–0.90) | 1.15 (0.89–1.49) | 2.40 (1.76–3.27) |
| Periodic drinker | 1.64 (1.21–2.22) | Reference | 1.00 (0.87–1.16) | 1.90 (1.33–2.71) |
| Low-risk drinker | 1.42 (0.80–2.51) | 0.00Footnote a | Reference | 1.77 (1.51–2.08) |
| High-risk regular drinker | 1.33 (0.78–2.28) | 0.75 (0.38–1.48) | 0.80 (0.57–1.14) | Reference |
| Grade 9 (relative to Grade 11) | ||||
| Non-drinker | Reference | 0.84 (0.77–0.91) | 0.95 (0.74–1.22) | 0.87 (0.65–1.16) |
| Periodic drinker | 1.11 (0.80–1.55) | Reference | 1.47 (1.26–1.71) | 1.91 (1.34–2.74) |
| Low-risk drinker | 1.52 (0.80–2.89) | 0.00Footnote a | Reference | 1.37 (1.14–1.65) |
| High-risk regular drinker | 2.56 (1.42–4.61) | 2.06 (0.94–4.53) | 1.14 (0.71–1.83) | Reference |
| Grade 10 (relative to Grade 11) | ||||
| Non-drinker | Reference | 1.11 (1.02–1.22) | 1.12 (0.83–1.52) | 1.01 (0.77–1.33) |
| Periodic drinker | 0.92 (0.67–1.26) | Reference | 0.98 (0.84–1.13) | 0.84 (0.58–1.22) |
| Low-risk drinker | 0.82 (0.45–1.49) | 0.00Footnote a | Reference | 0.97 (0.83–1.15) |
| High-risk regular drinker | 0.91 (0.52–1.58) | 0.68 (0.32–1.43) | 1.21 (0.85–1.72) | Reference |
Abbreviations: CI, confidence interval; OR, odds ratio Note: Baseline was the 2013-14 school year and follow-up was the 2014-15 school year.
|
||||
Discussion
This study characterized patterns of alcohol use in a large sample of secondary school students, identifying four latent classes. These distinct classes align with previous research indicating the presence of an underlying grouping structure to youth alcohol use.Footnote 31,Footnote 32 Consistent with other studies,Footnote 31 we found that the most prevalent class was non-drinkers. The size of this group decreased by 16% at follow-up but remained the dominant group. Individuals in the low-risk drinker and high-risk regular drinker classes engaged in some levels of binge drinking, indicating that a considerable proportion of youth is at risk of immediate and long-term consequences of alcohol consumption. This finding is supported by evidence that suggests that when youth do drink alcohol, they are more likely to binge drink.Footnote 1
LTA allowed us to characterize the homogenous group of alcohol users and also to understand the developmental process of their alcohol use over time. In particular, the data showed that youth were highly likely to maintain their alcohol-use behaviour between baseline and follow-up. The low-risk drinker class was the most stable of the four identified. Furthermore, we found a high degree of transitioning between latent classes from baseline to the following year. Individuals mainly moved into the expected increasing direction and consumed more at follow-up. Periodic drinkers demonstrated the highest likelihood of an increase in alcohol consumption by moving to the low-risk drinker class. This high transition probability suggests that many of those who drink a few times a month increase their frequency of drinking to weekly while also starting to engage in binge drinking. Estimated transition probabilities indicated that alcohol consumption increases incrementally and most of the transitions occurred into the next-higher level of consumption.Footnote 10
Although most youth moved to a higher alcohol-use class, a notable proportion returned to a lower severity class or transitioned out of drinking. Nearly one out of 10 low-risk or high-risk regular drinkers was likely to stop drinking. Drinking cessation by individuals in these two classes was more likely than by periodic drinkers, possibly because students using alcohol at such a high frequency can be severely affected in their daily lives, with poorer academic engagement and performance.Footnote 33 In comparison, the likelihood of cessation by periodic drinkers was only 1%, suggesting that most students in the early stages of alcohol consumption continue to drink. Future research needs to determine the characteristics of the youth that reduce their consumption and to investigate the factors that influenced this decrease.
As in previous research,Footnote 32 we found that school grade was associated with transitions between latent classes. The results of this study show that the odds of transitioning from the non-drinking class to other classes are similar for students in different grades, indicating a stable chance of starting alcohol drinking between school years. On the other hand, periodic drinkers and low-risk drinkers in Grade 9 are more likely to escalate their alcohol use than students in Grade 11. This finding indicates that initiation and escalation of alcohol consumption by secondary school students are more likely to happen during the first two years of secondary school and that behaviours of students become more stable as they move to higher grades, suggesting that the prevention programs would be more efficient if they targeted Grade 9 and 10 students.
The results of this study confirmed previous research that male youth have higher odds than female youth of engaging in, transitioning to and remaining in problematic drinking.Footnote 34,Footnote 35 Also, male students indicated a higher probability of quitting drinking. Consistent with problem behaviour theory that posits an interrelation between use of different substances,Footnote 21,Footnote 22,Footnote 36 the results of the current study demonstrated the relevance of cigarette and cannabis use in relation to heightening the probability of membership in the higher-risk drinking classes. The odds of membership in the periodic drinker class for cigarette smokers was more than four times that of non-smokers. Similar patterns were observed for cannabis users, for whom the odds of engaging in higher levels of drinking were greater than for non-drinkers. This finding supports the existing literature, which shows that a high level of alcohol consumption co-occurs with cigarette or cannabis use.Footnote 37 However, based on the current study it is unclear which of these substances serves as a gateway for the use of the others. Future research is needed to examine the sequencing of initiation between different substances. Theoretical models such as the gateway theoryFootnote 38 and the common liability theoryFootnote 13,Footnote 39 and empirical evidenceFootnote 40 suggest that youth deciding on the use of any of alcohol, cigarette and cannabis is associated with a higher risk of the use of others, regardless of use sequences. The findings of our study confirm the previous research and suggest that prevention interventions need to focus on all of the most common substances simultaneously.
The LTA that is used in the current research is a person-centred approach that can model individuals’ changes based on their patterns of responses on an outcome of interest. Therefore, it can be used to understand the patterns in data and to explore if individuals are different from one another with respect to the outcome of interest. Moreover, LTA is able to account for the measurement errors typically associated with self-report surveys.Footnote 17 In this method, each individual with an empirical response has a probability of membership in every latent class and the model assigns individuals to a class with the highest probability of membership. The results from the LTA need to be applied with awareness of its limitations. One of the main limitations of LTA is that subgroups detected in a study sample are not necessarily the same as real underlying subgroups in the population and the number of subgroups identified by LTA can be greater than the actual number.Footnote 41 Another limitation of LTA is the assumption that the underlying latent variable describes any observed association between indicators of the latent variable. This assumption may be hard to meet in some real applications and may cause biases in parameter estimation, such as overestimation of the number of classes.Footnote 42,Footnote 43
The results of this study should be considered in light of its limitations. The main limitation of this study was reliance on self-reported measures of alcohol use. Youth reports on alcohol and other substance use are potentially associated with underreporting and measurement errors. Secondly, the linkage process could not link a portion of students’ data over two years of follow-up. The non-linked data appear not to be a random collection, but data from students who are more likely to drink, smoke cigarettes, and use cannabis. As a result, the linked data can underestimate the size and probability of transitioning to high-risk groups. In addition, the developmental course of alcohol consumption was investigated with one year of follow-up. More comprehensive knowledge about changes in youth drinking behaviour would require a longer follow-up time. Finally, measurement time points were about one year apart, so students’ alcohol behaviours could have changed several times over this period. Because of these types of potentially missed transitions, the transition probabilities should be interpreted with caution.Footnote 17
Future research can evaluate to what extent transitioning between different identified patterns of alcohol use may be influenced by a change to any prevention programs or policies on alcohol control. For example, our research team is examining, using four years of data in a quasi-experimental setting, the impact on youth alcohol-use patterns of the new Liquor Control Board of Ontario (LCBO) policy that authorizes up to 450 grocery stores across Ontario to sell alcohol. Evaluating the effect of this natural experiment (or for researchers evaluating other forms of alcohol policy) would be better served by examining the impact on the more nuanced alcohol-use transition patterns presented here rather than simply evaluating the impact on a less informative outcome such as use versus no use. In addition, future research may implement and assess the impact of behavioural change interventions, such as Alcohol Brief InterventionFootnote 44 and Motivational Enhancement Therapy,Footnote 45 to motivate problematic drinkers to quit alcohol or decrease their consumption. The transition modelling approach used here can also be applied to other risk behaviour or substance use domains, such as cannabis and cigarettes, and may serve as a template for guiding future evaluations of prevention policies, such as the new federal cannabis regulations in Canada or any potential changes to tobacco control efforts.
Conclusion
The study suggests that alcohol consumption tends to increase in those youth who start, but the volume of increase is not the same across all populations of youth. The large transition from periodic drinker class to higher levels of drinking we observed indicates the need for preventive interventions in the earlier stages of use, before drinking becomes habitual. In addition, there is more need for interventions that target current alcohol users to increase the likelihood of transitions from alcohol drinker classes to the non-drinker class. The study demonstrated that cigarette or cannabis use was associated with membership in classes with high levels of alcohol consumption, suggesting that efforts that address polysubstance use may be more efficient than single alcohol programs.
Acknowledgements
The COMPASS study was supported by a bridge grant from the Canadian Institutes of Health Research (CIHR) Institute of Nutrition, Metabolism and Diabetes (INMD) through the “Obesity – Interventions to Prevent or Treat” priority funding awards (OOP-110788; grant awarded to S. Leatherdale) and an operating grant from the Canadian Institutes of Health Research (CIHR) Institute of Population and Public Health (IPPH; MOP-114875; grant awarded to S. Leatherdale); a CIHR Project Grant (PJT-148562; grant awarded to S. Leatherdale); a CIHR Project Grant (PJT-149092; grant awarded to K. Patte); and by a research funding arrangement with Health Canada (#1617-HQ-000012; contract awarded to S. Leatherdale).
Conflicts of interest
The authors have no conflicts of interest to disclose.
Authors’ contributions and statement
MG devised the project, performed the analyses, interpreted the results, and wrote the first draft of the manuscript. SL led the COMPASS host study. RC and JD provided methodological advice for data analyses. SL, RC and JD contributed to interpretation of data and revised the manuscript. All authors read and approved the final version of the manuscript.
The content and views expressed in this article are those of the authors and do not necessarily reflect those of the Government of Canada.
References
- Footnote 1
-
Public Health Agency of Canada. The Chief Public Health Officer's Report on the State of Public Health in Canada, 2015: Alcohol Consumption in Canada. Ottawa (ON): Public Health Agency of Canada; 2016. 76 p.
- Footnote 2
-
Brubacher JR, Chan H, Martz W, et al. Prevalence of alcohol and drug use in injured British Columbia drivers. BMJ Open. 2016;6:e009278. doi: 10.1136/bmjopen-2015-009278.
- Footnote 3
-
Ellickson PL, Tucker JS, Klein DJ. Ten-year prospective study of public health problems associated with early drinking. Pediatrics. 2003;111(5 Pt 1):949-55. doi: 10.1542/peds.111.5.949.
- Footnote 4
-
Landberg J. Per capita alcohol consumption and suicide rates in the US, 1950–2002. Suicide Life Threat Behav. 2009;39(4):452-60. doi: 10.1521/suli.2009.39.4.452.
- Footnote 5
-
Brière FN, Rohde P, Seeley JR, Klein D, Lewinsohn PM. Comorbidity between major depression and alcohol use disorder from adolescence to adulthood. Compr Psychiatry. 2014;55(3):526-33. doi: 10.1016/j.comppsych.2013.10.007.
- Footnote 6
-
Oosterhoff B, Kaplow JB, Layne CM. Trajectories of binge drinking differentially mediate associations between adolescent violence exposure and subsequent adjustment in young adulthood. Translational Issues in Psychological Science. 2016;2(4):371. doi: 10.1037/tps0000092.
- Footnote 7
-
Windle M. Drinking over the lifespan: focus on early adolescents and youth. Alcohol Res. 2016;38(1):95-101. Available from: https://www.ncbi.nlm.nih .gov/pmc/articles/PMC4872619/
- Footnote 8
-
McBride O, Adamson G, Cheng HG, Slade T. Changes in drinking patterns in the first years after onset: a latent transition analysis of National Epidemiologic Survey on Alcohol and Related Conditions (NESARC) data. Psychology of addictive behaviors. 2014;28(3):696-709. doi: 10.1037/a0035069.
- Footnote 9
-
Peterson SJ, Davis HA, Smith GT. Personality and learning predictors of adolescent alcohol consumption trajectories. J Abnorm Psychol. 2018;127(5):482-95. doi: 10.1037/abn0000351.
- Footnote 10
-
Shin Y, Lee JK, Lu Y, et al. Exploring parental influence on the progression of alcohol use in Mexican-heritage youth: a latent transition analysis. Prev Sci. 2016;17(2):188-98. doi: 10.1007/s11121-015-0596-1.
- Footnote 11
-
Auerbach KJ, Collins LM. A multidimensional developmental model of alcohol use during emerging adulthood. J Stud Alcohol. 2006;67(6):917-25. doi: 10.15288/jsa.2006.67.917.
- Footnote 12
-
Kandel DB, Yamaguchi K, Chen K. Stages of progression in drug involvement from adolescence to adulthood: further evidence for the gateway theory. J Stud Alcohol. 1992;53(5):447-457. doi: 10.15288/jsa.1992.53.447.
- Footnote 13
-
Vanyukov MM, Tarter RE, Kirisci L, Kirillova GP, Maher BS, Clark DB. Liability to substance use disorders: 1. Common mechanisms and manifestations. Neurosci Biobehav Rev. 2003; 27(6):507-15. doi: 10.1016/j.neubiorev .2003.08.002.
- Footnote 14
-
Dauber SE, Paulson JF, Leiferman JA. Race-specific transition patterns among alcohol use classes in adolescent girls. J Adolesc. 2011;34(3):407-20. doi: 10.1016/j.adolescence.2010.07.001.
- Footnote 15
-
Jackson N, Denny S, Sheridan J, et al. Predictors of drinking patterns in adolescence: a latent class analysis. Drug Alcohol Depend. 2014;135:133-9. doi: 10.1016/j.drugalcdep.2013.11.021.
- Footnote 16
-
Rawana JS, Ames ME. Protective predictors of alcohol use trajectories among Canadian Aboriginal youth. J Youth Adolesc. 2012;41(2):229-43. doi: 10.1007/s10964-011-9716-9.
- Footnote 17
-
Collins LM, Lanza ST. Latent class and latent transition analysis: with applications in the social, behavioral, and health sciences. Hoboken (NJ): John Wiley & Sons; 2013. doi: 10.1002/9780470567333.
- Footnote 18
-
Roberts TJ, Ward SE. Using latent transition analysis in nursing research to explore change over time. Nurs Res. 2011;60(1):73. doi: 10.1097/NNR.0b013e3182001c63.
- Footnote 19
-
Brown SA, McGue M, Maggs J, et al. A developmental perspective on alcohol and youths 16 to 20 years of age. Pediatrics. 2008;121 Suppl 4:S290-310. doi: 10.1542/peds.2007-2243D.
- Footnote 20
-
Mason WA, Spoth RL. Sequence of alcohol involvement from early onset to young adult alcohol abuse: differential predictors and moderation by family-focused preventive intervention. Addiction. 2012;107(12):2137-48. doi: 10.1111/j.1360-0443.2012.03987.
- Footnote 21
-
Hix-Small H, Duncan TE, Duncan SC, Okut H. A multivariate associative finite growth mixture modeling approach examining adolescent alcohol and marijuana use. J Psychopathol Behav Assess. 2004;26(4):255-70. doi: 10.1023%2FB%3AJOBA.0000045341.56296.fa.
- Footnote 22
-
Scholes-Balog KE, Hemphill SA, Evans-Whipp TJ, Toumbourou JW, Patton GC. Developmental trajectories of adolescent cannabis use and their relationship to young adult social and behavioural adjustment: a longitudinal study of Australian youth. Addict Behav. 2016;53:11-8. doi: 10.1016/j.addbeh.2015.09.008.
- Footnote 23
-
Leatherdale ST, Brown KS, Carson V, et al. The COMPASS study: a longitudinal hierarchical research platform for evaluating natural experiments related to changes in school-level programs, policies and built environment resources. BMC Public Health. 2014;14(1):331. doi: 10.1186/1471-2458-14-331.
- Footnote 24
-
Qian W, Battista K, Bredin C, Stephen Brown K, Leatherdale ST. Assessing longitudinal data linkage results in the COMPASS study. COMPASS Technical Report Series. Waterloo (ON): University of Waterloo; 2015. Available from: https://uwaterloo.ca/compass-system/publications/assessing-longitudinal-data-linkage-results-compass-study
- Footnote 25
-
University of Waterloo. Canadian Student Tobacco, Alcohol and Drug Survey. CSTADT questionnaire: Alcohol use [Internet]. Waterloo (ON): University of Waterloo; [cited 15 February 2019]. Available from: https://uwaterloo.ca/canadian-student-tobacco-alcohol-drugs-survey/questionnaires#Alcohol
- Footnote 26
-
Saunders JB, Aasland OG, Babor TF, de la Fuente JR, Grant M. Development of the alcohol use disorders identification test (AUDIT): WHO collaborative project on early detection of persons with harmful alcohol consumption–II. Addiction. 1993;88(6):791-804. doi: 10.1111/j.1360-0443.1993.tb02093.x.
- Footnote 27
-
Nylund KL, Asparouhov T, Muthén BO. Deciding on the number of classes in latent class analysis and growth mixture modeling: a Monte Carlo simulation study. Struct Equ Modeling. 2007;14(4):535-69. doi: 10.1080/10705510701575396.
- Footnote 28
-
Ramaswamy V, Desarbo WS, Reibstein DJ, Robinson WT. An empirical pooling approach for estimating marketing mix elasticities with PIMS data. Mark Sci. 1993;12(1):103-24. doi: 10.1287/mksc.12.1.103.
- Footnote 29
-
University Park: The Methodology Center, Penn State. PROC LCA & PROC LTA. 2015;Version 1.3.2.
- Footnote 30
-
Reboussin BA, Ip EH, Wolfson M. Locally dependent latent class models with covariates: an application to under-age drinking in the USA. J R Stat Soc Ser A Stat Soc. 2008;171(4):877-97. doi: 10.1111/j.1467-985X.2008.00544.x.
- Footnote 31
-
Tomczyk S, Isensee B, Hanewinkel R. Latent classes of polysubstance use among adolescents—a systematic review. Drug Alcohol Depend. 2016;160:12-29. doi: 10.1016/j.drugalcdep.2015.11.035.
- Footnote 32
-
Jackson KM, Schulenberg JE. Alcohol use during the transition from middle school to high school: national panel data on prevalence and moderators. Dev Psychol. 2013;49(11):2147-58. doi: 10.1037/a0031843.
- Footnote 33
-
Patte KA, Qian W, Leatherdale ST. Is binge drinking onset timing related to academic performance, engagement, and aspirations among youth in the COMPASS Study? Subst Use Misuse. 2017;52(13):1795-800. doi: 10.1080/10826084.2017.1306562.
- Footnote 34
-
Modecki KL, Barber BL, Eccles JS. Binge drinking trajectories across adolescence: for early maturing youth, extra-curricular activities are protective. J Adolesc Health. 2014;54(1):61-6. doi: 10.1016/j.jadohealth.2013.07.032.
- Footnote 35
-
Schuckit MA, Smith TL, Danko GP, et al. Predictors of subgroups based on maximum drinks per occasion over six years for 833 adolescents and young adults in COGA. J Stud Alcohol Drugs. 2014;75(1):24-34. doi: 10.15288/jsad.2014.75.24.
- Footnote 36
-
Donovan JE, Jessor R. Structure of problem behavior in adolescence and young adulthood. J Consult Clin Psychol. 1985;53(6):890-904. doi: 10.1037/0022-006X.53.6.890.
- Footnote 37
-
Tomczyk S, Hanewinkel R, Isensee B. Multiple substance use patterns in adolescents—a multilevel latent class analysis. Drug Alcohol Depend. 2015;155:208-14. doi: 10.1016/j.drugalcdep.2015.07.016.
- Footnote 38
-
Kandel D, Kandel E. The Gateway Hypothesis of substance abuse: developmental, biological and societal perspectives. Acta Paediatr. 2015;104(2):130-7. doi: 10.1111/apa.12851.
- Footnote 39
-
Degenhardt L, Chiu WT, Conway K, et al. Does the ‘gateway’ matter? Associations between the order of drug use initiation and the development of drug dependence in the National Comorbidity Study Replication. Psychol Med. 2009;39(1):157-67. doi: 10.1017/S0033291708003425.
- Footnote 40
-
DuPont RL, Han B, Shea CL, Madras BK. Drug use among youth: national survey data support a common liability of all drug use. Prev Med. 2018;113:68-73. doi: 10.1016/j.ypmed.2018.05.015.
- Footnote 41
-
Twisk J, Hoekstra T. Classifying developmental trajectories over time should be done with great caution: a comparison between methods. J Clin Epidemiol. 2012;65(10):1078-87. doi: 10.1016/j.jclinepi.2012.04.010.
- Footnote 42
-
Berzofsky ME, Biemer PP, Kalsbeek WD. Local dependence in latent class analysis of rare and sensitive events. Sociol Methods Res. 2014;43(1):137-70. doi: 10.1177/0049124113506407.
- Footnote 43
-
Lanza ST, Cooper BR. Latent class analysis for developmental research. Child Dev Perspect. 2016;10(1):59-64.
- Footnote 44
-
Bridgeman K, Shepherd J, Jordan P, et al. Brief intervention for alcohol misuse. Nurs Times. 2012;108. Available from: https://www.nursingtimes.net/Journals/2012/12/13/z/s/j/181212-Brief-intervention-for-alcohol-misuse.pdf
- Footnote 45
-
Miller WR. Motivational enhancement therapy manual: a clinical research guide for therapists treating individuals with alcohol abuse and dependence. DIANE Publishing; 1995.