
Original quantitative research – How many alcohol-attributable deaths and hospital admissions could be prevented by alternative pricing and taxation policies? Modelling impacts on alcohol consumption, revenues and related harms in Canada
Health Promotion and Chronic Disease Prevention in Canada
Tim Stockwell, PhDAuthor reference footnote 1; Samuel Churchill, MScAuthor reference footnote 1; Adam Sherk, PhDAuthor reference footnote 1; Justin Sorge, MPHAuthor reference footnote 1; Paul Gruenewald, PhDAuthor reference footnote 2
https://doi.org/10.24095/hpcdp.40.5/6.04
This article has been peer reviewed.
Correspondence: Tim Stockwell, Canadian Institute for Substance Use Research, University of Victoria, PO Box 1700 STN CSC, Victoria, BC V8W 2Y2; Tel: 250-472-5445; Email: timstock@uvic.ca
Abstract
Introduction: In 2017 Canada increased alcohol excise taxes for the first time in over three decades. In this article, we describe a model to estimate various effects of additional tax and price policies that are predicted to improve health outcomes.
Methods: We obtained alcohol sales and taxation data for 2016/17 for all Canadian jurisdictions from Statistics Canada and product-level sales data for British Columbia. We modelled effects of alternative price and tax policies—revenue-neutral taxes, inflation-adjusted taxes and minimum unit prices (MUPs)—on consumption, revenues and harms. We used published price elasticities to estimate impacts on consumption and revenue and the International Model for Alcohol Harms and Policies (InterMAHP) to estimate impacts on alcohol-attributable mortality and morbidity.
Results: Other things being equal, revenue-neutral alcohol volumetric taxes (AVT) would have minimal influence on overall alcohol consumption and related harms. Inflation-adjusted AVT would result in 3.83% less consumption, 329 fewer deaths and 3762 fewer hospital admissions. A MUP of $1.75 per standard drink (equal to 17.05 mL ethanol) would have reduced consumption by 8.68% in 2016, which in turn would have reduced the number of deaths by 732 and the number of hospitalizations by 8329 that year. Indexing alcohol excise taxes between 1991/92 and 2016/17 would have resulted in the federal government gaining approximately $10.97 billion. We estimated this could have prevented 4000–5400 deaths and 43 000–56 000 hospitalizations.
Conclusions: Improved public health outcomes would be made possible by (1) increasing alcohol excise tax rates across all beverages to compensate for past failures to index rates, and (2) setting a MUP of at least $1.75 per standard drink. While reducing alcohol-caused harms, these tax policies would have the added benefit of increasing federal government revenues.
Highlights
- We modelled the impacts of alternative pricing and taxation policies on alcohol harms for Canada in 2016.
- A minimum unit price (MUP) of $1.75 per standard drink would have reduced the number of deaths across Canada in 2016 by 732 and hospitalizations by 8329.
- Compensating for past failures to adjust alcohol excise tax rates with inflation would have decreased the annual number of deaths by 329 and hospitalizations by 3762.
- Indexing alcohol excise taxes between 1991 and 2017 would have resulted in the federal government gaining approximately $10.97 billion.
- Excise taxes calculated per unit of alcohol, adjusted for inflation and combined with an MUP, would have significantly reduced alcohol consumption, and consequently alcohol-attributable deaths and hospitalizations.
Keywords: alcohol policy, minimum unit pricing, taxation, International Model for Alcohol Harms and Policies, InterMAHP, mortality, morbidity, policy modeling
Introduction
Alcohol consumption in Canada was associated with approximately 15 000 preventable deaths, 90 000 preventable hospital admissions and 245 000 potential years of life lost in 2014.Footnote 1 The collective impact of alcohol use on health care, crime and lost productivity was estimated at $14.6 billion, higher than the costs of tobacco use and the costs of all other psychoactive substances combined, including opioids and cannabis.Footnote 1
In 2016/17, the reference fiscal year we use in this paper, Canada collected $1.6 billion from excise taxes on alcohol, and $634 million from goods and services tax (GST) applied to alcohol.Footnote 2
Alcohol excise taxes have a significant but, in most countries, substantially untapped potential to improve public health and safety outcomes.Footnote 3 In most countries, excise taxes are applied to the wholesale price of alcohol and then multiplied by profit margins and sales taxes. Thus, the effects of excise taxes on final prices can be considerable. Pricing and taxation strategies are considered among the most effective at reducing alcohol consumption and related harms.Footnote 4Footnote 5 In a much-cited systematic review that included 1003 observations from 112 studies covering more than 30 countries, Wagenaar et al. concluded that, on average, a 10% increase in alcohol prices results in a 4.4% reduction in consumption.Footnote 6 The same research group also estimated significant impacts of price changes on alcohol-related morbidity and mortality.Footnote 7
Thomas et al.Footnote 3 outlined elements of taxation and pricing strategies with strong theoretical and empirical support for their impacts on consumption and related harms. Giesbrecht et al.Footnote 8 and Wettlaufer et al.Footnote 9 operationalized these and assessed the implementation of ideal pricing and taxing strategies that achieve the following objectives:
- Taxes are applied comprehensively across all beverage types at a rate per unit of pure alcohol, often referred to as an alcohol volumetric tax (AVT). These generally result in drinks with higher alcohol content (both by strength and volume) being more expensive than less hazardous, lower alcohol content drinks;
- Tax rates are applied per unit of alcohol (e.g. per litre of ethanol or standard drink) and indexed to inflation to ensure that their real values do not erode over time;
- “Floor” or minimum prices are set, also at a rate per unit of pure alcohol, to restrict the availability of cheap and high strength alcohol.
In many countries, excise tax rates and pricing do not follow these principles. For example, it is common for wine excise taxes to be set per litre of beverage rather than per litre of ethanol. This means that high strength alcohol products have the same tax per litre as lower strength products.Footnote 10 Many countries have ad valorem (value-based) excise tax rates (i.e. set as a per cent of wholesale price and unrelated to alcohol content) that favour cheap, high strength beverages. Many jurisdictions do not routinely adjust volumetric excise tax rates with the cost of living. As a result, these tax rates decline in value and hence effectiveness over time.Footnote 3 This was the case for Canada between 1985 and 2017.Footnote 11Footnote 12 The only revisions made in that time were to compensate for introducing a 6% GST in 1991Footnote 13 and then reducing this to 5% in 2006.Footnote 14Footnote 15
Another common shortcoming is the practice of applying much higher excise tax rates to products above a particular percentage alcohol content by volume. For example, excise taxes in Canada increase for products above 7% alcohol by volume (ABV); as a consequence, most ciders and coolers have exactly 7% ABV, maximizing the amount of alcohol sold to consumers for the least price. An excise tax that increases continuously and gradually according to the strength of alcoholic drinks should minimize such clustering of relatively strong, low-priced drinks.
While all excise tax rates in Canada are volumetric (volume-based) rather than value-based, they are only “alcohol volumetric” for spirits with ABV greater than 7%. Most Canadian provinces and territories also impose some kind of minimum price on alcohol sales from liquor stores and/or bars and restaurants.Footnote 3 However, these vary greatly in value, comprehensiveness and how they are applied.Footnote 16 For example, some provinces or territories fail to apply minimum prices to all beverage types; set low minimum prices that potentially affect very few products; calculate minimum prices by product volume rather than pure ethanol (i.e. they do not set minimum prices per standard drink or unit); or do not index minimum price rates with inflation.Footnote 3
Given the strong evidence for the effectiveness of minimum pricing as a public health measure,Footnote 17Footnote 18Footnote 19 Wettlaufer et al.Footnote 9 recommended that the federal government encourage a standard national minimum price of at least $1.71 per standard drink (equal to 17.05 mL ethanol), that is, a minimum unit price (MUP).
In this paper, we take advantage of access to unique, detailed datasets from a provincial government alcohol distributor that provide product-level data on prices, alcohol content and sales volumes. These were integrated with other national datasets to help model the effects of excise tax reforms on government revenues, per capita alcohol consumption and alcohol-related harms. We approximated per capita alcohol consumption changes based on published alcohol price elasticity data, and estimated impacts of alcohol consumption changes on health harms using an open access Internet-based modelling tool, the International Model for Alcohol Harms and Policies (InterMAHP).Footnote 20 Specifically, we modelled the following policy scenarios for the fiscal year 2016/17:
- Scenario 1: Revenue-neutral Canadian excise taxes calculated at “uniform” versus “stratified” rates by beverage type and quality class; rates set per litre of pure ethanol while maintaining the tax burden on, and revenues from, alcohol sales constant.
- Scenario 2: Higher inflation-adjusted alcohol excise tax rates calculated to compensate for the absence of adjustments for inflation between the fiscal years 1991/92 and 2016/17.
- Scenario 3: MUPs set at either $1.50 or $1.75 per standard drink applied to all alcohol beverages.
Methods
Overall analytic strategy
For each of the selected tax and price policy scenarios, we proceeded through the following four basic steps:
- We estimated the impact of the policy scenario on the prices of all alcoholic beverages in the Canadian market by beverage type (beers and ciders, wines, spirits) and by three price (“quality”) categories (low, medium, high).
- We estimated how the price changes would affect the consumption of each product in the Canadian market by applying a matrix of price elasticities for each beverage type and quality category as well as cross-price elasticities between each of these categories.
- We estimated how the changes in consumption from Step 2 would affect federal government excise taxation revenues.
- We estimated how the changes in consumption from Step 2 would affect alcohol-attributable morbidity and mortality in Canada using the InterMAHP.Footnote 20
The degree to which the consumption of alcohol responds to changes in price (i.e. the price elasticity of alcoholic beverages)—which is determined by its starting priceFootnote 21—is foundational to the strategy. There is a very wide distribution of alcohol prices in all developed markets, and consumers usually respond differently to price changes to cheap products than they do to expensive ones.
An added complication is that Canadian excise taxes vary substantially by beverage type and by the strength of drinks within these beverage types. In the case of beer, the level of taxation applied also depends on the volume of output of an individual brewery with lower rates applied to smaller producers. To model how price and tax policies would affect consumption overall, we estimated the distribution of alcohol sales by price for each beverage and quality category. To achieve this, we sought comprehensive individual product sales and price data from a provincial government alcohol monopoly. We estimated the distribution of prices per unit (standard drink) of pure alcohol from three samples of such data for the province of British Columbia (BC) and then applied this to national data reported by Statistics Canada on alcohol sales volumes.
Our modelling approach assumes the principle of ceteris paribus, that is, “all else being equal.” Our estimated changes in consumption, revenue and harms assume all other relevant policies, social and economic changes are held constant.
Further details on each of the four methodological steps are provided below, followed by additional details specific to each of the selected tax and price policy scenarios.
Step 1: Estimation of scenario impacts on alcohol prices
We first estimated the exact contributions of excise taxes to the final price of each alcohol product in a detailed price and sales volume dataset from BC. This was necessary in order to estimate how changes to taxation rates would affect the price and, then, the sales volumes of each product, so as to estimate the overall impact of tax changes on total alcohol consumption. We assumed a conservative pass-through of 100% from a tax increase to a price increase.Footnote 22
For the scenarios involving changes in excise taxes, it was necessary to estimate how a specific change in excise tax would change the retail price of each beverage category at each point along the wide distribution of prices within that category of alcoholic beverage. We started with three samples of comprehensive individual product data provided by the BC Liquor Distribution Branch. These comprised reported prices, ethanol contents and sales volumes, one from 2014 (April to August) and two from 2016 (April and May), covering 10 466 individual alcohol products. We analysed these samples separately to test for consistency in estimates of the distributions of the key variables of interest.
Prices of all products were converted to a price per standard drink (equal to 17.05 mL pure alcohol). We calculated the proportion of those prices made up by excise taxes in the target year of 2016 on the basis of beverage type, strength and (in the case of beer) individual brewery. These excise tax price components for each beverage were then adjusted according to each excise tax scenario estimating, in turn, the change in the retail price of each product. Both the retail price per standard drink and the value of excise taxes paid on all individual beverages were then expressed as proportions of the total value of all beverages sold within that category (by beverage type and quality). This meant that the distribution of sales volumes (litres of pure alcohol) could be expressed independently of absolute price levels and of the identity of individual products in a category. These distributions were then adjusted to fit national data on the total volume and value of the sales of alcoholic beverages in Canada by beverage type for the calendar year 2016.
Following Gruenewald et al.,Footnote 21 products in each beverage category were divided into low, medium and high quality groups (terciles) by price per unit of ethanol. Prices per standard drink after the application of sales tax varied between $0.69 for a cheap wine and $1617.23 for the most expensive spirits (Table 1).
Table 1. Summary statistics from the British Columbia product-level dataset, 2016
| Beverage type | Quality | Price per standard drink ($ incl. taxes) | Number of products (n) | Per cent of volume sold, by beverage (%) | ||||
|---|---|---|---|---|---|---|---|---|
| Min. | Average | Median | Max. | Litres of beverage | Litres of ethanol / pure alcohol | |||
| Beer | Low | 0.79 | 1.30 | 1.22 | 1.53 | 218 | 31.4 | 33.3 |
| Medium | 1.53 | 1.69 | 1.55 | 1.84 | 243 | 33.4 | 33.3 | |
| High | 1.84 | 2.97 | 2.37 | 59.42 | 1640 | 35.2 | 33.3 | |
| Wine | Low | 0.69 | 1.23 | 1.19 | 1.47 | 230 | 33.7 | 33.3 |
| Medium | 1.47 | 2.02 | 1.85 | 2.51 | 879 | 33.2 | 33.3 | |
| High | 2.51 | 16.54 | 5.10 | 965.09 | 5128 | 33.1 | 33.3 | |
| Spirits | Low | 0.91 | 1.37 | 1.28 | 1.44 | 181 | 31.2 | 33.3 |
| Medium | 1.44 | 1.50 | 1.35 | 1.56 | 156 | 31.7 | 33.3 | |
| High | 1.56 | 11.67 | 3.13 | 1617.23 | 1392 | 37.2 | 33.3 | |
| Total | 0.69 | 10.51 | 3.06 | 1617.23 | 10 067 | N/A | N/A | |
We applied excise tax rates for beer, wine, spirits and coolers for that year to estimate as closely as possible the precise excise tax collected in BC from each individual product. As these were determined solely by percentage alcohol content by volume and container size for wine and spirits and were available in the price dataset, estimating these rates for these beverages was straightforward. However, federal excise tax rates on beer vary according to the annual volume produced by individual breweries, with lower excise tax rates for smaller producers. For example, rates for regular strength beers (>2.5% ABV) produced by domestic breweries in 2016 rose from $3.122 per 100 litres for the first 200 000 litres produced to $31.22 per 100 litres for all production above 7.5 million litres. We therefore estimated effective average beer excise tax rates for each individual brewery. To determine these rates, we fit logistic curves of recorded sales by brewery against effective tax rates within constraints set by 2016 data on market coverage by beverage type and total BC excise tax revenues collected. This enabled us to calculate excise taxes levied on each individual product and then calculate the total amount of excise taxes collected from each beverage category. We did this by multiplying the taxes levied on each individual product by sales volumes and then scaling these estimates to known national alcohol market parameters (e.g. total litres of ethanol, litres of beverages and dollar values by beverage types and jurisdiction from Statistics Canada) using both geographical and temporal scaling (e.g. provincial-to-national and quarterly-to-yearly, respectively). We obtained national alcohol market parameters from officially recorded salesFootnote 23 and excise tax revenuesFootnote 2 using reported excise tax rates for the 2016/17 fiscal year.Footnote 12
Assumed MUPs of $1.50 or $1.75 for Scenario 3 led to a more straightforward process for calculating price changes. Prices of all products in each price dataset that were below a new minimum per standard drink were simply adjusted upwards to reflect the new assumed minimum. We used this conservative approach because evidence shows that an increase in minimum prices can also cause increases in the price of products above the new minimum price.Footnote 18
Step 2: Estimating effects of price changes on alcohol consumption
Any change in the way alcohol is taxed or priced affects the level of its consumption. The extent of consumption change in response to a price change is measured by its price elasticity. Price elasticity estimates the percentage change in consumption for a 1% change in price. Also, any change in consumption of any one beverage (e.g. wine) affects levels of consumption of other competing alcoholic beverages (e.g. spirits and beer). These “cross-price elasticities” are also influenced strongly by beverage quality (indexed by the relative prices of different beverages of the same type).Footnote 21 We estimated a matrix of such elasticities by applying alcohol price and cross-price elasticities reported for Canada,Footnote 18Footnote 24 with modifications by quality tercile following estimates made for Sweden.Footnote 21
Gruenewald et al. performed a unique analysis of detailed price and sales data provided by the Swedish government alcohol retail sales monopoly, Systembolaget, before and after a sudden change in the way alcohol prices were calculated.Footnote 21 In broad terms, they analyzed the market for a “complex good,” such as alcohol with thousands of unique products arranged along a price-quality “spectrum” (the full price range over which competing products varyFootnote 25). “Quality classes” are represented along this spectrum by relative prices in which relatively lower cost goods represent lower quality goods, relatively higher priced goods represent higher quality goods, and so on.Footnote 26Footnote 27
Defining “low,” “medium” and “high” quality class beverages by beverage type, as above, Gruenewald et al.Footnote 21 examined the effect of a substantial increase in value-based taxes on wine and spirits and a per unit liquid volume tax for all alcoholic beverages on alcohol sales. They found that consumers did substitute between beverage quality classes and demonstrated that price elasticities related to price increases on lower quality goods were much greater than price elasticities related to price increases on high quality goods.Footnote 21 The many more options for quality substitutions available among high quality products enabled consumers of these products to substitute to lower quality products when faced with higher prices; these options are not always available to consumers of lower quality products. Not surprisingly, studies of tax pass-throughs have demonstrated that the alcohol industry knows this well; in the face of tax increases, prices on costly products are disproportionately increased over those of less costly products.Footnote 28Footnote 29
Following on this work, we defined three “own-price” (beer, wine and spirits) and two “cross-price” elasticities between quality classes for each beverage type (e.g. beer and wine, beer and spirits). “Own-price” elasticity is an estimate of how changes to the price of a particular product affect sales. “Cross-price” elasticity is an estimate of how sales of product are affected by changes in price of a different product. We then anchored these ratios by requiring that the overall own-price elasticities matched those estimated for Canada by Hill-McManus et al.Footnote 24 We then used the resulting matrix of price elasticities to estimate how the mean price per litre of all beverage categories (by type and quality) would affect consumption. The resulting elasticity matrix is shown in Table 2.
Table 2. Ratios of alcohol price elasticities by beverage type and quality or price per litre of ethanol
| Beverage category | Effects of beverages of … | Beer | Wine | Spirits | Coolers | Ciders |
|---|---|---|---|---|---|---|
| Own-price elasticities | Equal quality | −0.591 | −0.415 | −0.436 | −0.362 | −0.362 |
| Within-beverage cross-price elasticities | Lower quality | 0.250 | 0.240 | 0.168 | 0.153 | 0.153 |
| Higher quality | 0.417 | 0.080 | −0.016 | 0.255 | 0.255 | |
| Cross-beverage price elasticities | Lower quality | 0.062 | 0.075 | 0.074 | 0.038 | 0.038 |
| Higher quality | −0.078 | −0.096 | −0.051 | −0.048 | −0.048 | |
To estimate the impacts of price changes on overall consumption, we first assigned all products to low, medium and high quality categories (terciles) based on their price per standard drink, and determined average price per litre of beverage in each category. We then compared how these mean prices would change in each scenario and applied the appropriate price elasticities shown in Table 2 to estimate changes in consumption. We assumed elasticities would work independently, that is, the total change in consumption for a given quality category was computed as the simple sum of the changes in consumption expected from the price changes under a given scenario.
Within beverage types, quality categories are equally distributed by sales of ethanol so the change in ethanol consumption by beverage type was computed by a simple mean of the values for each quality category. Total change in ethanol consumption was computed by a weighted mean, where the weights were given by total ethanol sales. This elasticity strategy was applied in all scenarios that report changes in consumption.
Step 3: Estimating impacts of consumption change on federal excise tax revenues
To determine changes in collected tax or revenue resulting from a change in consumption, we estimated changes in consumption for sales of each beverage quality class. We then combined the new sales estimates with the new prices used in each scenario, and summed them all to produce new total sales and tax figures. We then scaled our market coverage parameters to reproduce yearly national figures on the assumption that the distribution of BC alcohol prices was broadly representative of the nation. Because the estimated distribution of prices per standard drink was expressed in terms of percentages of both the total value and volume (in litres of ethanol) of the BC alcohol market, the assumption that this distribution applies to the whole of Canada is independent of the identity of the products sold, the level of overall consumption or the actual prices paid.
Step 4: Estimation of impacts of changes in alcohol consumption on mortality and morbidity under each policy scenario
Applying and developing methods used originally in the World Health Organization (WHO) Global Burden of Disease StudyFootnote 30 with updated systematic reviews and meta-analyses, we used InterMAHP to estimate the impacts of alcohol consumption changes on alcohol-caused mortality and morbidity. InterMAHP was created to estimate alcohol-attributable fractions for 43 disease and injury types partially attributable to alcohol use.Footnote 20 The second version of this resource has a feature that enables calculating changes in rates of harm due to changes in per capita consumption.Footnote 20Footnote 31 Notable assumptions applied in InterMAHP for these purposes are that (1) a continuous distribution of drinking levels across any population follows a gamma distribution (as demonstrated and described for multiple countries, including Canada, by Kehoe et al.Footnote 32); and (2) change in 100% alcohol-attributable conditions due to a change in per capita consumption can be estimated by an absolute risk function calibrated to the observed incidence of each condition.Footnote 31Footnote 33
To perform such estimations, it is first necessary to have reliable estimates of per capita consumption for the population in the year of interest; an estimate of additional unrecorded consumption; and data on numbers of deaths and hospitalizations associated with diagnoses either fully or partially attributable to alcohol use. In the current study, we obtained per capita consumption data for BC and Canada as a whole from Statistics CanadaFootnote 34 and applied an assumed 10.1% unrecorded alcohol consumption for Canada using the WHO Global Information System on Alcohol and Health (GISAH).Footnote 35 Data sourced originally from the Canadian Institute for Health Information (CIHI) on hospitalizations and from Statistics Canada on deaths were provided by the Canadian Substance Use Costs and Harms studyFootnote 1 for the year 2016 for all Canadian jurisdictions.
All estimates of alcohol-attributable morbidity and mortality and changes in these under each scenario were calculated by applying InterMAHP.Footnote 20 When estimating the impacts of changes in per capita consumption on harm, InterMAHP assumes all changes are accrued immediately, even for impacts on long-term chronic illnesses.Footnote 20 Population rates for some of these, such as liver cirrhosis, have been shown to respond immediately to changes in population consumption, while others, such as cancers, likely would respond over a longer time. Our methods thus count both the immediate and future effects caused by consumption changes, as if the policies had been implemented far enough in the past for longer-term health benefits to accrue.
Scenario 1: Calculating revenue-neutral alcohol volumetric excise tax rates and structures
In calculating the impacts on alcohol sales and related morbidity and mortality in 2016/17 had Canada implemented revenue-neutral volumetric excise tax rates, we considered two different tax structures: (1a) taxes distributed at a standard “unified” rate by volume of alcohol in each product; and (1b) taxes “stratified” by beverage type by volume of alcohol in each product.
In brief, we adjusted the portion of each product’s retail price in 2016/17 due to excise taxes as required by each scenario and then scaled the distribution of taxes to assure revenue neutrality (i.e. produce the same revenue observed in 2016/17) – total alcohol revenues from 1a and beverage-specific revenues for 1b. We constructed an input vector θ of ethanol volumetric excise tax rates whose output would match a vector V of estimated volumetric excise taxes collected for all three scenarios. We defined the distance between our prospective scenario and the existing tax structure as the Euclidean distance to the vector Cof estimated excise tax collected under the current structure:
The composition of these two functions produced a single-valued multivariable function L(θ) that we could then optimize (i.e. find the minimum value of L). When the input and output vectors were one-dimensional (scenario 1a), we applied the base R uniroot function.Footnote 36 When input and output were multidimensional (scenario 1b), we applied simultaneous perturbation stochastic approximation techniquesFootnote 37 to optimize the loss function.
In each scenario, we estimated ethanol volumetric excise tax rates that replicated, as closely as possible, total excise tax revenues collected under the current structure using the techniques described.
Scenario 1a applied a unified AVT for all beverages, estimated to be $6.705 per litre of ethanol. Scenario 1b involved calculating separate stratified AVT rates to deliver revenue neutrality for each beverage type, estimated at $4.679 for beer, $4.769 for wine and $11.454 for spirits.
Scenario 2: Calculating inflation-adjusted excise tax rates to compensate for the lack of adjustment from 1991/92 to 2016/17
Point estimate for 2016/17
In Scenario 2, we first estimated the change in alcohol consumption and alcohol-attributable morbidity and mortality that would occur from an increase in excise taxes in 2016/17 that corrected for cumulative inflation from 1991/92 to 2016/17. For this scenario, we applied the same methods used in Scenario 1b for stratified AVTs, but now working with initial excise tax rates adjusted by cumulative inflation from 1991/92 to 2016/17, estimated at 1.5535 for that period or +55.35%.
Cumulative estimate for 1991/91 to 2016/17
We then estimated the cumulative impacts on consumption, revenue and harms of past failures to adjust excise tax rates. We assumed a counterfactual scenario in which excise rates had kept up with inflation from 1991/92 to 2016/17. We applied a compounded inflation rate, acquired from the Bank of Canada, to estimate excise taxes collected at the product level adjusted for inflation since 1991/92. For example, if the rate for a given product was $0.10 per litre of beverage and inflation was +50%, then the rate would be increased to $0.15 per litre of beverage. These new rates produced new prices across all beverage quality groups.
We estimated total excise taxes foregone by the Canadian government resulting from the failure to index these between 1991/92 and 2016/17. We accessed archived and current Statistics Canada data of total alcohol sales (in dollars and litres).Footnote 23Footnote 33Footnote 38Footnote 39Footnote 40 Data for total litres of beverage sold were available for all years of study, but revenues were only available from 1993/94 to 2016/17 and excise taxation data were only available from 2004/5 to 2016/17. Revenues were imputed from total litres of beverage sales data, and excise collection was imputed from the Consumer Price Index using non-Bayesian linear regression method as implemented in the R package “mice.”Footnote 41
To implement the selected scenario where excise rates would have tracked inflation, we used consumption, price, and excise collection data to create a series of year over year per cent changes from 1991/92. We used these per cent changes to encode the assumed grandly exogenous factors that historically alter changes in price and consumption. Our prospective scenario induces relatively small changes in these factors, determined by the following iterative method.
Given each year’s beverage product price, and the proportion of that price that was due to excise taxation, we first increased the amount due to excise taxes by that year’s inflation rate. We then assumed that 100% of this inflated amount would be passed onto consumers.Footnote 22Footnote 42 The resulting price change was then assumed to affect subsequent sales with an elasticity of −0.44,Footnote 6 leading to changes in consumption that then affected net revenue; prospective excise collection was then determined as a proportion of net sales. These changes in consumption were then carried over to the following year’s prospective excise scenario. Sources of uncertainty were taken both from the Wagenaar et al. estimate of overall alcohol price elasticity and the method of imputation for historical excise duty rates.Footnote 6 These uncertainties were then used in Monte Carlo simulations with 10 000 draws to construct 95% confidence intervals, that is, a parametric bootstrap.
We estimated cumulative harms incurred from lack of indexing by a simple extrapolation from the preventable hospitalizations and deaths estimated in 2016/17. The 95% confidence interval endpoints were used to estimate the lower and upper bounds on preventable harms in 2017. These harms were projected over the period of 1991/92 to 2016/17 by assuming a linear relationship between population and preventable harms. We then rounded preventable deaths to the hundreds, and preventable hospitalizations to the thousands, to reflect the simplicity of this estimate.
Scenario 3: Estimating effects of an MUP set at $1.50 or $1.75 per standard drink
We computed each product’s price per standard drink and raised the price of each product that fell below the proposed minimum to the proposed minimum price for all products. This selective price increase changed the mean price per litre of beverage quality classes having at least one product that fell below the threshold. As before, we used these adjusted prices and the elasticities in Table 2 to estimate expected changes in consumption, one for each dataset, and proposed minimum price per standard drink.
Results
Precision of estimated distributions of ethanol sales by prices per standard drink
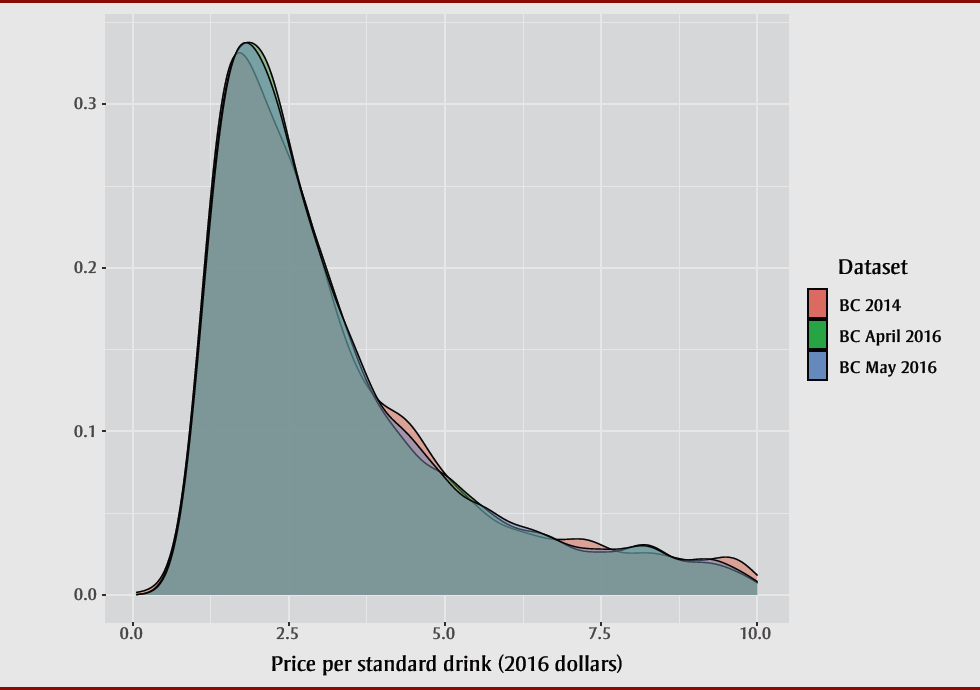
The distributions of ethanol sales volumes by price paid per standard drink across the three BC product-level prices and sales samples were very similar (Figure 1). We estimated the extent of overlaps between samples using 10 000 bootstrap samples calculated using the overlapping R package.Footnote 43 Resulting median estimates and 95% confidence limits demonstrated the following overlaps: 89.05% (87.17–90.83%) between the BC 2014 and BC April 2016 prices paid per standard drink; 88.48% (86.76–90.10%) between the BC 2014 and BC May 2016 prices paid per standard drink; and 92.44% (90.90–93.75%) between the BC April 2016 and BC May 2016 prices paid per standard drink.
Figure 1. Probability distributions of ethanol sales by price per standard drink for three product-level samples from British Columbia (BC), 2014–2016
Text description: Figure 1
Figure 1. Probability distributions of ethanol sales by price per standard drink for three product-level samples from British Columbia (BC), 2014–2016
| Price per standard drink (2016 dollars) | BC 2014 probability distribution | BC April 2016 probability distribution | BC May 2016 probability distribution |
|---|---|---|---|
| 0.061131826 | 0.002123029 | 0.000631 | 0.000563 |
| 0.080580729 | 0.002327965 | 0.000753 | 0.000672 |
| 0.100029632 | 0.002554816 | 0.000896 | 0.000799 |
| 0.119478535 | 0.002805799 | 0.001065705 | 0.000952 |
| 0.138927437 | 0.003083256 | 0.001264503 | 0.001129958 |
| 0.158376340 | 0.003396011 | 0.001493458 | 0.001334879 |
| 0.177825243 | 0.003749251 | 0.001755951 | 0.001570046 |
| 0.197274146 | 0.004140926 | 0.002055580 | 0.001838761 |
| 0.216723049 | 0.004574506 | 0.002401051 | 0.002154547 |
| 0.236171951 | 0.005053612 | 0.002803376 | 0.002518016 |
| 0.255620854 | 0.005598386 | 0.003259355 | 0.002930692 |
| 0.275069757 | 0.006206063 | 0.003774048 | 0.003397352 |
| 0.294518660 | 0.006877136 | 0.004352757 | 0.003923019 |
| 0.313967563 | 0.007616543 | 0.005001028 | 0.004523332 |
| 0.333416465 | 0.008430452 | 0.005749248 | 0.005209547 |
| 0.352865368 | 0.009355566 | 0.006585418 | 0.005977242 |
| 0.372314271 | 0.010372028 | 0.007515314 | 0.006832961 |
| 0.391763174 | 0.011486045 | 0.008545850 | 0.007783467 |
| 0.411212077 | 0.012703959 | 0.009684128 | 0.008841904 |
| 0.430660979 | 0.014045629 | 0.010958938 | 0.010041452 |
| 0.450109882 | 0.015540865 | 0.012377511 | 0.011364227 |
| 0.469558785 | 0.017168188 | 0.013932842 | 0.012818031 |
| 0.489007688 | 0.018934711 | 0.015632772 | 0.014410743 |
| 0.508456591 | 0.020847587 | 0.017485170 | 0.016150308 |
| 0.527905493 | 0.022948432 | 0.019507212 | 0.018091056 |
| 0.547354396 | 0.025243080 | 0.021742749 | 0.020206441 |
| 0.566803299 | 0.027713599 | 0.024160507 | 0.022499249 |
| 0.586252202 | 0.030366780 | 0.026767806 | 0.024977014 |
| 0.605701105 | 0.033209281 | 0.029571718 | 0.027647070 |
| 0.625150007 | 0.036310436 | 0.032579049 | 0.030555994 |
| 0.644598910 | 0.039632306 | 0.035847864 | 0.033699813 |
| 0.664047813 | 0.043167301 | 0.039349639 | 0.037060480 |
| 0.683496716 | 0.046919979 | 0.043076174 | 0.040642966 |
| 0.702945618 | 0.050902123 | 0.047031478 | 0.044451697 |
| 0.722394521 | 0.055186634 | 0.051218928 | 0.048514368 |
| 0.741843424 | 0.059701130 | 0.055669701 | 0.052858628 |
| 0.761292327 | 0.064446344 | 0.060398693 | 0.057438524 |
| 0.780741230 | 0.069422411 | 0.065364165 | 0.062254030 |
| 0.800190132 | 0.074658279 | 0.070564590 | 0.067304272 |
| 0.819639035 | 0.080173777 | 0.075997495 | 0.072591149 |
| 0.839087938 | 0.085910205 | 0.081660697 | 0.078171931 |
| 0.858536841 | 0.091862304 | 0.087609757 | 0.083973593 |
| 0.877985744 | 0.098024095 | 0.093770698 | 0.089989405 |
| 0.897434646 | 0.104430876 | 0.100134803 | 0.096211680 |
| 0.916883549 | 0.111049009 | 0.106692328 | 0.102631774 |
| 0.936332452 | 0.117839641 | 0.113432507 | 0.109279372 |
| 0.955781355 | 0.124791052 | 0.120371042 | 0.116106005 |
| 0.975230258 | 0.131890846 | 0.127473221 | 0.123085372 |
| 0.994679160 | 0.139159428 | 0.134705268 | 0.130203290 |
| 1.014128063 | 0.146536185 | 0.142050868 | 0.137444835 |
| 1.033576966 | 0.153999310 | 0.149492992 | 0.144806278 |
| 1.053025869 | 0.161532041 | 0.157017541 | 0.152260232 |
| 1.072474772 | 0.169118404 | 0.164603696 | 0.159772523 |
| 1.091923674 | 0.176734343 | 0.172214691 | 0.167324954 |
| 1.111372577 | 0.184345306 | 0.179830798 | 0.174899077 |
| 1.130821480 | 0.191932631 | 0.187432198 | 0.182474606 |
| 1.150270383 | 0.199477661 | 0.194999022 | 0.190018244 |
| 1.169719286 | 0.206947534 | 0.202489025 | 0.197511103 |
| 1.189168188 | 0.214302979 | 0.209886590 | 0.204934925 |
| 1.208617091 | 0.221540538 | 0.217175866 | 0.212271791 |
| 1.228065994 | 0.228643142 | 0.224338971 | 0.219504151 |
| 1.247514897 | 0.235594121 | 0.231358652 | 0.226572425 |
| 1.266963800 | 0.242328674 | 0.238192960 | 0.233486767 |
| 1.286412702 | 0.248843458 | 0.244814337 | 0.240235729 |
| 1.305861605 | 0.255146260 | 0.251235525 | 0.246805736 |
| 1.325310508 | 0.261224986 | 0.257444701 | 0.253184014 |
| 1.344759411 | 0.267068219 | 0.263431109 | 0.259315332 |
| 1.364208313 | 0.272574869 | 0.269179384 | 0.265201947 |
| 1.383657216 | 0.277812553 | 0.274617879 | 0.270858287 |
| 1.403106119 | 0.282780696 | 0.279804894 | 0.276277282 |
| 1.422555022 | 0.287473949 | 0.284736612 | 0.281452797 |
| 1.442003925 | 0.291866625 | 0.289410326 | 0.286351630 |
| 1.461452827 | 0.295892818 | 0.293824425 | 0.290947044 |
| 1.480901730 | 0.299633886 | 0.297925892 | 0.295286140 |
| 1.500350633 | 0.303090391 | 0.301746611 | 0.299368339 |
| 1.519799536 | 0.306263543 | 0.305313652 | 0.303193830 |
| 1.539248439 | 0.309108286 | 0.308631189 | 0.306757406 |
| 1.558697341 | 0.311624804 | 0.311704129 | 0.309997670 |
| 1.578146244 | 0.313872936 | 0.314517617 | 0.312990014 |
| 1.597595147 | 0.315858339 | 0.317055405 | 0.315738615 |
| 1.617044050 | 0.317587104 | 0.319374068 | 0.318248094 |
| 1.636492953 | 0.319002981 | 0.321481414 | 0.320523502 |
| 1.655941855 | 0.320160948 | 0.323385428 | 0.322517350 |
| 1.675390758 | 0.321093549 | 0.325094230 | 0.324280138 |
| 1.694839661 | 0.321809267 | 0.326569395 | 0.325832291 |
| 1.714288564 | 0.322316777 | 0.327867589 | 0.327180417 |
| 1.733737467 | 0.322559588 | 0.329000988 | 0.328331223 |
| 1.753186369 | 0.322622443 | 0.329976850 | 0.329263281 |
| 1.772635272 | 0.322514859 | 0.330802092 | 0.329989644 |
| 1.792084175 | 0.322246005 | 0.331462279 | 0.330544783 |
| 1.811533078 | 0.321812082 | 0.331968789 | 0.330935191 |
| 1.830981981 | 0.321204557 | 0.332346171 | 0.331167219 |
| 1.850430883 | 0.320472856 | 0.332598542 | 0.331236836 |
| 1.869879786 | 0.319625432 | 0.332729527 | 0.331129888 |
| 1.889328689 | 0.318670582 | 0.332737532 | 0.330887060 |
| 1.908777592 | 0.317600185 | 0.332601462 | 0.330513453 |
| 1.928226494 | 0.316429938 | 0.332352615 | 0.330013934 |
| 1.947675397 | 0.315183699 | 0.331991954 | 0.329393133 |
| 1.967124300 | 0.313868207 | 0.331520138 | 0.328623548 |
| 1.986573203 | 0.312489980 | 0.330937545 | 0.327742560 |
| 2.006022106 | 0.311042272 | 0.330219680 | 0.326755237 |
| 2.025471008 | 0.309545738 | 0.329382687 | 0.325664793 |
| 2.044919911 | 0.308009410 | 0.328434413 | 0.324474252 |
| 2.064368814 | 0.306437887 | 0.327374627 | 0.323167447 |
| 2.083817717 | 0.304835058 | 0.326203163 | 0.321758406 |
| 2.103266620 | 0.303198840 | 0.324908009 | 0.320259078 |
| 2.122715522 | 0.301542773 | 0.323480622 | 0.318671677 |
| 2.142164425 | 0.299869518 | 0.321942785 | 0.316998355 |
| 2.161613328 | 0.298181510 | 0.320295599 | 0.315231674 |
| 2.181062231 | 0.296479826 | 0.318540474 | 0.313369592 |
| 2.200511134 | 0.294765960 | 0.316679141 | 0.311429817 |
| 2.219960036 | 0.293043899 | 0.314685224 | 0.309414614 |
| 2.239408939 | 0.291314384 | 0.312591795 | 0.307326336 |
| 2.258857842 | 0.289577974 | 0.310403150 | 0.305165245 |
| 2.278306745 | 0.287833600 | 0.308123176 | 0.302919377 |
| 2.297755648 | 0.286081400 | 0.305756103 | 0.300610926 |
| 2.317204550 | 0.284321835 | 0.303293685 | 0.298243074 |
| 2.336653453 | 0.282554248 | 0.300748383 | 0.295819158 |
| 2.356102356 | 0.280777862 | 0.298135806 | 0.293342666 |
| 2.375551259 | 0.278988030 | 0.295461866 | 0.290806737 |
| 2.395000162 | 0.277185361 | 0.292732660 | 0.288226823 |
| 2.414449064 | 0.275369103 | 0.289952139 | 0.285609639 |
| 2.433897967 | 0.273537887 | 0.287123042 | 0.282959463 |
| 2.453346870 | 0.271689563 | 0.284263396 | 0.280280644 |
| 2.472795773 | 0.269816366 | 0.281379722 | 0.277574814 |
| 2.492244676 | 0.267922220 | 0.278478477 | 0.274849867 |
| 2.511693578 | 0.266005725 | 0.275566030 | 0.272113385 |
| 2.531142481 | 0.264065518 | 0.272649908 | 0.269369641 |
| 2.550591384 | 0.262096580 | 0.269739346 | 0.266622801 |
| 2.570040287 | 0.260094269 | 0.266839828 | 0.263877459 |
| 2.589489189 | 0.258063449 | 0.263956359 | 0.261140383 |
| 2.608938092 | 0.256003271 | 0.261093611 | 0.258414519 |
| 2.628386995 | 0.253912970 | 0.258259746 | 0.255702875 |
| 2.647835898 | 0.251784555 | 0.255461788 | 0.253008213 |
| 2.667284801 | 0.249620465 | 0.252698009 | 0.250333043 |
| 2.686733703 | 0.247424771 | 0.249970608 | 0.247686979 |
| 2.706182606 | 0.245197535 | 0.247281351 | 0.245065721 |
| 2.725631509 | 0.242938928 | 0.244631995 | 0.242470230 |
| 2.745080412 | 0.240639476 | 0.242034449 | 0.239901353 |
| 2.764529315 | 0.238309256 | 0.239477101 | 0.237359695 |
| 2.783978217 | 0.235950331 | 0.236959238 | 0.234851467 |
| 2.803427120 | 0.233563732 | 0.234479826 | 0.232373202 |
| 2.822876023 | 0.231149143 | 0.232037525 | 0.229921973 |
| 2.842324926 | 0.228702893 | 0.229636805 | 0.227497272 |
| 2.861773829 | 0.226234719 | 0.227271349 | 0.225098490 |
| 2.881222731 | 0.223746349 | 0.224935140 | 0.222727967 |
| 2.900671634 | 0.221239576 | 0.222625723 | 0.220385631 |
| 2.920120537 | 0.218714252 | 0.220340589 | 0.218066219 |
| 2.939569440 | 0.216173378 | 0.218078561 | 0.215768957 |
| 2.959018343 | 0.213622458 | 0.215838371 | 0.213493107 |
| 2.978467245 | 0.211063664 | 0.213612998 | 0.211238790 |
| 2.997916148 | 0.208499194 | 0.211400246 | 0.209009540 |
| 3.017365051 | 0.205931530 | 0.209198056 | 0.206799489 |
| 3.036813954 | 0.203364990 | 0.207004515 | 0.204608285 |
| 3.056262857 | 0.200802117 | 0.204819018 | 0.202435638 |
| 3.075711759 | 0.198245157 | 0.202638172 | 0.200281318 |
| 3.095160662 | 0.195696345 | 0.200460702 | 0.198149833 |
| 3.114609565 | 0.193163115 | 0.198285748 | 0.196037141 |
| 3.134058468 | 0.190645042 | 0.196112615 | 0.193942365 |
| 3.153507370 | 0.188143999 | 0.193940902 | 0.191865426 |
| 3.172956273 | 0.185662007 | 0.191770249 | 0.189806230 |
| 3.192405176 | 0.183203000 | 0.189600505 | 0.187767674 |
| 3.211854079 | 0.180775137 | 0.187431814 | 0.185748638 |
| 3.231302982 | 0.178374072 | 0.185264424 | 0.183746488 |
| 3.250751884 | 0.176001473 | 0.183098741 | 0.181760814 |
| 3.270200787 | 0.173658959 | 0.180936037 | 0.179791133 |
| 3.289649690 | 0.171354156 | 0.178776520 | 0.177838160 |
| 3.309098593 | 0.169090086 | 0.176620895 | 0.175902654 |
| 3.328547496 | 0.166861947 | 0.174469925 | 0.173980464 |
| 3.347996398 | 0.164670931 | 0.172324427 | 0.172070726 |
| 3.367445301 | 0.162518172 | 0.170186950 | 0.170172549 |
| 3.386894204 | 0.160416001 | 0.168058200 | 0.168285038 |
| 3.406343107 | 0.158358776 | 0.165938689 | 0.166409669 |
| 3.425792010 | 0.156343597 | 0.163829552 | 0.164542380 |
| 3.445240912 | 0.154371176 | 0.161731975 | 0.162682405 |
| 3.464689815 | 0.152442367 | 0.159648598 | 0.160829060 |
| 3.484138718 | 0.150573846 | 0.157583064 | 0.158981753 |
| 3.503587621 | 0.148750306 | 0.155534188 | 0.157141147 |
| 3.523036524 | 0.146972086 | 0.153503418 | 0.155306211 |
| 3.542485426 | 0.145239485 | 0.151492228 | 0.153476619 |
| 3.561934329 | 0.143557409 | 0.149502113 | 0.151652677 |
| 3.581383232 | 0.141933680 | 0.147541543 | 0.149834866 |
| 3.600832135 | 0.140356176 | 0.145606779 | 0.148024991 |
| 3.620281038 | 0.138824893 | 0.143698805 | 0.146225036 |
| 3.639729940 | 0.137339787 | 0.141819030 | 0.144435244 |
| 3.659178843 | 0.135909812 | 0.139968810 | 0.142657196 |
| 3.678627746 | 0.134533292 | 0.138154705 | 0.140892620 |
| 3.698076649 | 0.133202195 | 0.136377741 | 0.139144312 |
| 3.717525552 | 0.131916197 | 0.134634672 | 0.137419240 |
| 3.736974454 | 0.130674936 | 0.132926329 | 0.135715754 |
| 3.756423357 | 0.129490714 | 0.131253432 | 0.134036185 |
| 3.775872260 | 0.128352821 | 0.129618262 | 0.132382875 |
| 3.795321163 | 0.127257430 | 0.128028808 | 0.130758177 |
| 3.814770065 | 0.126203825 | 0.126476151 | 0.129173814 |
| 3.834218968 | 0.125192217 | 0.124960228 | 0.127625634 |
| 3.853667871 | 0.124233649 | 0.123480852 | 0.126114443 |
| 3.873116774 | 0.123313039 | 0.122037706 | 0.124642048 |
| 3.892565677 | 0.122429202 | 0.120638177 | 0.123210089 |
| 3.912014579 | 0.121580886 | 0.119275577 | 0.121828003 |
| 3.931463482 | 0.120770600 | 0.117946563 | 0.120494836 |
| 3.950912385 | 0.119999556 | 0.116650141 | 0.119205937 |
| 3.970361288 | 0.119257737 | 0.115385227 | 0.117961550 |
| 3.989810191 | 0.118543347 | 0.114153826 | 0.116761659 |
| 4.009259093 | 0.117854521 | 0.112955898 | 0.115610153 |
| 4.028707996 | 0.117193591 | 0.111784522 | 0.114510551 |
| 4.048156899 | 0.116555126 | 0.110638268 | 0.113452308 |
| 4.067605802 | 0.115933479 | 0.109515685 | 0.112433830 |
| 4.087054705 | 0.115326356 | 0.108415309 | 0.111453307 |
| 4.106503607 | 0.114731421 | 0.107340972 | 0.110509077 |
| 4.125952510 | 0.114147800 | 0.106284807 | 0.109606940 |
| 4.145401413 | 0.113569204 | 0.105245418 | 0.108733652 |
| 4.164850316 | 0.112992768 | 0.104221518 | 0.107886443 |
| 4.184299219 | 0.112416088 | 0.103211884 | 0.107062481 |
| 4.203748121 | 0.111836483 | 0.102217424 | 0.106258884 |
| 4.223197024 | 0.111248398 | 0.101235852 | 0.105475571 |
| 4.242645927 | 0.110650611 | 0.100264936 | 0.104705559 |
| 4.262094830 | 0.110041094 | 0.099304080 | 0.103944876 |
| 4.281543733 | 0.109417902 | 0.098352810 | 0.103190895 |
| 4.300992635 | 0.108776557 | 0.097411367 | 0.102441103 |
| 4.320441538 | 0.108112697 | 0.096481143 | 0.101692878 |
| 4.339890441 | 0.107428646 | 0.095560219 | 0.100942817 |
| 4.359339344 | 0.106723297 | 0.094648941 | 0.100189028 |
| 4.378788246 | 0.105995669 | 0.093747773 | 0.099430030 |
| 4.398237149 | 0.105239185 | 0.092857296 | 0.098664533 |
| 4.417686052 | 0.104455656 | 0.091981372 | 0.097890928 |
| 4.437134955 | 0.103647980 | 0.091119057 | 0.097106439 |
| 4.456583858 | 0.102816218 | 0.090270745 | 0.096312639 |
| 4.476032760 | 0.101960558 | 0.089437449 | 0.095509365 |
| 4.495481663 | 0.101073945 | 0.088620195 | 0.094696596 |
| 4.514930566 | 0.100164621 | 0.087822434 | 0.093874451 |
| 4.534379469 | 0.099234287 | 0.087046361 | 0.093040908 |
| 4.553828372 | 0.098284021 | 0.086289931 | 0.092198913 |
| 4.573277274 | 0.097313911 | 0.085553840 | 0.091349325 |
| 4.592726177 | 0.096322405 | 0.084838665 | 0.090492800 |
| 4.612175080 | 0.095316658 | 0.084145184 | 0.089630027 |
| 4.631623983 | 0.094298271 | 0.083479377 | 0.088760906 |
| 4.651072886 | 0.093268875 | 0.082835034 | 0.087887007 |
| 4.670521788 | 0.092229125 | 0.082211741 | 0.087009625 |
| 4.689970691 | 0.091181873 | 0.081608898 | 0.086129423 |
| 4.709419594 | 0.090130607 | 0.081025721 | 0.085247033 |
| 4.728868497 | 0.089076975 | 0.080464464 | 0.084362980 |
| 4.748317400 | 0.088022598 | 0.079921273 | 0.083478044 |
| 4.767766302 | 0.086970040 | 0.079392710 | 0.082592995 |
| 4.787215205 | 0.085921613 | 0.078877042 | 0.081708283 |
| 4.806664108 | 0.084878465 | 0.078372435 | 0.080824346 |
| 4.826113011 | 0.083841834 | 0.077877452 | 0.079941645 |
| 4.845561914 | 0.082812897 | 0.077389785 | 0.079061301 |
| 4.865010816 | 0.081796551 | 0.076905487 | 0.078183440 |
| 4.884459719 | 0.080790959 | 0.076422559 | 0.077308575 |
| 4.903908622 | 0.079796717 | 0.075939065 | 0.076437261 |
| 4.923357525 | 0.078814444 | 0.075453138 | 0.075570097 |
| 4.942806428 | 0.077845827 | 0.074961195 | 0.074709208 |
| 4.962255330 | 0.076894036 | 0.074462169 | 0.073854929 |
| 4.981704233 | 0.075955713 | 0.073955023 | 0.073007825 |
| 5.001153136 | 0.075030958 | 0.073438736 | 0.072168851 |
| 5.020602039 | 0.074119816 | 0.072912458 | 0.071339018 |
| 5.040050941 | 0.073224708 | 0.072373876 | 0.070521227 |
| 5.059499844 | 0.072345347 | 0.071822504 | 0.069717358 |
| 5.078948747 | 0.071478986 | 0.071259982 | 0.068926990 |
| 5.098397650 | 0.070625327 | 0.070686515 | 0.068151276 |
| 5.117846553 | 0.069784043 | 0.070102451 | 0.067391352 |
| 5.137295455 | 0.068957898 | 0.069507972 | 0.066649555 |
| 5.156744358 | 0.068143900 | 0.068901986 | 0.065930591 |
| 5.176193261 | 0.067340589 | 0.068288006 | 0.065231226 |
| 5.195642164 | 0.066547529 | 0.067666931 | 0.064552159 |
| 5.215091067 | 0.065764373 | 0.067039691 | 0.063893968 |
| 5.234539969 | 0.064993590 | 0.066407230 | 0.063257109 |
| 5.253988872 | 0.064231308 | 0.065769917 | 0.062648059 |
| 5.273437775 | 0.063477164 | 0.065129655 | 0.062060990 |
| 5.292886678 | 0.062730814 | 0.064487580 | 0.061495150 |
| 5.312335581 | 0.061992684 | 0.063844444 | 0.060950052 |
| 5.331784483 | 0.061263402 | 0.063200938 | 0.060425062 |
| 5.351233386 | 0.060540885 | 0.062557794 | 0.059922869 |
| 5.370682289 | 0.059825010 | 0.061915890 | 0.059439952 |
| 5.390131192 | 0.059115681 | 0.061275520 | 0.058972995 |
| 5.409580095 | 0.058414174 | 0.060636992 | 0.058520599 |
| 5.429028997 | 0.057720298 | 0.060000564 | 0.058081292 |
| 5.448477900 | 0.057033137 | 0.059366448 | 0.057654554 |
| 5.467926803 | 0.056352860 | 0.058735571 | 0.057238513 |
| 5.487375706 | 0.055679668 | 0.058107436 | 0.056829408 |
| 5.506824609 | 0.055016183 | 0.057482110 | 0.056425680 |
| 5.526273511 | 0.054361198 | 0.056859704 | 0.056025820 |
| 5.545722414 | 0.053714599 | 0.056240338 | 0.055628388 |
| 5.565171317 | 0.053076780 | 0.055624717 | 0.055231586 |
| 5.584620220 | 0.052448456 | 0.055013018 | 0.054833719 |
| 5.604069122 | 0.051833347 | 0.054405067 | 0.054433878 |
| 5.623518025 | 0.051228829 | 0.053801141 | 0.054031285 |
| 5.642966928 | 0.050635348 | 0.053201552 | 0.053625295 |
| 5.662415831 | 0.050053347 | 0.052606915 | 0.053214358 |
| 5.681864734 | 0.049484868 | 0.052018863 | 0.052798957 |
| 5.701313636 | 0.048932022 | 0.051436725 | 0.052379404 |
| 5.720762539 | 0.048392286 | 0.050861007 | 0.051955904 |
| 5.740211442 | 0.047865966 | 0.050292237 | 0.051528782 |
| 5.759660345 | 0.047353341 | 0.049730962 | 0.051098143 |
| 5.779109248 | 0.046857846 | 0.049179857 | 0.050665105 |
| 5.798558150 | 0.046378598 | 0.048638428 | 0.050230915 |
| 5.818007053 | 0.045913658 | 0.048106748 | 0.049796429 |
| 5.837455956 | 0.045463031 | 0.047585412 | 0.049362546 |
| 5.856904859 | 0.045026685 | 0.047075009 | 0.048930425 |
| 5.876353762 | 0.044608968 | 0.046577574 | 0.048502009 |
| 5.895802664 | 0.044205672 | 0.046094747 | 0.048077852 |
| 5.915251567 | 0.043815872 | 0.045624969 | 0.047658840 |
| 5.934700470 | 0.043439249 | 0.045168724 | 0.047245817 |
| 5.954149373 | 0.043076077 | 0.044726464 | 0.046839576 |
| 5.973598276 | 0.042728854 | 0.044298648 | 0.046443367 |
| 5.993047178 | 0.042393064 | 0.043890107 | 0.046055795 |
| 6.012496081 | 0.042068200 | 0.043496871 | 0.045677169 |
| 6.031944984 | 0.041753746 | 0.043119133 | 0.045307796 |
| 6.051393887 | 0.041450482 | 0.042757027 | 0.044947890 |
| 6.070842790 | 0.041158048 | 0.042410631 | 0.044599535 |
| 6.090291692 | 0.040873782 | 0.042082803 | 0.044261530 |
| 6.109740595 | 0.040597158 | 0.041772227 | 0.043932685 |
| 6.129189498 | 0.040327658 | 0.041476874 | 0.043612661 |
| 6.148638401 | 0.040066177 | 0.041196401 | 0.043301044 |
| 6.168087304 | 0.039811130 | 0.040930387 | 0.042998193 |
| 6.187536206 | 0.039561346 | 0.040679230 | 0.042703552 |
| 6.206985109 | 0.039316466 | 0.040444017 | 0.042414988 |
| 6.226434012 | 0.039076156 | 0.040220795 | 0.042131775 |
| 6.245882915 | 0.038841411 | 0.040008691 | 0.041853163 |
| 6.265331817 | 0.038610592 | 0.039806771 | 0.041578488 |
| 6.284780720 | 0.038383469 | 0.039614035 | 0.041307230 |
| 6.304229623 | 0.038159941 | 0.039430930 | 0.041037633 |
| 6.323678526 | 0.037940194 | 0.039254155 | 0.040768987 |
| 6.343127429 | 0.037725023 | 0.039082120 | 0.040500618 |
| 6.362576331 | 0.037513493 | 0.038913570 | 0.040231883 |
| 6.382025234 | 0.037305728 | 0.038747230 | 0.039961703 |
| 6.401474137 | 0.037101872 | 0.038581658 | 0.039689574 |
| 6.420923040 | 0.036902850 | 0.038414764 | 0.039415160 |
| 6.440371943 | 0.036709210 | 0.038245198 | 0.039138120 |
| 6.459820845 | 0.036520404 | 0.038071759 | 0.038858166 |
| 6.479269748 | 0.036336713 | 0.037893289 | 0.038574499 |
| 6.498718651 | 0.036158425 | 0.037708524 | 0.038287035 |
| 6.518167554 | 0.035987510 | 0.037514079 | 0.037996196 |
| 6.537616457 | 0.035823542 | 0.037310826 | 0.037702019 |
| 6.557065359 | 0.035666233 | 0.037098035 | 0.037404590 |
| 6.576514262 | 0.035515872 | 0.036875071 | 0.037103806 |
| 6.595963165 | 0.035372741 | 0.036641397 | 0.036799619 |
| 6.615412068 | 0.035239990 | 0.036394275 | 0.036493019 |
| 6.634860971 | 0.035115234 | 0.036134598 | 0.036184347 |
| 6.654309873 | 0.034998602 | 0.035863455 | 0.035873978 |
| 6.673758776 | 0.034890229 | 0.035580993 | 0.035562318 |
| 6.693207679 | 0.034791002 | 0.035287473 | 0.035249838 |
| 6.712656582 | 0.034702495 | 0.034982428 | 0.034937460 |
| 6.732105485 | 0.034622335 | 0.034665568 | 0.034625739 |
| 6.751554387 | 0.034550398 | 0.034339929 | 0.034315246 |
| 6.771003290 | 0.034486519 | 0.034006420 | 0.034006574 |
| 6.790452193 | 0.034431865 | 0.033666037 | 0.033701100 |
| 6.809901096 | 0.034385737 | 0.033319853 | 0.033399488 |
| 6.829349998 | 0.034346310 | 0.032968401 | 0.033102154 |
| 6.848798901 | 0.034313091 | 0.032614543 | 0.032809750 |
| 6.868247804 | 0.034285547 | 0.032259743 | 0.032522921 |
| 6.887696707 | 0.034264146 | 0.031905367 | 0.032243252 |
| 6.907145610 | 0.034246711 | 0.031552793 | 0.031972057 |
| 6.926594512 | 0.034232064 | 0.031204229 | 0.031708798 |
| 6.946043415 | 0.034219385 | 0.030861833 | 0.031454014 |
| 6.965492318 | 0.034207819 | 0.030526387 | 0.031208206 |
| 6.984941221 | 0.034195809 | 0.030199120 | 0.030972291 |
| 7.004390124 | 0.034182011 | 0.029881197 | 0.030749017 |
| 7.023839026 | 0.034165467 | 0.029574174 | 0.030536197 |
| 7.043287929 | 0.034145219 | 0.029282078 | 0.030334056 |
| 7.062736832 | 0.034119595 | 0.029002974 | 0.030142761 |
| 7.082185735 | 0.034086072 | 0.028737529 | 0.029962430 |
| 7.101634638 | 0.034044999 | 0.028486314 | 0.029795994 |
| 7.121083540 | 0.033995540 | 0.028249804 | 0.029640904 |
| 7.140532443 | 0.033936891 | 0.028031724 | 0.029496539 |
| 7.159981346 | 0.033865941 | 0.027830166 | 0.029362682 |
| 7.179430249 | 0.033782071 | 0.027643946 | 0.029239073 |
| 7.198879152 | 0.033686391 | 0.027472958 | 0.029127057 |
| 7.218328054 | 0.033578477 | 0.027317011 | 0.029025511 |
| 7.237776957 | 0.033457970 | 0.027177308 | 0.028932743 |
| 7.257225860 | 0.033320577 | 0.027054458 | 0.028848294 |
| 7.276674763 | 0.033169357 | 0.026945136 | 0.028771693 |
| 7.296123666 | 0.033005187 | 0.026848800 | 0.028703062 |
| 7.315572568 | 0.032828237 | 0.026764880 | 0.028642443 |
| 7.335021471 | 0.032638312 | 0.026692786 | 0.028587821 |
| 7.354470374 | 0.032432605 | 0.026634799 | 0.028538758 |
| 7.373919277 | 0.032215863 | 0.026587067 | 0.028494841 |
| 7.393368180 | 0.031988776 | 0.026548929 | 0.028455708 |
| 7.412817082 | 0.031752082 | 0.026519877 | 0.028422142 |
| 7.432265985 | 0.031505628 | 0.026499441 | 0.028392493 |
| 7.451714888 | 0.031250360 | 0.026488502 | 0.028366580 |
| 7.471163791 | 0.030989329 | 0.026486202 | 0.028344267 |
| 7.490612693 | 0.030723603 | 0.026491341 | 0.028325463 |
| 7.510061596 | 0.030454273 | 0.026503796 | 0.028310923 |
| 7.529510499 | 0.030182398 | 0.026523504 | 0.028300234 |
| 7.548959402 | 0.029910222 | 0.026550873 | 0.028293252 |
| 7.568408305 | 0.029639167 | 0.026587410 | 0.028290145 |
| 7.587857207 | 0.029370355 | 0.026631575 | 0.028291112 |
| 7.607306110 | 0.029104896 | 0.026683590 | 0.028297034 |
| 7.626755013 | 0.028846012 | 0.026743695 | 0.028308465 |
| 7.646203916 | 0.028593900 | 0.026812141 | 0.028324951 |
| 7.665652819 | 0.028349256 | 0.026891309 | 0.028346747 |
| 7.685101721 | 0.028112922 | 0.026979974 | 0.028374091 |
| 7.704550624 | 0.027886278 | 0.027077754 | 0.028407517 |
| 7.723999527 | 0.027672994 | 0.027184712 | 0.028448444 |
| 7.743448430 | 0.027470704 | 0.027300844 | 0.028495450 |
| 7.762897333 | 0.027279803 | 0.027427119 | 0.028548499 |
| 7.782346235 | 0.027100624 | 0.027563543 | 0.028607484 |
| 7.801795138 | 0.026935305 | 0.027708035 | 0.028672224 |
| 7.821244041 | 0.026784703 | 0.027859960 | 0.028743722 |
| 7.840692944 | 0.026646159 | 0.028018560 | 0.028820003 |
| 7.860141847 | 0.026519499 | 0.028182986 | 0.028900246 |
| 7.879590749 | 0.026404488 | 0.028352865 | 0.028983712 |
| 7.899039652 | 0.026303438 | 0.028525151 | 0.029069570 |
| 7.918488555 | 0.026214017 | 0.028698367 | 0.029156817 |
| 7.937937458 | 0.026134335 | 0.028870942 | 0.029243583 |
| 7.957386361 | 0.026063749 | 0.029041217 | 0.029328463 |
| 7.976835263 | 0.026001578 | 0.029206103 | 0.029410134 |
| 7.996284166 | 0.025949161 | 0.029363055 | 0.029487221 |
| 8.015733069 | 0.025902806 | 0.029510655 | 0.029557465 |
| 8.035181972 | 0.025861515 | 0.029647006 | 0.029617660 |
| 8.054630874 | 0.025824416 | 0.029770230 | 0.029667596 |
| 8.074079777 | 0.025790768 | 0.029877175 | 0.029705818 |
| 8.093528680 | 0.025759444 | 0.029962565 | 0.029730910 |
| 8.112977583 | 0.025728663 | 0.030028208 | 0.029741262 |
| 8.132426486 | 0.025697587 | 0.030072671 | 0.029730532 |
| 8.151875388 | 0.025665396 | 0.030094651 | 0.029701906 |
| 8.171324291 | 0.025630727 | 0.030092979 | 0.029654474 |
| 8.190773194 | 0.025592201 | 0.030060072 | 0.029587456 |
| 8.210222097 | 0.025549608 | 0.030000297 | 0.029500199 |
| 8.229671000 | 0.025502380 | 0.029914367 | 0.029387287 |
| 8.249119902 | 0.025449987 | 0.029802163 | 0.029251857 |
| 8.268568805 | 0.025390222 | 0.029663747 | 0.029095565 |
| 8.288017708 | 0.025323516 | 0.029495893 | 0.028918747 |
| 8.307466611 | 0.025250204 | 0.029299226 | 0.028721903 |
| 8.326915514 | 0.025170117 | 0.029078773 | 0.028503087 |
| 8.346364416 | 0.025083118 | 0.028835701 | 0.028263776 |
| 8.365813319 | 0.024986676 | 0.028571333 | 0.028008303 |
| 8.385262222 | 0.024883451 | 0.028286707 | 0.027738110 |
| 8.404711125 | 0.024773629 | 0.027980048 | 0.027454759 |
| 8.424160028 | 0.024657436 | 0.027658652 | 0.027159389 |
| 8.443608930 | 0.024534602 | 0.027324541 | 0.026853246 |
| 8.463057833 | 0.024404825 | 0.026979789 | 0.026541079 |
| 8.482506736 | 0.024270188 | 0.026626522 | 0.026224907 |
| 8.501955639 | 0.024131176 | 0.026266357 | 0.025906763 |
| 8.521404542 | 0.023988303 | 0.025903295 | 0.025588685 |
| 8.540853444 | 0.023841670 | 0.025539949 | 0.025274301 |
| 8.560302347 | 0.023692439 | 0.025178358 | 0.024965717 |
| 8.579751250 | 0.023541772 | 0.024820493 | 0.024664663 |
| 8.599200153 | 0.023390300 | 0.024469001 | 0.024372847 |
| 8.618649055 | 0.023238658 | 0.024127445 | 0.024091882 |
| 8.638097958 | 0.023088011 | 0.023796067 | 0.023826082 |
| 8.657546861 | 0.022939278 | 0.023476163 | 0.023576321 |
| 8.676995764 | 0.022793032 | 0.023168889 | 0.023342125 |
| 8.696444667 | 0.022649897 | 0.022875256 | 0.023124268 |
| 8.715893569 | 0.022510588 | 0.022600318 | 0.022923376 |
| 8.735342472 | 0.022377554 | 0.022341160 | 0.022741839 |
| 8.754791375 | 0.022250047 | 0.022097679 | 0.022581448 |
| 8.774240278 | 0.022128586 | 0.021869976 | 0.022438591 |
| 8.793689181 | 0.022013671 | 0.021658011 | 0.022312936 |
| 8.813138083 | 0.021906711 | 0.021463946 | 0.022204016 |
| 8.832586986 | 0.021809453 | 0.021286779 | 0.022111568 |
| 8.852035889 | 0.021720496 | 0.021123725 | 0.022038242 |
| 8.871484792 | 0.021640166 | 0.020974041 | 0.021978400 |
| 8.890933695 | 0.021568765 | 0.020836902 | 0.021930869 |
| 8.910382597 | 0.021508627 | 0.020711839 | 0.021894398 |
| 8.929831500 | 0.021459493 | 0.020599481 | 0.021867667 |
| 8.949280403 | 0.021420070 | 0.020495792 | 0.021850665 |
| 8.968729306 | 0.021390423 | 0.020399639 | 0.021839730 |
| 8.988178209 | 0.021370587 | 0.020309875 | 0.021832849 |
| 9.007627111 | 0.021363541 | 0.020225344 | 0.021828501 |
| 9.027076014 | 0.021366562 | 0.020145351 | 0.021825167 |
| 9.046524917 | 0.021378901 | 0.020067606 | 0.021820884 |
| 9.065973820 | 0.021400291 | 0.019990750 | 0.021813258 |
| 9.085422723 | 0.021430771 | 0.019913723 | 0.021801048 |
| 9.104871625 | 0.021471924 | 0.019835499 | 0.021782948 |
| 9.124320528 | 0.021520368 | 0.019754696 | 0.021757710 |
| 9.143769431 | 0.021575488 | 0.019669615 | 0.021723451 |
| 9.163218334 | 0.021636625 | 0.019579891 | 0.021676920 |
| 9.182667237 | 0.021703607 | 0.019484778 | 0.021619227 |
| 9.202116139 | 0.021775270 | 0.019383579 | 0.021549591 |
| 9.221565042 | 0.021849478 | 0.019275653 | 0.021467311 |
| 9.241013945 | 0.021925219 | 0.019158044 | 0.021371768 |
| 9.260462848 | 0.022001439 | 0.019032224 | 0.021258270 |
| 9.279911750 | 0.022076340 | 0.018897859 | 0.021130139 |
| 9.299360653 | 0.022147886 | 0.018754622 | 0.020987413 |
| 9.318809556 | 0.022214922 | 0.018602234 | 0.020829977 |
| 9.338258459 | 0.022276138 | 0.018438780 | 0.020657791 |
| 9.357707362 | 0.022330200 | 0.018264553 | 0.020467955 |
| 9.377156264 | 0.022371953 | 0.018080618 | 0.020262212 |
| 9.396605167 | 0.022401900 | 0.017886943 | 0.020042321 |
| 9.416054070 | 0.022418968 | 0.017683523 | 0.019808587 |
| 9.435502973 | 0.022421786 | 0.017469803 | 0.019561347 |
| 9.454951876 | 0.022407873 | 0.017244207 | 0.019299514 |
| 9.474400778 | 0.022370785 | 0.017009120 | 0.019022874 |
| 9.493849681 | 0.022314090 | 0.016764655 | 0.018734316 |
| 9.513298584 | 0.022236652 | 0.016510933 | 0.018434277 |
| 9.532747487 | 0.022137384 | 0.016248078 | 0.018123191 |
| 9.552196390 | 0.022011348 | 0.015974104 | 0.017801174 |
| 9.571645292 | 0.021855851 | 0.015690875 | 0.017466407 |
| 9.591094195 | 0.021675014 | 0.015398996 | 0.017122157 |
| 9.610543098 | 0.021468292 | 0.015098582 | 0.016768778 |
| 9.629992001 | 0.021235218 | 0.014789745 | 0.016406602 |
| 9.649440904 | 0.020968521 | 0.014471561 | 0.016035947 |
| 9.668889806 | 0.020671977 | 0.014143860 | 0.015655190 |
| 9.688338709 | 0.020348690 | 0.013808153 | 0.015266322 |
| 9.707787612 | 0.019998928 | 0.013464567 | 0.014870049 |
| 9.727236515 | 0.019623055 | 0.013113242 | 0.014466635 |
| 9.746685418 | 0.019213087 | 0.012754245 | 0.014056351 |
| 9.766134320 | 0.018778860 | 0.012385881 | 0.013638479 |
| 9.785583223 | 0.018321704 | 0.012010570 | 0.013213696 |
| 9.805032126 | 0.017842708 | 0.011628629 | 0.012783295 |
| 9.824481029 | 0.017341509 | 0.011240422 | 0.012347690 |
| 9.843929931 | 0.016816800 | 0.010846361 | 0.011907336 |
| 9.863378834 | 0.016275937 | 0.010446057 | 0.011462463 |
| 9.882827737 | 0.015720542 | 0.010040897 | 0.011013486 |
| 9.902276640 | 0.015152278 | 0.009632114 | 0.010562057 |
| 9.921725543 | 0.014571455 | 0.009220460 | 0.010108926 |
| 9.941174445 | 0.013981378 | 0.008806743 | 0.009654893 |
| 9.960623348 | 0.013385864 | 0.008391847 | 0.009200805 |
| 9.980072251 | 0.012786753 | 0.007977264 | 0.008748352 |
| 9.999521154 | 0.012185881 | 0.007564272 | 0.008298594 |
Scenario 1: Revenue-neutral alcohol volumetric excise tax rates and structures
Based on our simulations, compared to current Canadian taxesFootnote 12 the unified AVT (Scenario 1a) would have resulted in a considerable reduction in excise taxes contributed by spirits-based drinks, large increases for beers and small increases for wines (see Table 3). Unexpectedly, it also resulted in a very small 0.13% increase in overall per capita alcohol consumption after taking account of the impacts of price changes across the full price-quality spectrum and across beverage types, own- and cross-price elasticities.
The stratified AVT (Scenario 1b) was designed to generate the same revenue within each beverage type as under the existing system. The overall impact was just a 0.06% reduction in per capita alcohol consumption.
Table 3. Estimated effects of two alternative and broadly revenue-neutral alcohol volumetric tax solutions on alcohol consumption and excise tax revenues
| Outcome measures | Scenario 1a: Unified AVT | Scenario 1b: Stratified AVT | |
|---|---|---|---|
| AVT rate per litre of ethanol ($) | Beer | 6.705 | 4.679 |
| Wine | 6.705 | 4.769 | |
| Spirits | 6.705 | 11.454 | |
| Change in ethanol consumption (%) | Beer | +0.21 | +0.18 |
| Wine | −0.93 | −0.46 | |
| Spirits | +1.12 | +0.01 | |
| Coolers | −0.33 | +0.29 | |
| Ciders | +0.33 | +0.23 | |
| Total | +0.13 | −0.06 | |
| Change in beverage consumption (%) | Total | +0.08 | +0.04 |
| Change in excise tax revenues (%) | Total | 0.00 | +0.55 |
Scenario 2: Inflation-adjusted excise tax rates
Actual alcohol excise taxes collected in 2016/17 totalled $1556.1 million. Had taxes been inflation-adjusted since 1991/92, 55.35% greater tax revenues would have been received in 2016/17 (see Table 4). This amounts to an additional $846.30 million and would have been accompanied by a 3.83% reduction in per capita alcohol consumption. Applying this estimated change in the per capita consumption to national data on partially and fully alcohol-attributable morbidity and mortality using InterMAHP suggested that there would be approximately 3762 fewer hospitalizations and 329 fewer deaths in 2016.
Table 4. Estimated effects in 2016/17 of introducing an alcohol volumetric tax adjusted for previous 25 years of inflation
| Outcome measures | Estimates | |
|---|---|---|
| Inflation | 1991/92 to 2016/17 | 1.5535 |
| Change in ethanol consumption (%) | Beer | −0.68 |
| Wine | −3.15 | |
| Spirits | −8.16 | |
| Coolers | −3.84 | |
| Ciders | +0.26 | |
| Total | −3.83 | |
| Estimated lost excise revenue (2016, $ million) | Beer | 233.83 |
| Wine | 173.85 | |
| Spirits | 397.923 | |
| Coolers | 23.05 | |
| Ciders | 17.64 | |
| Total | 846.30 | |
| Change in harm (n) | Deaths | −329 |
| Hospitalizations | −3762 | |
The cumulative effects of the failure to index excise duty rates between 1991/92 and 2016/17 are summarized in Table 5. All told, we estimated that the federal government would have collected between $9.26 billion and $12.71 billion more from excise taxation and the Canadian population would have been consuming between 2.51% and 3.33% less alcohol in 2016/17.
Table 5. Estimated uncollected excise revenue and change in consumption
| Cumulative outcome measure | Point estimate | 95% Confidence intervals |
|---|---|---|
| Change in consumption by 2016 | −2.91% | −2.51% to −3.33% |
| Lost excise revenue 1991–2016 | $10.97 billion | $9.26 billion to $12.71 billion |
Scenario 3: MUPs set per standard drink of alcohol
The largest impacts of any of the price and tax reforms estimated arose from introducing MUPs (see Table 6). If set at $1.50 per standard drink, per capita alcohol consumption in Canada would have fallen in 2016 by approximately 3.94%. If set at $1.75, consumption would have been reduced by 8.68%. These consumption changes in turn would result in 4.2% and 7.9% reductions in federal taxes collected, with reductions in excise taxes slightly offset by smaller increases in GST. Both types of minimum prices modelled in Scenario 3 resulted in estimated increases in overall expenditure on alcohol, $564.37 million for an MUP of $1.50 and $1.57 billion for an MUP of $1.75.
The 8.68% reduction in consumption from a $1.75 MUP would have resulted in approximately 8329 fewer hospitalizations and 732 fewer deaths in Canada in 2016.
Table 6. Estimated effects of implementing minimum unit prices per standard drink
| Outcome | MUP $1.50 | MUP $1.75 | |
|---|---|---|---|
| Change in consumption (%) | Beer | −1.08 | −2.21 |
| Wine | −4.57 | −9.61 | |
| Spirits | −6.73 | −15.47 | |
| Coolers | −5.15 | −11.10 | |
| Ciders | −0.04 | −0.46 | |
| Total | −3.94 | −8.68 | |
| Change in harm (n) | Deaths | −339 | −732 |
| Hospitalizations | −3868 | −8329 | |
| Change in revenue ($ million) | Excise duty | −73.86 | −162.95 |
| Federal sales tax (GST) | 6.89 | 36.47 | |
| Net federal revenue | −66.97 | −126.48 | |
| Change in expenditure ($ million) | Due to price changes | 564.37 | 1567.60 |
Comparison of policy scenario effects by beverage type and product price/quality
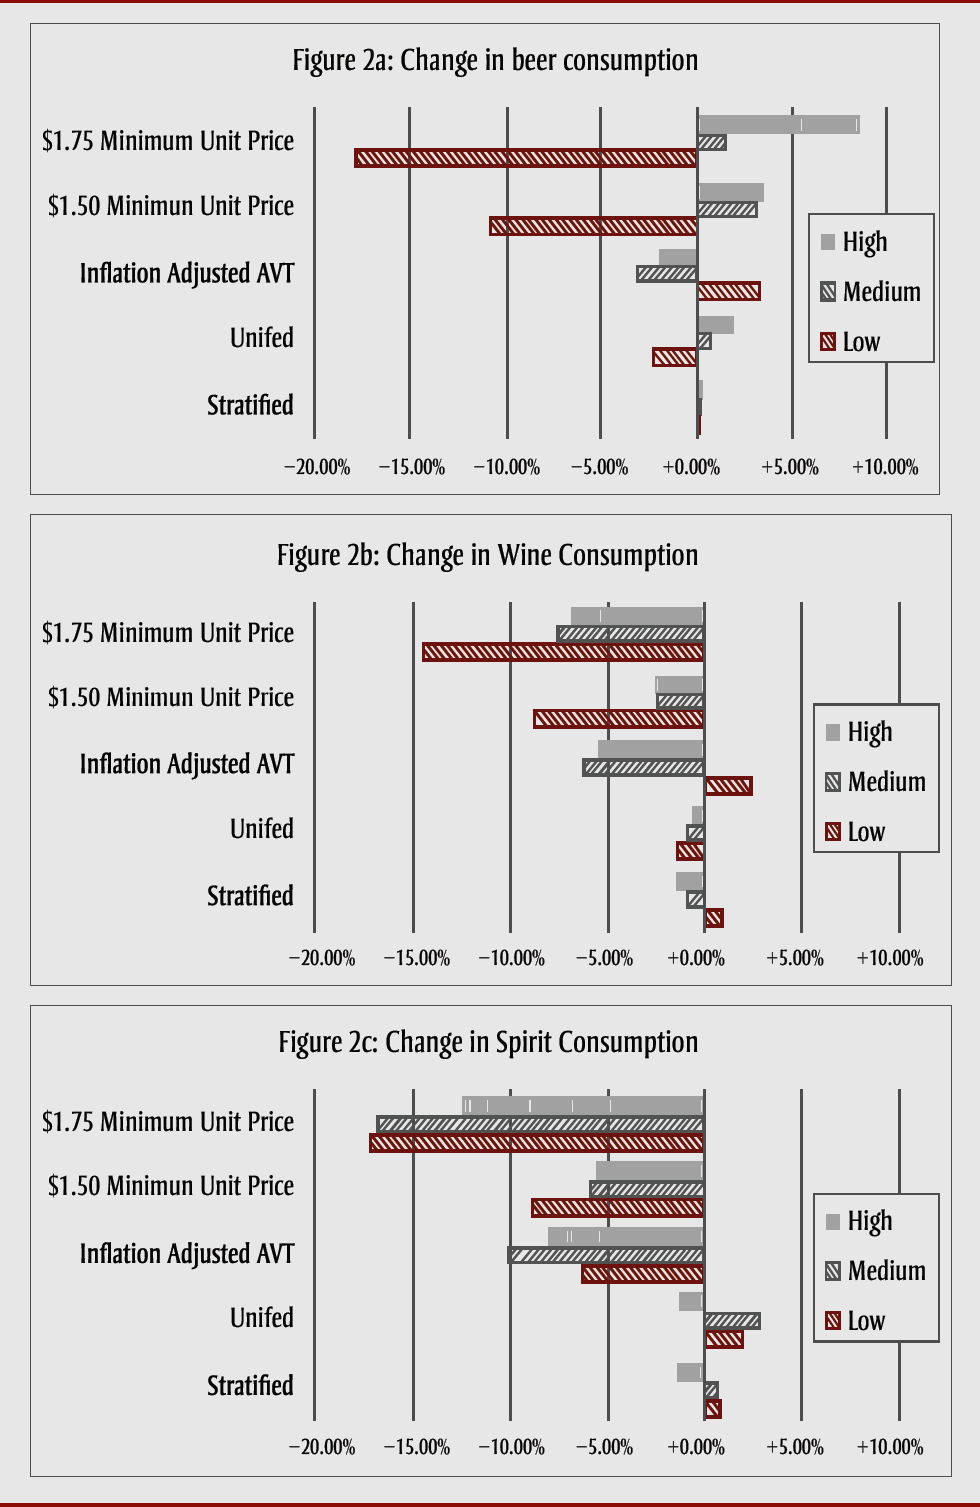
Figure 2 conveys the full effect of different tax policy impacts by beverage type and quality class categories, showing stark differences in effects, especially on consumption of cheaper products. Both the revenue-neutral unified and stratified alcohol volumetric taxation strategies had fairly equal effects across different quality bands for all beverages (Scenarios 1a, 1b). However, the across-the-board increase in excise taxes adjusting for inflation (Scenario 2) appeared to increase consumption of lower quality products while both the MUPs (Scenario 3) resulted in marked decreases in consumption of these products.
Figure 2. Change in consumption by scenario, beverage category (beer, wine, spirits) and quality group (low, medium, high)
Text description: Figure 2
Figure 2. Change in consumption by scenario, beverage category (beer, wine, spirits) and quality group (low, medium, high)
Figure 2a. Change in beer consumption
| Category | High Quality | Medium Quality | Low Quality |
|---|---|---|---|
| $1.75 Minimum unit price | 8.46% | 1.53% | -17.77% |
| $1.50 Minimum unit price | 3.49% | 3.18% | -10.81% |
| Inflation Adjusted AVT | -1.86% | -3.05% | 3.36% |
| Unified | 1.89% | 0.70% | -2.17% |
| Stratified | 0.20% | 0.21% | 0.11% |
Figure 2b. Change in wine consumption
| Category | High Quality | Medium Quality | Low Quality |
|---|---|---|---|
| $1.75 Minimum unit price | -6.85% | -7.60% | -14.43% |
| $1.50 Minimum unit price | -2.47% | -2.47% | -8.82% |
| Inflation Adjusted AVT | -5.45% | -6.29% | 2.35% |
| Unified | -0.53% | -0.86% | -1.40% |
| Stratified | -1.32% | -0.85% | 0.80% |
Figure 2c. Change in spirit consumption
| Category | High Quality | Medium Quality | Low Quality |
|---|---|---|---|
| $1.75 Minimum unit price | -12.47% | -16.79% | -17.20% |
| $1.50 Minimum unit price | -5.48% | -5.87% | -8.91% |
| Inflation Adjusted AVT | -8.01% | -10.10% | -6.33% |
| Unified | -1.28% | 2.76% | 1.88% |
| Stratified | -1.29% | 0.56% | 0.78% |
Discussion
We estimated the effects on revenue, alcohol consumption and related harms of a variety of recommended pricing and taxation reformsFootnote 3Footnote 9 by applying a matrix of price elasticities to a large dataset of prices, alcohol contents and sales volumes for over 10 000 products provided by a government monopoly alcohol distributor in a Canadian province. This modelling approach enabled us to simulate the impacts of different tax strategies while accounting for complex interactions related to price changes across different beverage types and “quality” classes of alcoholic beverages.
This approach provides a realistic assessment of tax impacts on sales of this “complex good.” Of note, our approach was made possible by the availability of BC price data used to estimate sales volumes distributed across two key variables, price per standard drink and excise taxes paid per standard drink, each expressed as a percentage of total value of the BC alcohol market. These distributions were estimated independently from three separate, comprehensive samples of BC price data, each comprising more than 10 000 products. The distributions estimated were very consistent.
The most striking finding was the superiority of MUPs as a means of reducing consumption and related harms compared with strategies that raise alcohol taxes across the full spectrum of alcohol products. For example, if an MUP of $1.75 per Canadian standard drink had been introduced in 2016, it would have reduced consumption by 8.68%, alcohol-attributable deaths by 732 and hospitalizations by 8329. In contrast, an across-the-board increase in alcohol excise taxes to compensate for inflation since 1997 would have resulted in reductions in consumption of only 3.51%, deaths by 302 and hospitalizations by 3453.
We likely underestimated the extent of the difference in outcomes from across-the-board tax increases versus MUPs because we were unable to take into account the disproportionate rates of alcohol-related harm experienced by people on low incomes consuming alcohol at the same rate as those on higher incomes.Footnote 17Footnote 44 It is possible, therefore, that under some circumstances, across-the-board tax increases could increase the health burden from alcohol consumption as consumers shift to and use more lower quality goods. This will likely particularly affect consumers living at lower income who tend to drink cheaper alcohol, thereby increasing health inequalities in comparison with the reverse effect of introducing MUPs. This situation may arise because, while MUPs precisely target only the cheapest products known to be favoured especially by drinkers living on low incomes, our models predict that an across-the-board tax increase will increase consumption of these cheaper beverages (see Figures 2a to 2c). At the very least, we can conclude that our models found that MUP and across-the-board tax increases had reverse effects on consumption of cheap alcohol, the former decreasing and the latter increasing consumption.
The proposed hypothetical tax policy reforms were based on theoretical and empirical evidence that they would yield public health benefits. However, it is hard to predict precise impacts on overall consumption given the complex interrelationships between price changes of different types of alcohol products beverages categorized by beverage and price categories.Footnote 21
In Scenario 1, we estimated the effects of collecting alcohol excise taxes at a rate per litre of ethanol rather than per litre of liquid as is currently the case for most beverages. In theory, this should provide consumers with a price incentive to select lower alcohol content beverages and shift their consumption accordingly. Again, in theory it should be possible to reduce alcohol consumption across the whole population by such a strategy while maintaining revenue neutrality. Our first model established a single unified alcohol volumetric excise tax rate applied to all beverage varieties while achieving the same level of exercise revenue as obtained in 2016/17. In fact, when considering all the complex interrelationships between beverage types and qualities in terms of price elasticities, this resulted in a slight increase in overall consumption (0.13%), because decreased wine consumption was more than compensated by slightly increased consumption of beer and spirits.
Applying unequal adjustments to tax rates for different major categories of alcohol producers would likely create political difficulties, and so we also modelled an alternative policy scenario in which each of the major producers was equally affected/unaffected overall (i.e. the stratified AVT, Scenario 1b). The model that best meets these requirements estimated only a 0.06% reduction in per capita alcohol consumption. While there may be some virtues of directly applying excise taxes at a rate per litre of ethanol rather than per litre of liquid, when applied across the whole complex alcohol market, overall estimated impacts on total consumption and related harms appeared to cancel each other out in our models.
Starkly contrasting outcomes were obtained from Scenario 2 (excise taxes increased to compensate for a failure to index taxes for 25 years) compared with Scenario 3 (a $1.50 MUP). Each resulted in a total change in consumption of approximately −4%, but this reduction occurred in completely different product segments. The two strategies had similar effects on spirit consumption, with all sectors seeing consumption reductions of similar magnitudes. However, opposite patterns of effects were observed for beers and wines. Under an MUP, consumption of cheaper alcohol was reduced and of expensive alcohol was increased. The reverse pattern occurred for the across-the-board tax increase in Scenario 2 (inflation-adjusted AVT).
Scenario 2 also highlighted the extent of lost federal government revenue from a failure to index alcohol tax rates until 2017. The federal alcohol taxes increase in 2006 was introduced purely to compensate for a reduction in federal sales taxes (the GST change from 6% to 5% for all consumer goods), that is, this was a revenue-neutral change and not an adjustment to take inflation into account. We estimated that in 2016 alone the federal government lost $846.30 million by not having adjusted alcohol excise taxes to compensate for inflation in the previous 25 years. Over this period, we estimate that the federal government lost $10.97 billion in excise tax revenues, which resulted in 4000 to 5400 more alcohol-caused deaths and 43 000 to 56 000 more alcohol-caused hospitalizations by 2016.
These results are broadly consistent with UKFootnote 45 and Australian modelling.Footnote 46 Meier et al. concluded that both AVT and minimum unit pricing generated greater reductions in harm for a fixed reduction in consumption than would be obtained from a value-based model or the then current mixed model applied in the UK.Footnote 45 Byrnes et al. estimated that introducing a revenue-neutral uniform AVT would only reduce per capita consumption by 0.05%, very similar to our estimate of 0.06%, albeit in a different market with a different tax structure.Footnote 46
Limitations
We used geographical and temporal scaling parameters to generalize findings from provincial estimates for BC to the whole of Canada. The BC distribution of product prices and sales volumes may not be fully representative of all other provinces and territories where there are different local sales taxes, transportation costs and regulatory policies. The BC alcohol market is, however, broadly representative of the rest of Canada with its combination of metropolitan, rural and remote populations spread across a large geographical area, though BC per capita consumption is slightly above the national average.Footnote 1 Overall any differences are likely to mostly cancel each other out.
Further, because only the distributions of ethanol sales volumes by both price and excise taxes paid per standard drink in BC were calculated as percentages of the total value of the BC alcohol market, extrapolating these distributions to Canada as a whole was independent of the types, brands, volumes and values of individual products sold in BC. In addition, almost identical distributions of these key variables were estimated from three independent samples of BC price data which, in turn, closely resembled reported distributions from Ontario in an earlier study.Footnote 24
Seasonal change in consumption between beverage categories is well documented.Footnote 47 The product-level datasets we used were from the spring and summer months when market shares of beer and refreshment beverages tend to be higher. Seasonal variations in total beverage market share were accounted for by temporal scaling parameters, but seasonal variation in individual product sales could not be estimated from the available data.
An additional unknown factor would be how manufacturers would respond to tax and minimum price changes. They would likely raise or lower the price they sell their products to the government distributor according to known changes in the final retail price. This would influence the potential to make profit from particular products. For example, 32% of individual cider products were listed as containing exactly 7% ABV, an artificial bright line in excise duty rates that marks an increase in duty collection. These products accounted for 50.8% of total ethanol sales among ciders. With an alcohol volumetric excise taxation, we would expect this type of clustering to disappear and a broader spectrum of strengths to occur. When considering MUP strategies, a majority of the additional revenue is unallocated by our models. One would expect producers to reactively raise the prime cost of their products to meet new MUPs, otherwise all of this unallocated revenue would be collected by government liquor authorities.
Conclusions
While a modelling exercise such as this can never precisely predict the future, it is capable of simultaneously considering a range of empirical inputs and complex interrelationships in order to provide a useful guide to the likely general outcomes of alternative policies. We suggest that the analyses presented in this paper support the following broad conclusions:
- Introducing national minimum pricing has substantial potential to improve public health and safety outcomes while, according to other evidence, reducing health inequalities to a greater extent than across-the-board tax increases for all alcoholic products;
- The Canadian government lost substantial revenue over recent decades by not indexing alcohol excise taxes to the cost of living between 1985 and 2017, with attendant negative impacts on public health; and
- Some optimal public health as well as revenue collection benefits could be obtained by combining elements of each of the reforms proposed above, that is, by replacing the federal sales tax on alcohol with an alcohol volumetric excise tax adjusted to compensate for past lost revenues and combining this with a national minimum price, for example, of $1.75 a standard drink.
In addition to the public health benefits, this combination of policies should help reduce health inequalities by reducing alcohol-attributable harms for people living on low incomes while ensuring that the federal government gains additional revenue.
Acknowledgements
We gratefully acknowledge funding for this research from the Public Health Agency of Canada. We acknowledge the opportunity to conduct this modelling exercise by virtue of being permitted access to detailed product-level prices and sales data by the BC Liquor Distribution Branch.
Conflict of interest
TS, JS and AS have each received travel expenses from Scandinavian government alcohol retail monopolies (Systembolaget and/or Alko) to take part in a project to assess the public health impacts of their policies. TS also received a consulting fee for this work, and AS and JS salary contributions. No conflicts for others to declare.
TS and AS were Guest Editors for this issue of the HPCDP Journal, but removed themselves from the peer review process and editorial decision-making associated with this manuscript.
Authors’ contributions and statement
Conceptualization: TS, SC, AS
Analysis and interpretation of data: SC, TS, PG, JS
Writing – original draft: TS, SC, PG
Writing – review and editing: TS, SC, AS, JS, PG
The content and views expressed in this article are those of the authors and do not necessarily reflect those of the Government of Canada.