
Original quantitative research – Regional variation in multimorbidity prevalence in British Columbia, Canada: a cross-sectional analysis of Canadian Community Health Survey data, 2015/16
Health Promotion and Chronic Disease Prevention in Canada
C. Andrew Basham, MScAuthor reference footnote 1Author reference footnote 2
https://doi.org/10.24095/hpcdp.40.7/8.02
This article has been peer reviewed.
Correspondence: C. Andrew Basham, 655 W 12th Ave., Vancouver, BC V5Z 4R4; Email: umbashac@myumanitoba.ca
Abstract
Introduction: Multimorbidity represents a major concern for population health and service delivery planners. Information about the population prevalence (absolute numbers and proportions) of multimorbidity among regional health service delivery populations is needed for planning for multimorbidity care. In Canada, health region–specific estimates of multimorbidity prevalence are not routinely presented. The Canadian Community Health Survey (CCHS) is a potentially valuable source of data for these estimates.
Methods: Data from the 2015/16 cycle of the CCHS for British Columbia (BC) were used to estimate and compare multimorbidity prevalence (3+ chronic conditions) through survey-weighted analyses. Crude frequencies and proportions of multimorbidity prevalence were calculated by BC Health Service Delivery Area (HSDA). Logistic regression was used to estimate differences in multimorbidity prevalence by HSDA, adjusting for known confounders. Multiple imputation using chained equations was performed for missing covariate values as a sensitivity analysis. The definition of multimorbidity was also altered as an additional sensitivity analysis.
Results: A total of 681 921 people were estimated to have multimorbidity in BC (16.9% of the population) in 2015/16. Vancouver (adj-OR = 0.65; 95% CI: 0.44–0.97) and Richmond (adj-OR = 0.55; 95% CI: 0.37–0.82) had much lower prevalence of multimorbidity than Fraser South (reference HSDA). Missing data analysis and sensitivity analysis showed results consistent with the main analysis.
Conclusion: Multimorbidity prevalence estimates varied across BC health regions, and were lowest in Vancouver and Richmond after controlling for multiple potential confounders. There is a need for provincial and regional multimorbidity care policy development and priority setting. In this context, the CCHS represents a valuable source of information for regional multimorbidity analyses in Canada.
Keywords: multimorbidity, prevalence, British Columbia, Canada, cross-sectional studies, surveys and questionnaires
Highlights
- Multimorbidity prevalence is a growing phenomenon with major cost and service delivery planning implications for health systems.
- This paper presents methods and results for analysis of Canadian Community Health Survey data for British Columbia (BC) during 2015/16.
- Estimated multimorbidity prevalence was lower in Vancouver and Richmond compared to other regions in BC, after adjusting for multiple confounding factors.
- Future research may seek to integrate multiple health administrative and survey datasets to better characterize multimorbidity among BC health regions.
- Policy development and priority setting for multimorbidity care in BC are warranted provincially and within each RHA.
Introduction
Globally, the prevalence of multimorbidity is rising.Footnote 1Footnote 2 Definitions of multimorbidity have proliferated in the past decade, and vary in terms of the conditions included and the populations considered, without a clear consensus.Footnote 3Footnote 4 However, systematic review guidance suggests that multimorbidity should be defined from a minimum of 12 candidate chronic health conditions and requires two or more chronic conditions (2+ conditions) to be present.Footnote 5 Furthermore, multimorbidity prevalence estimates should include all members of the population.Footnote 5 Finally, defining multimorbidity as 3 or more chronic conditions (3+ conditions) has been established as more meaningful for clinicians and linked to greater need for care coordination.Footnote 5
In Canada, multimorbidity is a major cost driver for provincial health insurance plans.Footnote 6 British Columbia (BC) has the lowest prevalence of chronic diseases of Canadian provinces and territories.Footnote 7 However, Feely et al. estimated that the prevalence of multimorbidity (3+ chronic conditions) in BC increased 75% over ten years, from 5.2% in 2001/02 to 9.1% in 2011/12, based on health administrative data.Footnote 7 Within BC, the prevalence of chronic diseases, and therefore multimorbidity, is expected to vary regionally, but the extent of that variation is unknown.
The BC Centre for Disease Control (BCCDC) has developed a Chronic Disease Dashboard (CDD) that is able to display incidence and prevalence of major chronic diseases, from mood and anxiety disorders to osteoporosis, across health regions, time, age and sex. The CDD is derived from the BC Ministry of Health’s Chronic Disease Registry (CDR), which gathers data from multiple health administrative databases.Footnote 8 Currently, work is underway at BCCDC to include a multimorbidity indicator in the CDD to facilitate analysis of multimorbidity in BC by health professionals.Footnote 9 Information systems based on administrative data are powerful and cost-effective, with virtually complete follow-up (i.e. offering the ability to track long-term health care use) in Canada. However, lack of data on health behaviours and social determinants, such as smoking, household income, highest household education level, body mass index (BMI), diet and physical activity, reduces analysts’ ability to explain differences between health regions.Footnote 7Footnote 10 Administrative data–based systems only capture treated conditions, rather than population prevalence of those conditions, which has led to underestimates of multimorbidity prevalence in Canada.Footnote 11
There is a need for health region–specific multimorbidity prevalence estimates to inform health policy, programming and resource allocation within BC, as well as health promotion and chronic disease prevention activities.Footnote 9 In BC, five Regional Health Authorities (RHAs) exist as entities of the provincial government that coordinate and develop health services tailored to regional population needs.Footnote 12Footnote 13 The RHAs are composed of 16 Health Service Delivery Areas (HSDAs), which are further subdivided into 89 Local Health Areas (LHAs).Footnote 14 As multimorbidity increases in the aging BC population, the need for health region–specific multimorbidity prevalence estimates will grow.Footnote 9 Surveys may offer important data for multimorbidity research and surveillance within BC. Surveys can incorporate questions on health determinants, and are not affected by physician billing and reimbursement policies and practices or health care access issues, which makes survey data a valuable resource for health service planners seeking to address the prevalence of multimorbidity in Canada. The Canadian Community Health Survey (CCHS) is a nationally representative survey that contains data on health determinants at individual and household levels and includes a range of health outcome measures, including self-reported diagnoses of specified chronic diseases. These data have been used previously for chronic disease and multimorbidity research.Footnote 15Footnote 16Footnote 17Footnote 18Footnote 19
This study examined the prevalence of multimorbidity within BC by HSDA using the most recently available CCHS data. The objectives of this study were to analyze the total burden of and variation in multimorbidity prevalence by HSDA, to determine how much variation could be explained by known risk factors for multimorbidity and to develop methods for regional analysis of multimorbidity in BC using survey data.
Methods
Data source and analytic sample
CCHS Public Use Microdata File (PUMF) data for 2015/16 (two years) were analyzed. The CCHS is a complex, nationally representative sample based on a cluster-randomized, multistage sampling framework. The PUMF dataset contains survey weights for each participant based on this framework that can be used to produce statistical estimates generalizable to 98% of the Canadian population.Footnote 20 Sample size calculations are based on health region–specific sampling frames.Footnote 20 Participants are weighted according to the number of people they represent in the Canadian population. Males are weighted more heavily than females due to lower participation in CCHS. Final weights are derived in a series of steps that involve integration, nonresponse adjustments, Winsorization and calibration.Footnote 20
Analysis variables
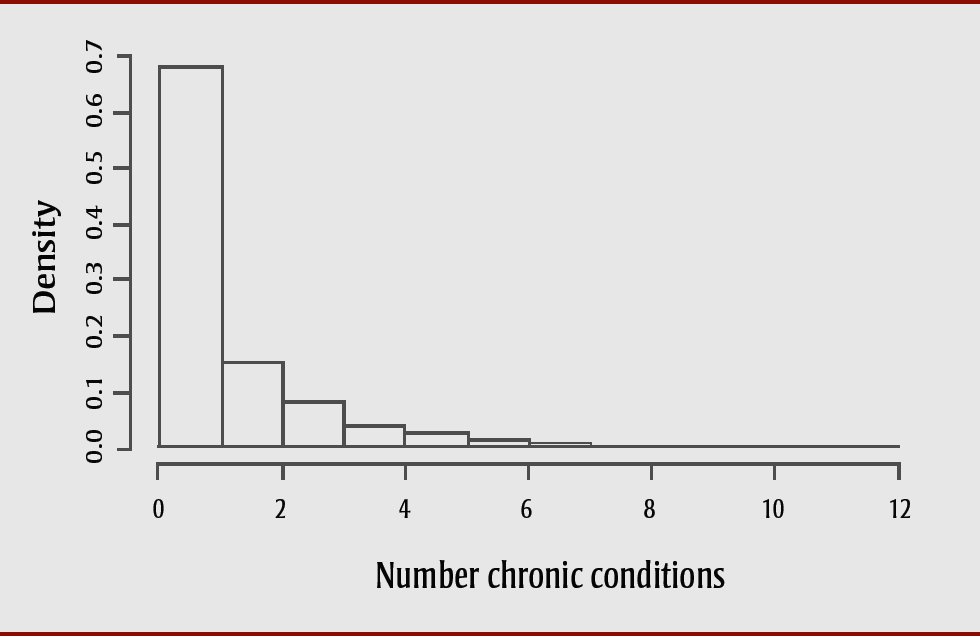
The outcome variable, multimorbidity, was defined as three or more (3+) chronic conditions from a list of 17 candidate health conditions that were self-reported by respondents with a physician diagnosis, and included asthma, COPD, sleep apnea, scoliosis, fibromyalgia, arthritis, back problems (excluding scoliosis, fibromyalgia and arthritis), osteoporosis, high blood pressure, heart disease, stroke effects, diabetes, cancer, migraine headaches, multiple chemical sensitivities, mood disorder (e.g. depression, bipolar, mania, dysthymia) and anxiety disorder (e.g. phobia, obsessive-compulsive disorder, panic). An indicator variable was created for each condition and was assigned a value of 0 or 1, with 1 indicating that the condition was present, 0 that it was not. These indicator variables were summed for each participant to create a multimorbidity index. This index was then dichotomized into a categorical outcome variable indicating multimorbidity (3+ chronic conditions vs. 2 or fewer chronic conditions), based on a survey-weighted histogram of the multimorbidity index generated during exploratory data analysis (Figure 1), as well as literature suggesting that people with 3+ conditions have a greater need for coordinated clinical management.Footnote 4Footnote 5Footnote 21
Figure 1. Histogram of multimorbidity index used to create dichotomous indicator variable for multimorbidity: Canadian Community Health Survey 2015/16, British Columbia subpopulation
Text description: Figure 1
Figure 1. Histogram of multimorbidity index used to create dichotomous indicator variable for multimorbidity: Canadian Community Health Survey 2015/16, British Columbia subpopulation
| Number of chronic conditions | Density (survey-weighted proportion with that number of chronic conditions) |
|---|---|
| 0,1 | 0.6779 |
| 1,2 | 0.1532 |
| 2,3 | 0.0809 |
| 3,4 | 0.0391 |
| 4,5 | 0.0249 |
| 5,6 | 0.0128 |
| 6,7 | 0.0058 |
| 7,8 | 0.0030 |
| 8,9 | 0.0012 |
| 9,10 | 0.0007 |
| 10,11 | 0.0004 |
| 11,12 | 0.0001 |
For an understanding of regional variation in multimorbidity prevalence estimates, HSDA was used as the key question predictor. HSDAs represent the most granular level at which data from the CCHS are available.
Statistical analysis
Descriptive statistics
The survey-weighted proportion and number of BC residents with multimorbidity were estimated by HSDA and by a series of sociodemographic factors identified in the literature as predictors of multimorbidity.Footnote 3Footnote 5Footnote 16Footnote 22Footnote 23Footnote 24 The sociodemographic factors included age group (12–29, 30–49, 50–64, 65–79, or 80+ years); sex (male or female); total household income group (< $20 000, $20 000–$39 999, $40 000–$59 999, $60 000–$79 999, or $80 000+); alcohol consumption (regular, occasional or not at all); current smoking status (daily, occasionally or not at all); daily fruit and vegetable consumption (< 5 servings or 5+ servings); highest household education level (< secondary, secondary graduate, or postsecondary certificate/diploma/degree); self-reported height and weight, converted to body mass index (BMI; categorized as under/normal weight, overweight, or obese classes I, II, III); and World Health Organization (WHO) physical activity level (active, moderately active, somewhat active, or inactive). Rao-Scott tests were used for equality of proportions for multimorbidity across covariate categories, incorporating the complex survey design weights.Footnote 25
Inferential statistics
For the inferential analysis comparing HSDAs within BC, adjusting for the covariates described above, survey-weighted logistic regression was used.Footnote 26 Univariable models were fit for the key question predictor, HSDA, as well as for each potential confounder listed above. An age- and sex-adjusted model was then fit to compare HSDAs. A full main effects model that included all potential confounders was fit to provide covariate-adjusted odds ratios (adj-ORs) for comparison of multimorbidity prevalence estimates across HSDAs. All models incorporated the survey weights supplied with the CCHS data to produce results generalizable to the population of BC, within the bounds of the sampling frame for the CCHS. Fraser South was used as the reference HSDA as it had the largest sample size (n = 1376), providing more stable OR estimates.
Interaction models (considered separately) included smoking status by alcohol consumption, smoking status by physical activity and smoking status by income. Each of these interaction terms was added to the covariate-adjusted main effects model. It was hypothesized that smoking status would have a stronger effect with regular alcohol consumption, low physical activity and low income level. Furthermore, age group by household income group and age group by smoking status were also considered potential interactions, with the hypothesis that the effect of income would be more pronounced in younger than older age groups, and that the effect of smoking would be less pronounced in younger age groups. No effect modification terms were considered as a theoretical justification was not clear for testing any interaction between HSDA and the covariates.
Missing data analysis
The proportion of participants with missing covariate values was assessed for each covariate separately and then multiple imputation using chained equations with five iterations of 20 imputations was performed for each participant with a missing value.Footnote 27 These imputed datasets were combined and analyzed to produce a pooled estimate and adjusted OR of multimorbidity for each HSDA compared with the reference HSDA, including all participants excluded due to missing values for one or more covariates for the final main effects model. This pooled and adjusted OR was compared with the results of the main effects model as a sensitivity analysis to assess robustness to missing data.
Sensitivity analysis
In the sensitivity analysis, the multimorbidity index definition was varied by combining four chronic pain conditions (scoliosis, fibromyalgia, arthritis and back problems) into a single indicator variable. Because arthritis and back problems were very common conditions in the sample, with 25.4% and 20.8% of the population reporting these conditions, respectively, these variables were combined with two other potentially related chronic pain conditions (scoliosis and fibromyalgia). The population prevalence of one or more of these four chronic pain conditions in BC was 38.2%. This chronic pain indicator variable was used as one condition within a revised multimorbidity index. From this revised multimorbidity index, the proportion of people with 3+ chronic conditions was recalculated to obtain a more conservative estimate of multimorbidity. The data was then reanalyzed using this revised multimorbidity definition.
Data management was conducted in SAS software, University Edition (SAS Institute Inc., Cary, NC, USA), while analyses and some final data management were conducted in R version 3.4.4 (R Core Team, Vienna, Austria).
Results
Data description
In BC, the estimated prevalence of multimorbidity (3+ chronic conditions) in 2015/16 was 17% (95% CI: 16%–18%) with the total number of people affected estimated at 681 921 (Table 1). Significant variation was observed in the estimated prevalence of multimorbidity by HSDA within BC. Richmond and Vancouver had the lowest prevalence at 10.2% and 11.6%, respectively, while Okanagan, North Vancouver Island and Central Vancouver Island had the highest at 22% (Table 1).
Table 1. Multimorbidity prevalence by health service delivery area: CCHS 2015/16, British Columbia subpopulation
| Health service delivery area | Multimorbidity (n; sample) |
Multimorbidity (N)Footnote a of Table 1 |
Multimorbidity (%)Footnote a of Table 1 |
95% CI |
|---|---|---|---|---|
| Central Vancouver Island | 232 | 119 267 | 21.9 | 18.1–25.6 |
| East Kootenay | 141 | 50 253 | 18.0 | 14.6–21.3 |
| Fraser East | 215 | 12 031 | 19.6 | 16.0–23.1 |
| Fraser North | 237 | 47 739 | 15.1 | 12.4–17.7 |
| Fraser South | 294 | 86 445 | 17.5 | 14.8–20.1 |
| Kootenay-Boundary | 158 | 13 542 | 19.6 | 15.9–23.4 |
| North Shore/Coast Garibaldi | 188 | 35 216 | 15.0 | 12.0–17.9 |
| North Vancouver Island | 200 | 22 615 | 22.0 | 18.2–25.9 |
| Northeast | 127 | 9 435 | 16.3 | 12.5–20.0 |
| Northern Interior | 210 | 24 480 | 21.3 | 17.7–24.9 |
| Northwest | 123 | 9 942 | 19.3 | 15.0–23.5 |
| Okanagan | 285 | 67 901 | 22.3 | 19.0–25.5 |
| Richmond | 108 | 19 252 | 10.2 | 7.7–12.6 |
| South Vancouver Island | 237 | 56 317 | 17.2 | 14.5–19.9 |
| Thompson/Cariboo | 207 | 37 773 | 20.4 | 16.9–23.9 |
| Vancouver | 173 | 69 714 | 11.6 | 9.0–14.2 |
| British Columbia (total) | 3135 | 681 921 | 16.9 | 16.0–17.8 |
| British Columbia (sensitivity analysis definition) | 2615 | 576 075 | 14.3 | 13.4–15.0 |
There was statistically significant variation (Rao-Scott test-based p < .05) in estimated multimorbidity prevalence across all sociodemographic characteristics of participants, except fruit and vegetable consumption (Table 2). By age group, multimorbidity prevalence estimates rose from 5% for ages 12 to 29 years up to 38% for those aged 80 years and over. By sex, females in BC had higher prevalence of multimorbidity than males (20% vs. 14%). Multimorbidity estimates were associated with income group: the highest income group (≥ $80 000) had the lowest prevalence (12%) while the lowest income group (< $20 000) had the highest prevalence at 27% (Table 2). Daily smoking status was related to higher estimated prevalence of multimorbidity (27%) than occasional/no smoking (16%). People in households where the education level was less than secondary school had the highest estimated prevalence of multimorbidity (39%) of any covariate group. People classified as obese had an estimated higher prevalence of multimorbidity (26%) than people in overweight and under/normal BMI groups (14%–16%).
Table 2. Multimorbidity prevalence by sociodemographic factors: CCHS 2015/16, British Columbia subpopulation
| Sociodemographic factor | N | Multimorbidity (%) | 95% CI |
|---|---|---|---|
| Age (years) | |||
| 12–29 | 409 015 | 4.6 | 2.6–6.6 |
| 30–49 | 1 235 321 | 7.1 | 5.9–8.3 |
| 50–64 | 958 272 | 14.6 | 12.7–16.6 |
| 65–79 | 920 341 | 26.0 | 23.8–28.1 |
| 80+ | 514 512 | 38.2 | 35.5–40.9 |
| Sex | |||
| Females | 2 045 234 | 19.9 | 18.6–21.2 |
| Males | 1 992 228 | 13.8 | 12.6–15.0 |
| Household income ($) | |||
| < 20 000 | 292 057 | 26.7 | 23.4–30.0 |
| 20 000–39 999 | 632 028 | 27.5 | 24.8–30.1 |
| 40 000–59 999 | 615 696 | 19.4 | 17.3–21.6 |
| 60 000–79 999 | 591 057 | 13.3 | 11.2–15.4 |
| ≥ 80 000 | 1 902 665 | 12.2 | 10.9–13.4 |
| Current smoking | |||
| Occasionally/not at all | 3 667 207 | 15.9 | 15.0–16.8 |
| Daily | 367 369 | 26.9 | 23.2–30.5 |
| Alcohol drinking (past 12 months) | |||
| Regular | 2 427 755 | 15.5 | 14.4–16.6 |
| Occasional | 624 794 | 18.2 | 16.0–20.5 |
| Not at all | 954 734 | 19.8 | 17.7–21.8 |
| Fruit and vegetable consumption (daily) | |||
| < 5 servings | 2 591 313 | 16.2 | 15.2–17.3 |
| ≥ 5 servings | 1 154 123 | 16.3 | 14.7–18.0 |
| Physical activity (WHO guidelines) | |||
| Active | 182 751 | 14.4 | 13.1–15.7 |
| Moderately active | 586 983 | 18.7 | 16.2–21.2 |
| Somewhat active | 620 207 | 17.9 | 15.8–19.9 |
| Inactive | 567 953 | 27.3 | 24.3–30.2 |
| Household education | |||
| < Secondary | 150 780 | 39.0 | 34.3–43.7 |
| Secondary graduate | 62 232 | 21.1 | 18.7–23.4 |
| Postsecondary graduate | 3 081 325 | 14.9 | 13.9–15.9 |
| Body mass index | |||
| Under/normal weight | 1 509 166 | 14.1 | 12.6–15.6 |
| Overweight | 1 237 534 | 15.9 | 14.3–17.4 |
| Obese | 747 209 | 26.2 | 23.9–28.6 |
Results from statistical analysis
The univariable analysis of multimorbidity by HSDA showed significant variation in the estimated prevalence of multimorbidity, with two HSDAs (Richmond and Vancouver) being lower than the reference HSDA (Fraser South), and three HSDAs (Central Vancouver Island, North Vancouver Island and Okanagan) being higher than the reference HSDA (Table 3). After adjusting for multiple potential confounders, Richmond and Vancouver HSDAs still had significantly lower multimorbidity prevalence than Fraser South, while others did not differ significantly from Fraser South or each other (Table 3).
Table 3. Logistic regression analysis of multimorbidity prevalence by health service delivery area: CCHS 2015/16, British Columbia subpopulation
| Health service delivery area | Crude OR (95% CI) |
Age/sex-adjusted OR (95% CI) |
Covariate-adjusted OR (95% CI) |
Multiple imputation pooled OR (95% CI) |
|---|---|---|---|---|
| Central Vancouver Island | 1.33 (1.00–1.76)Footnote * of Table 3 | 1.07 (0.79–1.45) | 1.18 (0.56–1.44) | 1.07 (0.79–1.45) |
| East Kootenay | 1.04 (0.77–1.39) | 0.89 (0.65–1.23) | 0.84 (0.58–1.21) | 0.82 (0.59–1.13) |
| Fraser East | 1.15 (0.86–1.54) | 1.15 (0.84–1.57) | 1.12 (0.77–1.63) | 1.04 (0.74–1.45) |
| Fraser North | 0.84 (0.64–1.11) | 0.85 (0.64–1.13) | 0.89 (0.63–1.25) | 0.84 (0.62–1.13) |
| Fraser South | 1.00 (ref) | 1.00 (ref) | 1.00 (ref) | 1.00 (ref) |
| Kootenay-Boundary | 1.15 (0.86–1.56) | 0.96 (0.70–1.32) | 0.83 (0.57–1.20) | 0.82 (0.59–1.14) |
| North Shore/Coast Garibaldi | 0.83 (0.62–1.12) | 0.71 (0.52–0.97)Footnote * of Table 3 | 0.79 (0.55–1.14) | 0.80 (0.58–1.11) |
| North Vancouver Island | 1.34 (1.00–1.79)Footnote * of Table 3 | 1.09 (0.80–1.48) | 1.11 (0.78–1.58) | 1.02 (0.75–1.38) |
| Northeast | 0.92 (0.66–1.28) | 1.10 (0.80–1.52) | 0.92 (0.62–1.36) | 0.93 (0.66–1.32) |
| Northern Interior | 1.28 (0.97–1.70) | 1.28 (0.95–1.74) | 1.19 (0.84–1.67) | 1.14 (0.84–1.56) |
| Northwest | 1.13 (0.84–1.57) | 1.07 (0.76–1.51) | 0.89 (0.59–1.35) | 0.98 (0.68–1.40) |
| Okanagan | 1.36 (1.04–1.77)Footnote * of Table 3 | 1.13 (0.85–1.50) | 1.13 (0.81–1.56) | 1.11 (0.83–1.47) |
| Richmond | 0.53 (0.39–0.74)Footnote * of Table 3 | 0.47 (0.34–0.66)Footnote * of Table 3 | 0.55 (0.37–0.82)Footnote * of Table 3 | 0.50 (0.35–0.71)Footnote * of Table 3 |
| South Vancouver Island | 0.99 (0.76–1.28) | 0.85 (0.64–1.13) | 0.92 (0.67–1.28) | 0.87 (0.66–1.16) |
| Thompson/Cariboo | 1.21 (0.91–1.61) | 1.02 (0.76–1.37) | 0.93 (0.66–1.31) | 0.88 (0.64–1.20) |
| Vancouver | 0.62 (0.45–0.85)Footnote * of Table 3 | 0.62 (0.45–0.87)Footnote * of Table 3 | 0.65 (0.44–0.97)Footnote * of Table 3 | 0.64 (0.45–0.90)Footnote * of Table 3 |
Missing data analysis
Three covariates had over 5% of participants with missing values: BMI (13.6%), physical activity (11.6%) and fruit and vegetable consumption (6.8%), while the other three variables with missing values—smoking status, alcohol consumption and household income group—had fewer than 4% missing. Multiple imputation was performed twenty times on seven variables (smoking, income, education, fruit and vegetable consumption, alcohol consumption, physical activity and BMI) using HSDA, age group, sex, income, physical activity, alcohol consumption, fruit and vegetable consumption, BMI, education and smoking status to predict the missing values. The results of the survey-weighted logistic regression of the imputed data showed similar results to the final main effects analysis, with Richmond and Vancouver HSDAs having significantly lower adjusted prevalence of multimorbidity than Fraser South (reference HSDA) (Table 3).
Sensitivity analysis
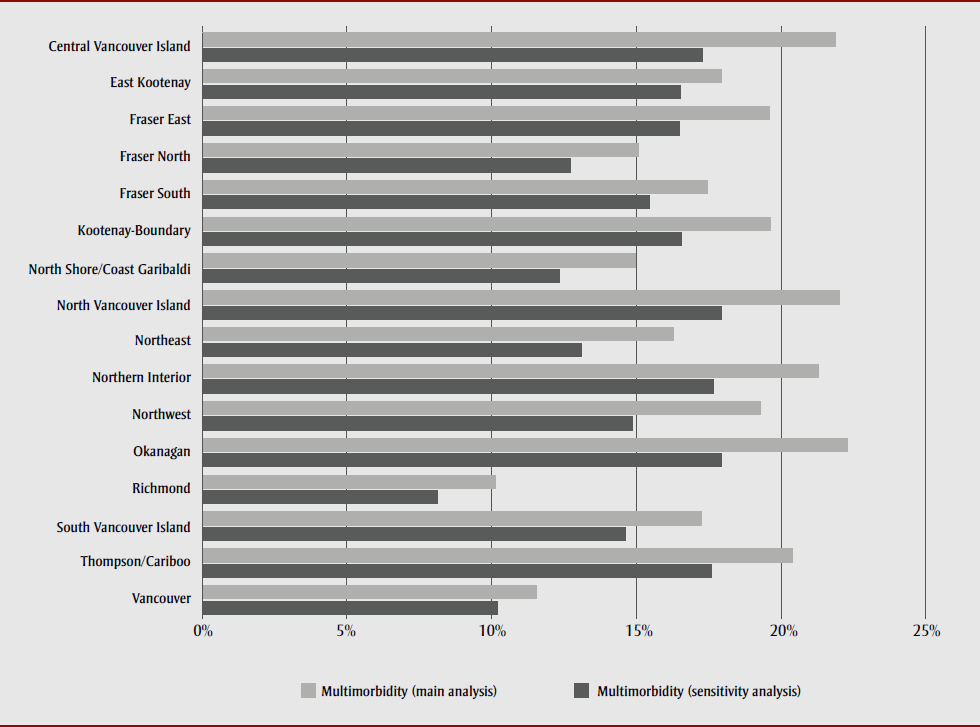
Using the more conservative definition of multimorbidity, the prevalence of multimorbidity in BC was estimated at 14.3%, with an estimated 576 075 people living with multimorbidity (Table 1). Estimated prevalence across all HSDAs was lower in the sensitivity analysis than in the main analysis; however, it did not decline equally across the HSDAs. Richmond and Vancouver had smaller proportionate decreases than other HSDAs (Figure 2). Crude and adjusted logistic regression analyses showed similar differences in multimorbidity prevalence estimates across HSDAs. Richmond’s adjusted OR was 0.49 (95% CI: 0.32–0.75); however, Vancouver’s adjusted OR was 0.69 (95% CI: 0.45–1.06) and was not statistically significant (p = .09) (results of sensitivity analysis available on request).
Figure 2. Multimorbidity prevalence by health service delivery area: Canadian Community Health Survey 2015/16, British Columbia subpopulation
Text description: Figure 2
Figure 2. Multimorbidity prevalence by health service delivery area: Canadian Community Health Survey 2015/16, British Columbia subpopulation
| Health Region / HSDA | Multimorbidity (sensitivity analysis) | Multimorbidity (main analysis) |
|---|---|---|
| Vancouver | 10.22% | 11.56% |
| Thompson/Cariboo | 17.59% | 20.40% |
| South Vancouver Island | 14.63% | 17.25% |
| Richmond | 8.13% | 10.15% |
| Okanagan | 17.95% | 22.29% |
| Northwest | 14.87% | 19.29% |
| Northern Interior | 17.67% | 21.29% |
| Northeast | 13.11% | 16.28% |
| North Vancouver Island | 17.93% | 22.02% |
| North Shore/Coast Garibaldi | 12.34% | 14.96% |
| Kootenay-Boundary | 16.57% | 19.62% |
| Fraser South | 15.46% | 17.44% |
| Fraser North | 12.72% | 15.09% |
| Fraser East | 16.48% | 19.58% |
| East Kootenay | 16.52% | 17.95% |
| Central Vancouver Island | 17.30% | 21.87% |
Discussion
This is the first study to estimate the proportion and number of BC residents living with multimorbidity in each HSDA and to compare multimorbidity prevalence estimates across HSDAs after controlling for potentially confounding variables. A large number of people in BC are estimated to be affected by multimorbidity (between 576 075 and 681 921 people; 13.4%–16.9% of the population). The main finding of this study was that Vancouver and Richmond had significantly lower prevalence of multimorbidity, compared to the reference HSDA, after control of multiple known confounders. None of the other HSDAs had a significantly different prevalence of multimorbidity from the reference HSDA (Fraser South) or from one another.
The lower estimated prevalence of multimorbidity may be due to residual confounding (e.g. income level; the highest level was $80 000+, which does not take into account advantages of increasing income beyond $80 000). The differences in multimorbidity estimates may also be due to unmeasured confounders such as ethnic origin or immigration status, which are known to vary across regions. Persons born outside of Canada tend to experience lower levels of multimorbidity (healthy immigrant effect) while Indigenous populations tend to face higher levels of multimorbity.Footnote 24Footnote 28 The differences in the proportions of immigrant and Indigenous populations between HSDAs may, therefore, be able to explain differences in multimorbidity across HSDAs. Differences in urban form may also explain differences in multimorbidity prevalence. Urban form has complex and poorly understood effects on chronic disease incidence and prevalence. Features of urban form, for example, transportation systems, act upon multiple potential risk factors, such as physical activity or sense of community, which in turn could affect multimorbidity prevalence.Footnote 29
A recent analysis by BCCDC scientists of age-adjusted multimorbidity prevalence in BC by HSDA showed similarly low prevalence in Richmond and Vancouver, although not as pronounced a difference as in the estimates in the present study.Footnote 9 The BCCDC estimates were higher, averaging 29% across BC, due to the use of a 2+ chronic condition definition of multimorbidity, and restriction to persons aged ≥ 20 years.Footnote 9 The Feely et al. multimorbidity (3+ chronic conditions) prevalence estimate for BC (9.1%) was lower than the multimorbidity prevalence estimates from the main analysis (16.9%) and sensitivity analysis (13.4%), likely due to different conditions included, data sources and time period.Footnote 7 Compared to Roberts et al., who also used CCHS to estimate the prevalence of 3+ chronic conditions in BC (3.9%) in 2011/12, the multimorbidity prevalence estimates in this paper appear high.Footnote 24 The exclusion of hypertension, the most prevalent chronic condition in CCHS, and use of nine conditions from the CCHS to define multimorbidity may explain the lower prevalence finding of Roberts et al.Footnote 24
Patterns in multimorbidity prevalence across known confounders, such as age group, sex, income, smoking status, education and physical activity were consistent with the literature.Footnote 3Footnote 5Footnote 30 Regular and occasional drinkers had a lower estimated prevalence of multimorbidity compared to nondrinkers. This relationship has been explored elsewhere,Footnote 31 with the “sick-quitter” hypothesis offered as a potential explanation. Fruit and vegetable consumption (< 5 vs. 5+ servings per day) was not related to multimorbidity prevalence in crude analysis (Table 2) or adjusted analyses (results not shown), which was not consistent with the literature.Footnote 5Footnote 32 People classified as obese had a higher prevalence of multimorbidity (Table 2), and the BMI variable was significant in univariable and multivariable models (data not shown). Recent literature on BMI and multimorbidity has shown a large and significant effect of obesity on multimorbidity prevalence, and this study’s findings were consistent (adj-OR for multimorbidity between obese and normal/under weight was 2.14 [95% CI: 1.76–2.60]; data not shown).Footnote 22Footnote 33
Strengths and limitations
All members of the population aged 12 years and older, with the exception of First Nations communities, were included in this study. Multimorbidity was defined from 17 candidate conditions using the more clinically relevant definition of 3+ conditions. Multiple risk factors for multimorbidity were adjusted for in the analysis, which studies and surveillance systems employing administrative data generally cannot do. Findings from the main analysis were robust to missing data for covariates and were also substantially similar when a revised definition of multimorbidity was used in the sensitivity analysis.
This study carries the limitations of the CCHS as well as some specific to this analysis. First, the definition of multimorbidity used here was based on self-reported diagnoses of the chronic conditions included in the CCHS, as were covariates. This may introduce some differential misclassification bias across HSDAs, although the extent of this potential misclassification bias cannot be assessed within the present study. A further limitation of the multimorbidity definition used here is the equal weighting of all cancers. Because CCHS does not provide information about cancer site, differential weighting of cancer sites could not be addressed in this study’s multimorbidity index.
Second, the CCHS excludes First Nations reserve communities by design, limiting interpretation to off-reserve populations. In 2016, there were an estimated 172 520 First Nations persons living in BC, of whom 40.1% (69 180) were estimated to live on-reserve.Footnote 34 The adjusted odds ratio for multimorbidity (3+ conditions) has been estimated at 2.7 (95% CI: 2.2–3.4) among Indigenous compared to non-Indigenous Canadians.Footnote 24 Therefore, this study may have underestimated the true prevalence of multimorbidity in BC. Potential solutions are discussed later on.
Third, people who do not have a permanent dwelling or access to a regular telephone are excluded from the sampling frame. These populations may be at particular risk for multimorbidity, given its socioeconomic dimensions.Footnote 35
Fourth, CCHS data is collected cross-sectionally, which means temporality cannot be established. For example, in the relationship between BMI and multimorbidity, obese persons were found to have higher estimated prevalence of multimorbidity; however, it is not known whether multimorbidity preceded obesity, or vice versa. Because of the way it is collected, multiple years of cross-sectional data, such as the CCHS provides, could be assembled longitudinally, yet the data will remain cross-sectional.
Implications and applications
The main implication of this study, given the substantial number of people estimated to be living with multimorbidity in BC in each HSDA, ranging from 9435 to 119 267 people in 2015/16, is that policy and program development for integrated patient-centred care coordination are warranted. In BC, RHAs are tasked with developing policy and setting priorities for regional health, as well as developing regional health plans for health services, facilities, programs, human resource requirements and activities in support of regional health.Footnote 12 RHAs could explicitly incorporate multimorbidity as a focal point for integrated patient-centred care within these functions. Patients with multimorbidity report concerns with disease-centred rather than patient-centred care and desire that patient priorities be given more consideration in planning, and that patients are involved in care decisions.Footnote 36
A starting point for integrated patient-centred care planning may be as simple as developing a policy and setting multimorbidity care as a priority within each RHA, considering both case complexity and care complexity in such policies.Footnote 37Footnote 38 Models for and effective elements of integrated patient-centred care for multimorbidity have been reviewed elsewhere and would need consideration within the BC context and within each RHA.Footnote 39Footnote 40 Multimorbidity care coordinators that could listen to the concerns of patients and help coordinate their experience and involvement in care decisions across facilities and providers may be a valuable place to begin for tangible service delivery to older patients with multimorbidity.Footnote 41
In addition to addressing integrated patient-centred care for patients with multimorbidity explicitly, RHAs could also use these results to justify upstream prevention activities. Conducting predictive modelling would help determine how health promotion strategies could be targeted to those at greatest risk of multimorbidity provincially, by RHA or by HSDA. The CCHS would be a valuable data source for multimorbidity predictive modelling, and such modelling would be a natural extension of this study. Briefly, from the crude prevalence estimates (Table 2), it appears those with lowest education levels, those in low-income households, people with obesity, those who are inactive physically and daily smokers are groups that would benefit from targeted prevention programming.
To help fill gaps in multimorbidity surveillance and research in BC, administrative health data may be combined with survey and census data, and more participatory approaches adopted for policy and program development. A recent request-to-contact study initiated in BC used administrative data to identify a large number (n = 12 000) of people with and without systemic autoimmune rheumatic diseases (SARDs) and then subsequently contacted them for enrollment in a cohort study.Footnote 42 This was the first instance of this form of research in Canada. This method could be valuable in recruiting regionally representative numbers of people with multimorbidity, using the numbers presented in this paper as a sampling frame. This method could support involvement of patients in epidemiological and health service research that could be incorporated into policy development and the setting of priorities by RHAs.
Collaboration with First Nations in BC who are excluded from the CCHS could improve the representativeness of regional estimates of multimorbidity prevalence as well as the appropriateness of any policies to address multimorbidity developed with RHAs. This could involve collaboration with the First Nations Health Authority of BC in multimorbidity surveillance and research through the First Nations Regional Longitudinal Health Survey (RHS). The RHS is a First Nations–owned survey conducted across Canada that provides high-quality data with the ability to assess multimorbidity among First Nations communities and the potential for linkage with administrative data.Footnote 43Footnote 44Footnote 45Footnote 46 Multimorbidity could be a lens through which to examine known challenges in care coordination among First Nations peoples, as there are substantial numbers of First Nations people on- and off-reserve living with multimorbidity who are facing such challenges.Footnote 46Footnote 47 If BC’s Ministry of Health and RHAs decide to address multimorbidity directly through policy and program development, a consultation process with First Nations would be an important component of this work. If First Nations in BC agreed to participate in such a consultation, it could provide a stronger basis for policy and program development that legitimately meets the needs of First Nations in BC for integrated patient-centred care for people living with multimorbidity.
Conclusion
This study demonstrates the usefulness of survey data in estimating the prevalence of multimorbidity for health services researchers within BC. Adjustment for key risk factors for multimorbidity affected prevalence estimates but did not explain the significantly lower estimated prevalence of multimorbidity in Vancouver and Richmond. Ongoing multimorbidity surveillance and research are needed in BC to provide support to practitioners and policy makers seeking to influence the prevalence and incidence of multimorbidity, and the care of people living with multimorbidity. The CCHS represents a valuable source of data for such analyses, and may be integrated with other surveys, administrative data and census data to provide a more complete picture of regional multimorbidity prevalence within BC. Given the large number of people living with multimorbidity in BC, policy development and priority setting for multimorbidity are warranted in all RHAs and throughout the province.
Conflicts of interest
None.
Author contribution and statement
CAB designed the study, conducted the analysis, and drafted the manuscript and takes complete responsibility for its contents.
The content and views expressed in this article are those of the author and do not necessarily reflect those of the Government of Canada or any other entities.