
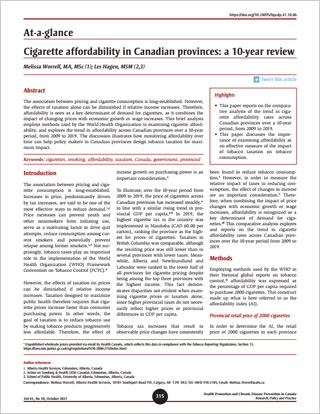
At-a-glance – Cigarette affordability in Canadian provinces: a 10-year review

HPCDP Journal Home
Published by: The Public Health Agency of Canada
Date published: October 2021
ISSN: 2368-738X
Submit a manuscript
About HPCDP
Browse
Previous | Table of Contents | Next
Melissa Worrell, MA, MScAuthor reference footnote 1; Les Hagen, MSMAuthor reference footnote 2Author reference footnote 3
https://doi.org/10.24095/hpcdp.41.10.06
Author references
Correspondence
Melissa Worrell, Alberta Health Services, 10101 Southport Road SW, Calgary, AB T2W 3N2; Tel: (403) 910-2105; Email: Melissa.Worrell@ahs.ca
Suggested citation
Worrell M, Hagen L. Cigarette affordability in Canadian provinces: a 10-year review. Health Promot Chronic Dis Prev Can. 2021;41(10):315-8. https://doi.org/10.24095/hpcdp.41.10.06
Abstract
The association between pricing and cigarette consumption is long-established. However, the effects of taxation alone can be diminished if relative income increases. Therefore, affordability is seen as a key determinant of demand for cigarettes, as it combines the impact of changing prices with economic growth or wage increases. This brief analysis employs methods used by the World Health Organization in examining cigarette affordability, and explores the trend in affordability across Canadian provinces over a 10-year period, from 2009 to 2019. The discussion illustrates how monitoring affordability over time can help policy makers in Canadian provinces design tobacco taxation for maximum impact.
Keywords: cigarettes, smoking, affordability, taxation, Canada, government, provincial
Highlights
- This paper reports on the comparative analysis of the trend in cigarette affordability rates across Canadian provinces over a 10-year period, from 2009 to 2019.
- This paper discusses the importance of examining affordability as an effective measure of the impact of tobacco taxation on tobacco consumption.
Introduction
The association between pricing and cigarette consumption is long-established. Increases in price, predominantly driven by tax increases, are said to be one of the most effective ways to reduce demand.Footnote 1Footnote 2 Price increases can prevent youth and other nonsmokers from initiating use, serve as a motivating factor to drive quit attempts, reduce consumption among current smokers and potentially prevent relapse among former smokers.Footnote 1Footnote 3 Not surprisingly, tobacco taxes play an important role in the implementation of the World Health Organization (WHO) Framework Convention on Tobacco Control (FCTC).Footnote 4
However, the effects of taxation on prices can be diminished if relative income increases. Taxation designed to maximize public health therefore requires that cigarette prices increase faster than consumer purchasing power. In other words, the goal of taxation is to reduce tobacco use by making tobacco products progressively less affordable. Therefore, the effect of income growth on purchasing power is an important consideration.Footnote 5
To illustrate, over the 10-year period from 2009 to 2019, the price of cigarettes across Canadian provinces has increased steadily,Footnote * in line with a similar rising trend in provincial GDP per capita.Footnote 6Footnote 7Footnote 8Footnote 9 In 2019, the highest cigarette tax in the country was implemented in Manitoba (CAD 60.00 per carton), ranking the province as the highest for prices of cigarettes. Taxation in British Columbia was comparable, although the resulting price was still lower than in several provinces with lower taxes. Meanwhile, Alberta and Newfoundland and Labrador were ranked in the lower half of all provinces for cigarette pricing despite being among the top three provinces with the highest income. This fact demonstrates disparities not evident when examining cigarette prices or taxation alone, since higher provincial taxes do not necessarily reflect higher prices or provincial differences in GDP per capita.
Tobacco tax increases that result in observable price changes have consistently been found to reduce tobacco consumption.Footnote 5 However, in order to measure the relative impact of taxes in reducing consumption, the effect of changes in income are an important consideration.Footnote 5 Therefore, when combining the impact of price changes with economic growth or wage increases, affordability is recognized as a key determinant of demand for cigarettes.Footnote 10 This comparative analysis explores and reports on the trend in cigarette affordability rates across Canadian provinces over the 10-year period from 2009 to 2019.
Methods
Employing methods used by the WHO in their biennial global reports on tobacco control,Footnote 11 affordability was expressed as the percentage of GDP per capita required to purchase 2000 cigarettes. This construct made up what is here referred to as the affordability index (AI).
Provincial retail price of 2000 cigarettes
In order to determine the AI, the retail price of 2000 cigarettes in each province was first determined. Unpublished wholesale unit cigarette pricing data were provided by Health Canada (Tobacco Reporting Regulations, Section 13). The industry unit price was an average derived by dividing unit volume into the total cigarette sales in each province. This average price was added to federal excise tax rates per unit to arrive at wholesale unit prices. These provincial unit prices were used (multiplied by 200) to obtain the provincial wholesale prices per carton of 200 cigarettes.
Provincial excise tax data were then obtained using historic rates reported by the Propel Centre for Population Health Impact,Footnote 6 data from the Smoking and Health Action FoundationFootnote 7 and unpublished tax tables (for 2019) compiled by the Canadian Cancer Society (Cunningham R, Senior Policy Analyst, 28 October 2019, via email). These data were added to the provincial wholesale price per carton in each jurisdiction.
Provincial retail prices were then derived by calculating any applicable provincial sales tax (PST), goods and services tax (GST) or harmonized sales tax (HST). Summaries of tax rates and changes over time were sourced from the Propel Centre for Population Health ImpactFootnote 6 and the Canadian Cancer Society tobacco tax tables. Finally, the provincial retail price per carton was converted to the retail price of 2000 cigarettes (multiplied by 10).
GDP per capita
The income-based provincial GDP at market prices is reported annually by Statistics Canada, and this rate was used in per capita calculations.Footnote 8 The provincial GDP was divided into the provincial population at the first quarter (Q1) of each calendar yearFootnote 9 to determine the GDP per capita.
Affordability index
The retail price of 2000 cigarettes divided into the GDP per capita and expressed as a percentage represents the affordability index (AI). A higher AI value represents lower cigarette affordability, and a lower AI represents higher cigarette affordability.
Trend analysis
The provincial AI trend over a 10-year period from 2009 to 2019 was further analyzed to determine whether affordability changed on average, in each province, over time. The average annual percentage change in affordability was used as the least-squares growth rate to determine if affordability had changed. The least-squares growth rate was determined by fitting a linear regression trend line on the logarithmic values of the AI. Cigarette affordability was deemed unchanged if the least-squares trend in AI was not significant at the 5% level, and deemed more (or less) affordable on average if the trend in AI was positive (or negative) and significantly different from zero at the 5% level.
Results
Figure 1 demonstrates an overall rising trend in the affordability index over time for all provinces, indicating cigarettes were becoming less affordable over time. In the 10-year period examined, the provinces of Nova Scotia and Prince Edward Island had intermittently been the jurisdictions with the lowest cigarette affordability, while Alberta has consistently been the most affordable jurisdiction when comparing price with GDP per capita.
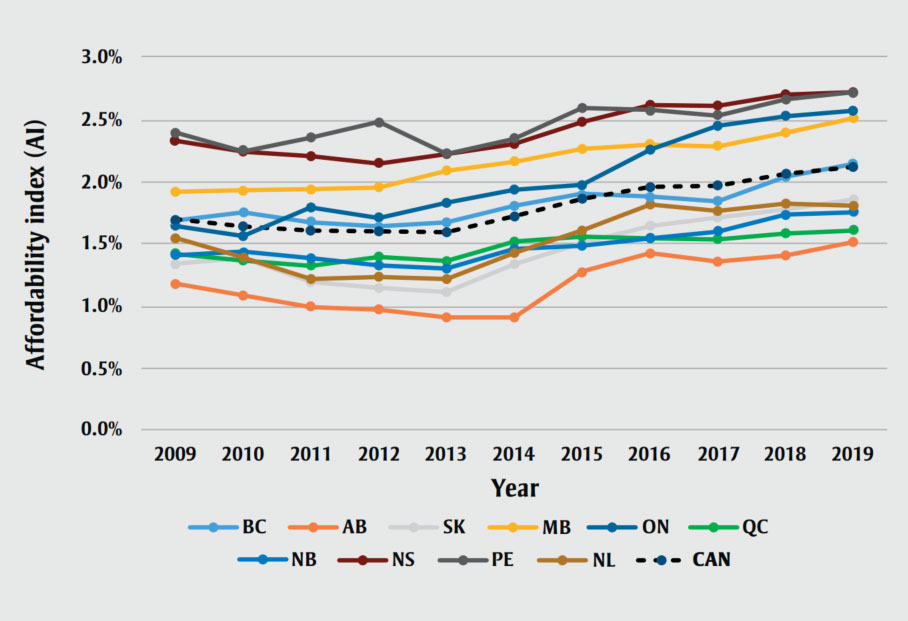
Figure 1 - Text description
| Province | Year | ||||||||||
|---|---|---|---|---|---|---|---|---|---|---|---|
| 2009 | 2010 | 2011 | 2012 | 2013 | 2014 | 2015 | 2016 | 2017 | 2018 | 2019 | |
| BC | 1.69% | 1.75% | 1.68% | 1.64% | 1.68% | 1.81% | 1.90% | 1.88% | 1.85% | 2.05% | 2.15% |
| AB | 1.18% | 1.09% | 1.00% | 0.98% | 0.92% | 0.91% | 1.28% | 1.43% | 1.36% | 1.41% | 1.51% |
| SK | 1.35% | 1.39% | 1.20% | 1.15% | 1.12% | 1.34% | 1.51% | 1.65% | 1.72% | 1.78% | 1.86% |
| MB | 1.92% | 1.94% | 1.94% | 1.96% | 2.09% | 2.17% | 2.27% | 2.31% | 2.29% | 2.40% | 2.52% |
| ON | 1.42% | 1.43% | 1.38% | 1.33% | 1.31% | 1.46% | 1.49% | 1.55% | 1.61% | 1.74% | 1.76% |
| QC | 1.43% | 1.37% | 1.33% | 1.40% | 1.37% | 1.52% | 1.57% | 1.55% | 1.54% | 1.59% | 1.62% |
| NB | 1.66% | 1.57% | 1.79% | 1.72% | 1.83% | 1.94% | 1.98% | 2.26% | 2.46% | 2.53% | 2.58% |
| NS | 2.34% | 2.25% | 2.21% | 2.15% | 2.22% | 2.31% | 2.48% | 2.61% | 2.61% | 2.69% | 2.72% |
| PE | 2.39% | 2.25% | 2.36% | 2.48% | 2.23% | 2.35% | 2.60% | 2.58% | 2.54% | 2.67% | 2.72% |
| NL | 1.55% | 1.39% | 1.22% | 1.24% | 1.22% | 1.43% | 1.61% | 1.82% | 1.77% | 1.83% | 1.81% |
| CAN | 1.69% | 1.64% | 1.61% | 1.60% | 1.60% | 1.72% | 1.87% | 1.96% | 1.97% | 2.07% | 2.12% |
Abbreviations: AB, Alberta; BC, British Columbia;
CAN, Canada; MB, Manitoba; NB, New Brunswick; NL, Newfoundland and Labrador;
NS, Nova Scotia; ON, Ontario; PE, Prince Edward Island; QC, Quebec; SK,
Saskatchewan.
Note: Affordability is expressed as an index (AI)
representing the percentage provincial GDP per capita required to purchase 2000
cigarettes at an average provincial retail price. Higher AI indicates lower
affordability; lower AI indicates higher affordability.
In examining the overall trend for the 10-year period, we found that for all provinces there was an increase in the AI (i.e. a decrease in cigarette affordability) that was significant at the 5% level.
Table 1 provides a comparison between provincial excise tax rates and the corresponding AI value that year, by province. The table illustrates how taxation, while not the sole factor, contributes to changes in affordability. For example, in provinces such as British Columbia, Alberta and Ontario, where tax increases were uncommon in the first half of the decade, cigarette affordability gradually increased, illustrating a need for tax increases during this period. Meanwhile, many provinces reflected a decrease in affordability between 2017 and 2019, despite not implementing provincial tax increases, indicating reduced purchasing power due to factors outside of taxation, such as tobacco manufacturer price increases.
| Province | Tax and AI | 2009 | 2010 | 2011 | 2012 | 2013 | 2014 | 2015 | 2016 | 2017 | 2018 | 2019 |
|---|---|---|---|---|---|---|---|---|---|---|---|---|
| BC | Tax ($) | 37.00Footnote b | 37.00 | 37.00 | 37.00 | 44.60Footnote b | 47.80Footnote b | 47.80 | 47.80 | 47.80 | 55.00Footnote b | 59.00Footnote b |
| AI (%) | 1.69 | 1.75 | 1.68 | 1.64 | 1.68 | 1.81 | 1.90 | 1.88 | 1.85 | 2.05 | 2.15 | |
| AB | Tax ($) | 40.00Footnote b | 40.00 | 40.00 | 40.00 | 40.00 | 40.00 | 50.00Footnote b | 50.00 | 50.00 | 50.00 | 55.00Footnote b |
| AI (%) | 1.18 | 1.09 | 1.00 | 0.98 | 0.92 | 0.91 | 1.28 | 1.43 | 1.36 | 1.41 | 1.51 | |
| SK | Tax ($) | 36.60 | 42.00Footnote b | 42.00 | 42.00 | 50.00Footnote b | 50.00 | 50.00 | 50.00 | 54.00Footnote b | 54.00 | 54.00 |
| AI (%) | 1.35 | 1.39 | 1.20 | 1.15 | 1.12 | 1.34 | 1.51 | 1.65 | 1.72 | 1.78 | 1.86 | |
| MB | Tax ($) | 37.00Footnote b | 41.00Footnote b | 45.00Footnote b | 50.00Footnote b | 58.00Footnote b | 58.00 | 59.00Footnote b | 59.00 | 59.00 | 59.00 | 60.00Footnote b |
| AI (%) | 1.92 | 1.94 | 1.94 | 1.96 | 2.09 | 2.17 | 2.27 | 2.31 | 2.29 | 2.40 | 2.52 | |
| ON | Tax ($) | 24.70 | 24.70 | 24.70 | 24.70 | 24.70 | 27.95Footnote b | 27.95 | 30.95Footnote b | 32.95Footnote b | 36.95Footnote b | 36.95 |
| AI (%) | 1.42 | 1.43 | 1.38 | 1.33 | 1.31 | 1.46 | 1.49 | 1.55 | 1.61 | 1.74 | 1.76 | |
| QC | Tax ($) | 20.60 | 20.60 | 21.20Footnote b | 25.80Footnote b | 25.80 | 29.80Footnote b | 29.80 | 29.80 | 29.80 | 29.80 | 29.80 |
| AI (%) | 1.43 | 1.37 | 1.33 | 1.40 | 1.37 | 1.52 | 1.57 | 1.55 | 1.54 | 1.59 | 1.62 | |
| NB | Tax ($) | 23.50 | 23.50 | 34.00Footnote b | 34.00 | 38.00Footnote b | 38.00 | 38.00 | 44.52Footnote b | 51.04Footnote b | 51.04 | 51.04 |
| AI (%) | 1.66 | 1.57 | 1.79 | 1.72 | 1.83 | 1.94 | 1.98 | 2.26 | 2.46 | 2.53 | 2.58 | |
| NS | Tax ($) | 43.04Footnote b | 43.04 | 43.04 | 43.04 | 47.04Footnote b | 47.04 | 51.04Footnote b | 55.04Footnote b | 55.04 | 55.04 | 55.04 |
| AI (%) | 2.34 | 2.25 | 2.21 | 2.15 | 2.22 | 2.31 | 2.48 | 2.61 | 2.61 | 2.69 | 2.72 | |
| PE | Tax ($) | 39.10 | 39.10 | 45.00Footnote b | 45.00 | 45.00 | 45.00 | 50.00Footnote b | 50.00 | 50.00 | 50.00 | 50.00 |
| AI (%) | 2.39 | 2.25 | 2.36 | 2.48 | 2.23 | 2.35 | 2.60 | 2.58 | 2.54 | 2.67 | 2.72 | |
| NL | Tax ($) | 36.00 | 38.00Footnote b | 38.00 | 38.00 | 41.00Footnote b | 47.00Footnote b | 47.00 | 49.00Footnote b | 49.00 | 49.00 | 49.00 |
| AI (%) | 1.55 | 1.39 | 1.22 | 1.24 | 1.22 | 1.43 | 1.61 | 1.82 | 1.77 | 1.83 | 1.81 | |
| CAN | AI (%) | 1.69 | 1.64 | 1.61 | 1.60 | 1.60 | 1.72 | 1.87 | 1.96 | 1.97 | 2.07 | 2.12 |
Abbreviations: AB, Alberta; AI, affordability index; BC, British Columbia; CAN, Canada; MB, Manitoba; NB, New Brunswick; NL, Newfoundland and Labrador; NS, Nova Scotia; ON, Ontario; PE, Prince Edward Island; QC, Quebec; SK, Saskatchewan.
|
||||||||||||
Discussion
Over the past decade, the affordability of cigarettes in all Canadian provinces has declined, despite an overall rise in GDP. On average, cigarettes in Canada were 26% less affordable in 2019 compared to 2009. The magnitude of change in provincial affordability varied significantly, with the largest decrease in New Brunswick, where cigarettes became 55% less affordable over the 10-year period. This substantial change in affordability corresponds to a 117% increase in cigarette taxation over the same timeframe (Table 1), the highest tax increase of any province. Meanwhile, the lowest rate of change in affordability was seen in Quebec, with a 13% decrease. Importantly, this reduction occurred despite a 45% increase in cigarette taxes over the timeframe, which represented greater changes in taxation than was seen in Alberta, Nova Scotia, Prince Edward Island or Newfoundland and Labrador.
The findings of this analysis emphasize that differences in GDP across subnational jurisdictions are an important factor when designing functional tax policy and when making cross-jurisdiction comparisons. This observation is further exemplified by the top three largest economies and tobacco markets in Canada—Ontario, Quebec and Alberta—which are also the provinces with the lowest AI, or highest cigarette affordability rates. The WHO “MPOWER” measures recommend taxes that represent 75% or more of the retail price of cigarettes;Footnote 11 a closer examination of the 2019 taxation in these provinces demonstrates that 66% to 69% of the price of a carton of cigarettes is made up of taxes. However, tobacco taxes represent a comparable 69% of the retail price of a cigarette carton in Prince Edward Island, where the affordability rate is one of the lowest in the country. The affordability index presented in this paper therefore serves as a vital adjunct to the measure of pricing and taxation, thus forming a more complete picture to inform tax policy design that addresses context.
Strengths and limitations
Comparing cigarette affordability using GDP per capita across Canadian jurisdictions provides benchmark data that can be used in designing effective tax policy. The trend lines demonstrate which tax increases resulted in sharp changes in affordability, such as the pivotal taxes implemented in Alberta in 2015 that resulted in a 41% increase in AI, or drop in annual affordability. Our study also allows for another important observation: the differences in cross-border affordability, such as between Manitoba and its neighbouring provinces. In 2019, annual affordability in Manitoba was 36% less than Saskatchewan and 43% less than Ontario. Studies on the implications of such subnational differences in affordability may provide valuable insights that have not previously been documented.
There are, however, certain limitations. This study examines affordability in Canadian provinces over time. The findings reflect a retrospective observation of a trend or impact, but they do not provide a recommended AI value for prospective planning or design. The authors were unable to identify studies recommending an optimal AI value. The WHO monitors changes in affordability and urges countries to ensure that affordability is decreasing over time. While targets to decrease affordability can be set by individual countries or subnational governments through exploration of AI trend lines, a “gold-standard” recommendation for AI value would be useful. Research to determine the optimal AI value at which cigarette consumption is significantly reduced would be valuable to tobacco control.
Conclusion
Provincial cigarette tax increases have resulted in reduced affordability over time, and they have contributed to reduced smoking prevalence and consumption. However, provinces need to ensure that cigarette tax increases are sustained in a manner that exceeds economic growth and wage increases in order to achieve the desired effect of reducing consumption. Provinces can apply an additional indexed (ad valorem) tobacco tax that is tied to the Consumer Price Index, relative wage increases or GDP increases to ensure that affordability does not increase over time. Monitoring affordability over time also contributes valuable data to maximize impact in the design of tobacco taxation structures at the subnational level in Canada.
Conflicts of interest
LH is employed by an organization that receives public and private sector funding that is not derived from tobacco or vaping companies. MW has no conflicts of interest.
Authors’ contributions and statement
MW and LH contributed to the design and conceptualization of the work and acquisition of the data. Data was analyzed by MW and validated by LH. Both authors contributed to the interpretation of the data and the drafting and revising of the article, and approved the final article.
The content and views expressed in this article are those of the authors and do not necessarily reflect those of the Government of Canada.