
Original quantitative research – Associations between meteorological factors and emergency department visits for unintentional falls during Ontario winters

HPCDP Journal Home
Published by: The Public Health Agency of Canada
Date published: December 2021
ISSN: 2368-738X
Submit a manuscript
About HPCDP
Browse
David Huynh, MScAuthor reference footnote 1; Caleigh TracyAuthor reference footnote 2; Wendy Thompson, MScAuthor reference footnote 3; Felix Bang, MPHAuthor reference footnote 3; Steven R. McFaull, MScAuthor reference footnote 3; Jaymes CurranAuthor reference footnote 4; Paul J. Villeneuve, PhDAuthor reference footnote 1
https://doi.org/10.24095/hpcdp.41.12.01
This article has been peer reviewed.
Author references
Correspondence
Paul J. Villeneuve, School of Mathematics and Statistics, Carleton University, Herzberg Building, Room 5413, 1125 Colonel By Dr., Ottawa, ON K1S 5B6; Tel: (613) 520-2600 ext. 3359; Email: Paul.Villeneuve@carleton.ca
Suggested citation
Huynh D, Tracy C, Thompson W, Bang F, McFaull SR, Curran J, Villeneuve. Associations between meteorological factors and emergency department visits for unintentional falls during Ontario winters. Health Promot Chronic Dis Prev Can. 2021;41(12):401-12. https://doi.org/10.24095/hpcdp.41.12.01
Abstract
Introduction: Unintentional falls are a leading cause of injury-related hospital visits among Canadians, especially seniors. While certain meteorological conditions are suspected risk factors for fall-related injuries, few studies have quantified these associations across a wider range of age groups and with population-based datasets.
Methods: We applied a time-stratified case-crossover study design to characterize associations of highly-spatially-resolved meteorological factors and emergency department (ED) visits for falls, in Ontario, among those aged 5 years and older during the winter months (November to March) between 2011 and 2015. Conditional logistic models were used to estimate the odds ratios (ORs) and their 95% confidence intervals (CIs) for these visits in relation to daily snowfall accumulation, including single-day lags of up to one week before the visit, and daily mean temperature on the day of the visit. Analyses were stratified by age and sex.
Results: We identified 761 853 fall-related ED visits. The odds for these visits was increased for most days up to a week after a snowfall of 0.2 cm or greater (OR = 1.05–1.08) compared to days with no snowfall. This association was strongest among adults aged 30 to 64 years (OR = 1.16–1.19). The OR for fall-related ED visits on cold days (less than −9.4 °C) was reduced by 0.05 relative to days with an average daily temperature of 3.0 °C or higher (OR = 0.95; 95% CI: 0.94, 0.96), and this pattern was evident across all ages. There were no substantive differences in the strength of this association by sex.
Conclusion: Snowfall and warmer winter temperatures were associated with an increased risk of fall-related ED visits during Ontario winters. These findings are relevant for developing falls prevention strategies and ensuring timely treatment.
Keywords: case-crossover, unintentional falls, accidental falls, injuries, weather, snow, ambient temperature, winter
Highlights
- A snowfall accumulation of 0.2 cm or greater was associated with an increased number of fall-related emergency department (ED) visits.
- Colder days (temperatures lower than −9.4 ℃) were associated with a decrease in fall-related ED visits compared to days with an average daily temperature of 3.0 °C or higher.
- Adults between 30 and 44 years old had the highest likelihood of a fall-related ED visit after snowfall or at low temperature.
- Our findings suggest that snowfall increases the risks of falls and provide some support for policies that reduce these risks.
Introduction
About 37.3 million falls that require medical attention occur globally every year.Footnote 1 In Canada, falls are the leading cause of injury among older adults, accounting for 85% of injury-related hospitalizations in this demographic.Footnote 2Footnote 3 The number of fall-related deaths and self-reported injuries in older adults increased by 65% from 2003 to 2008 and by 43% from 2003 to 2009/2010.Footnote 2 This trend is worrying as the likelihood of experiencing a fall increases with age and Canada’s population is aging.Footnote 3 Nevertheless, the public health concern for older adults should span across all ages given that those younger than 65 years made up about 70% of emergency department (ED) visits for falls in 2017/2018.Footnote 4 Furthermore, there are differences by sex, with females accounting for 54% of fall-related ED visits compared to 46% for males in 2017/2018.Footnote 4 This is especially important considering that the prevalence of osteoporosis is more than two times greater among women,Footnote 5 and this health condition leaves women more vulnerable to injuries from falls. As falls can result in mortality and significant morbidity (e.g. injuries, chronic pain, functional decline, mental health issues, reduced quality of life, etc.),Footnote 2Footnote 3Footnote 6 there is a public health benefit to an improved understanding of the factors contributing to falls.
Slippery conditions due to ice and snow have been implicated as one of the primary causes of outdoor falls,Footnote 7Footnote 8 indicating that falls are more likely to occur during winter. Although Chow et al.Footnote 9 found conflicting findings in the literature on the seasonality of falls, most of the studies they examined found an increased incidence in falls during winter among older adults, and the authors suggested that cold temperatures and slippery conditions during winter likely contributed to this increase.Footnote 9Footnote 10Footnote 11 Given these findings and that over half of falls reported among those aged 18 to 44 yearsFootnote 7 and about half of the falls among community-dwelling older adults occurred outdoors,Footnote 12 weather is likely an important risk factor. Despite these findings, most messaging to do with preventing falls relates to modifications in ergonomics, built environments and modifiable health behaviours rather than weather.Footnote 13Footnote 14Footnote 15
Previous studies have shown snowfall was 13.4 times more likely to occur before days with excess ED visits for falls than before periods without excess visits.Footnote 16 Others found a 38% increase in falls involving ice and snow compared with risks on dry weather daysFootnote 17 and an 18% increase in fall-related hospitalizations within 6 days of a snowfall.Footnote 18 In addition, fall-related injuries were 31% higher among men and 15% higher among women on days where freezing rain alerts were issued,Footnote 19 and the number of outdoor falls doubled a few days following freezing rain compared to days without excess falls during the month of December.Footnote 20 Past research also found that these increases typically have a lag period, beginning a few days after a winter meteorological event (e.g. ice storm, snowstorm, and freezing rain) and persisting for up to a week after its occurrence.Footnote 8Footnote 16Footnote 18Footnote 20Footnote 21Footnote 22 Furthermore, it has been suggested that falls and hospitalizations for fall-related injuries among seniors increase as average daily temperature decreases.Footnote 11Footnote 23 More specifically, Luukinen et al.Footnote 11 found that the incidence rate of outdoor falls among the elderly was about 4.5 times greater on days with an average daily temperature less than −20 °C compared to days of at least 10 °C.
Although these studies provide some insight into how meteorological events may increase the risk for a fall and related hospital care, their generalizability is limited. Firstly, almost all studies investigating relationships between meteorological factors and hospital care for falls focussed exclusively on older adults.Footnote 8Footnote 9Footnote 10Footnote 11Footnote 23Footnote 24 Secondly, the Canadian studies that have explored these associations have largely focussed on the impacts of major storms and freezing rain.Footnote 8Footnote 20Footnote 22 Thus, previous studies have not reported associations between more frequent winter meteorological events (e.g. everyday snowfall and cold temperatures) and falls; nor have they consistently explored variations by age. By understanding the relationships between meteorological factors and fall-related hospital care among residents of Ontario, we are better able to anticipate the health care resources required to treat these events and target injury prevention.
To address research gaps in this topic area, the aim of this study was to examine the influence of snowfall and temperature on fall-related ED visits during winter months in Ontario and investigate whether these associations differed by sex and age.
Methods
Study design
We used a time-stratified case-crossover study design to evaluate associations between meteorological factors (e.g. daily snowfall accumulation and daily average temperature) and the occurrence of ED visits for unintentional falls during winter months. This design is effective for evaluating associations between short-term environmental exposures and adverse health eventsFootnote 25 (e.g. snowfall and myocardial infarction,Footnote 26 temperature and myocardial infarction,Footnote 27 air pollution and asthma,Footnote 28 etc.). The effectiveness of this study design at evaluating these associations lies in its method of controlling confounders (e.g. age, sex, etc.) by having cases essentially match to themselves.Footnote 29 This study design controls for the influence of individual-level factors by contrasting the individual’s exposure on the event date to their exposure during control periods. We chose the time-stratified bi-directional approach to certain control periods by selecting other days of the month that fall on the same day of the week as the event date; this provides the additional benefit of controlling day-of-week effects.Footnote 25
Study population
The National Ambulatory Care Reporting Systems (NACRS) captures individual-level demographic (e.g. age, sex, postal code) and administrative information (e.g. registration date and diagnostic codes) for all hospital-based and community-based ambulatory care from participating facilities and ministries of health.Footnote 30 Unintentional falls are defined by records containing International Classification of Disease 10th edition (ICD-10-CA) codes W00 to W19 as the primary reason for these ED visits. As we were most interested in quantifying the associations between meteorological factors and ED visits for outdoor unintentional falls, we removed records with ICD-10-CA codes indicating a fall that was unlikely to occur outdoors. (For a list of included and excluded ICD-10-CA codes, see Figure 1.) We excluded children aged under 5 years because unintentional falls in this age range predominantly occur indoors.Footnote 31 Furthermore, given that performing these analyses nationally requires considerable computational resources and that Ontario’s NACRS data provides ample sample size and has near complete coverage,Footnote 30 we restricted our analyses to Ontario ED visits.
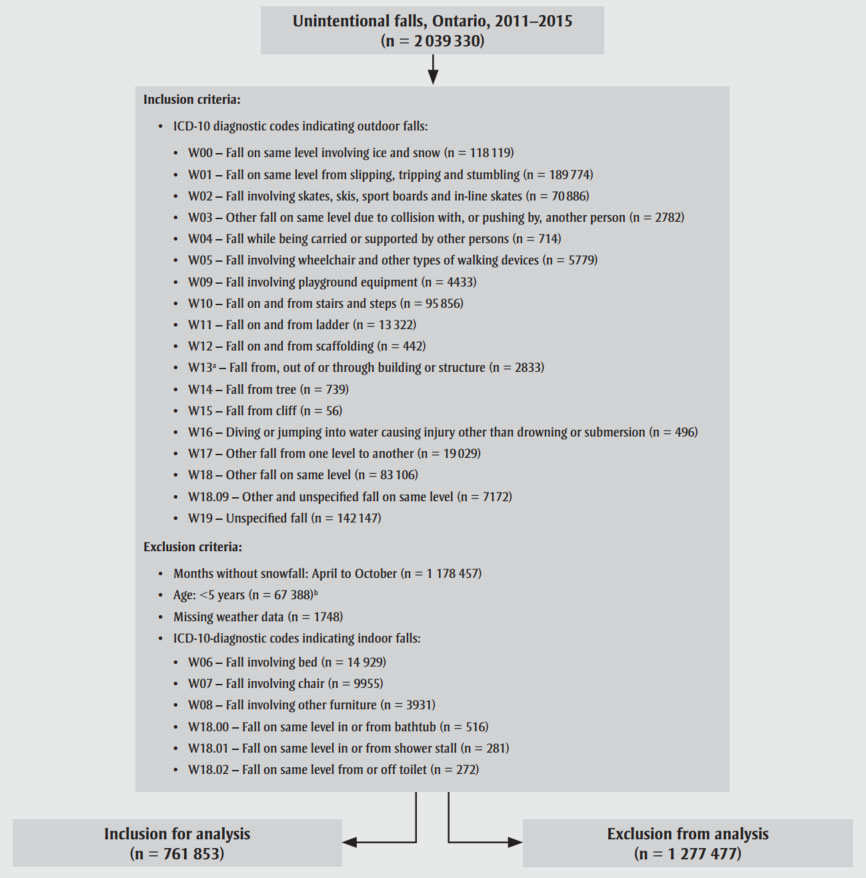
Figure 1 - Text description
The algorithm took 2 039 330 unintentional falls in Ontario from 2011 to 2015, and applied the following criteria:
Inclusion criteria:
- ICD-10 diagnostic codes indicating outdoor falls:
- W00 – Fall on same level involving ice and snow (n = 118 119)
- W01 – Fall on same level from slipping, tripping and stumbling (n = 189 774)
- W02 – Fall involving skates, skis, sport boards and in-line skates (n = 70 886)
- W03 – Other fall on same level due to collision with, or pushing by, another person (n = 2782)
- W04 – Fall while being carried or supported by other persons (n = 714)
- W05 – Fall involving wheelchair and other types of walking devices (n = 5779)
- W09 – Fall involving playground equipment (n = 4433)
- W10 – Fall on and from stairs and steps (n = 95 856)
- W11 – Fall on and from ladder (n = 13 322)
- W12 – Fall on and from scaffolding (n = 442)
- W13a – Fall from, out of or through building or structure (n = 2833)
- W14 – Fall from tree (n = 739)
- W15 – Fall from cliff (n = 56)
- W16 – Diving or jumping into water causing injury other than drowning or submersion (n = 496)
- W17 – Other fall from one level to another (n = 19 029)
- W18 – Other fall on same level (n = 83 106)
- W18.09 – Other and unspecified fall on same level (n = 7172)
- W19 – Unspecified fall (n = 142 147)
Exclusion criteria:
- Months without snowfall: April to October (n = 1 178 457)
- Age: <5 years (n = 67 388)b
- Missing weather data (n = 1748)
- ICD-10-diagnostic codes indicating indoor falls:
- W06 – Fall involving bed (n = 14 929)
- W07 – Fall involving chair (n = 9955)
- W08 – Fall involving other furniture (n = 3931)
- W18.00 – Fall on same level in or from bathtub (n = 516)
- W18.01 – Fall on same level in or from shower stall (n = 281)
- W18.02 – Fall on same level from or off toilet (n = 272)
As a result, 761 853 events were included in the analysis, and 1 277 477 were excluded.
Sources: Canadian
Urban Environmental Health Research Consortium (meteorology data); National
Ambulatory Care Reporting System (emergency department visit data).
a The ICD-10-CA
code W13 was included as it also codes for outdoor falls on balconies, bridges,
flag poles and rooftops.
b Falls that occur
among those aged less than 5 years mostly occur indoors.
Weather data
While meteorological stations are often used to assess spatial associations between weather events and health outcomes, their use is limited to health outcomes that occur near these stations.Footnote 32Footnote 33The Canadian Forest Service of Natural Resources Canada works to overcome this issue by using thin-plate smoothing splines through ANUSPLIN climate modelling software to create spatial climate models.Footnote 32Footnote 34 While these models have largely had applications in the forestry industry, they can be used in environmental health research.Footnote 32Footnote 33 These climate models can estimate daily values for temperature extremes (minimum and maximum) and total precipitation at a postal code level.Footnote 33Footnote 34 However, the lowest geographical unit level available from our NACRS dataset for place of residence is the forward sortation area (FSA; regions defined by the first three digits of a postal code). Thus, the mean daily average temperature, temperature extremes and total precipitation were calculated for each FSA by averaging these values for all six-character postal codes within an FSA. The meteorological data for all fall and control event dates were linked spatiotemporally by the Canadian Urban Environmental Health Research Consortium (CANUE).Footnote 35Footnote 36
As our measure of total precipitation was not able to distinguish rain from snow, we defined snowfall as precipitation occurring on days with an average temperature at or below 0°C. Furthermore, as increases in ED visits for unintentional falls occur up to one week after winter meteorological events,Footnote 8Footnote 16Footnote 18Footnote 20Footnote 21Footnote 22 we examined lag days up to one week before the fall-related ED visit. We analyzed single-day snowfall accumulation rather than multi-day snowfall accumulation because snowfall removal is likely to occur within 24 hours of its occurrence.Footnote 17 We also categorized our main meteorological variables because we sought to examine how the associations between meteorological variables and fall-related ED visits varied at different levels. Furthermore, there may be some error in the values for environmental factors within an FSA due to factors such as buildings, topography, vegetation cover and wind. In the context of snowfall, individuals tend to stay indoors when greater snowfall accumulation occurs,Footnote 22 reducing their risk for a fall. We categorized snowfall using the definitions for trace and non-trace snowfall accumulation (>0 to <0.2 cm and ≥0.2 cm, respectively) from Environment and Climate Change Canada.Footnote 37 Trace snowfall accumulation was used to represent modest snowfall amounts that exceed 0 cm and accumulation of at least 0.2 cm represented more significant snowfall.
For average daily temperature, the temperature range in our data crossed 0°C, where more slippery conditions may occur due to freezing rain and ice formation. In turn, these conditions may be more likely to precipitate a fall, unlike at temperatures considerably above or below 0°C. Consequently, we used a quintile approach to categorize our average daily temperature ranges.Footnote 11 As there was only recorded snowfall between the months of November and March, we defined these months as winter and restricted the records for analysis to these months. Furthermore, we removed 1748 fall-related ED visit records (0.2%) with missing weather data on the registration date from analysis (Figure 1).
Statistical analysis
We summarized individual-level characteristics by demographic and meteorological factor of individuals who had an ED visit for an unintentional fall during the months of November to March for the calendar years of 2011 to 2015, inclusively. We used conditional logistic regression to compute the odds ratio (OR) and its 95% confidence interval (CI) for ED visits for unintentional falls on days with total daily snowfall accumulation (>0 to <0.2 cm, ≥0.2 cm) compared to days with no snowfall, including lag days up to one week before the fall-related ED visit.
Furthermore, we conducted regression analyses for fall-related ED visits on days corresponding to average daily temperature ranges of less than −9.4°C, −9.4 to less than −4.1°C, −4.1 to less than −0.3°C and −0.3 to less than 3.0°C compared to days with an average temperature of at least 3.0°C. We stratified the analyses by age group (5–17, 18–29, 30–44, 45–64 and 65+ years) and sex.
We also modelled the association between fall-related ED visits and both exposure factors to assess the stability of our primary results. All analyses were performed using SAS version 9.4 (SAS Institute Inc., Cary, NC, US). Carleton University’s Research Ethics Board approved the study (Project #113345).
Results
Demographic and weather characteristics
We identified 761 853 fall-related ED visits during the study period (Table 1). Fall-related ED visits occurred most frequently on days without snowfall (63.2%; n = 481 273), followed by days with trace snowfall accumulation (24.1%; n = 183 831) and days with non-trace snowfall accumulation (12.7%; n = 96 749). The distribution of fall-related ED visits by temperature was similar across the temperature ranges. Demographically, there were more fall-related ED visits among females (55.3%; n = 420 978) than males and among adults aged 65 and older (29.6%; n = 225 733) than the other age groups. There were also more fall-related ED visits among those living in urban areas (82.5%; n = 628 650) than in rural areas and in central Ontario (34.7%; n = 264 692) than other regions in Ontario.
| Variable | Number of emergency department visits | |
|---|---|---|
| n = 761 853 | %Footnote a | |
| Snowfall accumulation on the day of the ED visit, cm | ||
| 0 | 481 273 | 63.2 |
| >0 to <0.2 | 183 831 | 24.1 |
| ≥0.2 | 96 749 | 12.7 |
| Daily average temperature, °C | ||
| ≥3.0 (warmest) | 147 996 | 19.4 |
| −0.3 to <3.0 | 148 645 | 19.5 |
| −4.1 to <−0.3 | 160 298 | 21.0 |
| −9.4 to <−4.1 | 158 765 | 20.8 |
| <−9.4 (coldest) | 146 149 | 19.2 |
| RuralityFootnote b | ||
| Rural | 133 203 | 17.5 |
| Urban | 628 650 | 82.5 |
| Region of residence in OntarioFootnote c | ||
| Eastern Ontario | 140 251 | 18.4 |
| Central Ontario | 264 692 | 34.7 |
| Metropolitan Toronto | 129 532 | 17.0 |
| Southwestern Ontario | 157 315 | 20.6 |
| Northern Ontario | 70 063 | 9.2 |
| Sex | ||
| Female | 420 978 | 55.3 |
| Male | 340 875 | 44.7 |
| Age group, years | ||
| 5–17 | 138 707 | 18.2 |
| 18–29 | 94 185 | 12.4 |
| 30–44 | 105 067 | 13.8 |
| 45–64 | 198 161 | 26.0 |
| 65+ | 225 733 | 29.6 |
| Year | ||
| 2011 | 144 068 | 18.9 |
| 2012 | 144 305 | 18.9 |
| 2013 | 157 564 | 20.7 |
| 2014 | 165 496 | 21.7 |
| 2015 | 150 420 | 19.7 |
Sources: Canadian Urban Environmental Health Research Consortium (meteorology data), National Ambulatory Care Reporting System (emergency department visit data)
|
||
Daily snowfall accumulation
For days with trace snowfall accumulation, the highest increase in the odds for fall-related ED visits occurred on the day this accumulation occurred (OR = 1.05; 95% CI: 1.04, 1.06) compared to days with no snowfall (Figure 2; data table available on request from the authors). This pattern was consistent across all groups of analysis (e.g. overall, by sex and by age group). By age group, adults (individuals 30–44 and 45–64 years) presented with the largest increase in odds for a fall-related ED visits (adults 30–44 years: OR = 1.07, 95% CI: 1.05, 1.09; adults 45–64 years, OR = 1.08, 95% CI: 1.06, 1.09). We also observed elevated odds 5 to 7 days afterwards across most groups analyzed.
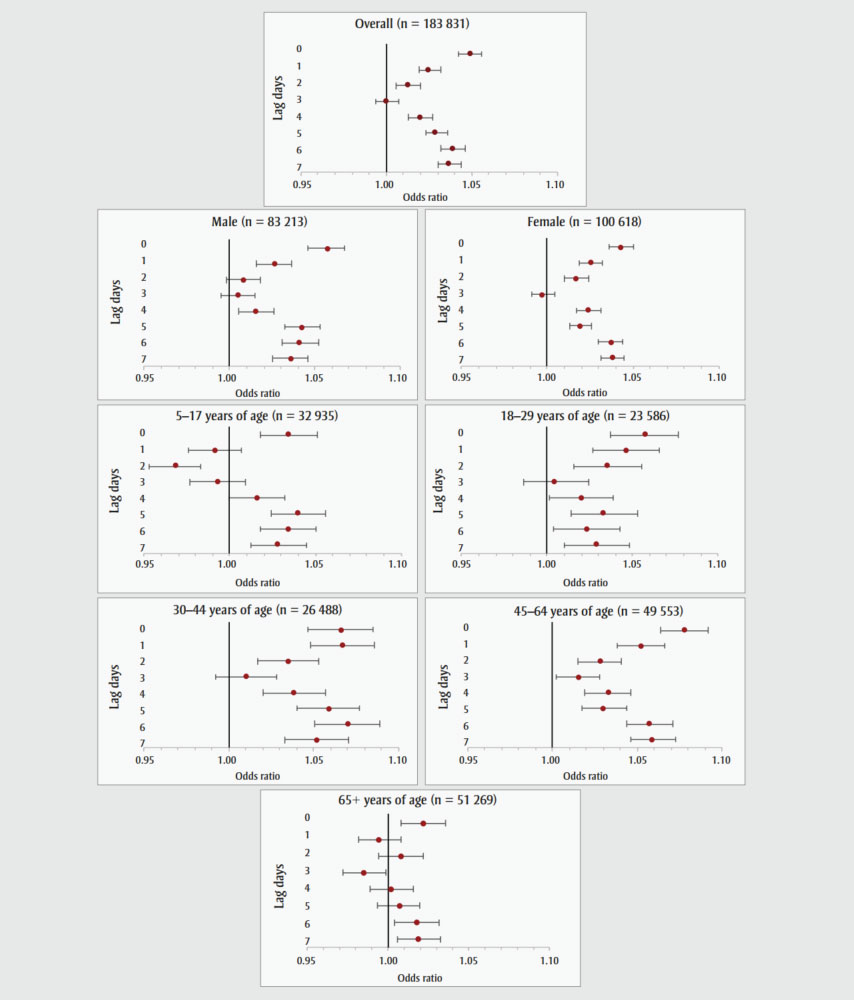
Figure 2 - Text description
| Number of Lag Days | OR | 95% CI (lower) | 95% CI (higher) | Diff (lower) | Diff (higher) | Y-Values | X-Value |
|---|---|---|---|---|---|---|---|
| 0 | 1.049 | 1.042 | 1.056 | 0.007 | 0.007 | 7.5 | 0.95 |
| 1 | 1.025 | 1.019 | 1.032 | 0.006 | 0.007 | 6.5 | 0.95 |
| 2 | 1.013 | 1.006 | 1.02 | 0.007 | 0.007 | 5.5 | 0.95 |
| 3 | 1 | 0.994 | 1.007 | 0.006 | 0.007 | 4.5 | 0.95 |
| 4 | 1.02 | 1.013 | 1.027 | 0.007 | 0.007 | 3.5 | 0.95 |
| 5 | 1.029 | 1.023 | 1.036 | 0.006 | 0.007 | 2.5 | 0.95 |
| 6 | 1.039 | 1.032 | 1.046 | 0.007 | 0.007 | 1.5 | 0.95 |
| 7 | 1.037 | 1.03 | 1.044 | 0.007 | 0.007 | 0.5 | 0.95 |
| Number of Lag Days | OR | 95% CI (lower) | 95% CI (higher) | Diff (lower) | Diff (higher) | Y-Values | X-Value |
|---|---|---|---|---|---|---|---|
| 0 | 1.043 | 1.033 | 1.052 | 0.01 | 0.009 | 7.5 | 0.95 |
| 1 | 1.025 | 1.016 | 1.034 | 0.009 | 0.009 | 6.5 | 0.95 |
| 2 | 1.017 | 1.008 | 1.026 | 0.009 | 0.009 | 5.5 | 0.95 |
| 3 | 0.997 | 0.988 | 1.006 | 0.009 | 0.009 | 4.5 | 0.95 |
| 4 | 1.024 | 1.014 | 1.033 | 0.01 | 0.009 | 3.5 | 0.95 |
| 5 | 1.019 | 1.01 | 1.028 | 0.009 | 0.009 | 2.5 | 0.95 |
| 6 | 1.037 | 1.028 | 1.046 | 0.009 | 0.009 | 1.5 | 0.95 |
| 7 | 1.038 | 1.029 | 1.048 | 0.009 | 0.01 | 0.5 | 0.95 |
| Number of Lag Days | OR | 95% CI (lower) | 95% CI (higher) | Diff (lower) | Diff (higher) | Y-Values | X-Value |
|---|---|---|---|---|---|---|---|
| 0 | 1.057 | 1.046 | 1.067 | 0.011 | 0.01 | 7.5 | 0.95 |
| 1 | 1.026 | 1.016 | 1.036 | 0.01 | 0.01 | 6.5 | 0.95 |
| 2 | 1.008 | 0.998 | 1.018 | 0.01 | 0.01 | 5.5 | 0.95 |
| 3 | 1.005 | 0.995 | 1.015 | 0.01 | 0.01 | 4.5 | 0.95 |
| 4 | 1.015 | 1.005 | 1.026 | 0.01 | 0.011 | 3.5 | 0.95 |
| 5 | 1.042 | 1.032 | 1.053 | 0.01 | 0.011 | 2.5 | 0.95 |
| 6 | 1.041 | 1.031 | 1.052 | 0.01 | 0.011 | 1.5 | 0.95 |
| 7 | 1.036 | 1.025 | 1.046 | 0.011 | 0.01 | 0.5 | 0.95 |
| Number of Lag Days | OR | 95% CI (lower) | 95% CI (higher) | Diff (lower) | Diff (higher) | Y-Values | X-Value |
|---|---|---|---|---|---|---|---|
| 0 | 1.034 | 1.018 | 1.051 | 0.016 | 0.017 | 7.5 | 0.95 |
| 1 | 0.991 | 0.976 | 1.007 | 0.015 | 0.016 | 6.5 | 0.95 |
| 2 | 0.968 | 0.953 | 0.983 | 0.015 | 0.015 | 5.5 | 0.95 |
| 3 | 0.993 | 0.977 | 1.009 | 0.016 | 0.016 | 4.5 | 0.95 |
| 4 | 1.016 | 1 | 1.032 | 0.016 | 0.016 | 3.5 | 0.95 |
| 5 | 1.04 | 1.024 | 1.056 | 0.016 | 0.016 | 2.5 | 0.95 |
| 6 | 1.034 | 1.018 | 1.05 | 0.016 | 0.016 | 1.5 | 0.95 |
| 7 | 1.028 | 1.012 | 1.045 | 0.016 | 0.017 | 0.5 | 0.95 |
| Number of Lag Days | OR | 95% CI (lower) | 95% CI (higher) | Diff (lower) | Diff (higher) | Y-Values | X-Value |
|---|---|---|---|---|---|---|---|
| 0 | 1.057 | 1.037 | 1.077 | 0.02 | 0.02 | 7.5 | 0.95 |
| 1 | 1.046 | 1.027 | 1.066 | 0.019 | 0.02 | 6.5 | 0.95 |
| 2 | 1.035 | 1.016 | 1.055 | 0.019 | 0.02 | 5.5 | 0.95 |
| 3 | 1.004 | 0.986 | 1.024 | 0.018 | 0.02 | 4.5 | 0.95 |
| 4 | 1.02 | 1.001 | 1.039 | 0.019 | 0.019 | 3.5 | 0.95 |
| 5 | 1.033 | 1.014 | 1.053 | 0.019 | 0.02 | 2.5 | 0.95 |
| 6 | 1.023 | 1.004 | 1.043 | 0.019 | 0.02 | 1.5 | 0.95 |
| 7 | 1.029 | 1.01 | 1.048 | 0.019 | 0.019 | 0.5 | 0.95 |
| Number of Lag Days | OR | 95% CI (lower) | 95% CI (higher) | Diff (lower) | Diff (higher) | Y-Values | X-Value |
|---|---|---|---|---|---|---|---|
| 0 | 1.066 | 1.047 | 1.085 | 0.019 | 0.019 | 7.5 | 0.95 |
| 1 | 1.067 | 1.048 | 1.086 | 0.019 | 0.019 | 6.5 | 0.95 |
| 2 | 1.035 | 1.017 | 1.053 | 0.018 | 0.018 | 5.5 | 0.95 |
| 3 | 1.01 | 0.992 | 1.028 | 0.018 | 0.018 | 4.5 | 0.95 |
| 4 | 1.038 | 1.02 | 1.057 | 0.018 | 0.019 | 3.5 | 0.95 |
| 5 | 1.059 | 1.04 | 1.077 | 0.019 | 0.018 | 2.5 | 0.95 |
| 6 | 1.07 | 1.051 | 1.089 | 0.019 | 0.019 | 1.5 | 0.95 |
| 7 | 1.052 | 1.033 | 1.071 | 0.019 | 0.019 | 0.5 | 0.95 |
| Number of Lag Days | OR | 95% CI (lower) | 95% CI (higher) | Diff (lower) | Diff (higher) | Y-Values | X-Value |
|---|---|---|---|---|---|---|---|
| 0 | 1.078 | 1.064 | 1.092 | 0.014 | 0.014 | 7.5 | 0.95 |
| 1 | 1.052 | 1.038 | 1.066 | 0.014 | 0.014 | 6.5 | 0.95 |
| 2 | 1.028 | 1.015 | 1.041 | 0.013 | 0.013 | 5.5 | 0.95 |
| 3 | 1.015 | 1.002 | 1.028 | 0.013 | 0.013 | 4.5 | 0.95 |
| 4 | 1.033 | 1.019 | 1.046 | 0.014 | 0.013 | 3.5 | 0.95 |
| 5 | 1.03 | 1.017 | 1.044 | 0.013 | 0.014 | 2.5 | 0.95 |
| 6 | 1.057 | 1.044 | 1.071 | 0.013 | 0.014 | 1.5 | 0.95 |
| 7 | 1.059 | 1.046 | 1.073 | 0.013 | 0.014 | 0.5 | 0.95 |
| Number of Lag Days | OR | 95% CI (lower) | 95% CI (higher) | Diff (lower) | Diff (higher) | Y-Values | X-Value |
|---|---|---|---|---|---|---|---|
| 0 | 1.021 | 1.008 | 1.034 | 0.013 | 0.013 | 7.5 | 0.95 |
| 1 | 0.995 | 0.983 | 1.008 | 0.012 | 0.013 | 6.5 | 0.95 |
| 2 | 1.008 | 0.995 | 1.021 | 0.013 | 0.013 | 5.5 | 0.95 |
| 3 | 0.986 | 0.974 | 0.999 | 0.012 | 0.013 | 4.5 | 0.95 |
| 4 | 1.002 | 0.99 | 1.015 | 0.012 | 0.013 | 3.5 | 0.95 |
| 5 | 1.007 | 0.994 | 1.019 | 0.013 | 0.012 | 2.5 | 0.95 |
| 6 | 1.017 | 1.004 | 1.03 | 0.013 | 0.013 | 1.5 | 0.95 |
| 7 | 1.018 | 1.006 | 1.031 | 0.012 | 0.013 | 0.5 | 0.95 |
Sources: Canadian
Urban Environmental Health Research Consortium (meteorology data), National
Ambulatory Care Reporting System (emergency department visit data).
Note: Lag days
represent the number of days before the emergency department visit.
These observed patterns differed from those seen on days with non-trace snowfall accumulation (Figure 3; data table available on request from the authors). Overall, the increased odds persisted for most of the week after non-trace snowfall accumulation occurred (OR = 1.05–1.08), with a slight reduction 5 days afterwards. While this relationship did not differ by sex, there were differences by age. A modest reduction in the odds for fall-related ED visits occurred on the case day to 2 days afterwards (OR = 0.92–0.97) among school-aged children (5–17 years). While there was a peak in the odds for fall-related ED visits one day following non-trace snowfall accumulation across most age groups, this association was most pronounced among adults (OR = 1.16–1.19). Individuals aged 18 to 29 years and 65 years and older presented with similar increases in odds ratios for fall-related ED visits 1 to 4 days following non-trace snowfall (OR = 1.03–1.09). When adjusted for temperature (Table 2), the risk estimates were similar (OR on lag day 0 for trace snowfall accumulation = 1.06, 95% CI: 1.06, 1.07) to the unadjusted values (OR = 1.05, 95% CI: 1.04, 1.06). This was also the case for our stratified analyses (data available on request from the authors).
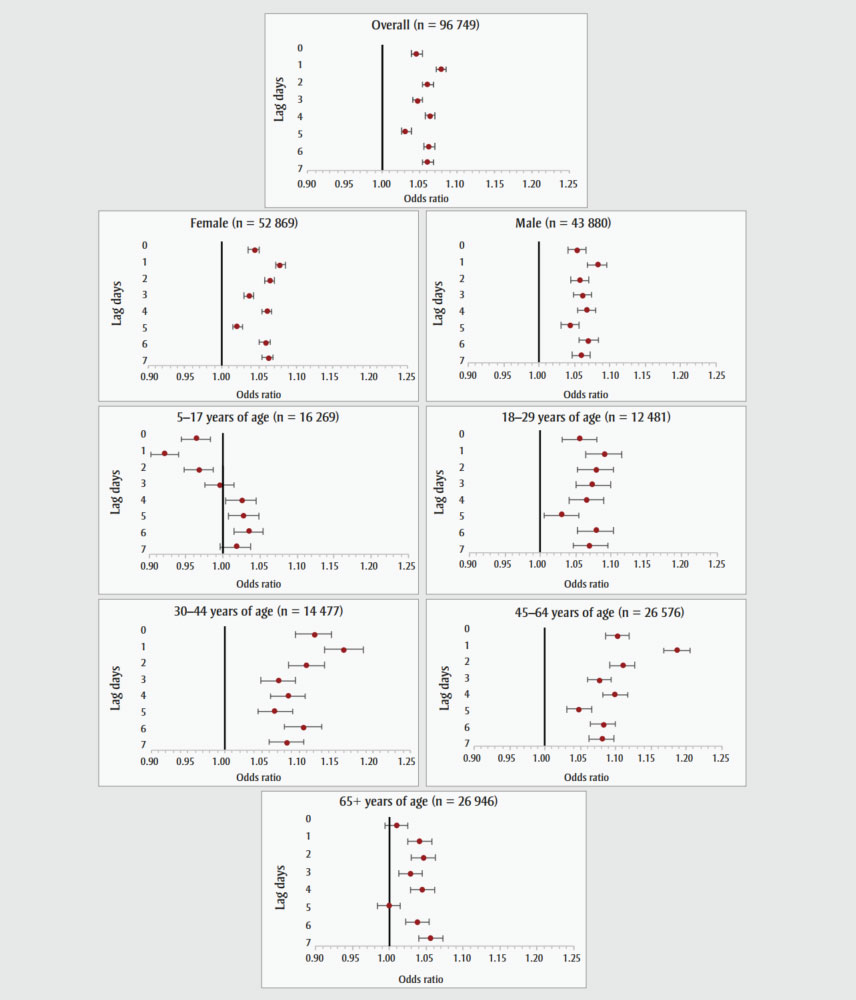
Figure 3 - Text description
| Number of Lag Days | OR | 95% CI (lower) | 95% CI (higher) | Diff (lower) | Diff (higher) | Y-Values | X-Value |
|---|---|---|---|---|---|---|---|
| 0 | 1.046 | 1.038 | 1.055 | 0.007 | 0.007 | 7.5 | 0.9 |
| 1 | 1.079 | 1.07 | 1.088 | 0.006 | 0.007 | 6.5 | 0.9 |
| 2 | 1.061 | 1.052 | 1.07 | 0.007 | 0.007 | 5.5 | 0.9 |
| 3 | 1.047 | 1.039 | 1.056 | 0.006 | 0.007 | 4.5 | 0.9 |
| 4 | 1.064 | 1.055 | 1.072 | 0.007 | 0.007 | 3.5 | 0.9 |
| 5 | 1.031 | 1.022 | 1.039 | 0.006 | 0.007 | 2.5 | 0.9 |
| 6 | 1.063 | 1.054 | 1.072 | 0.007 | 0.007 | 1.5 | 0.9 |
| 7 | 1.061 | 1.052 | 1.07 | 0.007 | 0.007 | 0.5 | 0.9 |
| Number of Lag Days | OR | 95% CI (lower) | 95% CI (higher) | Diff (lower) | Diff (higher) | Y-Values | X-Value |
|---|---|---|---|---|---|---|---|
| 0 | 1.043 | 1.033 | 1.052 | 0.01 | 0.009 | 7.5 | 0.9 |
| 1 | 1.078 | 1.066 | 1.09 | 0.012 | 0.012 | 6.5 | 0.9 |
| 2 | 1.064 | 1.052 | 1.076 | 0.012 | 0.012 | 5.5 | 0.9 |
| 3 | 1.036 | 1.024 | 1.047 | 0.012 | 0.011 | 4.5 | 0.9 |
| 4 | 1.061 | 1.049 | 1.073 | 0.012 | 0.012 | 3.5 | 0.9 |
| 5 | 1.02 | 1.008 | 1.031 | 0.012 | 0.011 | 2.5 | 0.9 |
| 6 | 1.058 | 1.046 | 1.07 | 0.012 | 0.012 | 1.5 | 0.9 |
| 7 | 1.062 | 1.05 | 1.074 | 0.012 | 0.012 | 0.5 | 0.9 |
| Number of Lag Days | OR | 95% CI (lower) | 95% CI (higher) | Diff (lower) | Diff (higher) | Y-Values | X-Value |
|---|---|---|---|---|---|---|---|
| 0 | 1.053 | 1.04 | 1.066 | 0.013 | 0.013 | 7.5 | 0.9 |
| 1 | 1.082 | 1.068 | 1.095 | 0.014 | 0.013 | 6.5 | 0.9 |
| 2 | 1.057 | 1.044 | 1.07 | 0.013 | 0.013 | 5.5 | 0.9 |
| 3 | 1.062 | 1.049 | 1.075 | 0.013 | 0.013 | 4.5 | 0.9 |
| 4 | 1.067 | 1.054 | 1.08 | 0.013 | 0.013 | 3.5 | 0.9 |
| 5 | 1.044 | 1.031 | 1.057 | 0.013 | 0.013 | 2.5 | 0.9 |
| 6 | 1.07 | 1.056 | 1.083 | 0.014 | 0.013 | 1.5 | 0.9 |
| 7 | 1.06 | 1.047 | 1.073 | 0.013 | 0.013 | 0.5 | 0.9 |
| Number of Lag Days | OR | 95% CI (lower) | 95% CI (higher) | Diff (lower) | Diff (higher) | Y-Values | X-Value |
|---|---|---|---|---|---|---|---|
| 0 | 0.963 | 0.944 | 0.983 | 0.019 | 0.02 | 7.5 | 0.9 |
| 1 | 0.921 | 0.903 | 0.94 | 0.018 | 0.019 | 6.5 | 0.9 |
| 2 | 0.967 | 0.948 | 0.986 | 0.019 | 0.019 | 5.5 | 0.9 |
| 3 | 0.995 | 0.976 | 1.015 | 0.019 | 0.02 | 4.5 | 0.9 |
| 4 | 1.025 | 1.004 | 1.045 | 0.021 | 0.02 | 3.5 | 0.9 |
| 5 | 1.027 | 1.007 | 1.048 | 0.02 | 0.021 | 2.5 | 0.9 |
| 6 | 1.034 | 1.014 | 1.055 | 0.02 | 0.021 | 1.5 | 0.9 |
| 7 | 1.017 | 0.996 | 1.037 | 0.021 | 0.02 | 0.5 | 0.9 |
| Number of Lag Days | OR | 95% CI (lower) | 95% CI (higher) | Diff (lower) | Diff (higher) | Y-Values | X-Value |
|---|---|---|---|---|---|---|---|
| 0 | 1.055 | 1.031 | 1.08 | 0.024 | 0.025 | 7.5 | 0.9 |
| 1 | 1.09 | 1.065 | 1.116 | 0.025 | 0.026 | 6.5 | 0.9 |
| 2 | 1.078 | 1.053 | 1.103 | 0.025 | 0.025 | 5.5 | 0.9 |
| 3 | 1.074 | 1.05 | 1.099 | 0.024 | 0.025 | 4.5 | 0.9 |
| 4 | 1.065 | 1.041 | 1.09 | 0.024 | 0.025 | 3.5 | 0.9 |
| 5 | 1.03 | 1.006 | 1.055 | 0.024 | 0.025 | 2.5 | 0.9 |
| 6 | 1.078 | 1.053 | 1.103 | 0.025 | 0.025 | 1.5 | 0.9 |
| 7 | 1.07 | 1.046 | 1.096 | 0.024 | 0.026 | 0.5 | 0.9 |
| Number of Lag Days | OR | 95% CI (lower) | 95% CI (higher) | Diff (lower) | Diff (higher) | Y-Values | X-Value |
|---|---|---|---|---|---|---|---|
| 0 | 1.12 | 1.095 | 1.144 | 0.025 | 0.024 | 7.5 | 0.9 |
| 1 | 1.16 | 1.135 | 1.186 | 0.025 | 0.026 | 6.5 | 0.9 |
| 2 | 1.11 | 1.086 | 1.134 | 0.024 | 0.024 | 5.5 | 0.9 |
| 3 | 1.072 | 1.049 | 1.096 | 0.023 | 0.024 | 4.5 | 0.9 |
| 4 | 1.085 | 1.062 | 1.109 | 0.023 | 0.024 | 3.5 | 0.9 |
| 5 | 1.067 | 1.044 | 1.091 | 0.023 | 0.024 | 2.5 | 0.9 |
| 6 | 1.105 | 1.081 | 1.13 | 0.024 | 0.025 | 1.5 | 0.9 |
| 7 | 1.083 | 1.059 | 1.107 | 0.024 | 0.024 | 0.5 | 0.9 |
| Number of Lag Days | OR | 95% CI (lower) | 95% CI (higher) | Diff (lower) | Diff (higher) | Y-Values | X-Value |
|---|---|---|---|---|---|---|---|
| 0 | 1.103 | 1.085 | 1.12 | 0.018 | 0.017 | 7.5 | 0.9 |
| 1 | 1.187 | 1.168 | 1.206 | 0.019 | 0.019 | 6.5 | 0.9 |
| 2 | 1.11 | 1.092 | 1.127 | 0.018 | 0.017 | 5.5 | 0.9 |
| 3 | 1.077 | 1.06 | 1.094 | 0.017 | 0.017 | 4.5 | 0.9 |
| 4 | 1.099 | 1.081 | 1.117 | 0.018 | 0.018 | 3.5 | 0.9 |
| 5 | 1.048 | 1.031 | 1.066 | 0.017 | 0.018 | 2.5 | 0.9 |
| 6 | 1.082 | 1.064 | 1.1 | 0.018 | 0.018 | 1.5 | 0.9 |
| 7 | 1.08 | 1.063 | 1.098 | 0.017 | 0.018 | 0.5 | 0.9 |
| Number of Lag Days | OR | 95% CI (lower) | 95% CI (higher) | Diff (lower) | Diff (higher) | Y-Values | X-Value |
|---|---|---|---|---|---|---|---|
| 0 | 1.01 | 0.994 | 1.025 | 0.016 | 0.015 | 7.5 | 0.9 |
| 1 | 1.041 | 1.025 | 1.058 | 0.016 | 0.017 | 6.5 | 0.9 |
| 2 | 1.046 | 1.03 | 1.062 | 0.016 | 0.016 | 5.5 | 0.9 |
| 3 | 1.029 | 1.013 | 1.045 | 0.016 | 0.016 | 4.5 | 0.9 |
| 4 | 1.045 | 1.029 | 1.061 | 0.016 | 0.016 | 3.5 | 0.9 |
| 5 | 1 | 0.984 | 1.015 | 0.016 | 0.015 | 2.5 | 0.9 |
| 6 | 1.038 | 1.022 | 1.054 | 0.016 | 0.016 | 1.5 | 0.9 |
| 7 | 1.056 | 1.04 | 1.073 | 0.016 | 0.017 | 0.5 | 0.9 |
Sources: Canadian
Urban Environmental Health Research Consortium (meteorology data), National
Ambulatory Care Reporting System (emergency department visit data).
Note: Lag days
represent the number of days before the emergency department visit.
| Lag day | Snowfall accumulation, cm | |||
|---|---|---|---|---|
| >0 to 0.2 | ≥0.2 | |||
| OR | 95% CI | OR | 95% CI | |
| 0 | 1.06 | 1.06, 1.07 | 1.06 | 1.05, 1.07 |
| 1 | 1.04 | 1.04, 1.05 | 1.09 | 1.09, 1.10 |
| 2 | 1.03 | 1.02, 1.03 | 1.07 | 1.06, 1.08 |
| 3 | 1.01 | 1.00, 1.01 | 1.05 | 1.04, 1.06 |
| 4 | 1.02 | 1.01, 1.02 | 1.06 | 1.05, 1.07 |
| 5 | 1.02 | 1.02, 1.03 | 1.03 | 1.02, 1.03 |
| 6 | 1.03 | 1.02, 1.04 | 1.06 | 1.05, 1.07 |
| 7 | 1.03 | 1.02, 1.03 | 1.05 | 1.04, 1.06 |
Sources: Canadian Urban Environmental Health Research Consortium (meteorology data), National Ambulatory Care Reporting System (emergency department visit data). |
||||
Daily average temperature
The odds for fall-related ED visits was elevated across most temperature ranges analyzed (Figure 4). Overall, the increase in the OR on days with an average daily temperature between −0.3 and less than 3.0 °C (OR = 1.04; 95% CI: 1.03, 1.05) was less than the increase seen on days with an average daily temperature of between −4.1 and less than −0.3 °C (1.09; 1.08, 1.10) or between −9.2 and less than −4.1 °C (1.08; 1.07, 1.09). Conversely, there was a modest reduction in the odds on days colder than −9.4 °C (0.95; 0.94, 0.96).
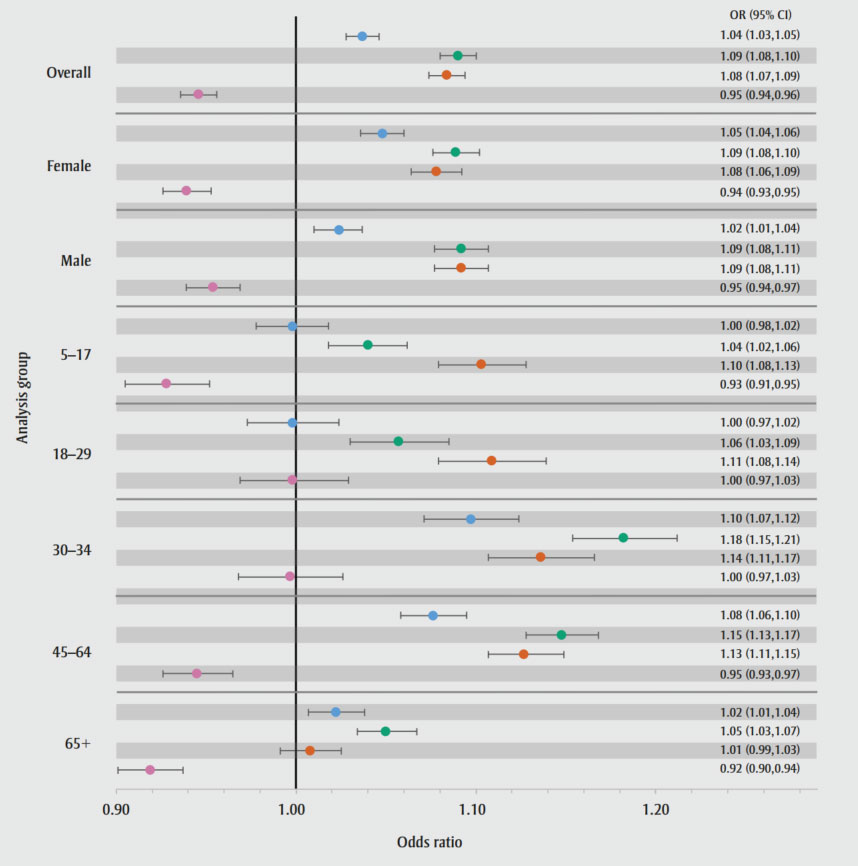
Figure 4 - Text description
| Category | Temperature | OR | 95% CI (lower) | 95% CI (higher) | Diff (lower) | Diff (higher) | Y-Values | X-Value | n | X-Value (n) |
|---|---|---|---|---|---|---|---|---|---|---|
| Overall | ≥-0.3° <3.0°C | 1.04 | 1.028 | 1.046 | 0.009 | 0.009 | 39 | 0.9 | 1.04 (1.03,1.05) | 1.215 |
| ≥-4.1° <-0.3°C | 1.09 | 1.08 | 1.1 | 0.01 | 0.01 | 38 | 0.9 | 1.09 (1.08,1.10) | 1.215 | |
| ≥-9.4° <-4.1°C | 1.08 | 1.074 | 1.094 | 0.01 | 0.01 | 37 | 0.9 | 1.08 (1.07,1.09) | 1.215 | |
| <-9.4°C | 0.95 | 0.936 | 0.956 | 0.01 | 0.01 | 36 | 0.9 | 0.95 (0.94,0.96) | 1.215 | |
| Female | ≥-0.3° <3.0°C | 1.05 | 1.036 | 1.06 | 0.012 | 0.012 | 34 | 0.9 | 1.05 (1.04,1.06) | 1.215 |
| ≥-4.1° <-0.3°C | 1.09 | 1.076 | 1.102 | 0.013 | 0.013 | 33 | 0.9 | 1.09 (1.08,1.10) | 1.215 | |
| ≥-9.4° <-4.1°C | 1.08 | 1.064 | 1.092 | 0.014 | 0.014 | 32 | 0.9 | 1.08 (1.06,1.09) | 1.215 | |
| <-9.4°C | 0.94 | 0.926 | 0.953 | 0.013 | 0.014 | 31 | 0.9 | 0.94 (0.93,0.95) | 1.215 | |
| Male | ≥-0.3° <3.0°C | 1.02 | 1.01 | 1.037 | 0.014 | 0.013 | 29 | 0.9 | 1.02 (1.01,1.04) | 1.215 |
| ≥-4.1° <-0.3°C | 1.09 | 1.077 | 1.107 | 0.015 | 0.015 | 28 | 0.9 | 1.09 (1.08,1.11) | 1.215 | |
| ≥-9.4° <-4.1°C | 1.09 | 1.077 | 1.107 | 0.015 | 0.015 | 27 | 0.9 | 1.09 (1.08,1.11) | 1.215 | |
| <-9.4°C | 0.95 | 0.939 | 0.969 | 0.015 | 0.015 | 26 | 0.9 | 0.95 (0.94,0.97) | 1.215 | |
| 5 - 17 | ≥-0.3° <3.0°C | 1 | 0.978 | 1.018 | 0.02 | 0.02 | 24 | 0.9 | 1.00 (0.98,1.02) | 1.215 |
| ≥-4.1° <-0.3°C | 1.04 | 1.018 | 1.062 | 0.022 | 0.022 | 23 | 0.9 | 1.04 (1.02,1.06) | 1.215 | |
| ≥-9.4° <-4.1°C | 1.1 | 1.079 | 1.128 | 0.024 | 0.025 | 22 | 0.9 | 1.10 (1.08,1.13) | 1.215 | |
| <-9.4°C | 0.93 | 0.905 | 0.952 | 0.023 | 0.024 | 21 | 0.9 | 0.93 (0.91,0.95) | 1.215 | |
| 18 - 29 | ≥-0.3° <3.0°C | 1 | 0.973 | 1.024 | 0.025 | 0.026 | 19 | 0.9 | 1.00 (0.97,1.02) | 1.215 |
| ≥-4.1° <-0.3°C | 1.06 | 1.03 | 1.085 | 0.027 | 0.028 | 18 | 0.9 | 1.06 (1.03,1.09) | 1.215 | |
| ≥-9.4° <-4.1°C | 1.11 | 1.079 | 1.139 | 0.03 | 0.03 | 17 | 0.9 | 1.11 (1.08,1.14) | 1.215 | |
| <-9.4°C | 1 | 0.969 | 1.029 | 0.029 | 0.031 | 16 | 0.9 | 1.00 (0.97,1.03) | 1.215 | |
| 30 - 44 | ≥-0.3° <3.0°C | 1.1 | 1.071 | 1.124 | 0.026 | 0.027 | 14 | 0.9 | 1.10 (1.07,1.12) | 1.215 |
| ≥-4.1° <-0.3°C | 1.18 | 1.154 | 1.212 | 0.028 | 0.03 | 13 | 0.9 | 1.18 (1.15,1.21) | 1.215 | |
| ≥-9.4° <-4.1°C | 1.14 | 1.107 | 1.166 | 0.029 | 0.03 | 12 | 0.9 | 1.14 (1.11,1.17) | 1.215 | |
| <-9.4°C | 1 | 0.968 | 1.026 | 0.029 | 0.029 | 11 | 0.9 | 1.00 (0.97,1.03) | 1.215 | |
| 45 - 64 | ≥-0.3° <3.0°C | 1.08 | 1.058 | 1.095 | 0.018 | 0.019 | 9 | 0.9 | 1.08 (1.06,1.10) | 1.215 |
| ≥-4.1° <-0.3°C | 1.15 | 1.128 | 1.168 | 0.02 | 0.02 | 8 | 0.9 | 1.15 (1.13,1.17) | 1.215 | |
| ≥-9.4° <-4.1°C | 1.13 | 1.107 | 1.149 | 0.02 | 0.022 | 7 | 0.9 | 1.13 (1.11,1.15) | 1.215 | |
| <-9.4°C | 0.95 | 0.926 | 0.965 | 0.019 | 0.02 | 6 | 0.9 | 0.95 (0.93,0.97) | 1.215 | |
| 65+ | ≥-0.3° <3.0°C | 1.02 | 1.007 | 1.038 | 0.015 | 0.016 | 4 | 0.9 | 1.02 (1.01,1.04) | 1.215 |
| ≥-4.1° <-0.3°C | 1.05 | 1.034 | 1.067 | 0.016 | 0.017 | 3 | 0.9 | 1.05 (1.03,1.07) | 1.215 | |
| ≥-9.4° <-4.1°C | 1.01 | 0.991 | 1.025 | 0.017 | 0.017 | 2 | 0.9 | 1.01 (0.99,1.03) | 1.215 | |
| <-9.4°C | 0.92 | 0.901 | 0.937 | 0.018 | 0.018 | 1 | 0.9 | 0.92 (0.90,0.94) | 1.215 |
Sources: Canadian
Urban Environmental Health Research Consortium (meteorology data); National
Ambulatory Care Reporting System (emergency department visit data).
Abbreviations: CI,
confidence interval; OR, odds ratio.
Note: A quintile
approach was used to select daily average temperature ranges, as follows: blue
(−0.3 to <3.0 °C), green (−4.1 to <−0.3 °C),
orange (−9.4 to <−4.1 °C) and pink (<−9.4 °C).
- Footnote a
-
Ranges of average daily temperature: <−9.4 °C, −9.4 to <−4.1 °C, −4.1 to <−0.3 °C, −0.3 to <3.0 °C.
There were no substantive differences by sex (Figure 4). By age group, the association between average daily temperature and fall-related ED visits was weakest among older adults and most pronounced among adults. The reduction in the odds for fall-related ED visits on days with an average daily temperature of less than −9.4 °C was similar among school-aged children, those 45 to 64 years of age and older adults (OR: 0.92–0.95). Meanwhile, adults aged 18 to 29 years and 30 to 44 years demonstrated no reduction in the odds on these days (OR: 1.00). Conversely, on days with an average daily temperature of −4.1 to less than −0.3 °C, adults had the greatest increase in the odds for a fall-related ED visit (OR: 1.15–1.18) compared to other age groups (OR: 1.04–1.06).
The risk estimates from our sensitivity analysis examining the association between average daily temperature and fall-related ED visits when adjusted for snowfall (data available on request from the authors) were similar to unadjusted values for all groups analyzed. For example, the adjusted OR for the −4.1 to less than −0.3 °C average daily temperature range was 1.10 (95% CI: 1.09, 1.11), while the unadjusted OR was 1.09 (95% CI: 1.08, 1.10).
Discussion
In this study, we evaluated associations between select meteorological factors (i.e. daily snowfall accumulation and temperature) and ED visits for unintentional falls among those aged 5 years and over, in Ontario, for the months of November to March between 2011 and 2015. We found positive associations between snowfall and fall-related ED visits relative to days with no snowfall. We also found decreased odds for these events on days with an average temperature of colder than −9.4 °C compared to days with an average temperature of at least 3.0 °C.
We observed a 5% increase in the odds for fall-related ED visits on days with trace snowfall accumulation and 5 to 7 days after this accumulation. Furthermore, we observed a 5% to 8% elevation on days with non-trace snowfall accumulation up to a week afterwards. Our findings are consistent with past research that found an increase in fall-related ED visits after winter precipitation (i.e. snowfall and ice storms), with greater lags in these increases as the severity of these weather events increased.Footnote 9Footnote 16Footnote 17Footnote 19Footnote 20Footnote 21Footnote 22 The delay in increased ED visits may be due to lags in the development of slippery conditions from thawing and refreezing of precipitationFootnote 20Footnote 21 or individuals delaying care by staying indoors during inclement weather.Footnote 22 While our associations were more attenuated compared to past studies, the findings from our population-based study suggest that snowfall is an important predictor of unintentional falls treated in Ontario hospitals.
We found no substantial differences in the strength of the association between meteorological characteristic and ED visits for unintentional falls between men and women. This differs from past research that found that men had a greater risk of falling following freezing rain alerts.Footnote 8 This finding was somewhat surprising given that multiple biological and behavioural factors have previously been identified that could contribute to sex differences in these associations. For example, females may be more predisposed to falling due to age-related decreases in bone mineral density, increased depressive symptoms and gait variability.Footnote 38Footnote 39Footnote 40Footnote 41 Females may also be at a greater risk of fracture from a fall due to the loss in bone density.Footnote 2 Meanwhile, males may be at greater risk for falling due to poorer balance, increased comorbidities and greater risk-taking behaviour.Footnote 38Footnote 39Footnote 40 However, we were unable to look at these specific influences directly given limitations of the data.
In contrast, we did find that there were differences in the strength of the association across age groups. Specifically, we observed that school-aged children had reduced risks for fall-related ED visit following snowfalls relative to older age groups. We also noted that adults had the greatest positive association, even when compared to older adults, which corroborates with findings from other studies.Footnote 16Footnote 19 Given this increased risk, it is important to identify factors that may put adults at greater risk. Past research found that older adults (65+) spend less time outdoors during winter than younger adultsFootnote 42; other studies posited that exposure to winter weather during work-related commutes was responsible for this elevated risk in the younger age group.Footnote 16Footnote 19 This rationale could be extended to explain the reduced risk of fall-related ED visits among school-aged children, as schools, parents and caregivers may restrict their outdoor activities on days with inclement weather. However, it is also important to note that we did not find a reduction in risk among older adults even though they also spend less time outdoors than younger adults. This may be explained by differences in the nature in which children and older adults fall, as interactions between weather and other factors (e.g. mobility issues) may put older adults at greater risk for weather-related falls compared to children.Footnote 2 However, additional research is needed to confirm these hypotheses.
With respect to temperature, we observed a 4% to 9% increase in the odds of fall-related ED visits on days with average daily temperature ranging from −9.4 to 3.0 °C and a 5% decrease on days when the average daily temperature was colder than −9.4 °C compared to days with an average daily temperature of at least 3.0 °C. By age group, we noted school-aged children and older adults had the lowest increases in risk for temperature ranges at least −4.1 °C and modest decreases in odds on days colder than −9.4 °C. Conversely, we found that adults had the greatest elevated risk on days within the daily temperature ranges of −4.1 to less than −0.3 °C and −9.4 to less than −4.1 °C. These findings partly contradict previous studies that found an inverse association between lower average daily temperature and the incidence of falls and hip fractures.Footnote 11Footnote 23
The relationships we found between temperature and fall-related ED visits could be explained by two factors. The elevated risk on days with an average daily temperature of at least −9.4 °C may be due to increased slipperiness of walking surfaces caused by either freezing rain and ice formation from thawing and refreezing of ice and snow as temperatures fluctuate throughout the day. Meanwhile, the decreased risk on colder days (<−9.4 °C) may be attributable to individuals reducing their exposure to weather by staying indoors. Older adults may be dissuaded from going and being active outdoors during colder temperatures due to decreases in perceived walkability.Footnote 43Footnote 44 In addition, school-aged children may be at a lower risk due to the greater care taken to protect them from colder temperatures. For example, school boards have policies actively encouraging schools to keep school-aged children indoors during the school day (e.g. recess) on days of extreme cold.Footnote 45Footnote 46 While thresholds differ across different school boards and such policies also consider wind chill, unlike our analysis, such wind chills are more likely to be achieved as temperature decreases.Footnote 47 This may partly explain why these groups have a reduction in falls—unlike among young adults or adults 30 to 44 years of age where such policies are less likely to be in place. Future studies should consider evaluating the impact of these factors.
In Canada, unintentional falls are highly prevalent and the accompanying health impacts are substantial. While past research has focussed on older adults, our study suggests that other age groups can also be at increased risk for weather-related falls, especially adults aged 30 to 64 years. Thus, measures aimed at reducing weather-related falls or mitigating the resultant health impacts should also consider targeting younger demographic groups.
Our findings provide support for the development of falls prevention strategies in several areas. As part of regional planning, municipalities can consider these findings when developing service standards (e.g. priorities, snowfall thresholds, timeliness, etc.) for their ice and snow removal policies. Our findings can also inform the content, target audience and timing of weather-related risk communications. Furthermore, for some occupations, employers may be able to implement flexible work arrangement policies (e.g. remote work, variable starting and ending times) due to inclement weather to help reduce the risk of weather-related falls among employees.Footnote 16Footnote 19 Finally, these findings may be able to help hospitals better anticipate changes in the number of patient contacts and determine appropriate ED staffing levels.
Strengths and limitations
While our study has a wider scope than past Canadian studies, there are several important considerations to note in interpreting these results. First, we matched meteorological factors by place of residence. While it is possible for individuals to have fallen outside the FSA associated with their place of residence, individuals spend most of their time at home. Thus, they are most likely to be exposed to these factors at their place of residence.
Second, some falls may have occurred indoors. We attempted to remove indoor falls from our analysis by excluding NACRS records encoded with ICD-10-CA codes with indoor locations in their description (e.g. W18.00 [Fall on same level in or from bathtub]). However, some ICD-10-CA codes lack location specificity (e.g. W10 [Fall on and from stairs and steps]), which meant that we could only remove about 5% of records. However, as up to 50% of falls could occur indoors,Footnote 7Footnote 8 our risk estimates for the relationships we analyzed may be conservative. Future studies could consider using other datasets where the distinction between outdoor and indoor falls is collected, such as the Canadian Hospitals Injury Reporting and Prevention Program.
Third, our province-wide analyses do not consider more localized factors, like neighbourhood walkability. A more local analysis can provide additional insights for developing more tailored recommendations.
Nonetheless, unlike previous studies, our study can support falls prevention and mitigation efforts for across a wider range of age groups.
Conclusion
ED visits for unintentional falls are more likely to occur on days with snowfall compared to days without snowfall. This increased risk persists over several days when greater snowfall accumulation occurs. Meanwhile, the risk for fall-related ED visits decreases on days with daily average temperatures of less than −9.4 ℃ compared to days of at least 3.0 ℃. Adults are generally at greatest risk with respect to these relationships. These findings provide insight for the development of strategies to prevent and mitigate the harms due to falls.
Acknowledgements
This research is funded by the Government of Canada through the Public Health Agency of Canada and the School of Mathematics and Statistics at Carleton University. Weather-related indicators, based on custom data from Natural Resources Canada, were indexed to DMTI Spatial Inc. postal codes and provided by the Canadian Urban Environmental Health Research Consortium (CANUE).
Conflicts of interest
All authors declare no conflicts of interest.
Authors’ contributions and statement
DH, CT and PJV were involved in the conceptualization of the work and study design.
DH and PJV led the conceptualization of the analysis.
SRM and FB analyzed and provided the ED visit data. JC analyzed and provided the weather data.
DH conducted the analysis.
DH and CT led the drafting of the manuscript and preparation of the manuscript for submission.
DH, CT, WT, FB, SRM, JC and PJV were all involved in the interpretation of the data and revision of the manuscript.
The content and views expressed in this article are those of the authors and do not necessarily reflect those of the Government of Canada.