
Original quantitative research – A cross-sectional study of pain status and psychological distress among individuals living with chronic pain: the Chronic Pain & COVID-19 Pan-Canadian Study
Health Promotion and Chronic Disease Prevention in Canada
Tell us what you think
Help us improve our products, answer our quick survey.
M. Gabrielle Pagé, PhDAuthor reference footnote 1Author reference footnote 2; Anaïs Lacasse, PhDAuthor reference footnote 3; Lise Dassieu, PhDAuthor reference footnote 1; Maria Hudspith, MAAuthor reference footnote 4; Gregg Moor, BAAuthor reference footnote 4; Kathryn SuttonAuthor reference footnote 4; James M. Thompson, MDAuthor reference footnote 5Author reference footnote 6; Marc Dorais, MScAuthor reference footnote 7; Audrée Janelle Montcalm, MScAuthor reference footnote 1; Nadia Sourial, PhDAuthor reference footnote 1Author reference footnote 8; Manon Choinière, PhDAuthor reference footnote 1Author reference footnote 2
https://doi.org/10.24095/hpcdp.41.5.01
(Published February 10, 2021)
This article has been peer reviewed.
Correspondence: Gabrielle Pagé, Centre de recherche du Centre hospitalier de l’Université de Montréal, Saint Antoine Building, Room S01-122, 850 Saint Denis St., Montréal, QC H2X 0A9; Tel: 514-890-8000 ext. 31601; Email: gabrielle.page@umontreal.ca
Abstract
Background: The COVID-19 pandemic has had a disproportionate impact on vulnerable populations, including individuals with chronic pain. We examined associations between geographical variations in COVID-19 infection rates, stress and pain severity, and investigated factors associated with changes in pain status and psychological distress among individuals living with chronic pain during the pandemic.
Methods: This investigation is part of a larger initiative, the Chronic Pain & COVID-19 Pan-Canadian Study, which adopted a cross-sectional observational design. A total of 3159 individuals living with chronic pain completed a quantitative survey between 16 April and 31 May 2020.
Results: Two-thirds (68.1%) of participants were between 40 and 69 years old, and 83.5% were women. Two-thirds (68.9%) of individuals reported worsened pain since pandemic onset. Higher levels of perceived pandemic-related risks (adjusted odds ratio: 1.27; 95% confidence interval: 1.03–1.56) and stress (1.21; 1.05–1.41), changes in pharmacological (3.17; 2.49–4.05) and physical/psychological (2.04; 1.62–2.58) pain treatments and being employed at the beginning of the pandemic (1.42; 1.09–1.86) were associated with increased likelihood of reporting worsened pain. Job loss (34.9% of individuals were employed pre-pandemic) was associated with lower likelihood (0.67; 0.48–0.94) of reporting worsened pain. Almost half (43.2%) of individuals reported moderate/severe levels of psychological distress. Negative emotions toward the pandemic (2.14; 1.78–2.57) and overall stress (1.43; 1.36–1.50) were associated with moderate/severe psychological distress.
Conclusion: Study results identified psychosocial factors to consider in addition to biomedical factors in monitoring patients’ status and facilitating treatment access for chronic pain patients during a pandemic.
Keywords: COVID-19, pain, psychological distress, pandemic
Highlights
- Two-thirds of individuals who completed an online survey reported worsened pain since the beginning of the COVID-19 pandemic.
- Almost half of respondents experienced moderate to severe psychological distress.
- Changes to pain treatments during the pandemic were significantly associated with worsened pain.
- Geographical aspects, such as rural vs. urban living or living in a province with higher infection rates were not associated with pain status or psychological distress.
- In future waves of the pandemic, consideration must be given to continue offering adequate pharmacological and physical/psychological pain treatments.
Introduction
Chronic pain is defined as a pain that has been present for more than 3 months, that has persisted for longer than the normal tissue-healing time or that is associated with a chronic condition.Footnote 1Footnote 2 Worldwide, approximately 20% of the adult population lives with chronic pain,Footnote 3Footnote 4 Inadequate chronic pain management costs between $38.3 billion and $40.4 billion in annual direct and indirect health care costs in Canada.Footnote 5
Chronic pain can have a wide range of repercussions on a person’s life and their health-related quality of life and mental health comorbidities.Footnote 6 These impacts on physical and mental health and well-being may be heightened during times of high stress. One-quarter of individuals in the general population report experiencing anxiety or depressive symptoms since the beginning of the COVID-19 pandemic.Footnote 7 However, there is a paucity of empirical data on the physical and mental health effects of the COVID-19 pandemic on vulnerable populations such as individuals living with chronic pain. Describing and identifying factors associated with poor physical and mental health statuses can inform public health decisions in future waves of the pandemic.
Based on expert opinion, individuals with chronic pain are likely to experience an exacerbation of their health condition during and after the COVID-19 pandemic.Footnote 8 This crisis and the associated psychological stressors may also precipitate a new onset of chronic pain.Footnote 8 One out of two individuals receiving tertiary chronic pain treatment in Canada live below the poverty line,Footnote 9 and the pandemic has disproportionally affected populations with low socioeconomic status. Furthermore, access to proper pain assessment, treatment and management has been challenging in Canada for a long time—particularly in rural and remote regionsFootnote 10—and the large-scale shut down of pain clinics, allied health professionals’ offices and exercise facilities during the pandemic has worsened pain management access.
The goal of this cross-sectional study was to document the physical and mental health status and socioeconomic status of Canadians living with chronic pain during the COVID-19 pandemic. The specific objectives were to (1) examine the association between geographical variations in COVID-19 infection rate, stress appraisal and pain severity; and (2) investigate the biopsychosocial factors associated with (a) changes in pain status during the COVID-19 pandemic, and (b) psychological distress among individuals living with chronic pain.
We hypothesized that (1) high provincial infection rates of COVID-19 would be associated with higher levels of stress appraisal and pain severity; and (2) the degree of geographical infection rates of COVID-19 and levels of perceived global and pandemic-specific stress would be associated with pain deterioration and psychological distress.
Methods
Design
The present study is part of a larger initiative, the Chronic Pain & COVID-19 Pan-Canadian Study, which used a cross-sectional mixed-method design to answer various pandemic-related research questions.Footnote 11 Quantitative survey data are summarized in the present article.
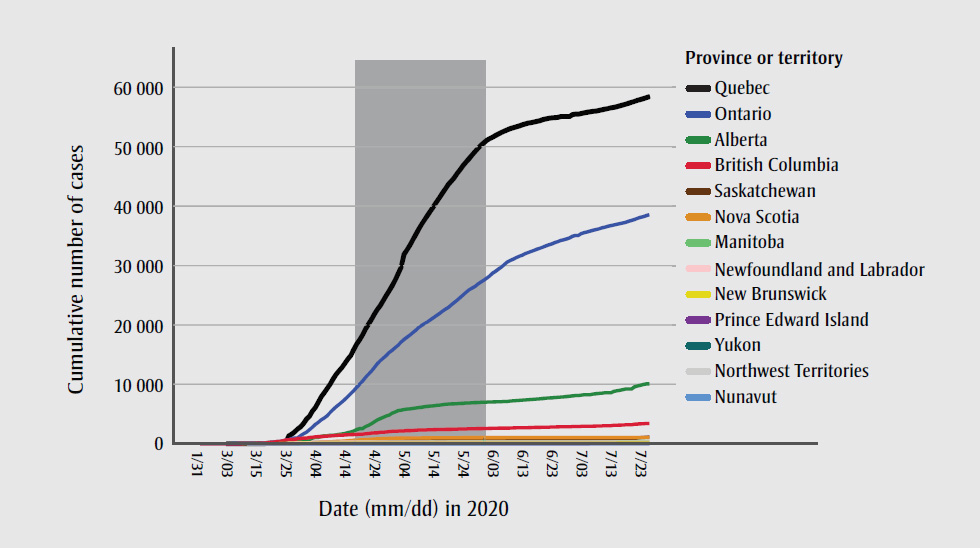
As shown by the shaded area in Figure 1, the study started at an early stage of the pandemic when the number of cumulative cases was growing exponentially in some provinces and the peak number of COVID-19 cases had not yet been reached.
Figure 1. Cumulative number of cases across provinces and territories, Canada
Text description: Figure 1
| Date | British Columbia | Alberta | Saskatchewan | Manitoba | Ontario | Quebec | Newfoundland and Labrador | New Brunswick | Nova Scotia | Prince Edward Island | Yukon | Northwest Territories | Nunavut |
|---|---|---|---|---|---|---|---|---|---|---|---|---|---|
| 31-01-2020 | 1 | 0 | 0 | 0 | 3 | 0 | 0 | 0 | 0 | 0 | 0 | 0 | 0 |
| 08-02-2020 | 4 | 0 | 0 | 0 | 3 | 0 | 0 | 0 | 0 | 0 | 0 | 0 | 0 |
| 16-02-2020 | 5 | 0 | 0 | 0 | 3 | 0 | 0 | 0 | 0 | 0 | 0 | 0 | 0 |
| 21-02-2020 | 6 | 0 | 0 | 0 | 3 | 0 | 0 | 0 | 0 | 0 | 0 | 0 | 0 |
| 24-02-2020 | 6 | 0 | 0 | 0 | 4 | 0 | 0 | 0 | 0 | 0 | 0 | 0 | 0 |
| 25-02-2020 | 7 | 0 | 0 | 0 | 4 | 0 | 0 | 0 | 0 | 0 | 0 | 0 | 0 |
| 26-02-2020 | 7 | 0 | 0 | 0 | 5 | 0 | 0 | 0 | 0 | 0 | 0 | 0 | 0 |
| 27-02-2020 | 7 | 0 | 0 | 0 | 6 | 0 | 0 | 0 | 0 | 0 | 0 | 0 | 0 |
| 29-02-2020 | 7 | 0 | 0 | 0 | 8 | 0 | 0 | 0 | 0 | 0 | 0 | 0 | 0 |
| 01-03-2020 | 8 | 0 | 0 | 0 | 15 | 1 | 0 | 0 | 0 | 0 | 0 | 0 | 0 |
| 03-03-2020 | 12 | 0 | 0 | 0 | 20 | 1 | 0 | 0 | 0 | 0 | 0 | 0 | 0 |
| 05-03-2020 | 21 | 0 | 0 | 0 | 22 | 2 | 0 | 0 | 0 | 0 | 0 | 0 | 0 |
| 06-03-2020 | 21 | 0 | 0 | 0 | 28 | 2 | 0 | 0 | 0 | 0 | 0 | 0 | 0 |
| 07-03-2020 | 27 | 0 | 0 | 0 | 28 | 2 | 0 | 0 | 0 | 0 | 0 | 0 | 0 |
| 08-03-2020 | 27 | 1 | 0 | 0 | 31 | 3 | 0 | 0 | 0 | 0 | 0 | 0 | 0 |
| 09-03-2020 | 32 | 7 | 0 | 0 | 34 | 4 | 0 | 0 | 0 | 0 | 0 | 0 | 0 |
| 11-03-2020 | 39 | 14 | 0 | 0 | 42 | 7 | 0 | 0 | 0 | 0 | 0 | 0 | 0 |
| 12-03-2020 | 46 | 19 | 0 | 0 | 59 | 13 | 0 | 0 | 0 | 0 | 0 | 0 | 0 |
| 13-03-2020 | 53 | 23 | 0 | 1 | 79 | 17 | 0 | 1 | 0 | 0 | 0 | 0 | 0 |
| 14-03-2020 | 64 | 29 | 0 | 1 | 79 | 17 | 0 | 1 | 0 | 0 | 0 | 0 | 0 |
| 15-03-2020 | 73 | 39 | 0 | 4 | 103 | 24 | 0 | 1 | 0 | 1 | 0 | 0 | 0 |
| 16-03-2020 | 73 | 56 | 1 | 4 | 145 | 39 | 0 | 1 | 0 | 1 | 0 | 0 | 0 |
| 17-03-2020 | 103 | 74 | 2 | 7 | 177 | 50 | 0 | 2 | 0 | 1 | 0 | 0 | 0 |
| 18-03-2020 | 186 | 97 | 2 | 8 | 189 | 74 | 0 | 2 | 1 | 1 | 0 | 0 | 0 |
| 19-03-2020 | 271 | 146 | 8 | 17 | 258 | 121 | 1 | 7 | 5 | 2 | 0 | 0 | 0 |
| 20-03-2020 | 271 | 195 | 8 | 17 | 311 | 139 | 3 | 7 | 5 | 2 | 0 | 0 | 0 |
| 21-03-2020 | 424 | 226 | 25 | 11 | 377 | 202 | 3 | 9 | 9 | 2 | 0 | 1 | 0 |
| 22-03-2020 | 424 | 259 | 33 | 11 | 425 | 221 | 3 | 9 | 28 | 3 | 0 | 1 | 0 |
| 23-03-2020 | 472 | 301 | 65 | 11 | 503 | 221 | 4 | 9 | 41 | 3 | 2 | 1 | 0 |
| 24-03-2020 | 617 | 358 | 72 | 11 | 588 | 221 | 4 | 18 | 51 | 3 | 2 | 1 | 0 |
| 25-03-2020 | 659 | 419 | 86 | 11 | 688 | 1339 | 67 | 26 | 68 | 5 | 3 | 1 | 0 |
| 26-03-2020 | 725 | 486 | 95 | 11 | 858 | 1629 | 82 | 33 | 73 | 9 | 3 | 1 | 0 |
| 27-03-2020 | 725 | 542 | 104 | 25 | 993 | 2021 | 102 | 45 | 90 | 11 | 3 | 1 | 0 |
| 28-03-2020 | 884 | 542 | 134 | 25 | 993 | 2498 | 120 | 51 | 110 | 11 | 4 | 1 | 0 |
| 29-03-2020 | 884 | 621 | 134 | 69 | 1355 | 2840 | 135 | 66 | 122 | 11 | 4 | 1 | 0 |
| 30-03-2020 | 960 | 690 | 175 | 83 | 1706 | 3430 | 148 | 68 | 127 | 18 | 5 | 1 | 0 |
| 31-03-2020 | 970 | 754 | 184 | 91 | 1966 | 4162 | 152 | 70 | 147 | 21 | 5 | 1 | 0 |
| 01-04-2020 | 1066 | 754 | 193 | 109 | 2392 | 4611 | 175 | 81 | 173 | 21 | 5 | 2 | 0 |
| 02-04-2020 | 1121 | 968 | 206 | 152 | 2793 | 5518 | 183 | 91 | 193 | 22 | 6 | 2 | 0 |
| 03-04-2020 | 1174 | 1075 | 220 | 164 | 3255 | 6101 | 183 | 95 | 207 | 22 | 6 | 4 | 0 |
| 04-04-2020 | 1203 | 1075 | 231 | 172 | 3630 | 6997 | 195 | 98 | 236 | 22 | 6 | 4 | 0 |
| 05-04-2020 | 1203 | 1250 | 249 | 187 | 4038 | 7944 | 217 | 101 | 262 | 22 | 6 | 4 | 0 |
| 06-04-2020 | 1266 | 1348 | 253 | 190 | 4347 | 8580 | 226 | 103 | 293 | 22 | 7 | 5 | 0 |
| 07-04-2020 | 1291 | 1373 | 260 | 203 | 4726 | 9340 | 228 | 105 | 310 | 22 | 7 | 5 | 0 |
| 08-04-2020 | 1336 | 1423 | 271 | 206 | 5276 | 10031 | 232 | 108 | 342 | 24 | 7 | 5 | 0 |
| 09-04-2020 | 1370 | 1451 | 278 | 207 | 5759 | 10912 | 236 | 111 | 373 | 25 | 8 | 5 | 0 |
| 10-04-2020 | 1410 | 1500 | 285 | 215 | 6237 | 11677 | 239 | 112 | 407 | 25 | 8 | 5 | 0 |
| 11-04-2020 | 1445 | 1569 | 289 | 226 | 6648 | 12292 | 241 | 112 | 428 | 25 | 8 | 5 | 0 |
| 12-04-2020 | 1445 | 1651 | 296 | 226 | 7049 | 12846 | 242 | 114 | 445 | 25 | 8 | 5 | 0 |
| 13-04-2020 | 1490 | 1732 | 300 | 229 | 7470 | 13557 | 244 | 116 | 474 | 25 | 8 | 5 | 0 |
| 14-04-2020 | 1517 | 1870 | 301 | 229 | 7953 | 14248 | 244 | 116 | 517 | 25 | 8 | 5 | 0 |
| 15-04-2020 | 1561 | 1996 | 304 | 231 | 8447 | 14860 | 247 | 117 | 549 | 26 | 8 | 5 | 0 |
| 16-04-2020 | 1561 | 2158 | 305 | 239 | 8961 | 15857 | 252 | 117 | 579 | 26 | 8 | 5 | 0 |
| 17-04-2020 | 1575 | 2397 | 306 | 239 | 9525 | 16798 | 256 | 117 | 606 | 26 | 9 | 5 | 0 |
| 18-04-2020 | 1618 | 2562 | 310 | 243 | 10010 | 17521 | 257 | 118 | 649 | 26 | 9 | 5 | 0 |
| 19-04-2020 | 1618 | 2562 | 314 | 245 | 10578 | 18357 | 257 | 118 | 675 | 26 | 9 | 5 | 0 |
| 20-04-2020 | 1699 | 2908 | 316 | 246 | 11184 | 19319 | 257 | 118 | 721 | 26 | 11 | 5 | 0 |
| 21-04-2020 | 1724 | 3095 | 320 | 246 | 11735 | 20126 | 257 | 118 | 737 | 26 | 11 | 5 | 0 |
| 22-04-2020 | 1795 | 3401 | 326 | 246 | 12245 | 20965 | 256 | 118 | 772 | 26 | 11 | 5 | 0 |
| 23-04-2020 | 1824 | 3720 | 331 | 251 | 12879 | 21838 | 256 | 118 | 827 | 26 | 11 | 5 | 0 |
| 24-04-2020 | 1853 | 4017 | 341 | 252 | 13519 | 22616 | 256 | 118 | 850 | 26 | 11 | 5 | 0 |
| 25-04-2020 | 1948 | 4233 | 347 | 256 | 13995 | 23267 | 257 | 118 | 865 | 26 | 11 | 5 | 0 |
| 26-04-2020 | 1948 | 4480 | 353 | 260 | 14432 | 24107 | 258 | 118 | 873 | 26 | 11 | 5 | 0 |
| 27-04-2020 | 1998 | 4696 | 365 | 261 | 14856 | 24982 | 258 | 118 | 900 | 26 | 11 | 5 | 0 |
| 28-04-2020 | 2053 | 4850 | 366 | 261 | 15381 | 25757 | 258 | 118 | 915 | 27 | 11 | 5 | 0 |
| 29-04-2020 | 2087 | 5165 | 383 | 263 | 15728 | 26594 | 258 | 118 | 935 | 27 | 11 | 5 | 0 |
| 30-04-2020 | 2112 | 5355 | 389 | 264 | 16187 | 27538 | 258 | 118 | 947 | 27 | 11 | 5 | 0 |
| 01-05-2020 | 2145 | 5573 | 415 | 268 | 16608 | 28648 | 259 | 118 | 959 | 27 | 11 | 5 | 0 |
| 02-05-2020 | 2171 | 5670 | 421 | 269 | 17119 | 29656 | 259 | 118 | 963 | 27 | 11 | 5 | 0 |
| 03-05-2020 | 2171 | 5766 | 433 | 270 | 17553 | 31865 | 259 | 118 | 971 | 27 | 11 | 5 | 0 |
| 04-05-2020 | 2224 | 5836 | 467 | 270 | 17923 | 32623 | 259 | 118 | 985 | 27 | 11 | 5 | 0 |
| 05-05-2020 | 2232 | 5893 | 487 | 271 | 18310 | 33417 | 259 | 119 | 991 | 27 | 11 | 5 | 0 |
| 06-05-2020 | 2255 | 5963 | 512 | 273 | 18722 | 34327 | 259 | 120 | 998 | 27 | 11 | 5 | 0 |
| 07-05-2020 | 2288 | 6017 | 531 | 272 | 19121 | 35238 | 261 | 120 | 1007 | 27 | 11 | 5 | 0 |
| 08-05-2020 | 2315 | 6098 | 544 | 273 | 19598 | 36150 | 261 | 120 | 1008 | 27 | 11 | 5 | 0 |
| 09-05-2020 | 2330 | 6157 | 553 | 273 | 19944 | 36986 | 261 | 120 | 1011 | 27 | 11 | 5 | 0 |
| 10-05-2020 | 2330 | 6253 | 564 | 276 | 20238 | 37721 | 261 | 120 | 1018 | 27 | 11 | 5 | 0 |
| 11-05-2020 | 2353 | 6300 | 568 | 278 | 20546 | 38469 | 261 | 120 | 1019 | 27 | 11 | 5 | 0 |
| 12-05-2020 | 2360 | 6345 | 573 | 279 | 20907 | 39225 | 261 | 120 | 1020 | 27 | 11 | 5 | 0 |
| 13-05-2020 | 2376 | 6407 | 577 | 279 | 21236 | 39931 | 261 | 120 | 1024 | 27 | 11 | 5 | 0 |
| 14-05-2020 | 2392 | 6457 | 582 | 278 | 21581 | 40724 | 261 | 120 | 1026 | 27 | 11 | 5 | 0 |
| 15-05-2020 | 2407 | 6515 | 590 | 278 | 21922 | 41420 | 260 | 120 | 1034 | 27 | 11 | 5 | 0 |
| 16-05-2020 | 2428 | 6587 | 591 | 278 | 22313 | 42183 | 260 | 120 | 1037 | 27 | 11 | 5 | 0 |
| 17-05-2020 | 2428 | 6644 | 592 | 278 | 22653 | 42920 | 260 | 120 | 1040 | 27 | 11 | 5 | 0 |
| 18-05-2020 | 2444 | 6683 | 592 | 279 | 22957 | 43627 | 260 | 120 | 1043 | 27 | 11 | 5 | 0 |
| 19-05-2020 | 2446 | 6716 | 599 | 279 | 23384 | 44197 | 260 | 120 | 1044 | 27 | 11 | 5 | 0 |
| 20-05-2020 | 2467 | 6716 | 620 | 279 | 23774 | 44775 | 260 | 120 | 1045 | 27 | 11 | 5 | 0 |
| 21-05-2020 | 2479 | 6768 | 622 | 279 | 24187 | 45495 | 260 | 121 | 1046 | 27 | 11 | 5 | 0 |
| 22-05-2020 | 2507 | 6800 | 627 | 281 | 24628 | 46141 | 260 | 121 | 1048 | 27 | 11 | 5 | 0 |
| 23-05-2020 | 2517 | 6818 | 630 | 281 | 25040 | 46838 | 260 | 121 | 1049 | 27 | 11 | 5 | 0 |
| 24-05-2020 | 2517 | 6860 | 632 | 281 | 25500 | 47411 | 260 | 121 | 1050 | 27 | 11 | 5 | 0 |
| 25-05-2020 | 2530 | 6879 | 634 | 281 | 25904 | 47984 | 260 | 121 | 1051 | 27 | 11 | 5 | 0 |
| 26-05-2020 | 2541 | 6901 | 634 | 281 | 26191 | 48598 | 260 | 122 | 1052 | 27 | 11 | 5 | 0 |
| 27-05-2020 | 2550 | 6926 | 637 | 281 | 26483 | 49139 | 260 | 123 | 1053 | 27 | 11 | 5 | 0 |
| 28-05-2020 | 2558 | 6955 | 639 | 283 | 26866 | 49702 | 261 | 126 | 1055 | 27 | 11 | 5 | 0 |
| 29-05-2020 | 2562 | 6979 | 641 | 283 | 27210 | 50232 | 261 | 128 | 1055 | 27 | 11 | 5 | 0 |
| 30-05-2020 | 2573 | 6992 | 645 | 283 | 27533 | 50651 | 261 | 129 | 1056 | 27 | 11 | 5 | 0 |
| 31-05-2020 | 2573 | 7010 | 646 | 284 | 27859 | 51059 | 261 | 132 | 1056 | 27 | 11 | 5 | 0 |
| 01-06-2020 | 2597 | 7044 | 646 | 284 | 28263 | 51354 | 261 | 132 | 1057 | 27 | 11 | 5 | 0 |
| 02-06-2020 | 2601 | 7057 | 646 | 286 | 28709 | 51593 | 261 | 133 | 1057 | 27 | 11 | 5 | 0 |
| 03-06-2020 | 2623 | 7076 | 647 | 287 | 29047 | 51884 | 261 | 135 | 1058 | 27 | 11 | 5 | 0 |
| 04-06-2020 | 2632 | 7091 | 648 | 287 | 29403 | 52143 | 261 | 136 | 1058 | 27 | 11 | 5 | 0 |
| 05-06-2020 | 2632 | 7098 | 649 | 289 | 29747 | 52398 | 261 | 136 | 1058 | 27 | 11 | 5 | 0 |
| 06-06-2020 | 2632 | 7138 | 650 | 289 | 30202 | 52624 | 261 | 136 | 1058 | 27 | 11 | 5 | 0 |
| 07-06-2020 | 2632 | 7138 | 650 | 289 | 30617 | 52849 | 261 | 137 | 1059 | 27 | 11 | 5 | 0 |
| 08-06-2020 | 2659 | 7202 | 654 | 289 | 30860 | 53047 | 261 | 146 | 1059 | 27 | 11 | 5 | 0 |
| 09-06-2020 | 2669 | 7229 | 656 | 289 | 31090 | 53185 | 261 | 147 | 1060 | 27 | 11 | 5 | 0 |
| 10-06-2020 | 2680 | 7276 | 658 | 289 | 31341 | 53341 | 261 | 151 | 1061 | 27 | 11 | 5 | 0 |
| 11-06-2020 | 2694 | 7316 | 660 | 289 | 31544 | 53485 | 261 | 153 | 1061 | 27 | 11 | 5 | 0 |
| 12-06-2020 | 2709 | 7346 | 663 | 290 | 31726 | 53666 | 261 | 154 | 1061 | 27 | 11 | 5 | 0 |
| 13-06-2020 | 2709 | 7383 | 664 | 292 | 31992 | 53824 | 261 | 157 | 1061 | 27 | 11 | 5 | 0 |
| 14-06-2020 | 2709 | 7433 | 665 | 293 | 32189 | 53952 | 261 | 157 | 1061 | 27 | 11 | 5 | 0 |
| 15-06-2020 | 2745 | 7453 | 683 | 293 | 32370 | 54054 | 261 | 160 | 1061 | 27 | 11 | 5 | 0 |
| 16-06-2020 | 2756 | 7482 | 684 | 293 | 32554 | 54146 | 261 | 163 | 1061 | 27 | 11 | 5 | 0 |
| 17-06-2020 | 2775 | 7530 | 693 | 295 | 32744 | 54263 | 261 | 164 | 1061 | 27 | 11 | 5 | 0 |
| 18-06-2020 | 2783 | 7579 | 708 | 297 | 32917 | 54383 | 261 | 164 | 1061 | 27 | 11 | 5 | 0 |
| 19-06-2020 | 2790 | 7625 | 716 | 300 | 33095 | 54550 | 261 | 164 | 1061 | 27 | 11 | 5 | 0 |
| 20-06-2020 | 2790 | 7673 | 726 | 302 | 33301 | 54674 | 261 | 164 | 1061 | 27 | 11 | 5 | 0 |
| 21-06-2020 | 2790 | 7704 | 746 | 302 | 33476 | 54766 | 261 | 164 | 1061 | 27 | 11 | 5 | 0 |
| 22-06-2020 | 2822 | 7736 | 751 | 303 | 33637 | 54835 | 261 | 164 | 1061 | 27 | 11 | 5 | 0 |
| 23-06-2020 | 2835 | 7781 | 753 | 303 | 33853 | 54884 | 261 | 165 | 1061 | 27 | 11 | 5 | 0 |
| 24-06-2020 | 2849 | 7825 | 757 | 304 | 34016 | 54937 | 261 | 165 | 1061 | 27 | 11 | 5 | 0 |
| 25-06-2020 | 2869 | 7851 | 759 | 305 | 34205 | 55079 | 261 | 165 | 1061 | 27 | 11 | 5 | 0 |
| 26-06-2020 | 2878 | 7888 | 772 | 307 | 34316 | 55079 | 261 | 165 | 1061 | 27 | 11 | 5 | 0 |
| 27-06-2020 | 2878 | 7957 | 777 | 311 | 34476 | 55079 | 261 | 165 | 1061 | 27 | 11 | 5 | 0 |
| 28-06-2020 | 2878 | 7996 | 778 | 311 | 34654 | 55079 | 261 | 165 | 1061 | 27 | 11 | 5 | 0 |
| 29-06-2020 | 2904 | 8067 | 779 | 313 | 34911 | 55390 | 261 | 165 | 1061 | 27 | 11 | 5 | 0 |
| 30-06-2020 | 2916 | 8108 | 785 | 314 | 35068 | 55458 | 261 | 165 | 1062 | 27 | 11 | 5 | 0 |
| 01-07-2020 | 2916 | 8108 | 785 | 314 | 35068 | 55458 | 261 | 165 | 1062 | 27 | 11 | 5 | 0 |
| 02-07-2020 | 2940 | 8202 | 795 | 314 | 35370 | 55593 | 261 | 165 | 1064 | 27 | 11 | 5 | 0 |
| 03-07-2020 | 2947 | 8259 | 796 | 314 | 35535 | 55682 | 261 | 165 | 1064 | 27 | 11 | 5 | 0 |
| 04-07-2020 | 2947 | 8259 | 796 | 314 | 35656 | 55784 | 261 | 165 | 1064 | 30 | 11 | 5 | 0 |
| 05-07-2020 | 2947 | 8259 | 796 | 314 | 35794 | 55863 | 261 | 165 | 1064 | 32 | 11 | 5 | 0 |
| 06-07-2020 | 2978 | 8389 | 805 | 314 | 35948 | 55937 | 261 | 165 | 1065 | 32 | 11 | 5 | 0 |
| 07-07-2020 | 2990 | 8436 | 806 | 314 | 36060 | 55997 | 261 | 165 | 1065 | 32 | 11 | 5 | 0 |
| 08-07-2020 | 3008 | 8482 | 808 | 314 | 36178 | 56079 | 261 | 165 | 1066 | 32 | 11 | 5 | 0 |
| 09-07-2020 | 3028 | 8519 | 813 | 314 | 36348 | 56216 | 261 | 166 | 1066 | 33 | 11 | 5 | 0 |
| 10-07-2020 | 3053 | 8596 | 815 | 314 | 36464 | 56316 | 262 | 166 | 1066 | 33 | 11 | 5 | 0 |
| 11-07-2020 | 3053 | 8596 | 815 | 314 | 36594 | 56407 | 262 | 166 | 1066 | 33 | 11 | 5 | 0 |
| 12-07-2020 | 3053 | 8596 | 815 | 314 | 36723 | 56521 | 262 | 166 | 1066 | 34 | 11 | 5 | 0 |
| 13-07-2020 | 3115 | 8826 | 871 | 314 | 36839 | 56621 | 262 | 166 | 1066 | 35 | 11 | 5 | 0 |
| 14-07-2020 | 3128 | 8912 | 876 | 319 | 36950 | 56730 | 262 | 167 | 1066 | 36 | 11 | 5 | 0 |
| 15-07-2020 | 3149 | 8994 | 881 | 319 | 37052 | 56859 | 262 | 168 | 1067 | 36 | 11 | 5 | 0 |
| 16-07-2020 | 3170 | 9114 | 923 | 320 | 37163 | 57001 | 262 | 168 | 1067 | 36 | 11 | 5 | 0 |
| 17-07-2020 | 3198 | 9219 | 936 | 325 | 37274 | 57142 | 262 | 168 | 1067 | 36 | 13 | 5 | 0 |
| 18-07-2020 | 3198 | 9219 | 941 | 326 | 37440 | 57300 | 262 | 168 | 1067 | 36 | 13 | 5 | 0 |
| 19-07-2020 | 3198 | 9219 | 943 | 332 | 37604 | 57466 | 262 | 169 | 1067 | 36 | 13 | 5 | 0 |
| 20-07-2020 | 3300 | 9587 | 962 | 343 | 37739 | 57616 | 262 | 170 | 1067 | 36 | 13 | 5 | 0 |
| 21-07-2020 | 3328 | 9728 | 970 | 353 | 37942 | 57796 | 263 | 170 | 1067 | 36 | 13 | 5 | 0 |
| 22-07-2020 | 3362 | 9861 | 1030 | 361 | 38107 | 57938 | 264 | 170 | 1067 | 36 | 13 | 5 | 0 |
| 23-07-2020 | 3392 | 9975 | 1072 | 362 | 38210 | 58080 | 264 | 170 | 1067 | 36 | 13 | 5 | 0 |
| 24-07-2020 | 3419 | 10086 | 1099 | 371 | 38405 | 58243 | 265 | 170 | 1067 | 36 | 14 | 5 | 0 |
| 25-07-2020 | 3419 | 10086 | 1136 | 375 | 38543 | 58414 | 265 | 170 | 1067 | 36 | 14 | 5 | 0 |
Participants
Eligible participants were adults (≥18 years old) living in Canada, fluent in French and/or English, who had pain for more than 3 months and access to the Internet.
Recruitment
The study used a non-probabilistic sampling approach. Study advertisements containing a web-based hyperlink to a consent form and questionnaire in French and English were published through patient associations, pain organizations, research networks and social media across Canada.
Procedures
The study was approved by the research ethics board of the Centre hospitalier de l’Université de Montréal. The survey ran from 16 April to 31 May, 2020, that is, roughly one month after the beginning of public health restrictions in Canada and before these restrictions were lifted. Interested participants answered screening questions regarding their eligibility on the study’s landing page and provided consent electronically. They were then automatically directed to the online study’s questionnaire. Participants were eligible to win one of ten $100 prepaid Visa gift cards. Only one questionnaire completion per IP address was allowed. The full survey was pre-tested by five people with chronic pain and with various education levels.
Measures
Main outcomes
Pain status change was assessed using the Patient Global Impression of Change scale, a 7-point Likert scale (from 1 for considerably worsened to 7 for considerably improved). This scale has high test–retest reliability (intraclass correlation coefficient of 0.80–0.92) and construct validity (moderate correlation with other measures of change [r = 0.53]).Footnote 13 Psychological distress was measured using a validated screening measure of depressive and anxious symptoms, the Patient Health Questionnaire-4 (PHQ-4).Footnote 14 The PHQ-4 has good convergent validity (r = 0.36–0.80 with subscales of a global measure of functioning), internal consistency (α = 0.78–0.82) and item intercorrelation (r = 0.60).Footnote 14Footnote 15
Pain characteristics
We assessed changes (yes/no/not applicable) in pharmacological and physical/psychological treatments since the beginning of the COVID-19 pandemic and initiation of public health safety measures (mid-March 2020 in Canada). The Numerical Rating Scale (NRS) for Pain IntensityFootnote 16Footnote 17 was used to measure average and worst pain intensity and pain unpleasantness over the past 7 days. The Brief Pain Inventory (BPI)Footnote 18 measured pain interference on various aspects of daily living. The BPI is a reliable (α > 0.70) scale that has demonstrated good convergent (r = 0.57–0.81 with generic pain measures) validity and sensitivity to change.Footnote 19Footnote 20 The EQ-5D-5LFootnote 21 assessed health-related quality of life and has been shown to have adequate construct validity and responsiveness among individuals with chronic pain.Footnote 22
Impact of the COVID-19 pandemic
A group of pain researchers, clinicians and patient representatives developed a questionnaire based on Lazarus and Folkman’s transactional stress modelFootnote 23 to measure (a) stressors and (b) primary appraisal. The following scores were computed from this questionnaire:
- emotional reactions toward the COVID-19 pandemic;
- stress (human and material);
- appraisal of the COVID-19 pandemic experience; and
- restrictions (work-related, health, social).
For scores on emotional reactions toward the COVID-19 pandemic, participants were asked to report the extent to which they experienced different emotions (sadness, worries, solitude, anger, powerlessness, anxiety, surprise, relief and hope) when they thought or heard about the COVID-19 pandemic on a scale from 0 (not at all) to 10 (enormously). A data reduction approach was used for further analyses: after removing skewed variables (surprise and hope) and the only positive emotion left (relief), parallel factor analysis revealed a one-factor solution. Regression analysis was carried out to generate a unique factor score for each participant.
For scores on stress (human and material), participants were asked to rate the extent to which they found several pandemic-associated factors stressful on a scale from 0 (not at all) to 10 (extremely). A similar data reduction strategy was used for these items. Factor 1, called material stress, included stress related to finances, food and essential items. Factor 2, called human stress, included stress associated with the pandemic and virus, and public health safety measures.
We used the Perceived Stress Scale-4 (PSS-4)Footnote 24 to measure the extent to which individuals found their life unpredictable, uncontrollable and overloaded over the past month. The PSS-4 has excellent internal consistency (α = 0.81) and adequate convergent validity (r = 0.66–0.73) with measures of depression and anxiety.Footnote 24
Appraisal of the COVID-19 pandemic experience was measured in terms of (1) individuals’ perceived susceptibility (accessibility of screening tests for COVID-19; perceived risk of being infected); (2) perceived severity (having access to necessary medical help should individuals get infected and their perceived change of recovery from COVID-19); (3) perceived benefits (agreement levels with confinement measures and the extent to which, despite the confinements, they can experience an active social life); and (4) perceived risks (decreased social activities and increased dependence toward others).
To assess restrictions (work-related, health, social), individuals were asked to identify which of the public health measures set in place were directly affecting them. For each subcategory (work, health, social), a sum of the number of restrictions endorsed was computed.
Data analysis
We used descriptive statistics to examine pain, geographical variations in COVID-19 infection rates, public health restriction measures and characteristics of psychological well-being.
To examine the effect of geographical variations in COVID-19 infection rate as a function of number of provincial cases, urban/rural living and their interaction with stress (Model 1: human and material-related stress, PSS-4) and pain (Model 2: pain interference, worst and average pain intensity, quality of life), we used multivariate analysis of variance.
To identify variables associated with pain deterioration (Model 3) and psychological distress (Model 4), we used multivariate logistic regression analyses. The dependent variable in Model 3 was pain deterioration (somewhat, a lot or considerably worsened vs. remained unchanged, somewhat, a lot or considerably improved). In Model 4, the dependent variable was psychological distress (PHQ-4 scores 6–12 [moderate/severe psychological distress] vs. 0–5 [no/mild psychological distress]). All variables of theoretical/clinical interest were entered in the model; the full list can be found in Table 2.
We ascertained multicollinearity using variance inflation factors (VIF) and correlation coefficients. Analyses were carried out in SAS version 9.4 (SAS Institute Inc., Cary, NC, USA) and SPSS version 26.9 for Windows (IBM, Chicago, IL, USA).
Sample size estimation
Guidelines for multivariate logistic regression analysis from large observational studiesFootnote 25 recommend a sample size greater than 500 to ensure accuracy of coefficient. A sample size of 1700 participants allows for the inclusion of all explanatory factors considered in this study.
Results
Study participants
A total of 3159 eligible participants completed the study questionnaire in part or entirely (see Figure 2). Table 1 shows participants’ sociodemographic, COVID-19 and pain characteristics. Participants were predominantly women (83.5%) and White (88.3%); two-thirds (68.1%) were between 40 and 69 years old. At a mean (standard deviation [SD]) of 6.13 (1.84) out of 10, participants’ average pain intensity in the past 7 days was moderate, and 46.9% had had pain for more than 10 years.
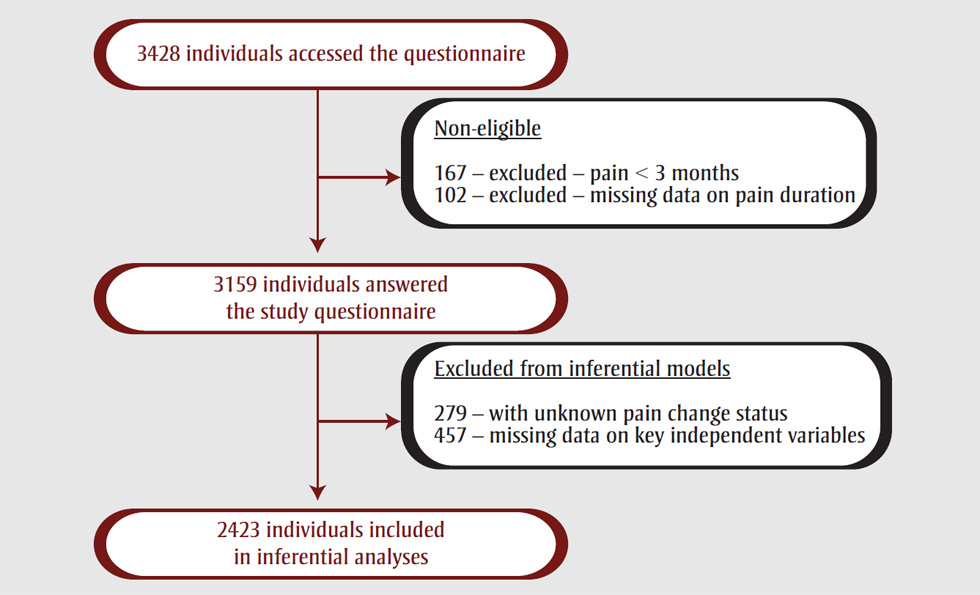
Figure 2. Study flow chart
Text description: Figure 2
Figure 2. Study flow chart
This figure depicts the flow chart of the study sample.
3428 individuals accessed the questionnaire. The following participants were deemed non-eligible and therefore excluded: 167 due to pain < 3 months and 102 due to missing pain data duration. A total of 3159 individuals thus answered the study questionnaire. 279 were excluded from inferential models as their pain change status was unknown, and 457 were excluded from inferential models because of missing data on key independent variables. A total of 2423 individuals were included in inferential analyses.
| Characteristics | Total sample (N = 3159) | Pain status (n = 2423) |
Psychological distress (n = 2423) |
||
|---|---|---|---|---|---|
| Worsened (n = 1697) | Unchanged or improved (n = 726) | No/mild psychological distress (n = 1365) |
Moderate /severe psychological distress (n = 1058) | ||
| Sociodemographic characteristics | |||||
| Age in years, n (%) | |||||
| 18–39 | 646 (24.2) | 434 (25.6) | 166 (23.0) | 297 (21.8) | 303 (28.7) |
| 40–69 | 1814 (68.1) | 1181 (69.6) | 472 (64.9) | 945 (69.2) | 708 (66.9) |
| ≥70 | 205 (7.7) | 82 (4.8) | 88 (12.1) | 123 (9.0) | 47 (4.4) |
| Missing | 494 | – | – | – | – |
| Sex, n (%) | |||||
| Female | 2225 (83.5) | 1466 (86.4) | 568 (78.2) | 1115 (81.7) | 919 (86.9) |
| Male | 429 (16.1) | 231 (13.6) | 158 (21.8) | 250 (18.3) | 139 (13.1) |
| Undetermined | 11 (0.4) | 0 (0.0) | 0 (0.0) | 0 (0.0) | 0 (0.0) |
| Missing | 494 | – | – | – | – |
| Ethnicity, n (%) | |||||
| White | 2350 (88.2) | 1502 (88.5) | 648 (89.3) | 1228 (90.0) | 921 (87.0) |
| Other | 315 (11.8) | 195 (11.5) | 78 (10.7) | 137 (10.0) | 137 (13.0) |
| Missing | 494 | – | – | – | – |
| Living condition, n (%) | |||||
| Alone | 560 (21.0) | 348 (20.5) | 159 (21.9) | 283 (20.7) | 224 (21.2) |
| Other | 2105 (79.0) | 1349 (79.5) | 567 (78.1) | 1082 (79.3) | 834 (78.8) |
| Missing | 494 | – | – | – | – |
| Civil status, n (%) | |||||
| Married or common law | 1555 (58.6) | 1005 (59.2) | 417 (57.4) | 842 (61.7) | 580 (54.8) |
| Other | 1099 (41.4) | 692 (40.8) | 309 (42.6) | 523 (38.3) | 478 (45.2) |
| Missing | 505 | – | – | – | – |
| Education, n (%) | |||||
| Less than university | 1444 (54.8) | 939 (55.4) | 385 (53.0) | 678 (49.7) | 646 (61.1) |
| University | 1193 (45.2) | 758 (44.6) | 341 (47.0) | 687 (50.3) | 412 (38.9) |
| Missing | 522 | – | – | – | – |
| Living area, n (%) | |||||
| Rural | 359 (11.4) | 227 (13.4) | 104 (14.3) | 183 (13.4) | 148 (14.0) |
| Urban | 2800 (88.6) | 1470 (86.6) | 622 (85.7) | 1182 (86.6) | 910 (86.0) |
| Work status, n (%) | |||||
| Working part-time or full-time | 976 (34.9) | 610 (40.0) | 247 (34.2) | 518 (38.0) | 339 (32.1) |
| Temporary or permanent invalidity | 899 (32.2) | 600 (35.5) | 189 (26.0) | 369 (27.1) | 420 (39.6) |
| Other | 918 (32.9) | 487 (24.5) | 290 (39.8) | 478 (34.9) | 299 (28.3) |
| Missing | 366 | – | – | – | – |
| Work status change, n (%) | |||||
| Loss of employment | 276 (10.0) | 148 (8.7) | 87 (12.0) | 127 (9.2) | 108 (10.2) |
| No loss of employment | 2484 (90.0) | 1549 (91.3) | 639 (88.0) | 1238 (90.8) | 950 (89.8) |
| Missing | 399 | – | – | – | – |
| COVID-19 pandemic-related characteristics | |||||
| Geographical variations in COVID-19 infection rates (per 100 000), n (%) | |||||
| >150 | 1923 (73.4) | 1214 (71.5) | 564 (77.7) | 1025 (75.0) | 753 (71.2) |
| 50–150 | 641 (24.5) | 443 (26.2) | 147 (20.3) | 312 (22.9) | 278 (26.3) |
| <50 | 57 (2.1) | 40 (2.3) | 15 (2.0) | 28 (2.1) | 27 (2.5) |
| Missing | 538 | – | – | – | – |
| COVID-19 infection, n (%) | |||||
| Yes, with complications requiring care | 8 (0.3) | 0 (0.0) | 0 (0.0) | 0 (0.0) | 0 (0.0) |
| Yes, without complications | 16 (0.6) | 0 (0.0) | 0 (0.0) | 0 (0.0) | 0 (0.0) |
| Waiting for test result | 15 (0.5) | 12 (0.7) | 1 (0.1) | 8 (0.6) | 5 (0.5) |
| Untested but with symptoms | 77 (2.8) | 56 (3.3) | 12 (1.7) | 32 (2.3) | 36 (3.4) |
| Not infected | 2671 (95.8) | 1629 (96.0) | 713 (98.2) | 1325 (97.1) | 1017 (96.1) |
| Missing | 372 | – | – | – | – |
| Work-related restrictions, mean score (SD) | 0.57 (0.70) | 0.58 (0.70) | 0.55 (0.69) | 0.58 (0.71) | 0.56 (0.68) |
| Health-related restrictions, mean score (SD) | 1.22 (0.76) | 1.30 (0.75) | 1.04 (0.77) | 1.11 (0.75) | 1.36 (0.76) |
| Social-related restrictions, mean score (SD) | 0.87 (0.83) | 0.89 (0.85) | 0.80 (0.79) | 0.76 (0.77) | 1.00 (0.88) |
| COVID-19 perceived susceptibility, n (%) | |||||
| 0–4 | 2296 (84.6) | 1409 (83.0) | 634 (87.3) | 1219 (89.4) | 824 (77.9) |
| >4 | 419 (15.4) | 288 (17.0) | 92 (12.7) | 146 (10.6) | 234 (22.1) |
| Missing | 444 | – | – | – | – |
| COVID-19 perceived severity, n (%) | |||||
| 0–4 | 1636 (60.2) | 1006 (59.3) | 431 (59.4) | 803 (58.8) | 634 (59.8) |
| >4 | 1081 (39.8) | 691 (40.7) | 295 (40.6) | 562 (41.2) | 424 (40.2) |
| Missing | 442 | – | – | – | – |
| COVID-19 perceived benefits, n (%) | |||||
| 0–4 | 747 (27.6) | 479 (28.2) | 171 (23.6) | 287 (20.9) | 363 (34.3) |
| >4 | 1963 (72.4) | 1218 (71.8) | 555 (76.4) | 1078 (79.1) | 695 (65.7) |
| Missing | 449 | – | – | – | – |
| COVID-19 perceived risks, n (%) | |||||
| 0–4 | 1460 (54.0) | 861 (50.7) | 453 (62.4) | 827 (60.7) | 487 (45.9) |
| >4 | 1245 (46.0) | 836 (49.3) | 273 (37.6) | 538 (39.3) | 571 (54.1) |
| Missing | 454 | – | – | – | – |
| Stress associated with the pandemic, mean score (SD) | 6.88 (2.40) | 7.17 (2.30) | 6.18 (2.48) | 6.01 (2.34) | 7.99 (1.98) |
| Stress associated with the public health restrictions, mean score (SD) | 5.88 (2.70) | 6.21 (2.62) | 5.15 (2.70) | 5.14 (2.58) | 6.85 (2.51) |
| Psychological characteristics | |||||
| PHQ-4, n (%) | |||||
| No/mild psychological distress | 1513 (56.8) | 850 (50.1) | 515 (71.0) | – | – |
| Moderate/severe psychological distress | 1153 (43.2) | 847 (49.9) | 211 (29.0) | – | – |
| Missing | 493 | – | – | – | – |
| PSS-4, mean score (SD) | 7.84 (3.24) | 8.25 (3.18) | 6.84 (3.15) | 6.28 (2.74) | 9.84 (2.68) |
| Pain characteristics | |||||
| Pain location, n (%) | |||||
| Generalized pain | 359 (11.8) | 210 (12.4) | 74 (10.2) | 157 (11.5) | 127 (12.1) |
| Head | 82 (2.7) | 31 (1.8) | 23 (3.2) | 34 (2.5) | 20 (1.9) |
| Upper limb and upper body | 242 (7.9) | 124 (7.4) | 62 (8.4) | 103 (7.5) | 83 (7.9) |
| Lower limb and lower body | 2379 (77.2) | 1322 (77.8) | 563 (77.6) | 1064 (78.0) | 821 (77.5) |
| Multisite | 13 (0.4) | 5 (0.3) | 2 (0.3) | 6 (0.4) | 1 (0.1) |
| Unknown/missing | 84 | 5 (0.3) | 2 (0.3) | 1 (0.1) | 6 (0.5) |
| Pain origin, n (%) | |||||
| Accident | 750 (25.1) | 441 (26.9) | 160 (22.4) | 324 (24.0) | 287 (27.4) |
| Disease | 757 (25.4) | 419 (25.0) | 203 (28.4) | 374 (27.9) | 248 (23.7) |
| Movement/trauma | 334 (11.2) | 175 (10.4) | 88 (12.3) | 150 (11.2) | 113 (10.8) |
| No precise event | 763 (25.6) | 422 (25.1) | 182 (25.5) | 343 (25.5) | 261 (24.9) |
| Other | 380 (12.7) | 213 (12.6) | 81 (11.4) | 154 (11.4) | 140 (13.2) |
| Missing | 175 | 27 | 12 | 20 | 9 |
| BPI, mean score (SD) | 43.39 (14.24) | 45.23 (13.33) | 39.06 (15.32) | 38.83 (13.74) | 49.26 (12.65) |
| Average pain intensity, mean score (SD) | 6.13 (1.84) | 6.36 (1.68) | 5.64 (2.00) | 5.76 (1.81) | 6.63 (1.69) |
| Worst pain intensity mean score (SD) | 7.65 (1.77) | 7.91 (1.51) | 7.18 (2.03) | 7.38 (1.81) | 8.09 (1.51) |
| Global quality of life, mean score (SD) | 55.66 (20.03) | 54.17 (19.78) | 58.80 (19.65) | 59.68 (19.04) | 50.80 (19.73) |
| Pain duration, n (%) | |||||
| ≤2 years | 390 (12.7) | 180 (10.5) | 111 (15.3) | 166 (12.2) | 125 (11.8) |
| 3–10 years | 1248 (40.4) | 718 (42.4) | 260 (35.8) | 517 (37.8) | 461 (43.6) |
| >10 years | 1444 (46.9) | 799 (47.1) | 355 (48.9) | 682 (50.0) | 472 (44.6) |
| Missing | 77 | – | – | – | – |
| Changes in pain status change, n (%) | |||||
| Considerably worsened | 418 (14.5) | – | – | 126 (9.2) | 232 (22.0) |
| Worsened a lot | 577 (20.0) | – | – | 220 (16.2) | 275 (26.0) |
| Somewhat worsened | 990 (34.5) | – | – | 504 (36.9) | 340 (32.1) |
| Remained unchanged | 750 (26.0) | – | – | 431 (31.5) | 183 (17.3) |
| Improved (somewhat, a lot, considerably) | 145 (5.0) | – | – | 84 (6.2) | 28 (2.6) |
| Missing | 279 | – | – | – | – |
| Changes to pharmacological treatments, n (%) | |||||
| Yes | 970 (33.9) | 707 (41.7) | 113 (15.6) | 392 (28.7) | 428 (40.5) |
| No | 1563 (54.6) | 803 (47.3) | 512 (70.5) | 792 (58.0) | 523 (49.4) |
| Not applicable | 331 (11.5) | 187 (11.0) | 101 (13.9) | 181 (13.3) | 107 (10.1) |
| Missing | 315 | – | – | – | – |
| Changes to physical/psychological treatments, n (%) | |||||
| Yes | 1685 (59.5) | 1140 (67.2) | 334 (46.0) | 821 (60.3) | 653 (61.7) |
| No | 786 (27.7) | 369 (21.7) | 272 (37.5) | 379 (27.7) | 262 (24.8) |
| Not applicable | 362 (12.8) | 188 (11.1) | 120 (16.5) | 165 (12.0) | 143 (13.5) |
| Missing | 326 | – | – | – | – |
Abbreviations: BPI, Brief Pain Inventory; PHQ-4, Patient Health Questionnaire – 4; PSS-4, Perceived Stress Scale – 4. |
|||||
Many participants reported that their pain had worsened since the beginning of the COVID-19 pandemic (68.9%). Less than 1% had a confirmed diagnosis of COVID-19. A majority (73.4%) were living in provinces with higher infection rates (>150 cases per 100 000 population). Mean (SD) levels of stress (on a 0–10 scale) associated with the pandemic itself (6.9 [2.4]) and with the lockdown (5.9 [2.7]) were however moderate. Levels of psychological distress were moderate to severe in close to half the participants (n = 1153; 43.2%). Among those who were working at the beginning of the pandemic, over one-quarter (28.3%; 276/976 employed individuals) had lost their job.
Associations between geographical variations in COVID-19 infection rates, stress appraisal and pain
Results showed that provincial infection rates (Pillai’s trace = 0.004; F(6; 5168) = 1.87; p = 0.082), urban vs. rural settings (Pillai’s trace = 0.001; F(3; 2583) = 0.48; p = 0.695) or their interaction (Pillai’s trace = 0.002; F(6; 5168) = 0.74; p = 0.621) were not associated with perceived stress (PSS-4, human and material stress associated with the pandemic) (Model 1). Provincial infection rates (Pillai’s trace = 0.024; F(6;5148) = 10.54; p < 0.001), but neither urban/rural living conditions (Pillai’s trace = 0.001; F(3; 2573) = 1.09; p = 0.352) nor their interaction (Pillai’s trace = 0.003; F(6; 5148) = 1.15; p = 0.332), were associated with pain interference (but not with average or worst pain intensity or quality of life) such that individuals from provinces with between 50 and 150 cases per 100 000 reported mean (SD) higher levels of pain interference (47.5 [12.9]) compared to those from provinces with more than 150 cases per 100 000 (42.1 [14.3]) (F(5;2593) = 15.4; p < 0.01) (Model 2).
Variables associated with pain status change and psychological distress
There were no clinically significant differences (>20% difference on total scores between the groupsFootnote 26 or in proportions across groups for categorical variables) between those who were included (n = 2423) and those who were excluded (n = 736) due to missing data, except for the number of public health restrictions. Compared to those retained in the model, individuals who were excluded were more likely to report no health restrictions (19.3% vs. 69.5%), no work restrictions (54.0% vs. 82.9%) and no social restrictions (37.9% vs. 73.4%). All individuals who reported being infected with COVID-19 (n = 24) were excluded from the regression analyses because of missing data; however, this represented only 0.8% of participants.
Due to high correlations between pain interference (BPI score) and the two pain intensity measures (average pain: r = 0.631; worst pain: r = 0.564), only the BPI score was included in the model.
Detailed results of the pain status change (Model 3) are shown in Table 2. Descriptive statistics on relevant variables as a function of pain status change are shown in Table 1. Older adults (adjusted odds ratio [aOR]: 0.49; 95% confidence interval [CI]: 0.32–0.76) and those who had lost their employment since the beginning of the pandemic (0.67; 0.48–0.94) were less likely to report worsened pain than younger adults or those still employed or not in the workforce.
| Variables | Model 3 Worsened pain |
Model 4 Moderate-severe psychological distress |
||
|---|---|---|---|---|
| Adjusted OR (95% CI) | P-value | Adjusted OR (95% CI) | P-value | |
| Time of questionnaire completion | ||||
| Weeks 1–3 (complete confinement) | Ref. | – | Ref. | – |
| Weeks 4–5 (initial lifting of restrictions) | 0.90 (0.71–1.13) | 0.361 | 1.03 (0.79–1.33) | 0.837 |
| Weeks 6–8 (additional lifting of restrictions) | 1.01 (0.78–1.31) | 0.961 | 0.96 (0.72–1.27) | 0.767 |
| Age, years | ||||
| 18–39 | Ref. | – | Ref. | – |
| 40–69 | 0.92 (0.71–1.18) | 0.487 | 0.75 (0.57–0.98) | 0.034 |
| ≥70 | 0.49 (0.32–0.76) | 0.002 | 0.54 (0.32–0.92) | 0.024 |
| Sex | ||||
| Male | Ref. | – | Ref. | – |
| Female | 1.19 (0.92–1.55) | 0.182 | 1.10 (0.80–1.50) | 0.560 |
| Civil status | ||||
| Other | Ref. | – | Ref. | – |
| Married / common law | 1.07 (0.83–1.37) | 0.626 | 0.94 (0.71–1.24) | 0.659 |
| Living condition | ||||
| Alone | Ref. | – | Ref. | – |
| Other | 0.96 (0.71–1.31) | 0.801 | 1.06 (0.75–1.48) | 0.757 |
| Education | ||||
| Less than university | Ref. | – | Ref. | – |
| University | 0.96 (0.78–1.19) | 0.721 | 0.85 (0.68–1.07) | 0.166 |
| Location | ||||
| Rural | Ref. | – | Ref. | – |
| Urban | 1.20 (0.91–1.59) | 0.205 | 1.06 (0.77–1.46) | 0.711 |
| Work status | ||||
| Other | Ref. | – | Ref. | – |
| Full-time or part-time | 1.42 (1.09–1.86) | 0.011 | 1.12 (0.83–1.52) | 0.458 |
| Permanent / temporary disability | 1.23 (0.94–1.60) | 0.132 | 1.16 (0.86–1.55) | 0.327 |
| Work status change | ||||
| No loss of employment | Ref. | – | Ref. | – |
| Loss of employment | 0.67 (0.48–0.94) | 0.019 | 1.09 (0.74–1.61) | 0.663 |
| Geographical variations in COVID-19 infection rates (per 100 000) | ||||
| 0 to <50 | Ref. | – | Ref. | – |
| 50–150 | 1.05 (0.53–2.08) | 0.887 | 0.79 (0.37–1.70) | 0.547 |
| >150 | 1.00 (0.52–1.93) | 0.991 | 0.83 (0.39–1.76) | 0.632 |
| COVID-19 perceived susceptibility | ||||
| 0–4 | Ref. | – | Ref. | – |
| >4 | 0.98 (0.73–1.31) | 0.886 | 1.17 (0.86–1.60) | 0.309 |
| COVID-19 perceived severity | ||||
| 0–4 | Ref. | – | Ref. | – |
| >4 | 0.92 (0.76–1.13) | 0.437 | 0.92 (0.74–1.15) | 0.475 |
| COVID-19 perceived benefits | ||||
| 0–4 | Ref. | – | Ref. | – |
| >4 | 1.00 (0.79–1.26) | 0.997 | 1.03 (0.80–1.32) | 0.844 |
| COVID-19 perceived risks | ||||
| 0–4 | Ref. | – | Ref. | – |
| >4 | 1.27 (1.03–1.56) | 0.022 | 0.91 (0.73–1.13) | 0.381 |
| Work-related restrictions | 0.99 (0.83–1.17) | 0.856 | 1.06 (0.88–1.27) | 0.547 |
| Health-related restrictions | 1.10 (0.96–1.27) | 0.174 | 1.08 (0.92–1.25) | 0.349 |
| Social-related restrictions | 0.98 (0.86–1.12) | 0.786 | 1.08 (0.94–1.24) | 0.275 |
| COVID-19 emotional reactionsFootnote a | 1.17 (0.99–1.38) | 0.059 | 2.14 (1.78–2.57) | <.001 |
| Stress (material needs)Footnote a | 0.93 (0.82–1.05) | 0.224 | 1.08 (0.95–1.22) | 0.268 |
| Stress (virus threat, social interactions)Footnote a | 1.21 (1.05–1.41) | 0.011 | 1.39 (1.17–1.66) | <.001 |
| PSS-4 – Perceived stress | 1.04 (1.00–1.08) | 0.046 | 1.43 (1.36–1.50) | <.001 |
| PHQ-4 | ||||
| No/mild distress | Ref. | – | – | – |
| Moderate/severe distress | 1.18 (0.92–1.52) | 0.188 | – | – |
| BPI – Pain interference | 1.02 (1.01–1.03) | <0.001 | 1.02 (1.01–1.03) | <0.001 |
| Pain duration, years | ||||
| 0–2 | Ref. | – | Ref. | – |
| 3–10 | 1.69 (1.24–2.29) | 0.001 | 1.00 (0.71–1.42) | 0.984 |
| >10 | 1.40 (1.03–1.90) | 0.033 | 0.83 (0.59–1.18) | 0.308 |
| Pain status change | ||||
| Unchanged or improved | – | – | Ref. | – |
| Worsened | – | – | 1.14 (0.88–1.47) | 0.316 |
| Changes to pharmacological treatments | ||||
| No | Ref. | – | Ref. | – |
| Yes | 3.17 (2.49–4.05) | <0.001 | 1.27 (1.00–1.62) | 0.054 |
| Changes to physical/psychological treatments | ||||
| No | Ref. | – | Ref. | – |
| Yes | 2.04 (1.62–2.58) | <0.001 | 1.04 (0.79–1.37) | 0.783 |
Abbreviations: BPI, Brief Pain Inventory; CI, confidence interval; OR, odds ratio; PHQ-4, Patient Health Questionnaire-4; PSS-4, Perceived Stress Scale-4; Ref., reference.
|
||||
Individuals who worked were more likely to report worsened pain than those who were not employed and not on disability (1.42; 1.09–1.86). Higher levels of perceived risks (but not susceptibility, severity or benefits) associated with COVID-19 (1.27; 1.03–1.56) and higher levels of stress associated with individuals’ health and safety (human stress composite score) (1.21; 1.05–1.41) were associated with greater likelihood of reporting worsened pain. Longer pain duration (3–10 years: 1.69; 1.24–2.29; >10 years: 1.40; 1.03–1.90) and changes in pharmacological treatments (3.17; 2.49–4.05) and physical/psychological treatments (2.04; 1.62–2.58) were also associated with greater likelihood of reporting worsened pain.
Based on the study analyses, one cannot rule out that some individuals may have reported improved pain status as a result of treatment change; however, only 5% of the overall sample reported this pain status.
Detailed results of psychological distress (Model 4) are shown in Table 2. Descriptive statistics on relevant variables as a function of psychological distress are shown in Table 1. Results revealed that older adults (40–69 years old: aOR = 0.75; 95% CI: 0.57–0.98; ≥70 years old: 0.54; 0.32–0.92) were less likely to report moderate/severe psychological distress than younger adults.
Higher intensity of negative emotions associated with the pandemic (aOR = 2.14; 95% CI: 1.78–2.57), higher levels of stress associated with individuals’ health and social interactions (human stress: 1.39; 1.17–1.66) and higher perceived global stress (1.43; 1.36–1.50) were associated with greater likelihood of reporting moderate/severe psychological distress.
Discussion
To our knowledge, this study is one of the first to document the effects of the COVID-19 pandemic in a large sample of individuals with chronic pain who participated in an online survey. The COVID-19 pandemic had detrimental effects on many individuals in terms of pain deterioration (70% of individuals) and psychological distress (moderate/severe distress in close to half of individuals). This is important, knowing that chronic pain is very unlikely to remit on its own and 33% of individuals on a pain clinic waitlist report suicidal ideation.Footnote 27
These statistics are consistent with those of people with other chronic diseases that show higher rates of stress, depression and anxiety than the general population during the pandemic.Footnote 28 Two important reasons for this were identified and concerned higher deaths rates following infection with the coronavirus among medically compromised populations and inaccessibility of medical services and treatments.Footnote 28 Changes in pharmacological and physical/psychological pain treatments since the onset of the pandemic had the strongest associations with pain deterioration in the present study. The rapid shift toward virtual care or alternative accessible health care and other support options is of utmost importance in such circumstances.Footnote 29
Pain status change associated with factors other than geography
Regional variations in COVID-19 infection rates, living in urban centres where transmission is more likely than in rural settings and experiencing higher numbers of public health safety measures were not associated with pain status or psychological distress. Prevalence of chronic pain is typically higher among rural or remote Canadian dwellers than urban dwellers,Footnote 30 but this does not mean that those individuals are also at higher risk of chronic pain deterioration. In Asian and European studies, geographical severity of the coronavirus outbreak has been positively associated with general psychological distress,Footnote 28 but has not been examined in relation to pain status.
Stress appraisal and management—a crucial element
Perceived stress was associated with both pain deterioration and psychological distress. Earlier studies on the COVID-19 pandemic have shown that sources of stress are numerous and include, for example, fear of COVID-19 infection, socioeconomic worries and traumatic stress responses.Footnote 31Footnote 32
In this study, stress appraisal had stronger associations with pain status and psychological distress than degree of geographical variations in COVID-19 infection. This is a clinically important finding, since minimizing the absolute number of stressors may be difficult during a pandemic; alternatively, helping individuals manage and appraise stress more optimally is achievable.Footnote 33
Counterintuitively, having lost one’s job during the pandemic was associated with lower likelihood of reporting worsened pain; however, being in the workforce at the beginning of the pandemic was associated with an increased likelihood of reporting worsened pain. While the type of employment was not measured in this study, working during the pandemic may push the boundaries of a person’s physical capacity if environmental demands (e.g. caring for children at home, adjusting to remote working) increase. Losing one’s job, if widely available national emergency financial programs can be made use of, may decrease an individual’s level of physical activity or allow for greater engagement in pain self-management.
Deteriorated pain and psychological distress were less prevalent with older age. This is consistent with a systematic review that showed younger adults were at increased risk of psychological distress during the pandemic, likely because of the financial and professional stress associated with lockdowns in addition to increased responsibilities such as childcare.Footnote 28
Magnitude of psychological distress
Psychological distress in this sample (43%) was double that of the general population during the COVID-19 pandemic.Footnote 8 Our findings showed that those who felt particularly vulnerable to the COVID-19 pandemic or express concerns about the health of others were more likely to report psychological distress. The COVID-19 pandemic puts individuals in an unpredictable situation over which they have little control, a perfect recipe for increased stress.Footnote 33 In contrast to pain status change, changes in pharmacological or physical/psychological treatments for pain did not increase the odds of reporting moderate to severe psychological distress. Some of those treatment changes may have been initiated by individuals with chronic pain to limit their risk of COVID-19 infection (e.g. by avoiding hospitals), which in turn may have led to a reduced perceived threat. For others, unwanted changes to their treatments may have led to a worsening of their psychological distress.
Strengths and limitations
The cross-sectional design of this study precluded the ability to make causal inferences. The self-selection of participants in the study through a convenience sampling strategy that included patient organizations limited generalizability of our findings to all individuals with chronic pain. However, compared to other large random surveys, our study sample was of a similar age (mean age: 49.7 compared to 46.6–48.4)Footnote 2Footnote 34Footnote 35 and had a similar percentage of workers (34.9% compared to 38–44%)Footnote 2Footnote 34; pain duration (46.9% with pain duration >10 years compared to 46–46.7%)Footnote 2Footnote 36; and pain intensity (mean 0–10 pain score: 6.1 vs. 6.3–6.9)Footnote 34Footnote 37 compared to other large random surveys.
Female participants were overrepresented in this study compared to other studies.Footnote 2Footnote 34Footnote 35Footnote 37 It is possible that such representation was in part due to the recruitment strategies that relied primarily on social media.Footnote 38Footnote 39 Nonetheless, we were able to recruit a nonnegligible number of male participants (n = 429), allowing us to consider this variable in the multivariate models.
The exclusion of individuals with missing data likely resulted in a sample that was less affected by the pandemic than those included. Moreover, patient self-report data may have been subject to recall bias and/or misclassification. These characteristics, however, allow to focus on the individuals’ perspectives and to document their lived experience, something very difficult to achieve in large epidemiological studies using medico-administrative databases.
Implications and recommendations
Given the cross-sectional nature and convenience sampling procedure used in this study, it will be important to validate study findings in other samples of individuals living with chronic pain. Study results showed deteriorated pain and psychological status during the COVID-19 pandemic in a population that already faced multiple types of physical, socioeconomic and mental health challenges. The pandemic has exacerbated all of these challenges.Footnote 40Footnote 41 Given the trajectory of chronic pain, it is likely that many individuals will not return to their pre-pandemic pain state once it is over, and rates of chronic pain may increase over time.Footnote 5 As suggested in the latest report of the Canadian Pain Task Force, tangible system responses to the COVID-19 pandemic should be implemented to improve the conditions of individuals living with chronic pain.Footnote 5 These include the identification of pain as a health care priority, supporting epidemiological research on pain (including post viral pain), facilitating the implementation of virtual stepped care for pain and mental health, facilitating access to self-management tools and creating centralized and interdisciplinary assessment, intake and care.Footnote 5
Acknowledgements
The authors would like to thank the Pain BC and the Canadian Arthritis Patient Alliance for their feedback on the study design and questionnaires, and for their recruitment efforts. MGP is a Junior 1 research scholar and AL is a Junior 2 research scholar from the Fonds de recherche du Québec – Santé (FRQS).
We also want to thank our patient partners—Camille Fauteux, Jacques Laliberté and Linda Wilhelm—for their insights and collaborations throughout the project. They were involved in the pre-test of the study questionnaires and provided their feedback on the interpretation of study results.
Dissemination
Study results have been presented at two conferences—Canadian Psychological Association and Centre de recherche du Centre hospitalier de l’Université de Montréal (CHUM). Two public webinars also took place to disseminate study results to the general public. In addition, we plan to further disseminate study results to participants and the general public through infographics, and press releases through partnering organizations.
Funding
Financial support for this study was provided by the Chronic Pain Network of the Canadian Institutes of Health Research (CIHR)’s Strategy for Patient-Oriented Research (SPOR grant SCA-145102), the Quebec Pain Research Network of the FRQS and Pain BC.
MH, GM and KS are employees of Pain BC, a charitable non-profit organization working to enhance the well-being of people living with pain. They were involved in the study design, participants’ recruitment and review of the manuscript. All other funding sources had no role in the study design, collection, analysis and interpretation of data, writing of the manuscript or decision to submit the paper for publication.
Conflict of interest
All authors declare no support from commercial entities for the submitted work. MH, GM and KS are employees of Pain BC, a charitable non-profit organization working to enhance the well-being of people living with pain; this organization receives funding from the British Columbia Ministry of Health. GM received funding from the Michael Smith Foundation for Health Research through InSearch Research Group for work unrelated to this submission.
Authors’ contributions and statement
MGP – conceptualization, data curation, formal analysis, investigation, methodology, writing – original draft and review and editing; AL – conceptualization, data curation, funding acquisition, methodology, writing – review and editing; LD – conceptualization, data curation, funding acquisition, methodology, writing – review and editing; MH – conceptualization, data curation, funding acquisition, methodology, writing – review and editing; GM – conceptualization, data curation, funding acquisition, methodology, writing – review and editing; KS – conceptualization, data curation, funding acquisition, methodology, writing – review and editing; JMT – conceptualization, data curation, funding acquisition, methodology, writing – review and editing; MD – formal analysis, writing-review and editing; AJM – conceptualization, data curation, methodology, project administration, writing – review and editing; NS – methodology, analysis, writing-review and editing; MC – conceptualization, data curation, funding acquisition, methodology, writing – review and editing.
The content and views expressed in this article are those of the authors and do not necessarily reflect those of the Government of Canada.