
Original quantitative research – A machine learning approach to predict e-cigarette use and dependence among Ontario youth

HPCDP Journal Home
Published by: The Public Health Agency of Canada
Date published: January 2022
ISSN: 2368-738X
Submit a manuscript
About HPCDP
Browse
Previous | Table of Contents | Next
Jiamin Shi, MPHAuthor reference footnote 1Author reference footnote 2; Rui Fu, MScAuthor reference footnote 2Author reference footnote 3; Hayley Hamilton, PhDAuthor reference footnote 1Author reference footnote 2; Michael Chaiton, PhDAuthor reference footnote 1Author reference footnote 2
https://doi.org/10.24095/hpcdp.42.1.04
This article has been peer reviewed.
Author references
Correspondence
Michael Chaiton, Institute for Population Mental Health Research, Centre for Addiction and Mental Health, Toronto, ON M5T 1R8; Tel: 416-535-8501; Email: Michael.Chaiton@camh.ca
Suggested citation
Shi J, Fu R, Hamilton H, Chaiton M. A machine learning approach to predict e-cigarette use and dependence among Ontario youth. Health Promot Chronic Dis Prev Can. 2022;42(1):21-28. https://doi.org/10.24095/hpcdp.42.1.04
Abstract
Introduction: We developed separate random forest algorithms to predict e-cigarette (vaping) ever use and daily use among Ontario youth, and subsequently examined predictor importance and statistical interaction.
Methods: This cross-sectional study used a representative sample of Ontario elementary and high school students in 2019 (N = 6471). Vaping frequency over the last 12 months was used to define ever-vaping and daily vaping. We considered a large set of individual characteristics as potential correlates for ever-vaping (176 variables) and daily vaping (179 variables). Using cross-validation, we developed random forest algorithms and evaluated model performance based on the C-index, a measure to assess the discriminatory ability of a model, for both outcomes. Further, the top 10 correlates were identified by relative importance score calculation and their interaction with sociodemographic characteristics.
Results: There were 2064 (31.9%) ever-vapers, and 490 (7.6%) of the respondents were daily users. The random forest algorithms for both outcomes achieved high performance, with C-index over 0.90. The top 10 correlates of daily vaping included use of caffeine, cannabis and tobacco, source and type of e-cigarette and absence in last 20 school days. Those of ever-vaping included school size, use of alcohol, cannabis and tobacco; 9 of the top 10 ever-vaping correlates demonstrated interactions with ethnicity.
Conclusion: Machine learning is a promising methodology for identifying the risks of ever-vaping and daily vaping. Furthermore, it enables the identification of important correlates and the assessment of complex intersections, which may inform future longitudinal studies to customize public health policies for targeted population subgroups.
Keywords: machine learning, vaping, smoking, Ontario, youth
Highlights
- This study applied a machine learning methodology that allowed the inclusion of a wide range of correlates in tobacco research among youth.
- The top 10 correlates of daily vaping included use of caffeine, cannabis and tobacco, source and type of e-cigarette and absence in last 20 school days. Those of ever-vaping included school size, and use of alcohol, cannabis and tobacco.
- Future longitudinal studies could verify the most important correlates of ever-vaping and daily vaping identified, potentially informing policies to prioritize strategies for issues related to substance use.
- Analysis of interactions quantified interaction strengths amongst important correlates and sociodemographic characteristics, which could be further explored by future longitudinal studies.
Introduction
Research has shown that the prevalence of vaping nicotine increased rapidly among North American youth aged 16 to 19 years from 2017 to 2018.Footnote 1 In particular, the ever-vaping percentage increased from 29.3% to 37.0%, and the percentage of vaping in the past 30 days increased from 8.4% to 14.6% among youth in Canada. Youth are also increasingly reporting symptoms of vaping dependence, defined as “the constellation of behaviors and symptoms that are distressing to the user and promote the compulsive use of vaping due to nicotine and non-nicotine factors.”Footnote 2,p.257 A prospective cohort study suggests that vaping dependence is potentially related to future tobacco use persistence and escalation among Grade 12 students in the US.Footnote 3 As of 2020, approximately 3000 hospitalizations and deaths reported by the US Centers for Disease Control and Prevention (CDC) were linked to use of vaping products.Footnote 4
Previous studies of vaping dependence, including those that used validated scales such as the PROMIS-E and the Penn State Electronic Cigarette Dependence Index, have attributed the rise of vaping dependence symptoms to older age, longer duration of use, greater vaping frequency, higher nicotine concentrations and current cigarette smoking.Footnote 5Footnote 6 However, these studies have limitations associated with traditional statistical regressions. The use of p-values to select features for model building based on statistical significance may limit insight into predictors not selected. Moreover, as vaping dependence may correlate with a wide variety of characteristics, it can be challenging for a regression model to completely capture these complex relationships. This complexity can further limit study findings with statistical issues such as multicollinearity and overfitting.
To address the aforementioned limitations, we applied a machine learning approach in this study. Machine learning—defined as “a group of data-driven analytical methods that rely on computational power to perform statistical tasks”Footnote 7,p.1317—is an emerging technique found in health research.Footnote 8Footnote 9Footnote 10Footnote 11 Compared to conventional statistical methods, machine learning may prove better able to make accurate predictions, with proper guidelines to mitigate risks of overfitting.Footnote 12 We use the machine learning definition of “predictor” throughout this paper to refer to a prediction model; it does not necessarily imply a temporal or causal relationship.
This methodology focusses on the variables that are most “important” to prediction in terms of improving the performance of the model area under the curve (AUC) of the receiver operating curve (ROC), rather than relying on estimates of variance and p-value hypothesis testing. Although there are studies that have applied machine learning methods such as classification treesFootnote 13 and random forestFootnote 14 in tobacco research, a recent scoping review suggested that these applications are rarely linked to public health impacts.Footnote 15 Thus, the aim of our study was to investigate further ever-vaping and daily vaping (as a proxy for vaping dependence) among the youth population, using machine learning methods with interpretable findings. In particular, our objectives were to develop machine learning algorithms that predict both ever-vaping and daily vaping among Ontario youth, and to perform post hoc analysis including ranking the importance of individual risk factors on both outcomes and illustrating statistical intersections to identify particularly susceptible youth subgroups.
Methods
Data and participants
This study used data from the 2019 Ontario Student Drug Use and Health Survey (OSDUHS), which included responses from 14 142 students from 992 classes in 263 elementary or secondary schools from 47 Ontario school boards.Footnote 16 The OSDUHS had a complex survey sampling design—schools were clustered within the 26 geographical strata. There were four different questionnaire types in total. We obtained a total of 6471 respondents after including only the survey types that contained the question “In the last 12 months, how often did you smoke e-cigarettes?” and excluding students who did not respond to this question. The sample used to examine daily vaping was limited to ever-vapers, including a total of 2064 respondents.
Measures
Outcome
We created binary outcome variables to represent daily vaping and ever-vaping using the same survey question. Participants who reported never having used an e-cigarette in their lifetime were “never-vapers,” while others were “ever-vapers.” Participants who vaped at least daily were classified as vaping dependent. Those who did not meet this criterion were considered to be participants without daily vaping.
Potential determinants
We regarded 179 and 176 variables capturing person-level characteristics as potentially predicting daily vaping and ever-vaping, respectivelyFootnote 16 (see the Appendix at https://osf.io/x36p8/ for full list of variables.) These variables described administrative information, demographics, school life, family life, physical health, mental health, driving behaviours, experience of having been a passenger with an intoxicated driver, vaping behaviours, substance use, perceptions and exposures, sociodemographic characteristics and other risk behaviours of substance use. We excluded any variables that were conditional on either daily vaping or ever-vaping based on survey design (i.e. questions that were conditional on having ever vaped were not included as predictors of ever-vaping). We collapsed levels of several variables to facilitate subsequent analysis. Numeric variables were scaled using z-score normalization prior to model building.
Analysis
Descriptive statistics and imputation of missing values
We summarized demographic characteristics of the respondents and prevalence of ever-vaping and daily vaping. Over 90% of the variables had missingness lower than 5% or between 5% and 10%. A variable describing different types of special education had 10% missingness. Categorical variables were either collapsed with their reference levels or available options representing uncertainty of how to respond. We imputed the missing value as the median for all numeric variables.
Random forest algorithm
Using the R version 3.6.3 package “caret,”Footnote 17 we developed a random forest algorithm—an ensemble machine learning algorithm formed by a large number of classification trees—to classify respondents of primary outcomes.Footnote 18 For instance, in the algorithm of daily vaping, each tree classified respondents either as being daily vapers or as not being daily vapers. When all the class predictions from trees were summed, the class with the majority of votes became the prediction of the random forest. This “wisdom of the crowd” approach had the potential to make the random forest a highly accurate and robust algorithm for prediction.Footnote 19
Development and validation of a random forest for daily vaping and ever-vaping
We included all the candidate predictors to train the model, excluding variables that were conditional on the outcome (i.e. we excluded questions for ever-vaping that were only asked to students who vaped). Using a ratio of 7:3, we randomly split the dataset into a training set (n = 1612 or 4680) and a test set (n = 691 or 2006) for the sample to classify daily vaping and ever-vaping. Both ever-vaping and daily vaping were imbalanced. To facilitate model training efficiency, we performed a Synthetic Minority Over-sampling Technique (SMOTE) procedure on the training data to reach two balanced samples for model training.Footnote 20 In a 10-fold cross-validation procedure during model training, the dataset was randomly partitioned into 10 equally sized subsamples. At each iteration, nine subsamples were used to train the model, while the one subsample retained was used to validate the model. The above procedure was repeated 10 times. To evaluate model performance, we reported accuracy, sensitivity, specificity and AUC regarding the classification of daily vaping and ever-vaping on the test set. We considered the average performance of the 10 iterations as overall performance of the model. AUC exceeding 0.80 represented good discriminatory ability, a common threshold for classification models.Footnote 21
Ranking of individual risk factors of daily vaping and ever-vaping
To identify the top 10 correlates of daily vaping and ever-vaping, we ranked all of the correlates based on scaled relative importance scores (0–100)—a measure calculated from total loss of accuracy due to exclusion of a correlate for every tree divided by the total number of trees.Footnote 22Footnote 23 One-way partial dependence plots of the top 10 correlates were used to understand their marginal effects on the predicted risks of daily vaping and ever-vaping, while other correlates were kept constant.Footnote 24 A partial dependence plot of one correlate illustrated probabilities of outcomes, given different values of that correlate. The higher the probability, the greater the risk of outcome observed under the influence of that correlate. These methods were applied to sociodemographic characteristics as well.
Exploration of interactions
We examined two-way interactions of the top 10 correlates identified and sociodemographic correlates that can robustly predict inequities of smoking-related outcomes.Footnote 25 Further, we explored the interaction effects of the following pairs of sociodemographic characteristics—age and sex, age and ethnicity, age and socioeconomic status (SES), sex and ethnicity, sex and SES, ethnicity and SES—using a simple feature importance ranking measure approach.Footnote 26 SES is subjectively determined by respondents based on their rating of their own SES on a ladder scaled from zero to 10.Footnote 27 Two-way partial dependence plots were used to illustrate daily vaping and ever-vaping risks on the proposed pairs with interaction strengths above a threshold of 0.1. The calculations of partial dependence probabilities were based on the variation of the two predictors, while holding other predictors constant.Footnote 28
Sensitivity analysis
We conducted two sets of sensitivity analyses using the same oversampled training set for both outcomes. First, we fitted random forest algorithms with only the top 10 correlates identified. Second, we built base multivariate logistic regression models composed of age, sex, ethnicity and SES. Performance of these logistic models was assessed by accuracy, sensitivity, specificity and AUC on the test set and compared to these measures of the random forest.
Results
Sample characteristics
The 6471 respondents were divided into 10 age groups (0 to 11, individual years between ages 12 and 19, and 20+ years); 54.6% of them were females; the majority (68.6%) came from a family positioned from 6 to 8 on the SES ladder; and 62.1% of them were White (Table 1). There were 2064 (31.9%) ever-vapers and 490 (7.6% of the entire sample or 23.7% of ever-vapers) respondents who were daily vapers.
| Characteristics | Overall (N = 6471) |
|---|---|
| Age (years) | |
| 11 or younger | 20 (0.3%) |
| 12 | 727 (11.2%) |
| 13 | 954 (14.7%) |
| 14 | 1042 (16.1%) |
| 15 | 1225 (18.9%) |
| 16 | 1100 (17.0%) |
| 17 | 981 (15.2%) |
| 18 | 386 (6.0%) |
| 19 | 27 (0.4%) |
| 20 or older | 9 (0.1%) |
| Sex | |
| Female | 3535 (54.6%) |
| Male | 2936 (45.4%) |
| Socioeconomic statusFootnote a | |
| 1 | 6 (0.1%) |
| 2 | 40 (0.6%) |
| 3 | 122 (1.9%) |
| 4 | 280 (4.3%) |
| 5 | 675 (10.4%) |
| 6 | 1061 (16.4%) |
| 7 | 1805 (27.9%) |
| 8 | 1575 (24.3%) |
| 9 | 657 (10.2%) |
| 10 | 250 (3.9%) |
| Ethnicity | |
| White | 4017 (62.1%) |
| Chinese | 374 (5.8%) |
| South Asian | 648 (10.0%) |
| Black | 563 (8.7%) |
| Indigenous | 157 (2.4%) |
| Filipino | 368 (5.7%) |
| Latin American/Central American/South American | 282 (4.4%) |
| Southeast Asian | 125 (1.9%) |
| West Asian or Arab | 344 (5.3%) |
| Korean | 56 (0.9%) |
| Japanese | 31 (0.5%) |
| Not sure about ethnicity | 256 (4.0%) |
| Ever-vaping | |
| No | 4407 (68.1%) |
| Yes | 2064 (31.9%) |
| Daily vaping | |
| No | 5981 (76.3%) |
| Yes | 490 (23.7%) |
Abbreviations: OSDUHS, Ontario Student Drug Use and Health Survey; SES, socioeconomic status.
|
|
Performance of the random forest algorithms
The random forest algorithms for both outcomes achieved high performance. The algorithm for ever-vaping had a testing accuracy of 0.82 (95% confidence interval [CI]: 0.81–0.84), sensitivity of 0.83 (0.80–0.86), specificity of 0.82 (0.80–0.84) and an AUC of 0.90. The algorithm for daily vaping had a testing accuracy of 0.83 (0.80–0.86), sensitivity of 0.85 (0.77–0.90), specificity of 0.82 (0.78–0.86) and an AUC of 0.90.
Top 10 correlates of ever-vaping and daily vaping
The algorithms demonstrated different top 10 correlates for daily vaping and ever-vaping (Figure 1). The top 10 correlates for ever-vaping were: having used cannabis in lifetime; having drunk alcohol in past 12 months; source of cannabis; having used waterpipe in lifetime; having used tobacco in lifetime; school size, having used cannabis in past 12 months; the number of drinks containing alcohol when typically drinking; having had an energy drink with alcohol in last 12 months; and having been drunk. The top 10 correlates for daily vaping were: source of e-cigarette/tried a friend’s; having smoked e-cigarettes with nicotine; having used cannabis in lifetime; source of cannabis; having smoked e-cigarettes without nicotine; having had a caffeine drink in the last 12 months; having had a caffeine drink in the last seven days; absence in the last 20 school days; source of e-cigarette/having bought e-cigarettes at a vape shop; and having used tobacco in lifetime. For both daily vaping and ever-vaping, all of the sociodemographic correlates showed minimal influence, with relative importance lower than three; thus, none of the corresponding partial dependence plots were reported.
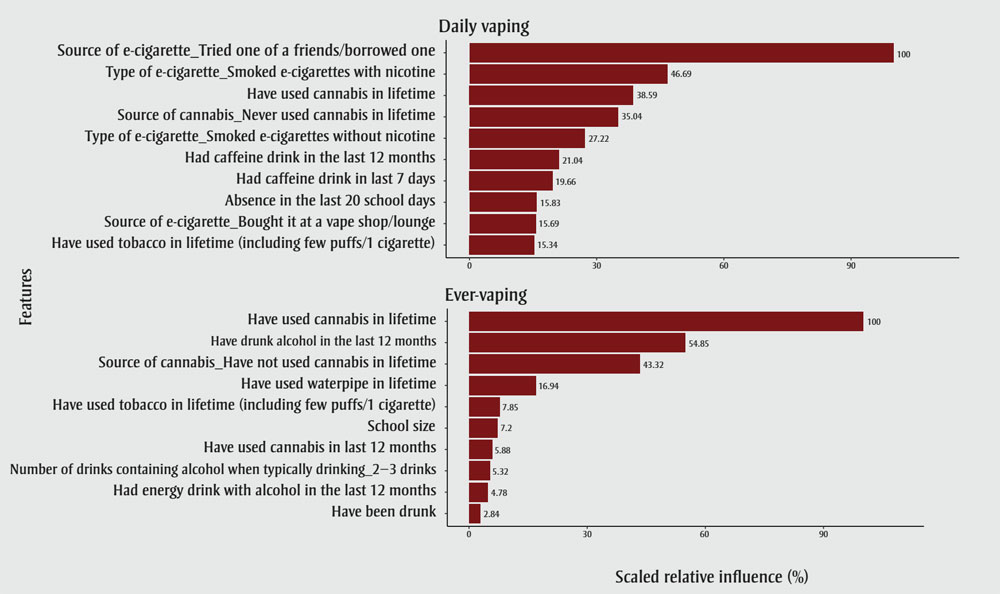
Figure 1 - Text description
| Features | Scaled relative influence (%) |
|---|---|
| Daily vaping | |
| Source of e-cigarette - Tried one of a friend/borrowed one | 100 |
| Type of e-cigarette - Smoked e-cigarettes with nicotine | 46.69 |
| Have used cannabis in lifetime | 38.59 |
| Source of cannabis - Never used cannabis in lifetime | 35.04 |
| Type of e-cigarette - Smoked e-cigarettes without nicotine | 27.22 |
| Had caffeine drink in the last 12 months | 21.04 |
| Had caffeine drink in last 7 days | 19.66 |
| Absence in the last 20 school days | 15.83 |
| Source of e-cigarette - Bought it at a vape shop/lounge | 15.69 |
| Have used tobacco in lifetime (including few puffs/1 cigarette) | 15.34 |
| Ever-vaping | |
| Have used cannabis in lifetime | 100 |
| Have drunk alcohol in the last 12 months | 54.85 |
| Source of cannabis - Have not used cannabis in lifetime | 43.32 |
| Have used waterpipe in lifetime | 16.94 |
| Have used tobacco in lifetime (including few puffs/1 cigarette) | 7.85 |
| School size | 7.2 |
| Have used cannabis in last 12 months | 5.88 |
| Number of drinks containing alcohol when typically drinking_2-3 drinks | 5.32 |
| Had energy drink with alcohol in the last 12 months | 4.78 |
| Have been drunk | 2.84 |
Abbreviations: OSDUHS, Ontario Student Drug Use and Health Survey.
Partial dependence on the top 10 predictors
According to partial dependence plots for ever-vaping, we found higher risks of ever-vaping among respondents who had used cannabis in the last 12 months or their lifetime, had drunk alcohol with or without high energy drinks in the last 12 months, had used tobacco or waterpipe in their lifetime, and had been drunk, compared to those who had not (see Appendix at https://osf.io/x36p8/). Across sources of cannabis, respondents who had ever used cannabis demonstrated a higher risk of ever-vaping than never-users. Respondents who had two to three drinks containing alcohol when they typically drank had approximately a 25% higher risk of ever-vaping than other alcohol and non-alcohol users. Risk of ever-vaping increased as school size increased in a range of up to 500 students, and remained high until the school size reached approximately 1850. There was a tiny decline in risk for schools with 1850 to 2000 students.
In regard to daily vaping, an increased risk of daily vaping was found among respondents who had used cannabis or tobacco in their lifetime or had drunk a caffeine drink in the last 12 months or seven days, compared with those who had not (see Appendix at https://osf.io/x36p8). Across sources of e-cigarette, there was a vast difference in the risk of being a daily vaper for respondents who borrowed an e-cigarette from a friend compared to those who purchased one in a retail environment. Across types of e-cigarettes, respondents who smoked e-cigarettes without nicotine had a 25% lower risk of being a daily vaper than those who did not. Never-users of cannabis showed a slightly lower risk of being a daily vaper than respondents who used cannabis across various sources. Any absence in the last 20 school days was associated with an increased risk of daily vaping; while it is possible that daily vaping could have led to more school absence, our model was not designed to demonstrate such a relationship.
Interactions
All of the top 10 correlates for ever-vaping, except for having been drunk, demonstrated interactions with ethnicity (see Appendix at https://osf.io/x36p8). Having tobacco or cannabis in lifetime and having drunk alcohol in last 12 months showed interactions with ethnicity, SES and age. Japanese ethnicity demonstrated a higher probability of ever-vaping than non-Japanese ethnicity for all school sizes, while opposite relationships were found among those of Southeast Asians and Korean ethnicity. Across all sources of cannabis, being of non-Japanese ethnicity was associated with lower probabilities of ever-vaping than being of Japanese ethnicity. Regardless of ethnic group, having two to three drinks on a typical day had the highest probability of ever-vaping, compared to other sources of alcohol. While being of Japanese ethnicity was positively associated with the probability of ever-vaping, being of Southeast Asian or Korean ethnicity was inversely associated with ever-vaping. There were smaller differences in the probability of ever-vaping between those of Japanese compared to non-Japanese ethnicity for having had cannabis or alcohol and having had alcohol combined with energy drinks in last 12 months. This relationship was also found for having had tobacco or cannabis in lifetime. Across all the SES groups, being of Southeast Asian or Korean ethnicity was associated with a slightly lower probability of ever-vaping compared to being non-Southeast Asian or non-Korean.
Age interacted with past-year alcohol use, ever use of tobacco and ever use of cannabis; in these interactions, the use of a substance was a more important predictor among younger students compared to older students. Similarly, these variables were more important predictors among higher SES students compared to lower SES students.
Weak interaction was found between caffeine consumption and ethnicity for daily vaping (see the Appendix at https://osf.io/x36p8/). The interaction strength of having had a caffeine drink in the last seven days and being uncertain of ethnicity was 0.111. Having had a caffeine drink in the last seven days was associated with a slightly higher probability of daily vaping, regardless of the uncertainty of ethnicity.
Sensitivity analysis
In line with the results of the primary analysis, high performance was found in parsimonious random forest algorithms with only the top 10 correlates. The parsimonious model of daily vaping had an accuracy of 0.81 (95% CI: 0.78–0.84), a sensitivity of 0.80 (0.72–0.86), a specificity of 0.82 (0.78–0.85) and an AUC of 0.87; the parsimonious model of ever-vaping had an accuracy of 0.78 (0.76–0.79), a sensitivity of 0.78 (0.74–0.81), a specificity of 0.78 (0.75–0.80), and an AUC of 0.86. By contrast, base logistic regressions of both outcomes had lower performance than the random forest models from the primary analysis. Specifically, the logit model of daily vaping had an accuracy of 0.53 (0.49–0.57), a sensitivity of 0.63 (0.54–0.71), a specificity of 0.50 (0.45–0.54) and an AUC of 0.60; the logit model of ever-vaping had an accuracy of 0.61 (0.59–0.64), a sensitivity of 0.82 (0.79–0.85), a specificity of 0.52 (0.49–0.55) and an AUC of 0.73.
Discussion
We applied a machine learning approach to investigate correlates of daily vaping and ever-vaping, using data from the OSDUHS conducted on a representative sample of Ontario youth attending elementary or secondary schools. The final random forest algorithms demonstrated high performance. The top 10 correlates for daily vaping differed from those for ever-vaping, as is consistent with various predictors found for cigarette onset and escalation in tobacco research.Footnote 29Footnote 30Footnote 31 While we found no interactions among pairs of predictors proposed for daily vaping, we did find interactions between predictors of ever-vaping, particularly by ethnicity.
Our study suggests the key correlates for ever-vaping and daily vaping were different. While a previous study concluded that social influences are the most powerful predictors for ever-vaping,Footnote 32 our study highlights the importance of three substances, namely cannabis, alcohol and tobacco, to risk of ever-vaping. These findings align with the emerging trend of cannabis vaping,Footnote 33 and indicate that nicotine, a highly addictive compound in tobacco, is the most common substance in vaping devices.Footnote 34 We also identified school size as an important sociodemographic correlate to the risk of ever-vaping.
Across sources of e-cigarette, since the lowest risk of daily vaping was found among respondents who tried an e-cigarette from a friend or borrowed one, social influences may play a limited role in the development of daily vaping. The use of nicotine-containing e-cigarettes was found to be associated with the highest risk of daily vaping—unsurprisingly, since addiction to vaping depends on nicotine.Footnote 35 Our results suggest that caffeine, cannabis and tobacco are important substances for increased risk of daily vaping. While the literature suggests school grade and age might be the strongest sociodemographic correlates of drug use,Footnote 36 our study shows increased number of absences in the last 20 school days might contribute more to increased risk of daily vaping.
Strengths and limitations
Methodologically, our study provides further evidence on the utility of machine learning in devising predictive modelling in tobacco control.Footnote 37 The high performance of random forests yields interpretable findings, such as identification of important features, that are potentially meaningful for policy makers. As research indicates that e-cigarette use in adolescence is associated with higher odds of smoking cigarettes,Footnote 38 features selected can identify important correlates, potentially preventing youth from proceeding to cigarette use. Days absent from school and school size, indicators not commonly found in the literature, were identified as important correlates of outcomes, because of the use of machine learning methods.
Furthermore, the high performance found in this study is in line with research that demonstrates that machine learning can outperform conventional statistical modelling on some occasions. For example, a systematic review reports that machine learning models have higher performance than logistic regression in neurosurgical outcome predictions.Footnote 39 Similarly, machine learning models exhibit higher C-indexes than clinical risk scores in prognostic performance among patients with acute gastrointestinal bleeding.Footnote 40
Regarding limitations, as our study was cross-sectional, we were only able to identify the top 10 important correlates rather than the true predictors of daily vaping or ever-vaping. Despite the robustness of random forest algorithms,Footnote 41 the relative importance of correlates did not imply causality, and we did not conduct hypothesis testing in this analysis. Future longitudinal studies with a causal design and analysis would help address this limitation. More research is also required to validate the findings about interactions, since the ethnic groups reported had relatively small sample sizes (n < 150). While our models demonstrated high performance with simple imputation of missing data, it would be worthwhile for future research to consider more sophisticated pipelines such as multiple imputation if precision of correlates is of major interest.Footnote 42
Furthermore, current tools for developing random forest algorithms are unable to incorporate a cluster sampling. However, this limitation only affects the variance of the correlates, which was not the focus of this study. Finally, our analysis has limitations that are inherent to survey studies, such as potential recall bias and response bias. Nevertheless, we expect the results to remain robust, since we believe the OSDUHS survey has been structured with instruments that optimize response quality.
Conclusion
By training and testing random forest algorithms, we identified different sets of top 10 correlates for daily vaping and ever-vaping in a Canadian youth population. We found interactions among important correlates and sociodemographic characteristics for ever-vaping. Identification of correlates for daily vaping and ever-vaping for targeting purposes may inform future longitudinal studies to improve policies designed for subpopulations, irrespective of causality.
Acknowledgements
This project was funded by the Canadian Institutes of Health Research, funding reference number MS2-17073.
Conflicts of interest
The authors have no conflicts of interest.
Authors’ contributions and statement
JS, HH and MC conceptualized the manuscript. JS led the writing, statistical analysis and data interpretation, with the guidance of RF and MC. All authors provided feedback, edited drafts and approved the final version of the manuscript.
The content and views expressed in this article are those of the authors and do not necessarily reflect those of the Government of Canada.