
Original quantitative research – Trends in gender and socioeconomic inequalities in adolescent health over 16 years (2002-2018): findings from the Canadian Health Behaviour in School-aged Children (HBSC) study

HPCDP Journal Home
Published by: The Public Health Agency of Canada
Date published: February 2022
ISSN: 2368-738X
Submit a manuscript
About HPCDP
Browse
Previous | Table of Contents | Next
Nour Hammami, PhDAuthor reference footnote 1Author reference footnote 2; Marine Azevedo Da Silva, PhDAuthor reference footnote 1; Frank J. Elgar, PhDAuthor reference footnote 1
https://doi.org/10.24095/hpcdp.42.2.03
This article has been peer reviewed.
Author references
Correspondence
Frank J. Elgar, Institute for Health and Social Policy, McGill University, 1130 Pine Avenue West, Montreal, QC H3A 1A3; Tel: 514-398-6764; Email: frank.elgar@mcgill.ca
Suggested citation
Hammami N, Da Silva MA, Elgar FJ. Trends in gender and socioeconomic inequalities in adolescent health over 16 years (2002–2018): Findings from the Canadian Health Behaviour in School-aged Children study. Health Promot Chronic Dis Prev Can. 2022;42(2):68-78. https://doi.org/10.24095/hpcdp.42.2.03
Abstract
Introduction: Monitoring health inequalities in adolescents informs policy approaches to reducing these inequalities early in the life course. The purpose of this study was to investigate trends in gender and socioeconomic inequalities in six health domains.
Methods: Data were from five quadrennial survey cycles of the Health Behaviour in School-aged Children (HBSC) study in Canada (pooled n = 94 887 participants). Differences in health between socioeconomic groups (based on material deprivation) and between genders were assessed using slope and relative indices of inequality in six health domains: daily physical activity, excess body weight, frequent physical symptoms, frequent psychological symptoms, low life satisfaction, and fair or poor self-rated health.
Results: Over a 16-year period, adolescents in Canada reported progressively worse health in four health domains, with those at the lowest socioeconomic position showing the steepest declines. Socioeconomic differences increased in excess body weight, physical symptoms, low life satisfaction, and fair or poor health. Gender differences also increased. Females showed poorer health than males in all domains except excess body weight, and gender differences increased over time in physical symptoms, psychological symptoms and low life satisfaction.
Conclusion: Socioeconomic and gender inequalities in health are persistent and widening among adolescents in Canada. Policies that address material and social factors that contribute to health disparities in adolescence are warranted.
Keywords: socioeconomic inequalities, socioeconomic position, gender, mental health, physical health, adolescents, HBSC, Canada
Highlights
- Five survey cycles of the Canadian HBSC study revealed increasing health inequalities between socioeconomic and gender groups from 2002 to 2018.
- The burden of ill health shifted towards socioeconomically disadvantaged adolescents in terms of excess body weight, physical symptoms, low life satisfaction, and fair or poor health.
- Gender inequalities also increased in physical and psychological symptoms and low life satisfaction, resembling trends in Canadian adults and in European adolescents.
- Monitoring health inequalities among adolescents informs policy approaches to reducing these gaps early in the life course.
Introduction
Social disadvantage in childhood and adolescence (i.e. income poverty, low parental education, housing instability) increases the risk of lower earnings, less education and poorer health in adulthood, perpetuating an intergenerational cycle of poverty and ill health.Footnote 1 Research has shown that individuals in lower socioeconomic positions (SEP) have poorer health.Footnote 2 Also, females are at a health disadvantage relative to males.Footnote 3 Both types of social inequalities in health—socioeconomic and gender—are socially constructed early in the life course and define health inequalities throughout life.Footnote 4 Therefore, evidence on adolescent health inequalities between socioeconomic and gender groups can be useful for predicting health inequalities in the adult population.
Using social policy to redress health inequalities requires robust evidence on their trends over time. Unfortunately, the evidence shows that little to no progress has been made in reducing health inequalities in Canada with regard to unintentional injury, chronic diseases, social conditions, well-being and health behaviours.Footnote 5Footnote 6 Similar trends were found in Europe.Footnote 7Footnote 8 Research has also found that socioeconomic differences in health (e.g. self-rated mental health and smoking) among Canadian adults have widened over time and that inequalities in health status (measured using the Health Utility Index and the Frailty Index) have increased more among females than males.Footnote 5Footnote 6
Evidence from the Health Behaviour in School-aged Children (HBSC) study suggests that Canadian adolescents have increasing socioeconomic and gender inequalities in frequent psychosomatic symptoms (i.e. two or more of the following in the past 6 months: headache, stomach ache, feeling low, irritable or bad tempered, feeling nervous, difficulty in getting to sleep and/or feeling dizzy).Footnote 9Footnote 10Footnote 11 We built upon this evidence by examining secular trends in these plus four other health domains (daily physical activity, excess body weight, life satisfaction and self-rated health) over a longer period. We chose these domains to broadly represent mental and physical health and well-being because they were consistently measured in the Canadian HBSC study and because they relate to current and future health problems.
Psychosomatic symptoms vary in severity from minor health complaints to clinical symptoms, and can develop into more serious conditions such as anxiety and depression.Footnote 12Footnote 13 Daily physical activity is associated with better physical and psychological health in terms of cardiometabolic outcomes (blood pressure, cholesterol and insulin resistance), cardiovascular fitness and quality of life.Footnote 14 Excess body weight in adolescence predicts poor social and psychological functioning and metabolic diseases in adulthood;Footnote 15 most adolescents with excess body weight continue to have excess weight in adulthood, which is associated with chronic diseases (e.g. type 2 diabetes, hypertension) and mortality.Footnote 16 Life satisfaction is positively associated with mental health in adolescenceFootnote 17Footnote 18 and reduced risk of depression and other adverse health conditions later in life.Footnote 19 Self-rated health is a subjective measure of health status with links to risk of various health conditions, school dropout, physical inactivity and poorer psychosocial functioning and work integration.Footnote 20
Previous research found that adolescents at lower SEP (compared to those at higher SEP) and female adolescents (compared to males) reported less physical activity,Footnote 21 higher body weight,Footnote 22 poorer self-rated health,Footnote 3 lower life satisfactionFootnote 23 and a greater number of physical and psychological health complaints.Footnote 9Footnote 11Footnote 24 International research using HBSC data has revealed significant heterogeneity in these trends across countries and health outcomes and few common trends.Footnote 25Footnote 26 Therefore, our analyses focused on trends in health inequalities between SEP and gender among Canadian adolescents. Given that adolescent health is positively associated with SEP and that socioeconomic differences in health may have widened due to increasing economic inequality,Footnote 5Footnote 9Footnote 11 we hypothesized that socioeconomic differences in all health domains grew from 2002 to 2018. We also hypothesized, based on previous findings, that gender inequalities in health also widened, with female adolescents reporting progressively worse health than their male counterparts.Footnote 10Footnote 27
Methods
Sample
The HBSC study is a cross-national school-based survey that is carried out in Canada and Europe every four years under the auspices of the World Health Organization.Footnote 28 It aims to understand associations between adolescents’ health and health behaviours with social contextual factors. The questionnaire is completed during school hours in classroom settings. Additional details about the HBSC study and design are available elsewhere online.Footnote 29Footnote 30
We used Canadian HBSC data from five quadrennial survey cycles from 2001/02 to 2017/18. These data were collected from nationally representative samples of 11- to 15-year-olds using random, two-stage cluster sample of schools.Footnote 30 The survey used both active and passive consent approaches depending on school board requirements, and student participation rates were from 74% to 77%.
Ethics approval was granted by the General Research Ethics Board of Queen’s University (#601236) and either the Public Health Agency of Canada or Health Canada.
Characteristics of the sample are summarized in Table 1. The increase in sample sizes from 2010 onwards was due to oversampling in some provinces and territories.
| Characteristic | Weighted percent per survey cycle, % | Total count, n | χ2 | p value | |||||
|---|---|---|---|---|---|---|---|---|---|
| 2002 (n = 7235) |
2006 (n = 9717) |
2010 (n = 26 078) |
2014 (n = 30 107) |
2018 (n = 21 750) |
Total | ||||
| Total sample | 20.0 | 20.0 | 20.0 | 20.0 | 20.0 | 100.0 | 94 887 | N/A | N/A |
| Gender | |||||||||
| Female | 53.4 | 52.9 | 50.8 | 50.9 | 52.5 | 52.1 | 48 199 | 42.3 | 0.163 |
| Male | 46.6 | 47.1 | 49.2 | 49.1 | 47.5 | 47.9 | 45 971 | ||
| Total | 100 | 100 | 100 | 100 | 100 | 100 | 94 170 | ||
| Family structure | |||||||||
| Two-parent family | 84.9 | 78.9 | 77.7 | 78.0 | 81.3 | 80.2 | 70 725 | 623.6 | <0.001 |
| One-parent family | 13.8 | 18.2 | 18.7 | 17.6 | 16.3 | 16.9 | 16 641 | ||
| Other | 1.2 | 2.8 | 3.6 | 4.4 | 2.3 | 2.9 | 3634 | ||
| Total | 100 | 100 | 100 | 100 | 100 | 100 | 91 000 | ||
| Daily physical activity | |||||||||
| No | 77.7 | 76.8 | 77.2 | 76.0 | 75.0 | 76.6 | 71 189 | 46.5 | 0.029 |
| Yes | 22.3 | 23.2 | 22.8 | 24.0 | 25.0 | 23.4 | 21 693 | ||
| Total | 100 | 100 | 100 | 100 | 100 | 100 | 92 882 | ||
| Excess body weight | |||||||||
| Normal | 80.3 | 78.6 | 78.6 | 75.0 | 77.0 | 77.9 | 47 881 | 121.3 | <0.001 |
| High | 19.7 | 21.4 | 21.4 | 25.0 | 23.0 | 22.1 | 15 092 | ||
| Total | 100 | 100 | 100 | 100 | 100 | 100 | 62 973 | ||
| Two or more physical symptoms | |||||||||
| No | 75.6 | 72.5 | 73.2 | 74.0 | 74.6 | 74.0 | 69 504 | 59.2 | 0.002 |
| Yes | 24.4 | 27.5 | 26.8 | 26.0 | 25.4 | 26.0 | 25 383 | ||
| Total | 100 | 100 | 100 | 100 | 100 | 100 | 94 887 | ||
| Two or more psychological symptoms | |||||||||
| No | 61.9 | 57.8 | 58.7 | 59.1 | 57.3 | 58.9 | 55 467 | 100.5 | <0.001 |
| Yes | 38.1 | 42.2 | 41.3 | 40.9 | 42.7 | 41.1 | 39 420 | ||
| Total | 100 | 100 | 100 | 100 | 100 | 100 | 94 887 | ||
| Low life satisfaction | |||||||||
| No | 85.7 | 85.1 | 83.1 | 82.9 | 82.1 | 83.8 | 75 654 | 125.0 | <0.001 |
| Yes | 14.3 | 14.9 | 16.9 | 17.1 | 17.9 | 16.2 | 15 838 | ||
| Total | 100 | 100 | 100 | 100 | 100 | 100 | 91 492 | ||
| Low self-rated health (fair or poor) | |||||||||
| No | 87.1 | 84.1 | 83.8 | 82.9 | 82.9 | 84.2 | 76 843 | 161.4 | <0.001 |
| Yes | 12.9 | 15.9 | 16.2 | 17.1 | 17.1 | 15.8 | 15 805 | ||
| Total | 100 | 100 | 100 | 100 | 100 | 100 | 92 648 | ||
| Socioeconomic position | |||||||||
| Mean (SD) | 0.5 (0.29) | 0.5 (0.29) | 0.5 (0.29) | 0.5 (0.29) | 0.5 (0.31) | 0.5 (0.30) | 89 290 | N/A | N/A |
Abbreviations: N/A, not applicable; SD, standard deviation. |
|||||||||
Physical and mental health measures (dependent variables)
Daily physical activity was measured with the question “Over the past 7 days, on how many days were you physically active for a total of at least 60 minutes per day?” with responses from 0 to 7. Adolescents who spent 60 minutes engaging in physical activity, every day, over the past 7 days were considered physically active as per the Canadian 24-Hour Movement Guidelines for Children and Youth: An Integration of Physical Activity, Sedentary Behaviour, and Sleep.Footnote 31
Standardized body mass indices (BMI) were calculated from self-reported weight and height and converted to body mass index Z (zBMI) scores that represented deviations from age- and gender-adjusted international norms according to World Health Organization child growth standards.Footnote 32 We determined excess body weight (overweight or obesity) based on zBMI values above 1. Adolescents with a zBMI below −2 (7.5% of the sample) or who had missing weight or height (26.1% of the sample) were omitted from the weight status analyses as these categories represent health risks other than excess body weight.Footnote 33Footnote 34Footnote 35 The proportion of missing weight and height in these data are consistent with findings from a review on missing weight, height and BMI information among adolescents.Footnote 36
Physical symptoms and psychological symptoms
Participants were asked to identify symptoms by responding to the question, “In the last 6 months, how often have you had the following [headache; stomach ache; backache; feeling low (depressed); irritability or bad temper; feeling nervous; difficulties in getting to sleep; feeling dizzy]?” The response options were “about every day,” “more than once a week,” “about every week,” “about every month” or “rarely or never.” The HBSC symptom checklist has proven to be a valid measure of adolescents’ health complaints, with a test-retest reliability of 0.79.Footnote 37
In line with previous HBSC reporting, adolescents who reported two or more physical symptoms (headache; stomach ache; backache; feeling dizzy) more than once a week in the last 6 months were considered to have frequent physical symptoms.Footnote 28 Those who reported two or more psychological symptoms (feeling low; feeling irritable; feeling nervous; difficulties in getting to sleep) more than once a week in the last 6 months were considered to have frequent psychological symptoms.Footnote 28
Life satisfaction
Life satisfaction was measured using Cantril’s analog scale,Footnote 38 with adolescents shown an image of a ladder and asked, “In general, where on the ladder do you feel you stand at the moment?” The scale runs from 0 (worst possible life) to 10 (best possible life).Footnote 38 The measure has been found to be a valid measure of life satisfaction among adults and adolescents.Footnote 17 Adolescents who reported a score of 5 or less were considered to have low life satisfaction.Footnote 28
Self-rated health
Self-rated health was measured using the question “Would you say your health is: excellent, good, fair, or poor?” This measure is a stable construct over time, and the score is low when well-being is low.Footnote 39 We used fair or poor health as a dichotomous measure of self-rated health.
Socioeconomic position and gender measures (independent variables)
SEP was estimated using the HBSC Family Affluence Scale, a multi-item measure of material assets (number of cars, having own bedroom, number of computers, number of bathrooms, family holidays in the past year, and having a dishwasher).Footnote 40 The number of items increased from four to six in 2014 with the addition of number of bathrooms in the home and ownership of a dishwasher to the list in the measure. The total score was harmonized in the form of a reversed proportional rank (ridit score) of material deprivation, which yields a continuous score from 0 (least deprived or highest SEP) to 1 (most deprived or lowest SEP).Footnote 41 This transformation supported the use of a slope index of inequality (SII), which represented the rate difference in health between highest and lowest SEP (or between males and females).Footnote 42 Sample weights were applied to the transformation to support an accurate interpretation of the distribution of SEP, which had a mean of 0.5 points and a theoretical range of 1 point.
Gender was assessed using the question “Are you male or female?” with the answer options “male” or “female.”
Statistical analyses
Summary statistics for the sample consisted of frequencies, counts and chi-square tests for categorical variables and mean and standard deviation (SD) estimates for continuous variables, across each of the survey cycles. We also assessed the prevalence of the health outcomes at each survey cycle by gender. For each variable and survey cycle, we used logistic regressions to estimate rate differences in health between highest and lowest SEP and between gender groups, while controlling for age and family structure (coded as two-parent family, one-parent family or other), and then multiplied this value by 100 to represent the predicted rate difference per 100 cases.
We tested interactions of SEP and gender across each survey cycle to assess trends in health inequality over time and graphed predicted values of the health measures at the lowest, mean and highest SEP across the survey cycles and for males and females across the survey cycles. All analyses used standardized weights and accounted for the sampling design effect of school clusters using the svy toolkit in STATA statistical software version 16.0 (StataCorp LP, College Station, TX, US). Data weights were applied, first within provincial or territorial samples to ensure balanced representations of regions and school types (e.g. public vs. Catholic school boards), then nationally to ensure that representation of the Canadian population was balanced. We also applied poststratification weights to equalize the importance of each survey cycle to the analysis. The level of significance was set at p < 0.05.
Results
Females and males participated equally in the survey (52.1% vs. 47.9%), and the mean (SD) age was 14.0 (1.4) years (see Table 1 for a summary of the characteristics of Canadian participants in the HBSC study from 2002 to 2018). More adolescents reported living in a two-parent family (80.2%) than a one-parent family (16.9%) or other arrangement (2.9%). Three-quarters (76.6%) of adolescents reported no daily physical activity, 22.1% had excess body weight, 26.0% reported physical complaints, 41.1% reported psychological complaints, 16.2% reported low life satisfaction and 15.8% reported low self-rated health (Table 1).
Relative to males, females reported worse health in all of the six health domains measured in the HBSC except excess body weight, which was more prevalent among males (see Figure 1). Gender gaps in trends in health were mostly consistent over time, although differences in physical and psychological symptoms and low life satisfaction widened in later survey cycles.

Figure 1 - Text description
| Characteristic | Health Domain | |||||
|---|---|---|---|---|---|---|
| Daily physical activity | Excess body weight | Two or more physical symptoms | Two or more psychological symptoms | Low life satisfaction | Low self-rated health | |
| 2002 | ||||||
| Males | 26.9% (25.0 - 28.8) |
23.1% (21.0 - 25.2) |
20.6% (19.0 - 22.3) |
36.3% (34.2 - 38.3) |
12.2% (11.0 - 13.5) |
12.8% (11.6 - 14.0) |
| Females | 17.0% (15.5 - 18.5) |
16.3% (14.5 - 18.1) |
30.1% (28.3 - 31.9) |
42.2% (40.2 - 44.1) |
17.2% (15.7 - 18.6) |
15.7% (14.4 - 17.1) |
| 2006 | ||||||
| Males | 30.6% (29.2 - 32.0) |
25.7% (24.2 - 27.2) |
20.3% (19.1 - 21.5) |
35.7% (34.3 - 37.2) |
12.3% (11.4 - 13.2) |
13.0% (12.1 - 14.0) |
| Females | 16.9% (15.8 - 17.9) |
17.4% (16.2 - 18.7) |
32.8% (31.5 - 34.1) |
47.1% (45.7 - 48.5) |
17.4% (16.4 - 18.5) |
17.6% (16.5 - 18.6) |
| 2010 | ||||||
| Males | 28.5% (27.3 - 29.6) |
24.7% (23.5 - 26.0) |
20.1% (19.1 - 21.0) |
34.8% (33.6 - 36.0) |
14.0% (13.2 - 14.8) |
14.2% (13.3 - 15.0) |
| Females | 17.5% (16.6 - 18.4) |
17.7% (16.5 - 18.8) |
32.9% (31.7 - 34.0) |
47.7% (46.5 - 49.0) |
18.6% (17.7 - 19.6) |
16.9% (16.0 - 17.8) |
| 2014 | ||||||
| Males | 30.8% (29.5 - 32.0) |
28.4% (27.0 - 29.8) |
18.6% (17.6 - 19.6) |
31.7% (30.5 - 32.9) |
12.6% (11.8 - 13.4) |
14.9% (14.0 - 15.7) |
| Females | 17.5% (16.5 - 18.4) |
21.1% (19.9 - 22.4) |
32.9% (31.8 - 34.1) |
50.1% (48.8 - 51.3) |
20.3% (19.3 - 21.4) |
17.7% (16.8 - 18.7) |
| 2018 | ||||||
| Males | 31.2% (29.7 - 32.6) |
25.6% (24.0 - 27.3) |
17.9% (16.8 - 19.0) |
34.7% (33.3 - 36.2) |
12.2% (11.3 - 13.1) |
14.8% (13.8 - 15.9) |
| Females | 18.2% (17.1 - 19.3) |
20.2% (18.8 - 21.7) |
33.7% (32.3 - 35.1) |
52.8% (51.3 - 54.3) |
21.7% (20.5 - 22.8) |
18.3% (17.2 - 19.4) |
Notes: The lines represent linear trends over
time.
Prevalence estimates were weighted and adjusted for age,
socioeconomic position and family structure (two parent, one parent or other).
Asterisks indicate a significantly larger gender
difference in that survey cycle compared to 2002.
Relative to males in 2002, females reported higher prevalence of two or more physical symptoms and two or more psychological symptoms at each survey year, with this relative prevalence increasing over time (see Table 2). In 2018, females relative to their male counterparts in 2002 were less active by 3.06%. Also, 6.32% more females reported physical symptoms, 12.17% more females reported psychological symptoms and 4.53% more females reported low life satisfaction. More females also reported low life satisfaction, relative to their male counterparts in 2002, in 2014 (2.82%) and 2018 (4.53%), with the gender gap also widening for this health domain. Relative to their male counterparts in 2002, fewer females reported meeting daily physical activity in 2006 (3.88%), 2014 (3.40%) and 2018 (3.06%). The prevalence of excess body weight and low self-rated health did not significantly differ between gender groups.
| Survey cycle | % (95% CI) | |||||
|---|---|---|---|---|---|---|
| Daily physical activity | Excess body weight | Two or more physical symptoms | Two or more psychological symptoms | Low life satisfaction | Low self-rated health | |
| 2002 (Ref.) × Male (Ref.) | Ref. | Ref. | Ref. | Ref. | Ref. | Ref. |
| 2006 | −3.88Footnote * (−6.85, −0.91) |
−1.49 (−4.84, 1.87) |
3.07Footnote * (0.03, 6.10) |
5.45Footnote ** (1.99, 8.92) |
0.13 (−2.22, 2.49) |
1.60 (−0.67, 3.87) |
| 2010 | −1.09 (−3.91, 1.73) |
−0.25 (−3.47, 2.96) |
3.34Footnote * (0.46, 6.22) |
7.03Footnote *** (3.74, 10.31) |
−0.35 (−2.64, 1.94) |
−0.24 (−2.39, 1.90) |
| 2014 | −3.40Footnote * (−6.21, −0.53) |
−0.44 (−3.75, 2.87) |
4.89Footnote ** (2.00, 7.78) |
12.42Footnote *** (9.11, 15.74) |
2.82Footnote * (0.51, 5.14) |
−0.07 (−2.24, 2.11) |
| 2018 | −3.06Footnote * (−6.08, 0.00) |
1.44 (−2.08, 4.95) |
6.32Footnote *** (3.29, 9.34) |
12.17Footnote *** (8.68, 15.65) |
4.53Footnote *** (2.10, 6.96) |
0.55 (−1.77, 2.87) |
| Linear trend | −0.01 (−0.01, 0.00) |
0.00 (0.00, 0.01) |
0.01Footnote *** (0.01, 0.02) |
0.03Footnote *** (0.02, 0.04) |
0.03Footnote ** (0.01, 0.05) |
0.00 (−0.01, 0.00) |
| Number of observations | 85 821 | 58 298 | 87 241 | 87 241 | 85 266 | 86 155 |
Abbreviations: CI, confidence interval; Ref., reference.
|
||||||
Figure 2 shows the prevalence estimates of the six health domains across the range of SEP. Significant differences were found in five health domains, with adolescents at the highest SEP having higher odds than their peers at the lowest SEP of daily physical activity and lower odds of excess body weight, psychological symptoms, low life satisfaction, and fair or poor health. The prevalence of physical symptoms did not differ between socioeconomic groups. In addition, health inequalities widened between the lowest and highest SEP groups in four domains: excess body weight, physical symptoms, low life satisfaction, and fair or poor health. In Figure 2, these trends are reflected as a fanning out of prevalence estimates over time.
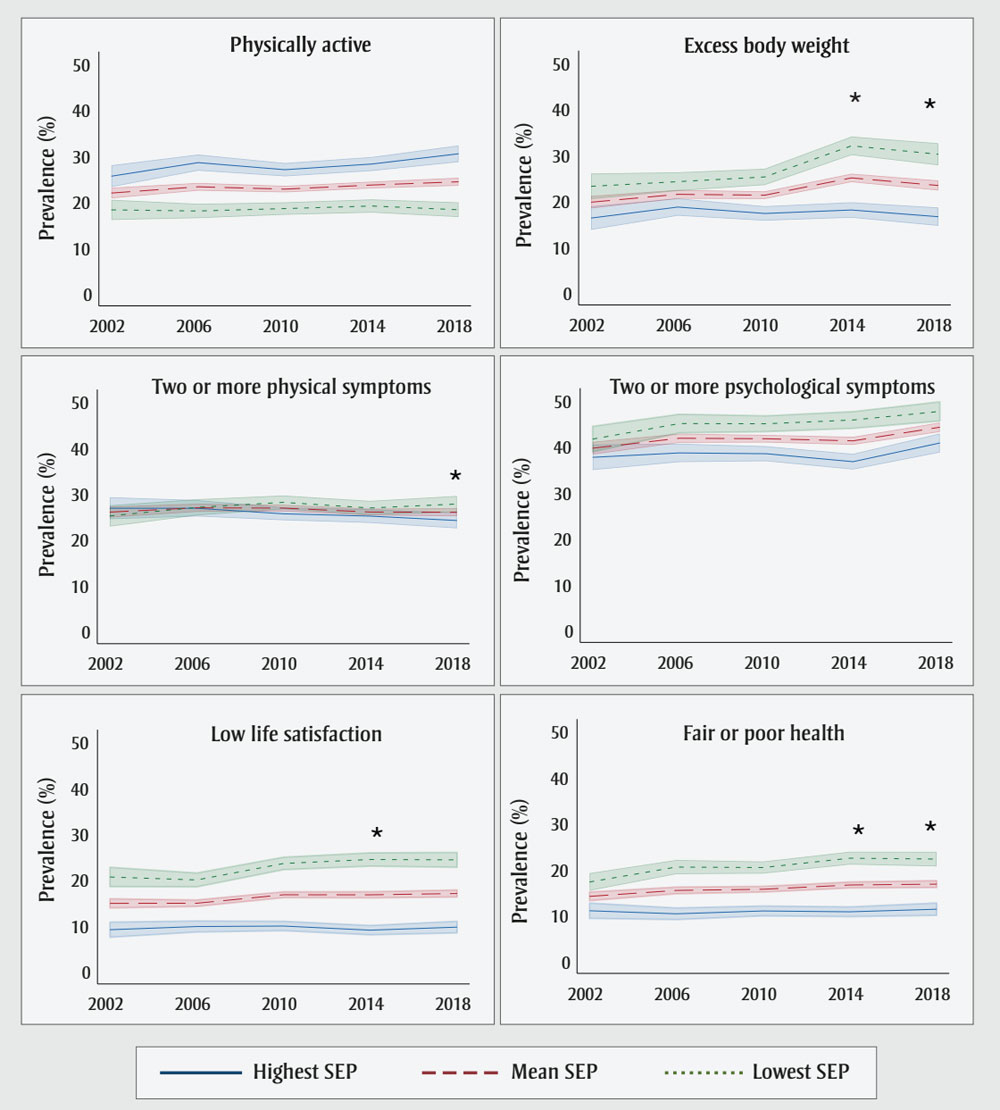
Figure 2 - Text description
| Characteristic | Health Domain | |||||
|---|---|---|---|---|---|---|
| Daily physical activity | Excess body weight | Two or more physical symptoms | Two or more psychological symptoms | Low life satisfaction | Low self-rated health | |
| 2002 | ||||||
| Lowest SEP | 25.6% (23.2 - 27.9) |
16.2% (13.7 - 18.8) |
26.8% (24.4 - 29.2) |
37.6% (34.8 - 40.4) |
9.1% (7.5 - 10.8) |
11.0% (9.3 - 12.6) |
| Mean SEP | 21.9% (20.7 - 23.1) |
19.7% (18.3 - 21.1) |
26.0% (24.8 - 27.2) |
39.6% (38.2 - 41.0) |
14.9% (13.9 - 15.9) |
14.1% (13.1 - 15.0) |
| Highest SEP | 18.2% (16.0 - 20.4) |
23.1% (20.3 - 25.9) |
25.1% (22.8 - 27.5) |
41.6% (38.8 - 44.3) |
20.6% (18.5 - 22.7) |
17.2% (15.3 - 19.2) |
| 2006 | ||||||
| Lowest SEP | 28.5% (26.7 - 30.3) |
18.6% (16.7 - 20.5) |
26.8% (25.0 - 28.6) |
38.6% (36.6 - 40.6) |
9.8% (8.6 - 11.0) |
10.3% (9.0 - 11.6) |
| Mean SEP | 23.2% (22.4 - 24.1) |
21.4% (20.4 - 22.4) |
26.9% (26.0 - 27.8) |
41.8% (40.8 - 42.8) |
14.9% (14.2 - 15.6) |
15.4% (14.7 - 16.1) |
| Highest SEP | 18.0% (16.4 - 19.6) |
24.2% (22.1 - 26.2) |
27.0% (25.2 - 28.8) |
45.0% (42.9 - 47.0) |
20.0% (18.5 - 21.5) |
20.5% (18.9 - 22.0) |
| 2010 | ||||||
| Lowest SEP | 27.0% (25.5 - 28.4) |
17.2% (15.7 - 18.8) |
25.6% (24.2 - 27.0) |
38.4% (36.7 - 40.0) |
9.9% (8.9 - 11.0) |
10.9% (9.8 - 12.0) |
| Mean SEP | 22.7% (22.0 - 23.5) |
21.2% (20.4 - 22.1) |
26.9% (26.1 - 27.6) |
41.6% (40.8 - 42.5) |
16.7% (16.1 - 17.4) |
15.6% (15.0 - 16.3) |
| Highest SEP | 18.5% (17.2 - 19.9) |
25.2% (23.4 - 27.0) |
28.1% (26.6 - 29.6) |
44.9% (43.2 - 46.6) |
23.6% (22.2 - 24.9) |
20.4% (19.0 - 21.7) |
| 2014 | ||||||
| Lowest SEP | 28.2% (26.7 - 29.7) |
18.0% (16.3 - 19.7) |
25.1% (23.6 - 26.6) |
36.7% (34.9 - 38.4) |
9.04% (8.0 - 10.1) |
10.7% (9.7 - 11.8) |
| Mean SEP | 23.6% (22.9 - 24.4) |
25.0% (24.0 - 25.9) |
26.0% (25.2 - 26.8) |
41.2% (40.3 - 42.1) |
16.7% (16.1 - 17.4) |
16.6% (15.9 - 17.2) |
| Highest SEP | 19.1% (17.6 - 20.5) |
32.0% (29.9 - 34.0) |
26.9% (25.3 - 28.4) |
45.7% (43.9 - 47.6) |
24.4% (23.0 - 25.9) |
22.4% (21.0 - 23.8) |
| 2018 | ||||||
| Lowest SEP | 30.4% (28.6 - 32.3) |
16.5% (14.5 - 18.5) |
24.2% (22.4 - 25.9) |
40.7% (38.6 - 42.8) |
9.70% (8.4 - 11.0) |
11.3% (10.0 - 12.6) |
| Mean SEP | 24.3% (23.5 - 25.2) |
23.3% (22.2 - 24.4) |
25.9% (25.1 - 26.8) |
44.2% (43.1 - 45.2) |
17.0% (16.2 - 17.8) |
16.8% (16.0 - 17.5) |
| Highest SEP | 18.3% (16.6 - 19.9) |
30.1% (27.7 - 32.5) |
27.7% (26.0 - 29.5) |
47.6% (45.5 - 49.7) |
24.3% (22.7 - 26.0) |
22.2% (20.6 - 23.8) |
Abbreviation: SEP, socioeconomic position.
Notes: The lines represent linear trends over
time.
Prevalence estimates were weighted and adjusted for age, gender and family structure (two parent, one parent or other). Asterisks indicate significantly larger socioeconomic difference in that survey cycle compared to 2002.
Relative to adolescents at the highest SEP in 2002, their counterparts at the lowest SEP had higher prevalence of excess body weight in 2014 and 2018; two or more physical symptoms in 2018; low life satisfaction in 2014; and low self-rated health in 2014 and 2018 (Table 3). Adolescents at the lowest SEP in the most recent survey cycles (2014 and 2018) show that the SEP gap widened in three health domains over time. This indicates that gaps in social inequalities become apparent slowly over time. The prevalence of daily physical activity and psychological symptoms did not significantly differ across SEP.
| Survey cycle | Rate (95% CI) | |||||
|---|---|---|---|---|---|---|
| Daily physical activity | Excess body weight | Two or more physical symptoms | Two or more psychological symptoms | Low life satisfaction | Low self-rated health | |
| 2002(Ref.) × Highest SEP | Ref. | Ref. | Ref. | Ref. | Ref. | Ref. |
| 2006 | −3.19 (−8.07, 1.68) |
−1.38 (−7.12, 4.36) |
1.87 (−3.23, 6.97) |
2.42 (−3.53, 8.36) |
−1.33 (−5.30, 2.63) |
3.91 (0, 7.82) |
| 2010 | −1.12 (−5.75, 3.51) |
1.04 (−4.44, 6.51) |
4.17 (−0.62, 8.95) |
2.55 (−3.07, 8.18) |
2.15 (−1.65, 5.94) |
3.19 (−0.52, 6.89) |
| 2014 | −1.80 (−6.50, 2.90) |
7.06Footnote * (1.43, 12.69) |
3.45 (−1.38, 8.30) |
5.10 (−0.60, 10.80) |
3.90* (0.071, 7.74) |
5.41Footnote ** (1.69, 9.13) |
| 2018 | −4.85 (−9.77, 0.71) |
6.67Footnote * (0.67, 12.67) |
5.27Footnote * (0.20, 10.33) |
2.90 (−3.10, 8.92) |
3.16 (−0.89, 7.21) |
4.65Footnote * (0.67, 8.62) |
| Linear trend | −0.01 (−0.02, 0.00) |
0.02Footnote ** (0.01, 0.04) |
0.01Footnote * (0.00, 0.02) |
0.01 (0.00, 0.02) |
0.01Footnote * (0.00, 0.02) |
0.01Footnote * (0.00, 0.02) |
| Number of observations | 85 821 | 59 298 | 87 241 | 87 241 | 85 266 | 86 155 |
Abbreviations: CI, confidence interval; Ref., reference; SEP, socioeconomic position.
|
||||||
Discussion
Socioeconomic and gender inequalities in health among children and adolescents track into adulthood yet remain a neglected area in health policy.Footnote 4 Our analysis of data from the Canadian HBSC study examined health inequalities over 16 years across six consistently measured health domains in nationally representative samples of adolescents. We found that health inequalities in socioeconomic and gender groups either increased or remained stable in multiple health domains. Specifically, females and adolescents at lower SEP experienced worse health indicators at several survey cycles, relative to male and more affluent counterparts, respectively. These trends point to the potential for persisting or worsening health inequalities in the adult population in the future.
These trends had been previously established for overall health among adults in Canada,Footnote 8 for psychological symptoms among adolescents in CanadaFootnote 10 and, recently, for mental health among adolescents across over 70 countries.Footnote 28Footnote 43Footnote 44 Our study added to the literature with the observation that gender differences and inequalities were widening over time among Canadian adolescents in terms of daily physical activity, physical and psychological symptoms, and low life satisfaction. The increase in psychological symptoms among females is thought to stem from earlier physical maturation, greater stress and greater social pressures perceived by females.Footnote 45Footnote 46
We found that socioeconomic inequalities had increased in excess body weight, physical symptoms, low life satisfaction and poor/fair self-rated health among adolescents in Canada. International reports on adolescent and adult health have also shown that socioeconomic inequalities are associated with worsening and widening socioeconomic gaps in overall healthFootnote 5Footnote 6Footnote 7Footnote 26 and mental health or psychological symptoms.Footnote 8Footnote 10Footnote 47 Evidence suggests that stress, health behaviours and psychosocial factors drive these social patterns, in part. The social cause theory of health disparities argues that social inequalities in health are the result of social conditions.Footnote 48Footnote 49 For instance, in their editorial, Link and PhelanFootnote 48 proposed that low SEP influences multiple disease outcomes through numerous risk factors as well as by limiting access to health care.Footnote 48
These health differences among adolescents are a concern for population health, policy and practice. There is strong evidence to support strategic investments in programs that identify the unique social challenges and stressors experienced by adolescent girls. Programs that promote gender equity among adolescents can help reduce gender disparity in health, especially when they leverage multisectoral initiatives and community partnerships.Footnote 50Footnote 51
We also support interventions similar to universal basic income (i.e. regular, unconditional payments made to individuals or households) as new evidence shows their positive effects on health.Footnote 52 Interventions that address the social, economic and physical environments using a cross-sectoral approach are working for adults,Footnote 53 but more evidence is needed on effective population-level interventions that address socioeconomic inequalities among adolescents.Footnote 54
Strengths and limitations
Strengths of this study include a large representative sample from across Canada. Rather than using subjective measures of perceived wealth, as done in previous studies,Footnote 11 we used an objective measure of material assets in the home and standardized the scores across survey years.Footnote 41Footnote 42 We used a wide array of physical and mental health measures, which nevertheless all pointed to the same conclusion: that there are gender and socioeconomic inequalities in health, and some are widening over time. Our use of the slope index of health inequality (SII) to measure SEP is important because it takes into consideration increasing affluence (i.e. inflation) over the survey cycles and because the index highlights differences in health between the highest and lowest SEP groups.Footnote 41
Interpretations of these findings should take into account the limitations of this study. First, we used subjective, self-report measures of health. This is a valid approach for many health domains, including height and weight (used for zBMI estimates).Footnote 55 However, there was a large percentage of missing zBMI and, as a result, we recommend caution when interpreting inequalities in excess body weight.
Second, although these results are representative of adolescents in Canada, the global generalizability of the findings is limited because this report used a probability sample of Canadian adolescents. Third, the repeated, cross-sectional design did not allow for the investigation of early-life experiences that may influence health.
Fourth, gender was measured using a binary variable (female versus male) from 2002 to 2010, which may have miscategorized individuals who identify as nonbinary. The HBSC study added a third option for gender (answer option: “neither describes me”) in 2018.Footnote 56
Fifth, the Family Affluence Scale collects data that are granular and less sensitive to socioeconomic differences among more affluent adolescents and therefore may produce estimates of health inequality that differ from those measured using household income, parental occupation or other SEP indicators.Footnote 41
Lastly, we did not include race/ethnicity in our analyses as this characteristic was unavailable for the 2006 survey cycle and it was inconsistently measured in the other survey cycles. This is a limitation as there are systematic inequalities in health associated with race/ethnicity that are interconnected with SEP.Footnote 57
Conclusion
There are persistent and widening health inequalities across SEP and gender among adolescents in Canada. Adolescent females reported more physical and psychological symptoms as well as lower life satisfaction and lower daily physical activity, relative to their male counterparts. Adolescents at the lowest SEP were most likely to experience excess body weight, frequent physical and psychological symptoms, low life satisfaction and fair or poor health. Future research may consider the intersectional role of gender and SEP and their association with health outcomes. To address social inequalities in health during this formative stage of the life course, policies directed at basic income and disparities in health, gender and social conditions are of utmost importance.
Acknowledgements
The Public Health Agency of Canada funded the Canadian Health Behaviour in School-aged Children (HBSC) study. Additional financial support for this analysis include grants from the Canadian Institutes for Health Research and Social Sciences and Humanities Research Council. FJE holds a Canada Research Chair in Social Inequalities in Child Health from the Government of Canada. Canadian principal investigators of the HBSC study are Drs. Wendy Craig, Queen’s University, and William Pickett, Brock University, and its national coordinator is Matthew King. International coordinator of the HBSC survey is Dr. Jo Inchley, University of Glasgow, Scotland. The international databank manager is Dr. Oddrun Samdal, University of Bergen, Norway. The funders had no role in the study design, data collection or analysis, decision to publish or manuscript preparation.
Conflicts of interest
The authors declare no conflicts of interest.
Authors’ contributions and statement
NH interpreted the results and undertook writing of the original draft.
NH and FE conceptualized the study and conducted the formal analysis and visualizations.
FE provided ideas and thoughts for discussion.
MADS contributed to the data curation.
FE and MADS revised the manuscript for important intellectual content and supported NH in writing – reviewing and editing.
The content and views expressed in this article are those of the authors and do not necessarily reflect those of the Government of Canada.