
Original quantitative research – Suicide and drug toxicity mortality in the first year of the COVID-19 pandemic: use of medical examiner data for public health in Nova Scotia

HPCDP Journal Home
Published by: The Public Health Agency of Canada
Date published: November 2021
ISSN: 2368-738X
Submit a manuscript
About HPCDP
Browse
Previous | Table of Contents | Next
Emily Schleihauf, MAEAuthor reference footnote 1; Matthew J. Bowes, MDAuthor reference footnote 2
https://doi.org/10.24095/hpcdp.42.2.02
(Published 10 November 2021)
This article has been peer reviewed.
Author references
Correspondence
Emily Schleihauf, 51 Garland Avenue, Dartmouth, NS B3B 0J2; Tel: 902-403-7042; Email: emily.schleihauf@novascotia.ca
Suggested citation
Schleihauf E, Bowes MJ. Suicide and drug toxicity mortality in the first year of the COVID-19 pandemic: use of medical examiner data for public health in Nova Scotia. Health Promot Chronic Dis Prev Can. 2022;42(2):60-67. https://doi.org/10.24095/hpcdp.42.2.02
Abstract
Introduction: The COVID-19 pandemic and governmental responses have raised concerns about any corresponding rise in suicide and/or drug toxicity mortality due to exacerbations of mental illness, economic issues, changes to drug supply, ability to access harm reduction services, and other factors.
Methods: Data were obtained from the Nova Scotia Medical Examiner Service. Case definitions were developed, and their performance characteristics assessed. Pre-pandemic trends in monthly suicide and drug toxicity deaths were modelled and the observed numbers of deaths in the pandemic year compared to expected numbers.
Results: There was a significant reduction in suicide deaths in the first year of the COVID-19 pandemic in Nova Scotia, with about 21 fewer non-drug toxicity suicide deaths than expected in March 2020 to February 2021 (risk ratio = 0.82). No change in drug toxicity mortality was detected. Case definitions were successfully applied to free-text cause of death statements and cases where cause and manner of death remained under investigation.
Conclusion: Processes for case classification and monitoring can be implemented in collaboration with medical examiners/coroners for timely, ongoing public health surveillance of suicide and drug toxicity mortality. Medical examiners and coroners are the stewards of a wealth of data that could inform the prevention of further deaths; it is time to engage these systems in public health surveillance.
Keywords: coroners, medical examiners, public health surveillance, COVID-19, suicide, drug overdose, mortality
Highlights
- Unintended consequences of the COVID-19 pandemic and the resulting regulations and policies may include increased suicide and/or drug toxicity mortality.
- Suicide mortality decreased during the first year of the pandemic, a finding that was in agreement with international findings and was not related to reporting lags.
- There was no change in numbers of drug toxicity deaths in the first year of the pandemic in Nova Scotia.
- Ongoing public health surveillance with timely reporting is required to detect and respond to any changes over time.
Introduction
Medical examiners and coroners investigate deaths that are unexplained or unexpected or that occur by violence, including domestic homicides, suicides, drug overdose deaths and motor vehicle collision deaths. Their offices are valuable sources of information that can be mobilized to inform policies and programs aiming to prevent future harms. Although these offices have been recognized as essential sources of data for informing public health surveillanceFootnote 1Footnote 2Footnote 3, their legislative position (typically in justice and public safety) means that they sit outside of the health system, and the exchange of data is sometimes problematic. Routine monitoring and interpretation, where it occurs at all, is typically limited and conducted only once case investigations are closed, which can be up to two years after a death. This inherent time-lag translates to official vital statistics data.
There are concerns that further COVID-19 pandemic “waves” and the responses to mitigate the spread of disease could result in a rise in adverse outcomes related to exacerbated mental illness, social isolation, economic issues or burnout.Footnote 4 Cross-sectional studies have detected significant increases in the prevalence of symptoms of depression, anxiety, psychological distress and COVID-related fears following the declaration of the pandemic and implementation of restrictions on public life.Footnote 5Footnote 6 Negative outcomes could include increases in deaths by suicide or drug toxicity; there have already been numerous reports in North America of increases in drug overdose events.Footnote 7Footnote 8Footnote 9Footnote 10Footnote 11 Early reports found no increase in suicide in the early months of the pandemic in many countries, but emphasize the importance of staying alert to both emerging and known risk factors for suicide as the consequences of the pandemic and associated policies evolve.Footnote 12Footnote 13 Researchers in Japan have reported an increase in suicide deaths coinciding with the second wave of the pandemic there, a phenomenon that appears to be most marked among women and children.Footnote 14 The unintended consequence of increased suicide is not necessarily inevitable;Footnote 4Footnote 15 timely data are required to allow for timely and targeted interventions.
There are two main barriers to the use of data from coroners and medical examiners in public health surveillance: the first is administrative and the second is practical. The first barrier is a lack of a natural pathway for data to flow between these agencies and public health, so that formal partnerships must be newly established. The second barrier is the length of time—often several months—it takes for medicolegal death investigations to conclude, potentially diminishing the value of information for use in real-time public health interventions.
The need to detect and respond to any impact the COVID-19 pandemic and associated policies have had on suicide and drug toxicity mortality has led to the health and justice departments in Nova Scotia collaborating for timely information sharing. Epidemiological principles were applied for systematic classification of fatalities referred to the Nova Scotia Medical Examiner Service. Cases were classified by characteristics that depended on whether the cause of death was certified or remained under investigation.
In this study, we assessed whether there was a change in suicide or drug toxicity deaths in the year after the introduction of measures to prevent the spread of COVID-19 in Nova Scotia.
Methods
Data source
All deaths that may be due to drug intoxication or suicide fall within the legislative mandate of the Nova Scotia Medical Examiner Service (NSMES). The NSMES uses an electronic application to collect and store case investigation information, including cause and manner of death. As standard practice, the medical examiners include the generic names of the drugs causing or contributing to death in the cause of death statement. Through a private service provider, the medical examiners have access to toxicology testing that covers a broad scope of pharmaceutical and nonpharmaceutical drugs.
Data for deaths occurring between January 2009 and February 2021 were extracted on 1 March 2021.
Case definitions: Suicide deaths and deaths due to drug toxicity
We mapped investigative workflow and timelines for key stages (e.g. toxicology results available, cause of death certified; details available on request from the authors). We had access to mortality data from investigative files and death certificates, which included various free text fields (and no International Classification of Diseases coding). We assessed deaths that had a final cause and manner of death recorded in the database against confirmed case definitions. Confirmed deaths by suicide were those for which manner of death was classified as suicide on the death certificate. Confirmed drug toxicity deaths were detected through text mining of immediate and antecedent cause of death fields on the death certificate as described here,Footnote 16 similar to others,Footnote 17 and currently in use for public reporting.Footnote 10Footnote 16 Probable case classifications were applied to cases still under investigation, with cause of death not yet certified. Understanding the performance of the case definitions was required to validate their usefulness in monitoring for trends, particularly when assessing recent months of mortality when many death investigations remain ongoing and cause and manner of death are not yet certified. It also allowed for a sensitivity analysis of findings to provide evidence that trends tested were not affected by the time lag in death certification.
Case definitions are summarized in Table 1.
| Drug toxicity deaths | Suicide deaths – total | Suicide deaths excluding drug toxicity | ||
|---|---|---|---|---|
Confirmed drug toxicity death (reference standard)
|
Probable drug toxicity: Definition A
|
Probable drug toxicity: Definition B
|
Confirmed suicide death (reference standard)
|
Confirmed suicide death excluding drug toxicity suicide deaths (reference standard)
|
|
||||
Analysis
We analyzed data using STATA version 15.1 (StataCorp LP, College Station, TX, US). We classified cases and calculated performance characteristics, including sensitivity, specificity, positive predictive value (PPV; true positives/all cases that met probable case definitions) and negative predictive value (NPV; true negatives/all cases that did not meet probable case definitions) of probable case definitions against confirmed case definitions, the reference standard.
To assess case definitions, we applied probable case definitions to historic data in the manner they would have been applied in real time. In other words, even though cause and manner for historic cases had since been certified, we reviewed the case notes and, if the death was not certified at the time of autopsy (within 3 days of report of death), the cause of death was considered “under investigation” and probable definitions were applied. Classifications dependent on cases remaining under investigation post-autopsy required manual review for historic cases; as such, fewer years of data were included for performance characteristics for related definitions.
The modelling approach described by Pirkis et al.Footnote 12 was applied. Models for monthly case frequencies were fit using Poisson regression with time as a linear predictor. Pairs of sine and cosine functions were added to improve model fit as a seasonal trend was observed when suicide data were plotted. Sine and cosine functions were removed from drug toxicity models, as they did not significantly improve the model fit as per the likelihood ratio test for significant difference between competing models.
From the model, we estimated the expected number of deaths in the year after the first cases of COVID-19 were detected in Nova Scotia, and compared this number with the number of deaths observed in that time period. We calculated risk ratios with 95% confidence intervals (CIs). We called the time period between January 2011 and February 2020 the pre-pandemic period and the March 2020 to February 2021 time frame the pandemic period.
We conducted sensitivity analyses based on historic sensitivity and PPV of case definitions. Models were run with cases in the pre-pandemic time period equal to the cases detected multiplied by the sensitivity of each definition (cases × 0.92 for suicide excluding drug toxicity, and cases × 0.96 for drug toxicity), and observed cases in the pandemic period were equal to the cases detected multiplied by the PPV of each definition (confirmed cases × 1 and probable cases × 0.669 for drug toxicity).
Results
There were no significant differences in the sex or age group distributions of cases between the pre-pandemic and pandemic periods (see Table 2 for case characteristics).
There was a significant decrease in suicide mortality in the pandemic year compared to the pre-pandemic period, with 30 fewer suicide deaths (excluding drug toxicity deaths) than expected (Table 3). A sensitivity analysis suggests this decrease may more likely be 21 fewer deaths than expected in the pandemic period, with borderline statistical significance (CI: 0.67–1.00). There was no significant change in frequency of drug toxicity death in the pandemic period compared to the pre-pandemic period (Table 3).
| Characteristics | Pre-pandemic n (%) |
First pandemic year n (%) |
Chi square p value |
|---|---|---|---|
| Suicide deaths – total | |||
| Total | 1174 (mean of 128 per 12-month period) |
111 | – |
| Sex | |||
| Male | 891 (75.9) | 89 (80.2) | 0.310 |
| Female | 283 (24.1) | 22 (19.8) | |
| Age, years | |||
| <20 | 68 (5.8) | 7 (6.3) | 0.143 |
| 20–29 | 165 (14.1) | 8 (7.2) | |
| 30–39 | 136 (11.6) | 14 (12.6) | |
| 40–49 | 245 (20.9) | 27 (24.3) | |
| 50–59 | 277 (23.6) | 21 (18.9) | |
| 60–69 | 169 (14.4) | 19 (17.1) | |
| 70–79 | 74 (6.3) | 13 (11.7) | |
| 80+ | 40 (3.4) | 2 (1.8) | |
| Suicide deaths excluding drug toxicity | |||
| Total | 945 (mean of 103 per 12-month period) |
93 | – |
| Sex | |||
| Male | 778 (82.3) | 77 (82.8) | 0.910 |
| Female | 167 (17.7) | 16 (17.2) | |
| Age, years | |||
| <20 | 65 (6.9) | 7 (7.5) | 0.079 |
| 20–29 | 150 (15.9) | 8 (8.6) | |
| 30–39 | 116 (12.3) | 12 (12.9) | |
| 40–49 | 195 (20.6) | 24 (25.8) | |
| 50–59 | 213 (22.5) | 17 (18.3) | |
| 60–69 | 122 (12.9) | 14 (15.0) | |
| 70–79 | 55 (5.8) | 11 (11.8) | |
| 80+ | 29 (3.1) | 0 | |
| All drug toxicity deaths | |||
| Total | 859 (mean of 94 per 12-month period) |
104 | – |
| Sex | |||
| Male | 533 (62.1) | 69 (66.4) | 0.393 |
| Female | 326 (37.9) | 35 (33.6) | |
| Age, years | |||
| <20 | 21 (2.4) | 3 (2.9) | 0.427 |
| 20–29 | 108 (12.6) | 21 (20.2) | |
| 30–39 | 160 (18.6) | 22 (21.1) | |
| 40–49 | 183 (21.3) | 18 (17.3) | |
| 50–59 | 225 (26.2) | 20 (19.2) | |
| 60–69 | 108 (12.6) | 14 (13.5) | |
| 70–79 | 38 (4.4) | 4 (3.8) | |
| 80+ | 16 (1.9) | 2 (1.9) | |
| Category | Observed | ExpectedFootnote a | Risk ratio (95% CI) |
|---|---|---|---|
| Suicide deaths excluding drug toxicity | 93 | 123 | 0.75 (0.62–0.92) |
| Suicide deaths excluding drug toxicity – sensitivity analysis | 93 | 114 | 0.82 (0.67–1.00) |
| All drug toxicity deaths | 104 | 91 | 1.15 (0.95–1.39) |
| All drug toxicity deaths – sensitivity analysis | 96 | 87 | 1.11 (0.91–1.36) |
Abbreviation: CI, confidence interval.
|
|||
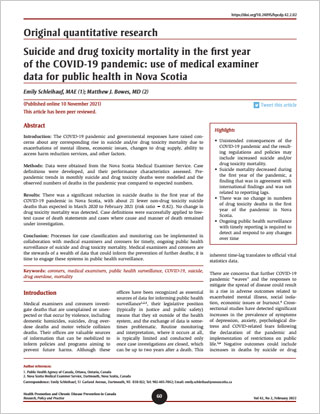
A small proportion of suicide deaths (a mean of 2 per month) were caused by drug toxicity (Table 2; Figure 1). A review of workflow and timelines determined that over 90% of suicide deaths not caused by drug toxicity were certified within 3 days of the first report of death. Deaths related to drug toxicity, whether accident or suicide, always required more time to investigate (>1 month) because of ancillary testing. We therefore implemented surveillance of both (1) non-drug toxicity suicide deaths, without the need for an interim probable suicide case definition, and (2) drug toxicity deaths, including probable cases but regardless of manner of death.
The performance parameters of the case definitions against the reference standards are shown in Tables 4a-d. While the PPV of probable definition A for drug toxicity was found to be very high (93.4%), the sensitivity was lower (85.1%) than desired (Table 4a). Use of this definition alone would underestimate drug toxicity deaths, potentially resulting in missing a chance to detect an important event or trend.
Probable definition B on its own has a lag time related to toxicology testing and would not include cases within probable definition A that have a very high probability of certification of cause of death due to drug toxicity (Table 4b). However, probable definition B is useful for ongoing monitoring of toxicity deaths by specific drug/drug type. For monitoring of all drug toxicity deaths, confirmed cases and cases meeting either probable definition A and/or B were classified as probable drug toxicity deaths.
| Category | Cause of death, n | PPV/NPV | |
|---|---|---|---|
| Drug toxicity (n = 785) |
Not drug toxicity (n = 9112) | ||
| Probable definition A met | 668 | 47 | PPV = 93.4% |
| Probable definition A not met | 117 | 9065 | NPV = 98.7% |
| Sensitivity/specificity | Sensitivity = 85.1% | Specificity = 99.5% | N/A |
Abbreviations: NPV, negative predictive value; NSMES, Nova Scotia Medical Examiner Service; PPV, positive predictive value.
|
|||
| Category | Cause of death, n | PPV/NPV | |
|---|---|---|---|
| Drug toxicity (n = 114) |
Not drug toxicity (n = 1239) |
||
| Probable definition B met | 105 | 52 | PPV = 66.9% |
| Probable definition B not met | 9 | 1187 | NPV = 99.3% |
| Sensitivity/specificity | Sensitivity = 92.1% | Specificity = 95.8% | N/A |
Abbreviations: NPV, negative predictive value; NSMES, Nova Scotia Medical Examiner Service; PPV, positive predictive value.
|
|||
| Category | Cause of death, n | PPV/NPV | |
|---|---|---|---|
| Drug toxicity (n = 114) |
Not drug toxicity (n = 1239) |
||
| Probable definition A or B met | 109 | 54 | PPV = 66.9% |
| Probable definition A and B not met | 5 | 1185 | NPV = 99.6% |
| Sensitivity/specificity | Sensitivity = 95.6% | Specificity = 95.6% | N/A |
Abbreviations: NPV, negative predictive value; NSMES, Nova Scotia Medical Examiner Service; PPV, positive predictive value.
|
|||
| Category | Manner of death, n | PPV/NPV | |
|---|---|---|---|
| Suicide (n = 110) |
Not suicide (n = 984) |
||
| Confirmed post-autopsy | 101 | 0 | PPV = 100% |
| Not confirmed post-autopsy (longer investigation) | 9 | 984 | NPV = 99.0% |
| Sensitivity/specificity | Sensitivity = 92.0% | Specificity = 100% | N/A |
Abbreviations: NPV, negative predictive value; NSMES, Nova Scotia Medical Examiner Service; PPV, positive predictive value. |
|||
Figures 1 and 2 present monthly counts of deaths by suicide and drug toxicity over time. The lag in certification of drug toxicity deaths is apparent in Figure 2, where underestimation of cases (as per probable classifications) is most evident in the most recent six months to data extraction.
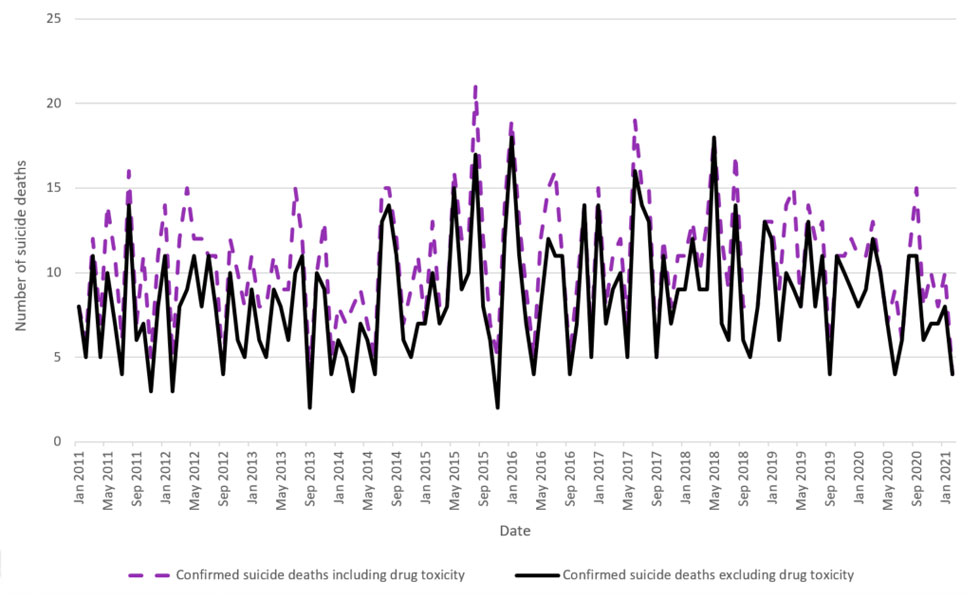
Figure 1 - Text description
| Date | Confirmed suicide deaths including drug toxicity | Confirmed suicide deaths excluding drug toxicity |
|---|---|---|
| Jan 2011 | 8 | 8 |
| Feb 2011 | 6 | 5 |
| Mar 2011 | 12 | 11 |
| Apr 2011 | 7 | 5 |
| May 2011 | 14 | 10 |
| Jun 2011 | 11 | 7 |
| Jul 2011 | 6 | 4 |
| Aug 2011 | 16 | 14 |
| Sep 2011 | 7 | 6 |
| Oct 2011 | 11 | 7 |
| Nov 2011 | 5 | 3 |
| Dec 2011 | 11 | 8 |
| Jan 2012 | 14 | 11 |
| Feb 2012 | 5 | 3 |
| Mar 2012 | 12 | 8 |
| Apr 2012 | 15 | 9 |
| May 2012 | 12 | 11 |
| Jun 2012 | 12 | 8 |
| Jul 2012 | 11 | 11 |
| Aug 2012 | 11 | 8 |
| Sep 2012 | 4 | 4 |
| Oct 2012 | 12 | 10 |
| Nov 2012 | 10 | 6 |
| Dec 2012 | 8 | 5 |
| Jan 2013 | 11 | 9 |
| Feb 2013 | 8 | 6 |
| Mar 2013 | 8 | 5 |
| Apr 2013 | 11 | 9 |
| May 2013 | 9 | 8 |
| Jun 2013 | 9 | 6 |
| Jul 2013 | 15 | 10 |
| Aug 2013 | 12 | 11 |
| Sep 2013 | 4 | 2 |
| Oct 2013 | 10 | 10 |
| Nov 2013 | 13 | 9 |
| Dec 2013 | 5 | 4 |
| Jan 2014 | 8 | 6 |
| Feb 2014 | 7 | 5 |
| Mar 2014 | 8 | 3 |
| Apr 2014 | 9 | 7 |
| May 2014 | 7 | 6 |
| Jun 2014 | 5 | 4 |
| Jul 2014 | 15 | 13 |
| Aug 2014 | 15 | 14 |
| Sep 2014 | 12 | 11 |
| Oct 2014 | 7 | 6 |
| Nov 2014 | 9 | 5 |
| Dec 2014 | 11 | 7 |
| Jan 2015 | 7 | 7 |
| Feb 2015 | 13 | 10 |
| Mar 2015 | 8 | 7 |
| Apr 2015 | 8 | 8 |
| May 2015 | 16 | 15 |
| Jun 2015 | 12 | 9 |
| Jul 2015 | 12 | 10 |
| Aug 2015 | 21 | 17 |
| Sep 2015 | 12 | 8 |
| Oct 2015 | 7 | 6 |
| Nov 2015 | 5 | 2 |
| Dec 2015 | 14 | 12 |
| Jan 2016 | 19 | 18 |
| Feb 2016 | 13 | 11 |
| Mar 2016 | 9 | 7 |
| Apr 2016 | 5 | 4 |
| May 2016 | 12 | 8 |
| Jun 2016 | 15 | 12 |
| Jul 2016 | 16 | 11 |
| Aug 2016 | 11 | 11 |
| Sep 2016 | 5 | 4 |
| Oct 2016 | 9 | 7 |
| Nov 2016 | 14 | 14 |
| Dec 2016 | 6 | 5 |
| Jan 2017 | 15 | 14 |
| Feb 2017 | 8 | 7 |
| Mar 2017 | 11 | 9 |
| Apr 2017 | 12 | 10 |
| May 2017 | 7 | 5 |
| Jun 2017 | 19 | 16 |
| Jul 2017 | 15 | 14 |
| Aug 2017 | 15 | 13 |
| Sep 2017 | 5 | 5 |
| Oct 2017 | 12 | 11 |
| Nov 2017 | 8 | 7 |
| Dec 2017 | 11 | 9 |
| Jan 2018 | 11 | 9 |
| Feb 2018 | 13 | 12 |
| Mar 2018 | 10 | 9 |
| Apr 2018 | 13 | 9 |
| May 2018 | 18 | 18 |
| Jun 2018 | 12 | 7 |
| Jul 2018 | 9 | 6 |
| Aug 2018 | 17 | 14 |
| Sep 2018 | 8 | 6 |
| Oct 2018 | 8 | 5 |
| Nov 2018 | 8 | 8 |
| Dec 2018 | 13 | 13 |
| Jan 2019 | 13 | 12 |
| Feb 2019 | 9 | 6 |
| Mar 2019 | 14 | 10 |
| Apr 2019 | 15 | 9 |
| May 2019 | 8 | 8 |
| Jun 2019 | 14 | 13 |
| Jul 2019 | 12 | 8 |
| Aug 2019 | 13 | 11 |
| Sep 2019 | 5 | 4 |
| Oct 2019 | 11 | 11 |
| Nov 2019 | 11 | 10 |
| Dec 2019 | 12 | 9 |
| Jan 2020 | 11 | 8 |
| Feb 2020 | 11 | 9 |
| Mar 2020 | 13 | 12 |
| Apr 2020 | 10 | 10 |
| May 2020 | 7 | 7 |
| Jun 2020 | 9 | 4 |
| Jul 2020 | 6 | 6 |
| Aug 2020 | 11 | 11 |
| Sep 2020 | 15 | 11 |
| Oct 2020 | 8 | 6 |
| Nov 2020 | 10 | 7 |
| Dec 2020 | 8 | 7 |
| Jan 2021 | 10 | 8 |
| Feb 2021 | 4 | 4 |
Figure 2 - Text description
| Date | Confirmed and probable | Confirmed |
|---|---|---|
| Jan 2011 | 3 | 3 |
| Feb 2011 | 10 | 10 |
| Mar 2011 | 7 | 7 |
| Apr 2011 | 9 | 9 |
| May 2011 | 13 | 13 |
| Jun 2011 | 11 | 11 |
| Jul 2011 | 9 | 9 |
| Aug 2011 | 4 | 4 |
| Sep 2011 | 2 | 2 |
| Oct 2011 | 9 | 9 |
| Nov 2011 | 13 | 13 |
| Dec 2011 | 7 | 7 |
| Jan 2012 | 9 | 9 |
| Feb 2012 | 6 | 6 |
| Mar 2012 | 11 | 11 |
| Apr 2012 | 11 | 11 |
| May 2012 | 7 | 7 |
| Jun 2012 | 9 | 9 |
| Jul 2012 | 8 | 8 |
| Aug 2012 | 9 | 9 |
| Sep 2012 | 3 | 3 |
| Oct 2012 | 5 | 5 |
| Nov 2012 | 12 | 12 |
| Dec 2012 | 9 | 9 |
| Jan 2013 | 5 | 5 |
| Feb 2013 | 8 | 8 |
| Mar 2013 | 11 | 11 |
| Apr 2013 | 11 | 11 |
| May 2013 | 5 | 5 |
| Jun 2013 | 7 | 6 |
| Jul 2013 | 12 | 12 |
| Aug 2013 | 7 | 7 |
| Sep 2013 | 7 | 7 |
| Oct 2013 | 4 | 4 |
| Nov 2013 | 11 | 11 |
| Dec 2013 | 6 | 6 |
| Jan 2014 | 11 | 11 |
| Feb 2014 | 6 | 6 |
| Mar 2014 | 6 | 6 |
| Apr 2014 | 6 | 6 |
| May 2014 | 6 | 6 |
| Jun 2014 | 6 | 6 |
| Jul 2014 | 8 | 8 |
| Aug 2014 | 8 | 8 |
| Sep 2014 | 8 | 8 |
| Oct 2014 | 8 | 8 |
| Nov 2014 | 13 | 13 |
| Dec 2014 | 11 | 11 |
| Jan 2015 | 6 | 6 |
| Feb 2015 | 7 | 7 |
| Mar 2015 | 4 | 4 |
| Apr 2015 | 7 | 7 |
| May 2015 | 7 | 7 |
| Jun 2015 | 6 | 6 |
| Jul 2015 | 5 | 5 |
| Aug 2015 | 9 | 9 |
| Sep 2015 | 8 | 7 |
| Oct 2015 | 11 | 11 |
| Nov 2015 | 6 | 6 |
| Dec 2015 | 10 | 10 |
| Jan 2016 | 7 | 7 |
| Feb 2016 | 7 | 7 |
| Mar 2016 | 9 | 9 |
| Apr 2016 | 8 | 8 |
| May 2016 | 10 | 10 |
| Jun 2016 | 9 | 9 |
| Jul 2016 | 10 | 10 |
| Aug 2016 | 6 | 6 |
| Sep 2016 | 7 | 7 |
| Oct 2016 | 5 | 5 |
| Nov 2016 | 4 | 4 |
| Dec 2016 | 2 | 2 |
| Jan 2017 | 11 | 11 |
| Feb 2017 | 9 | 9 |
| Mar 2017 | 10 | 10 |
| Apr 2017 | 7 | 7 |
| May 2017 | 7 | 7 |
| Jun 2017 | 14 | 14 |
| Jul 2017 | 4 | 4 |
| Aug 2017 | 7 | 7 |
| Sep 2017 | 7 | 7 |
| Oct 2017 | 5 | 5 |
| Nov 2017 | 8 | 7 |
| Dec 2017 | 10 | 10 |
| Jan 2018 | 8 | 8 |
| Feb 2018 | 8 | 8 |
| Mar 2018 | 6 | 6 |
| Apr 2018 | 10 | 10 |
| May 2018 | 9 | 9 |
| Jun 2018 | 13 | 13 |
| Jul 2018 | 8 | 8 |
| Aug 2018 | 5 | 5 |
| Sep 2018 | 7 | 7 |
| Oct 2018 | 7 | 7 |
| Nov 2018 | 11 | 11 |
| Dec 2018 | 2 | 2 |
| Jan 2019 | 4 | 4 |
| Feb 2019 | 9 | 9 |
| Mar 2019 | 11 | 11 |
| Apr 2019 | 13 | 13 |
| May 2019 | 12 | 12 |
| Jun 2019 | 3 | 3 |
| Jul 2019 | 8 | 8 |
| Aug 2019 | 11 | 11 |
| Sep 2019 | 6 | 4 |
| Oct 2019 | 6 | 6 |
| Nov 2019 | 4 | 4 |
| Dec 2019 | 7 | 6 |
| Jan 2020 | 9 | 9 |
| Feb 2020 | 6 | 6 |
| Mar 2020 | 4 | 4 |
| Apr 2020 | 6 | 6 |
| May 2020 | 7 | 7 |
| Jun 2020 | 13 | 12 |
| Jul 2020 | 6 | 5 |
| Aug 2020 | 3 | 3 |
| Sep 2020 | 13 | 11 |
| Oct 2020 | 8 | 8 |
| Nov 2020 | 14 | 10 |
| Dec 2020 | 11 | 9 |
| Jan 2021 | 13 | 5 |
| Feb 2021 | 6 | 0 |
- Footnote a
-
Definition A: Death that occurred in Nova Scotia AND cause of death remains under investigation AND preliminary classification of death event was “drug related.”
- Footnote b
-
Definition B: Death that occurred in Nova Scotia AND cause of death remains under investigation AND preliminary classification of death event was “drug related” or “medical” or “undetermined” AND postmortem toxicology findings included detection of one or more drugs AND age at death >14 and <75 years.
Discussion
One year into the COVID-19 pandemic, a decrease was noted in the number of non-drug toxicity suicide deaths in Nova Scotia compared to the pre-pandemic period. This decrease was not explained by a lag in certification, as most of these deaths were certified within 3 days. The sensitivity analysis that accounted for the performance of the case definitions applied showed about 21 fewer deaths in the first 12-month period of the pandemic, with borderline statistical significance (upper confidence limit of 1.00).
Suicide findings are consistent with a recent report where 12 of 21 high income and upper-middle income countries (or areas of countries) had a decrease in suicide deaths in the early months of the pandemic while the remainder continued to have numbers within the expected range.Footnote 12 There was no evidence of a difference in the demographics of those dying by suicide during the pandemic compared to before the pandemic; nor was there a detectable change in drug toxicity deaths, which included probable and confirmed cases to mitigate the lag in certification.
Increases in drug toxicity mortality during the pandemic have been observed in other Canadian jurisdictions.Footnote 7Footnote 9Footnote 10 Factors contributing to these increases—including a shifting and increasingly harmful drug supply and greater barriers to harm reduction approaches—have been less prominent in Nova Scotia to date but can change quickly and must be considered when pandemic policies are implemented to avoid preventable death.
An emerging collaboration between the NSMES and public health authorities in Nova Scotia initially focused on drug toxicity deaths and deaths by suicide, both recognized as major public health issues in Canada and North America, and both identified as in need of monitoring for prompt response in the context of potential unintended consequences of the COVID-19 pandemic.Footnote 4Footnote 8Footnote 13 The case definitions that have been implemented had high sensitivity and specificity when applied to historical data, suggesting that events of interest will not go undetected and excluded cases are unlikely to be certified as drug toxicity or suicide deaths when the case investigations are closed. Monitoring provisional trends in drug toxicity deaths as well as suicide deaths ensures timely surveillance of both types of fatalities, taking into account drug specificity and manner of death. It also satisfies concerns around differences in classification of manner of death and a suggested need to consider both suicide poisoning and accidental toxicity together as a group of deaths due to self-intoxication.Footnote 18Footnote 19
The approach to case classification described here does not increase the workload of members of the death investigation team and does not require time-consuming manual review of cases. It does rely upon common certification practices on the part of the medical examiners; existing guidelines from the United States for the certification of drug toxicity deaths have been helpful in this regard. One of these guidelines recommends naming the specific (parent) drug(s) that contributed to death by their generic names in Part I of the death certificate.Footnote 20
Coroner medical examiner offices across Canada differ markedly in the way they are resourced, staffed and administered, and they are not subject to national practice guidelines of any type. The impact of this variance in death investigation practice on the quality of mortality data has not been studied. Common approaches would allow for better comparability in this area. In the interim, presumptive case classifications are assigned in various jurisdictions in different ways (e.g. based on scene evidence, medical and social history collected by investigating coroners for suspected drug toxicityFootnote 8Footnote 9; preliminary coroner statisticsFootnote 7 and police-reported statistics for suspected deaths by suicideFootnote 14).
The longer-term trend of an increasing population suicide rate in Nova Scotia pre-pandemic is also evident in vital statistics data as presented in the Nova Scotia suicide framework.Footnote 21 The two-year lag in data availability shows that collaboration with the death investigation system is required to detect any early warning signals and classify cases (including presumptive cases) to monitor them in real time. Furthermore, drug toxicity and suicide data available through routine processes for gathering vital statistics in Canada may be affected by information bias that could be mitigated through classification of probable cases and more frequent updates from source data or a live connection. As the complexity of the investigation to determine suicide intent and the lag time of toxicology results can lead to a longer investigation, time frames for capturing a vital statistics dataset and publishing it as “final” means that a proportion of deaths are classified in the “Symptoms, signs and abnormal clinical and laboratory findings, not elsewhere classified” category. This can result in significant underestimation in frequencies and population rates; the effect of this underestimation on drug toxicity surveillance in the USA has been noted.Footnote 22
In summary, vital statistics data are affected by timeliness as well as accuracy for suicide and drug toxicity deaths. This, coupled with the richness of the contextual information collected through the death investigation, which is distilled out when coded to ICD,Footnote 1Footnote 17 makes the coroner/medical examiner office both the source of truth about non-natural deaths and the source of data and evidence to inform action.
Efforts to prevent deaths can be informed by an understanding of the context in which fatalities occur (e.g. different actions are warranted in response to deaths from pharmaceutically formulated fentanyl patches than to fentanyl powders produced outside of the controls of the pharmaceutical industry), and when considered alongside other evidence (e.g. mental health surveys, non-fatal harms, etc.). Pan-Canadian toxicity mortality data are publicly released every quarter, with a six-month delay in providing evidence essential for drug policy.Footnote 23
At the local level, evidence-based interventions can be rapidly implemented to prevent additional drug toxicity deaths in a targeted setting, similar to what happens when the source of infection is identified and removed to contain infectious disease outbreaks. While the removal of causative agents such as nonpharmaceutical fentanyl or methamphetamine from the local environment has proven not to be feasible, there are effective interventions for preventing death. Similarly, rapid targeted suicide prevention strategies can be deployedFootnote 4Footnote 15 when warranted in addition to established population-based prevention strategies.
Setting up routine data collection for key pieces of information for routine and/or ad-hoc analysis can provide a basis for quickly assessing a situation (e.g. occupational groups affected by suicide during versus prior to the pandemic, such as health care providers). Although the investigative files are rich in detail, they could be made more useful by standardizing the collection of minimum datasets.Footnote 1 In the interim, cases can be reviewed to abstract key information, but this is time consuming and should be driven by the need for information for action. Ongoing collaboration between the death investigation system and public health is fundamental for this surveillance system to function, with iterative review of objectives, analysis, reporting, and related programs/policies.Footnote 22
Strengths and limitations
There are limitations to this work. For some cases, cause of death remained outstanding at the time of assessing historical probable cases against the reference standard. Still, this proportion was small (3.5%) and classification as case/not case would not change the findings. Medical examiners in Nova Scotia have broad consensus on the structure of cause of death statements for drug toxicity deaths and the level of evidence to classify a death as suicide, but there could still be some inter- and intra-observer variability in how deaths are classified.
Because Nova Scotia has a highly centralized death investigation system, the approach we describe here may not be generalizable across all Canadian or international jurisdictions, precluding direct replication of this approach. The scope of this collaboration could be widened to include all non-natural deaths. However, surveillance of natural causes of death, such as heart or lung disease, requires access to all-cause mortality data: extension of our approach to these other categories of death will require an extension of the collaboration to other agencies.
Investing in real-time mortality surveillance systems and improving the accuracy of death certification are essential for understanding and acting on trends in mortality by cause.Footnote 24Footnote 25 Some simple measures, such as guidelines for death certification,Footnote 20 implementing electronic death certificates,Footnote 26 and standardization of cause of death statements easily implementable in electronic systems,Footnote 1 allows for timely and inexpensive monitoring of all causes of death.
Conclusion
Timely surveillance data need not be perfect in terms of sensitivity and specificity to provide evidence of a need for action or iteratively inform an ongoing public health response (and associated programs and policies). Assigning cases according to definitions of public health interest is the first step prior to any descriptive or analytic analyses, whether measuring direct or indirect effects of pandemic or related restrictions at the individual level (e.g. changes to mental health during lockdown, changes to employment, disruption to drug supply) or the ecological level (e.g. timelines of changes to policies).
Nova Scotia has not experienced increases in suicide or drug toxicity deaths during the first year of the pandemic. As the factors that contribute to non-natural deaths can quickly shift during pandemic response, countermeasures and rapid intervention are important. Death investigation systems are the source of truth for preventable non-natural deaths that have the potential to arise as unintended consequences. These systems are the stewards of a wealth of data that could inform the prevention of further deaths; it is time to engage these systems in public health surveillance.
Acknowledgements
We thank the medicolegal death investigators, the medical examiners, the morgue technicians and the case records staff working in the Nova Scotia Medical Examiner Service (NSMES).
Conflict of interest
The authors declare that they have no conflict of interest.
Statement
The content and views expressed in this article are those of the authors and do not necessarily reflect those of the Government of Canada.