
Evidence synthesis – What is known about the prevalence of household food insecurity in Canada during the COVID-19 pandemic: a systematic review

HPCDP Journal Home
Published by: The Public Health Agency of Canada
Date published: March 2022
ISSN: 2368-738X
Submit a manuscript
About HPCDP
Browse
Leanne Idzerda, PhDAuthor reference footnote 1; Geneviève Gariépy, PhDAuthor reference footnote 2Author reference footnote 3; Tricia Corrin, MPHAuthor reference footnote 4; Valerie Tarasuk, PhDAuthor reference footnote 5; Lynn McIntyre, MDAuthor reference footnote 6; Sarah Neil-Sztramko, PhDAuthor reference footnote 7Author reference footnote 8; Maureen Dobbins, RN, PhDAuthor reference footnote 8Author reference footnote 9; Susan Snelling, PhDAuthor reference footnote 8; Alejandra Jaramillo Garcia, MScAuthor reference footnote 1
https://doi.org/10.24095/hpcdp.42.5.01
(Published 16 March 2022)
This article has been peer reviewed.
Author reference
Correspondence
Leanne Idzerda, Public Health Agency of Canada, 785 Carling Ave., Ottawa, ON K1S 5H4; Tel: (613) 952-7608; Email: Leanne.Idzerda@phac-aspc.gc.ca
Suggested citation
Idzerda L, Gariépy G, Corrin T, Tarasuk V, McIntyre L, Neil-Sztramko S, Dobbins M, Snelling S, Jaramillo Garcia A. What is known about the prevalence of household food insecurity in Canada during the COVID-19 pandemic: a systematic review. Health Promot Chronic Dis Prev Can. 2022;42(5):177-87. https://doi.org/10.24095/hpcdp.42.5.01
Abstract
Introduction: Household food insecurity (HFI) is a persistent public health issue in Canada that may have disproportionately affected certain subgroups of the population during the COVID-19 pandemic. The purpose of this systematic review is to report on the prevalence of HFI in the Canadian general population and in subpopulations after the declaration of the COVID-19 pandemic in March 2020.
Methods: Sixteen databases were searched from 1 March 2020 to 5 May 2021. Abstract and full-text screening was conducted by one reviewer and the inclusions verified by a second reviewer. Only studies that reported on the prevalence of HFI in Canadian households were included. Data extraction, risk of bias and certainty of the evidence assessments were conducted by two reviewers.
Results: Of 8986 studies identified in the search, four studies, three of which collected data in April and May 2020, were included. The evidence concerning the prevalence of HFI during the COVID-19 pandemic is very uncertain. The prevalence of HFI (marginal to severe) ranged from 14% to 17% in the general population. Working-age populations aged 18 to 44 years had higher HFI (range: 18%–23%) than adults aged 60+ years (5%–11%). Some of the highest HFI prevalence was observed among households with children (range: 19%–22%), those who had lost their jobs or stopped working due to COVID-19 (24%–39%) and those with job insecurity (26%).
Conclusion: The evidence suggests that the COVID-19 pandemic may have slightly increased total household food insecurity in Canada during the pandemic, especially in populations that were already vulnerable to HFI. There is a need to continue to monitor HFI in Canada.
Keywords: food insecurity, COVID-19, systematic review, underserved populations, Canada
Highlights
- This review examined household food insecurity (HFI) during the COVID-19 pandemic in Canada, with data collected between April 2020 and April 2021.
- The reported HFI prevalence among the general population ranged from 14% to 17%. Subpopulations most vulnerable to HFI included households whose working-age members lost their employment (range: 24%–39%) or were job-insecure (26%) and households with children (range: 19%–22%). The certainty of evidence for most findings was low to very low, which means the interpretation could change as new research findings emerge.
- The evidence suggests that the COVID-19 pandemic may have slightly increased total household food insecurity in Canada during the pandemic, especially in populations that were already vulnerable to HFI.
- New research on the impacts of COVID-19 on household food insecurity in the territories, in remote communities and among Indigenous and racialized populations is needed.
- Policies and interventions are needed to reduce HFI in Canada within the context of the pandemic, the pandemic recovery period and beyond.
Introduction
Household food insecurity (HFI) is a persistent public health issue in Canada and can be understood as a harmful lack in the basic human right to food.Footnote 1Footnote 2 It is a marker of both deprivation and impoverishment and is a potent social determinant of health.Footnote 3 Prior to the COVID-19 pandemic, 1 in 8 households (12.7%) in Canada were food-insecure,Footnote 1 representing 4.4 million Canadians, including 1.2 million children.Footnote 1
The measurement and monitoring of household food insecurity in Canada adopts a narrow focus, defining food insecurity as the inadequate or insecure access to food due to financial constraints. In Canada nationally, and in this paper, household food insecurity is operationalized using responses to the Household Food Security Survey Module.Footnote 4 Research has consistently demonstrated that those living in food-insecure households have poorer mental, physical and oral health, report greater stress and are more likely to suffer from chronic conditions such as diabetes, hypertension and mood and anxiety disorders.Footnote 5Footnote 6Footnote 7Footnote 8Footnote 9 HFI is also associated with more frequent hospitalizations and early death.Footnote 10 Health care costs among severely food-insecure adults are more than double that of food-secure adults, even after adjusting for well-established social determinants of health, such as education and income levels.Footnote 11
Monitoring of HFI in Canada for almost two decades has shown that some segments of society are more affected than others. For example, one-third (33.1%) of female-led, lone-parent households are food-insecure.Footnote 1 HFI also differs markedly by Indigenous status and cultural group. Some of the highest rates of food insecurity have been found among households in which the respondent identified as Indigenous (28.2%) or Black (28.9%).Footnote 1 While being unemployed can contribute to HFI, data collected prior to the COVID-19 pandemic show that most food-insecure households had members who were in the workforce.Footnote 1Footnote 12 In 2017–2018, two out of three (65.0%) food-insecure households reported their main source of income as wages or salaries from employment rather than social assistance, employment insurance or seniors’ pensions.Footnote 1 Another study found that most food-insecure working households had members that worked in low-wage, temporary or part-time jobs.Footnote 12 The COVID-19 pandemic has had a disproportionate impact on some of these same subpopulations in terms of both COVID-19 cases and hospitalizations, as well as indirect effects such as unemployment.Footnote 13
To inform HFI policy and action in Canada, we undertook a systematic review of the prevalence of HFI in Canada during the COVID-19 pandemic. The purpose of this review was to report on the prevalence of HFI in the general population, and to identify subpopulations that may be more affected by HFI. This is important, as there is speculation that the COVID-19 pandemic has negatively affected household food insecurity among vulnerable subgroups.Footnote 13
Methods
Review scope and team
This systematic review built upon the studies identified by a rapid review of the evidence on the prevalence of HFI in North America during the COVID-19 pandemic conducted by the National Collaborating Centre for Methods and Tools (NCCMT).Footnote 14 The methods used in that rapid review differed from a traditional systematic review in terms of the screening process. In this case, only one reviewer screened the titles and abstracts, as opposed to the usual two people independently screening the abstracts and full text for inclusion. All inclusions were later verified by an independent second reviewer. The list of included studies was also confirmed with two subject matter experts to ensure that no studies were missing.
Using the studies with Canadian data identified by the NCCMT rapid review, our multidisciplinary team, with expertise in knowledge synthesis, epidemiology, chronic and infectious diseases and public health, undertook independent data extraction, risk of bias assessment and quality of evidence evaluation. The review methods were established prior to the conduct of the review and carried out with no significant deviations. The outcome domain to be assessed was HFI.
Search strategy, inclusion criteria and selection process
As part of the original NCCMT rapid review, 16 databases were searched from 1 March 2020 up to and including 5 May 2021, using key terms related to food insecurity. A full copy of the search strategy is available online.Footnote 15 Searches were limited to English- and French-language studies, and there were no restrictions based on publication status: peer-reviewed, pre-print and non–peer reviewed sources were included. All identified references were exported into DistillerSR systematic review software (Evidence Partners, Inc., Ottawa, ON, Canada) and duplicates were removed. A single reviewer screened all titles and abstracts for potential eligibility. Another reviewer screened full-text articles of all potentially eligible studies for final inclusion. These inclusions were verified by a second reviewer at the data extraction stage. Conflicts were resolved by a third reviewer. More detailed information about the rapid review can be found elsewhere.Footnote 14
In the current systematic review, we included studies from the NCCMT rapid review that reported on the prevalence of HFI in Canadian households. Studies that included households outside of Canada were only included if they reported on Canadian HFI separately. We included data collected after the declaration of the COVID-19 pandemic (11 March 2020). Studies that reported a comparison to prepandemic values were included if they provided data on HFI prevalence during the pandemic.
Data extraction
A form was developed to extract data on key study characteristics (e.g. study design, date of study, tool used to measure HFI), participant characteristics (e.g. demographic and socioeconomic variables) and HFI prevalence outcomes (data extraction form available upon request). The form was pre-tested by all three reviewers to ensure clarity and consistency and that all the necessary information to address the research topic was extracted. For each HFI outcome, the prevalence, numerator and denominator were extracted along with the confidence interval, range and/or standard deviation.
Prevalence estimates were extracted for the general population as well as for subgroups of interest, which were identified in consultation with subject matter experts as well as policy makers at the Public Health Agency of Canada. These subgroups were: low-income households, single-parent households, Indigenous households, households with children, home ownership status (owner, renter), main source of income of household head, employment status of household head, sex or gender of the household head, race or racial identity of household head, and sexual orientation of the household head. Subpopulation analysis was not limited to these populations, and other affected groups were included in the analysis as necessary. One reviewer extracted the study characteristics and outcomes, and a second reviewer verified the extracted information. Any discrepancies found by the verifier were discussed and resolved by consensus. In the event of missing or unclear data, the original authors of the studies were contacted.
Risk of bias and certainty of evidence appraisal
We first assessed the risk of bias of individual studies using a validated critical appraisal tool for prevalence studies designed by the Joanna Briggs Institute (JBI).Footnote 16 The checklist includes nine questions focussed on assessing selection and information bias. We then assessed the certainty of evidence of each HFI outcome (total HFI, to include marginal, moderate and severe HFI vs. moderate and severe HFI) by applying the Grading of Recommendations Assessment, Development and Evaluation (GRADE) methodology.Footnote 17
Two modifications were made to the JBI critical appraisal tool when applying risk of bias within the GRADE assessment. Question 3, pertaining to sample size, was removed, as this question was assessed during the GRADE assessment and we did not want to double penalize any study. Question 4, pertaining to the detailed description of subjects and setting, was considered not applicable, as this item relates to an issue of reporting rather than the study’s risk of bias. Therefore, seven questions in total were included in the risk of bias assessment as it was utilized in the GRADE assessment. Two reviewers independently assessed risk of bias for each study. Reviewers resolved conflicts through consensus or consultation with a third reviewer. In the event of missing or unclear data, the original authors of the included studies were contacted.
In the absence of a formal framework for prevalence in GRADE, we used the GRADE framework for assessment of incidence estimates in the context of prognostic studies.Footnote 17 We then made specific adaptions, similar to what others have doneFootnote 18 (details available upon request). One reviewer assessed the quality of the body of evidence for each outcome and another verified the assessment, with disagreements resolved through discussion or consultation with a third reviewer. Details of the GRADE decision framework are outlined in Table 1. Following guidelines,Footnote 17 we initially assigned the certainty of evidence from studies of all designs as “high” for all outcomes, with final level of certainty rating scored as high (0 point loss), moderate (−0.5 to −1.5 points), low (−2 to −3 points) or very low (−3.5 points or more).
| Factors that can affect the quality of evidence | Rating of evidence | Number of points | Decision rules |
|---|---|---|---|
| Risk of bias | No serious risk of bias | 0 |
|
| Serious risk of bias | −0.5 point |
|
|
| −1 point | If data synthesized narratively:
|
||
| Very serious risk of bias | −1.5 point | If data synthesized narratively:
|
|
| InconsistencyFootnote a | No serious inconsistency | 0 |
|
| Serious inconsistency | −0.5 point |
|
|
| −1 point |
|
||
| Indirectness | No serious indirectness | 0 |
|
| Serious indirectness | −0.5 point |
|
|
| Very serious indirectness | −1 point |
|
|
| Imprecision | No serious imprecision | 0 |
|
| Serious imprecision | −0.5 point |
|
|
| Publication bias | No serious risk of publication bias | 0 | Due to the fact that pre-prints as well as unpublished grey literature and reports were included in this review, we do not expect that important results were missed. In addition, any other surveys conducted were likely small online surveys and are not likely to have a great impact on the results |
Abbreviations: GRADE, Grading of Recommendations Assessment, Development and EvaluationFootnote 17; HFI, household food insecurity; MA, meta-analysis; OIS, optimal information size; ROB, risk of bias; SME, subject matter expert.
|
|||
Synthesis methods
We conducted a narrative synthesis of the evidence for the research question according to overall findings that emerged from the literature. Individual studies were compared based on the characteristics of the populations, the outcome measures and the reference time period. Meta-analyses were planned if more than two studies were available that adequately reported similar data suitable for pooling.
Results
Study selection
Figure 1 presents the study selection process using the PRISMA flow diagram.Footnote 19 Reasons for exclusion were not reported due to the rapid time frame of the NCCMT rapid review. A total of 8986 studies were identified in the search (8973 from databases and registers and 13 from other sources), of which 144 were deemed potentially relevant. Six publications, representing four unique datasets, were deemed eligible for inclusion in this review.Footnote 13Footnote 20Footnote 21Footnote 22Footnote 23Footnote 24 Three studiesFootnote 13Footnote 20Footnote 21 reported findings from the same dataset collected in May 2020 as part of the Canadian Perspectives Survey Series (CPSS-2) from Statistics Canada. All three CPSS-2 studies reported prevalence values within 1% of each other, with small differences due to criteria for inclusion of data in the final analysis. Among these studies,Footnote 13Footnote 20Footnote 21 we excluded two studies and included only the study by Men and TarasukFootnote 13 in our review, as this study reported on HFI in the most detail for the subpopulations of interest and was the only peer-reviewed study utilizing the data. Four studies were therefore ultimately included in the current review.Footnote 13Footnote 22Footnote 23Footnote 24
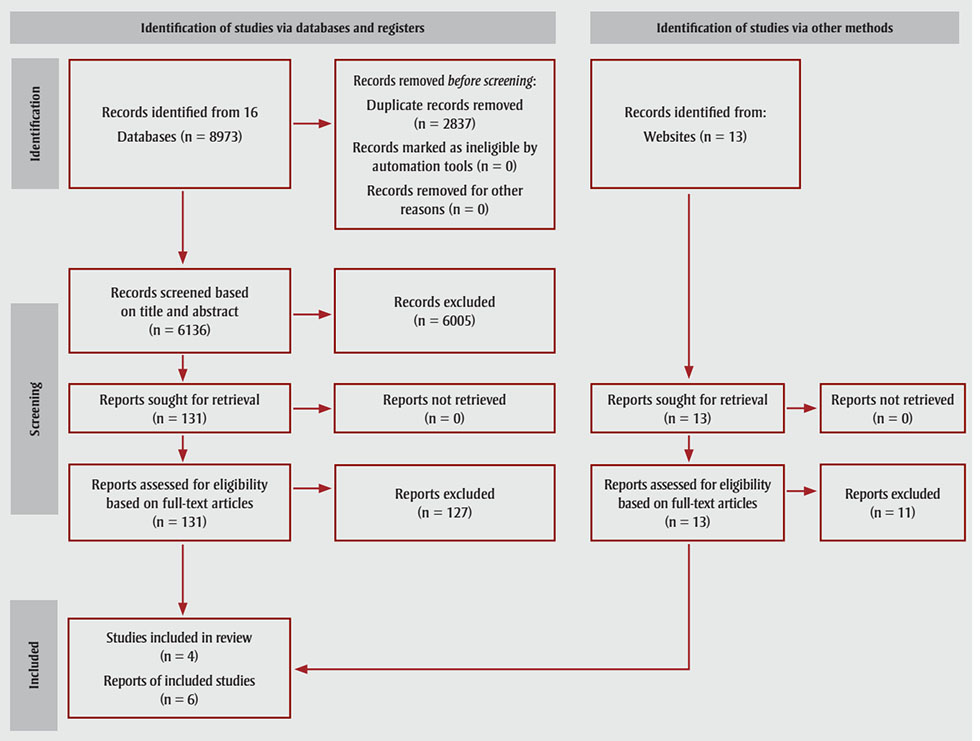
Figure 1 - Text description
This figure illustrates the selection of studies or the HFI systematic review.
Studies were identified in two ways: through databases and registers, and via other methods.
8973 records were identified from 16 databases. The following records were removed before screening: duplicate records (n = 2837); records marked as ineligible by automation tools (n = 0); and records removed for other reasons (n = 0). Thus, 6136 records were screened based on title and abstract. Of those, 6005 records were excluded. As a result, 131 reports were sought for retrieval (n = 0 records were not retrieved). Those 131 reports were assessed for eligibility based on full-text articles, which resulted in 127 reports being excluded.
13 records were identified via other methods (websites). Those 13 reports were sought for retrieval (n = 0 records were not retrieved). Those 13 reports were therefore assessed for eligibility based on full-text articles, which resulted in 11 excluded reports.
In the end, this yielded n = 6 reports of included studies, with n = 4 studies included in the review.
Abbreviation: HFI, household food insecurity.
Study characteristics
The study characteristics are included in Table 2. All four studies utilized web surveys to collect data. Two studies were large, population-based, cross-sectional surveysFootnote 13Footnote 24 and two studies were cross-sectional surveys conducted within the context of an ongoing longitudinal cohort study.Footnote 22Footnote 23 Three studies were peer-reviewedFootnote 13Footnote 22Footnote 23 and one was a non–peer reviewed government report.Footnote 24 Sample sizes varied from 254 to 6691 participants. Each study used a different instrument to measure HFI and different criteria to define HFI. For example, one studyFootnote 22 defined HFI as moderate or severe experiences of HFI, whereas the other studies included marginal, moderate and severe experiences of HFI.Footnote 13Footnote 23Footnote 24 Three studies measured HFI over the previous 30 days,Footnote 13Footnote 23Footnote 24 while one studyFootnote 22 used a reference period of 7 days. Three studies collected data in the first wave of the pandemic, between April and May 2020,Footnote 13Footnote 22Footnote 23 and one in the third wave, in April 2021.Footnote 24
| First author, year |
Location | Study design | Dates of data collection | Sample size and recruitment | Response rate | Income | Age in years (SD) | HFI measure | Reported outcome |
|---|---|---|---|---|---|---|---|---|---|
| Carroll, 2020 | City of Guelph, Ontario | Cross-sectional online survey | April–May 2020 | N = 254 families with children under 11, recruited from the Guelph Family Health Study | 83% | 56.7% HH income more than CAD 100 000 per year | Mean age of mothers: 37.5 (4.8) fathers: 39.4 (5.5) | Definition: presence of HFI Tool: single question (not enough money to buy food) (not validated)Footnote a Reference period: last 30 days | Prevalence of HFI, unadjusted |
| INSPQ, 2021 | Quebec province | Cross-sectional online survey | April 2021 | N = 6691 adults recruited through an online web panel | 10% | NR | 18–44: 42% 45–59: 26% 60+: 33% | Definition: marginal to severe HFI Tool: 4 items derived from the 18-item HFSSMFootnote b (not validated) Reference period: last 30 days | Prevalence of HFI, weighted to approximate the sociodemographic distribution of the Quebec adult population |
| Lamarche, 2021 | Quebec province | Cross-sectional online survey | April–May 2020 | N = 922 adults, recruited from the NutriQuébec study | 37% | 39.5% HH income more than CAD 100 000 per year | 18–49: 50% 50–69: 34% 70+: 16% | Definition: moderate to severe HFI Tool: 15 items derived from the 18-item HFSSM Reference period: last 7 days | Prevalence of HFI, weighted to approximate the sociodemographic distribution of the Quebec adult population and probability of nonresponse |
| Men and Tarasuk, 2021 | All 10 Canadian provinces | Cross-sectional online survey | May 2020 | N = 4410. The CPSS-2 draws a probability sample from respondents to the Labour Force Survey 2019. Canadians aged 15+ years living in 10 provinces | 64% | NR | 15–44: 48% 45–64: 32% 65+: 20% | Definition: marginal to severe HFI Tool: validated 6-item questionnaire derived from the 18-item HFSSMFootnote d Reference period: last 30 days | Prevalence of HFI, weighted to approximate the sociodemographic distribution of the Canadian population |
Abbreviations: CPSS-2, Canadian Perspectives Survey Series-2; HFI, household food insecurity; HFSSM, Household Food Security Survey Module (gold standard for measurement of HFI); HH, household; INSPQ, Institut national de santé publique du Québec; NR, not reported; SD, standard deviation.
|
|||||||||
Risk of bias in studies
A summary of the risk of bias assessments is provided in Table 3, with detailed assessments available upon request. Serious concerns about risk of bias were found for three of the four included studies,Footnote 22Footnote 23Footnote 24 while the remaining study was assessed at low risk of bias.Footnote 13
| Question | Carroll et al. (2020) | INSPQ (2021) | Lamarche et al. (2021) | Men and Tarasuk (2021) |
|---|---|---|---|---|
| 1. Was the sample frame appropriate to address the target population? | No | No | No | Yes |
| 2. Were study participants sampled in an appropriate way? | No | No | No | Yes |
| 3. Was the sample size adequate?Footnote a | No | Yes | Yes | Yes |
| 4. Were the study subjects and setting described in detail?Footnote a | Yes | Yes (upon request) | Yes | Yes |
| 5. Was data analysis conducted with sufficient coverage of the identified sample? | No | No | No | No |
| 6. Were valid methods used to identify HFI? | No | No | No | Yes |
| 7. Was HFI measured in a standard, reliable way for all participants? | Yes | Yes | Yes | Yes |
| 8. Was there appropriate statistical analysis? | No | No | No | Yes |
| 9. Was the response rate adequate, and if not, was the low response rate managed appropriately? | Yes | Yes | Yes | Yes |
| Score | 6 of 9 | 5 of 9 | 5 of 9 | 1 of 9 |
| Overall risk of biasFootnote b | Serious ROB | Serious ROB | Serious ROB | Low ROB |
| Risk of bias as applied in GRADEFootnote c | 5 of 7 | 5 of 7 | 5 of 7 | 1 of 7 |
Abbreviations: GRADE, Grading of Recommendations Assessment, Development and Evaluation; HFI, household food insecurity; INSPQ, Institut national de santé publique du Québec; ROB, risk of bias.
|
||||
Prevalence of HFI
The prevalence of total HFI for the general population (including marginal, moderate and severe HFI) ranged from 14% to 17% across included studies (low certainty; Table 4). Thus, the evidence suggests that the COVID-19 pandemic may have slightly increased total household food insecurity. The prevalence of moderate and severe HFI over the last 30 days was 10% (very low certainty; Table 5). The prevalence of moderate and severe HFI over the last 7 days was 1% (very low certainty; Table 5). The COVID-19 pandemic may have increased the prevalence of moderate and severe HFI, but the evidence is very uncertain and new evidence may change the interpretation of this data.
| Subpopulations | Prevalence of food insecurity (%) | GRADE certainty rating | |
|---|---|---|---|
| INSPQ (2021) | Men and Tarasuk (2021) | ||
| General population | 17 | 14 | LowFootnote c |
| Age (years) | |||
| 18–44 | Range 18–22 | Range 18–23Footnote a | LowFootnote c |
| 60+ | Range 9–11 | Range 5–7Footnote b | LowFootnote c |
| Gender | |||
| Men | 17 | 15 | LowFootnote c |
| Women | 17 | 14 | LowFootnote c |
| Household status | |||
| Households with children | 22 | 19 | LowFootnote c |
| Households with no children | 16 | 12 | LowFootnote c |
| Place of residence | |||
| Urban | 10 | 14 | LowFootnote c |
| Rural | 11 | 17 | LowFootnote c |
| Education | |||
| High school or less | 20 | 15 | LowFootnote c |
| University degree | 12 | 11 | LowFootnote c |
| Housing type | |||
| Apartment, flat or double, row, or terrace housing | NR | 19 | LowFootnote d |
| Single detached houses | NR | 12 | LowFootnote d |
| Immigration status | |||
| Immigrant | 22 | 15 | LowFootnote c |
| Non-immigrant | 16 | 14 | LowFootnote c |
| Marital status | |||
| Single or never married | NR | 21 | LowFootnote d |
| Married | NR | 10 | LowFootnote d |
| Work-related indicators | |||
| Job loss or work leave | 39 | NR | Very lowFootnote e |
| Worked full-time continuously | 17 | NR | Very lowFootnote e |
| Absence | |||
| Absent from work | NR | 24 | LowFootnote d |
| Worked without absence | NR | 11 | LowFootnote d |
| Job security | |||
| Job secure | NR | 8 | LowFootnote d |
| Job insecure | NR | 26 | LowFootnote d |
| Government programs | |||
| Applied for CERB | 28 | NR | Very lowFootnote e |
| Applied for EI | 23 | NR | Very lowFootnote e |
| Did not apply for CERB or EI | 11 | NR | Very lowFootnote e |
Abbreviations: CERB, Canada Emergency Response Benefit; EI, employment insurance; GRADE, Grading of Recommendations Assessment, Development and Evaluation; HFI, household food insecurity; INSPQ, Institut national de santé publique du Québec; NR, not reported.
|
|||
| Subpopulations | Prevalence of food insecurity (% | GRADE certainty rating | |
|---|---|---|---|
| INSPQ (2021) | Lamarche et al. (2021) | ||
| General population | 10 | 1 | Very lowFootnote a |
| Age (years) | |||
| 18–44 | Range 14–15 | NR | Very lowFootnote b |
| 60+ | Range 3–4 | NR | Very lowFootnote b |
| Household status | |||
| Households with children | 13 | NR | Very lowFootnote b |
| Households with no children | 9 | NR | Very lowFootnote b |
| Work-related indicators | |||
| Job loss or work leave | 31 | NR | Very lowFootnote b |
Abbreviations: GRADE, Grading of Recommendations Assessment, Development and Evaluation; HFI, household food insecurity; INSPQ, Institut national de santé publique du Québec; NR, not reported.
|
|||
Data by subgroup for all levels of HFI are summarized below. GRADE was applied to all subgroup analyses, as detailed in Tables 4 and 5.
Households with children
Two studies reported higher HFI prevalence in households with versus without children (22% vs. 16% and 19% vs. 12%, respectively); however, no formal statistical tests were conducted for between-group differences, as confidence intervals were not reported in the original studies.Footnote 13Footnote 24
Age
Two studies reported on HFI prevalence and age of the primary respondent.Footnote 13Footnote 24 One study found that the highest prevalence of HFI was in those aged 18 to 44 (range: 21%–22%) and the lowest prevalence in those aged 60 and older (range: 9%–11%).Footnote 24 A second study found that respondents aged 25 to 34 years had the highest HFI prevalence (range: 18%–23%) among all age groups, whereas those aged 65 and older had the lowest prevalence (range: 5%–7%).Footnote 13 No statistical testing was reported for between-group differences.
Gender
Two studies found similar HFI prevalence by respondent’s gender, with 17% in both men and women in one studyFootnote 24 and 15% in men and 14% in women in another study.Footnote 13 A third study found similar prevalence of HFI among middle- and high-income parents in Ontario, ranging from 9% for mothers to 5% for fathers.Footnote 23
Living conditions
One study found that HFI among those living in apartments, flats, or double, row or terrace housing was 19%, and 12% in those living in single, detached houses.Footnote 13 The same study reported HFI in rural (17%) and urban (14%) residents.Footnote 13 A second study found similar HFI prevalence among urban (10% in metropolitan region residents) and rural residents (11%).Footnote 24
Immigrant status
One study found that HFI was 22% among immigrants and 16% among non-immigrants,Footnote 24 while a second found similar HFI prevalence between immigrant status (15% immigrants vs. 14% Canadian-born).Footnote 13
Education
Two studies found HFI prevalence to be between 15% and 20% among those with a high school diploma and 11% to 12% among those with a university degree.Footnote 13Footnote 24
Marital status
One study described HFI prevalence by marital status, reporting 21% HFI among single or never married populations versus 10% among married couples.Footnote 13
Employment circumstances
Two studies found different HFI prevalence by employment circumstances.Footnote 13Footnote 24 One found that among those who were absent from work in the last week because of a business closure or layoff due to COVID-19, the prevalence of HFI was 32% (compared to 11% for those at work without absence). The study also reported that 26% of job-insecure individuals experienced HFI compared with 8% of their job-secure counterparts.Footnote 13 Similarly, a second study found that HFI was high for people experiencing job loss or work leave (39%).Footnote 24 The same study also found that food insecurity was at least twice as prevalent among applicants for Canada Emergency Response Benefit (CERB) (28%) and employment insurance (EI) (23%) as among non-applicants (11%).Footnote 24
Overall, the evidence suggests that the COVID-19 pandemic may have resulted in an increase in prevalence of HFI among the known vulnerable subgroups identified above. Due to the lack of data, we were not able to assess levels of HFI among those with vulnerabilities related to household income or housing status, nor among households with Indigenous members or racialized communities. Their omission should not preclude concern for their continued or increased HFI during the COVID-19 pandemic.
Discussion
The purpose of this systematic review was to determine the prevalence of HFI in Canada during the COVID-19 pandemic in the general population and in subpopulations. We found four studies that assessed HFI, three in the early pandemic during the first wave (April–May 2020) and one during the third wave (April 2021). These studies reported a prevalence of 14% to 17% for the general population. Results further indicated that households with children, households with members who had lost their jobs or stopped working due to the pandemic and households where members faced job insecurity (might lose job) had the highest prevalence of HFI. In addition, working-age populations (aged 18–44) were most affected; however, these differences should be interpreted cautiously; no statistical testing was conducted to determine whether differences were statistically significant, as confidence intervals were not reported in these studies. Consistent with prepandemic studies, there were low rates of HFI among seniors, in line with previous evidence demonstrating the protectiveness of the guaranteed annual income pension program.Footnote 25
The certainty of evidence for most findings was low to very low, which means the interpretations could change as new research findings emerge. We believe that the true prevalence of HFI may be greater than reported in these studies, particularly among vulnerable subgroups such as those living in remote regions of Canada, low-income individuals and those in tenuous living situations—not all of whom were captured by the studies included in this review. The reasons for this are explicated below.
First, HFI in territories, remote or isolated communities and Indigenous populations was not specifically assessed in any of the studies, due to a lack of data. The prevalence of HFI has traditionally been higher in these populations, and while they represent a small population, their exclusion could contribute to an overall underestimation of HFI prevalence in Canada. Two of the four studies were conducted in Quebec, which had the lowest HFI prevalence rate of all the provinces and territories before the pandemic, in 2017–2018 (11.1% vs. 12.7% across Canada).Footnote 1
Second, all data came from web-based surveys, which may have favoured the participation of more affluent populations with more time and resources, and underrepresented disadvantaged populations who are at higher risk of HFI. For instance, two studies included a large proportion of older people, who are traditionally more food secure than the general population of Canada,Footnote 22Footnote 24 and two studies included a large proportion of people with a higher average income (> CAD 100 000) than the general population.Footnote 22Footnote 23 Such populations tend to have lower rates of HFI. Thus, the use of a web survey may have underestimated the prevalence of HFI.
Third, as data were mostly collected in the early pandemic (April–May 2020), some households may not yet have fully experienced the impact of employment and income loss on their HFI.
Fourth, a 7-day or 30-day reference period is not as sensitive as a 12-month period to capture HFI, and thus we would expect HFI over the year to be higher. Given that three of the four studies were conducted at the start of the COVID-19 pandemic,Footnote 13Footnote 22Footnote 23 it was not possible for researchers to use a 12-month period to calculate HFI during the pandemic. However, as the pandemic has now been ongoing for nearly two years at the time of writing, future studies should use an expanded time period to collect these data.
To determine whether the COVID-19 pandemic–associated public health measures influenced HFI prevalence, a comparison to prepandemic data is needed. While a direct comparison of these data to prepandemic levels of HFI is not possible due to differences in methodology, we are nonetheless able to make indirect comparisons using Statistics Canada data. A recent report, utilizing the CPSS-2 data, found that one in seven households in the 10 provinces were affected by HFI in April 2020.Footnote 20 After adjusting for differences in the questionnaire and reference time period, the authors found that food insecurity was significantly higher during the early COVID-19 pandemic in comparison to Statistics Canada 2017–2018 data:Footnote 21 14.6% versus 10.5%, respectively. Unfortunately, this was a 30-day measure collected in April 2020 and we do not have data describing what happened after this date. Data from the Institut national de santé publique du Québec (INSPQ) at various time points between August 2020 and April 2021 demonstrate that HFI remained relatively stable in Quebec over time (range: 17%–19%)Footnote *; however, these findings may not be directly generalizable to other Canadian provinces and territories.
This review shows that people in working-age households, households with children and those who either lost their jobs or were job insecure may have suffered the highest levels of HFI. While the COVID-19 pandemic did not create HFI in Canada, many of the subpopulations with high HFI are also some of the most impacted by employment and income loss as a result of the pandemic. HFI is tightly linked to income and reflects the broader material circumstances of households, such as income, assets like property, and other resources that a household could draw upon.Footnote 1 It seems that HFI was particularly prevalent among workers who were not able to work due to the pandemic business closures.Footnote 13Footnote 24 Between February and April 2020, half of job losses occurred in the bottom earnings quartile, disproportionately affecting the younger, hourly paid, and non-unionized workers.Footnote 26 Between March and May 2020, nearly half of the residents in the 10 provinces indicated that the COVID-19 pandemic had impacted their ability to meet financial obligations or essential needs.Footnote 27
Taken together, findings point to the role that financial resources and income play in HFI. Benefit programs, such as the CERB and the Canada Recovery Benefit (CRB), may have offset some of the impact on certain Canadian households. CERB was launched on 6 April 2020 and ran through September 2020, when it was replaced by the CRB for unemployed workers ineligible for EI. The aim of these programs was to provide temporary income to Canadians who faced unemployment due to the COVID-19 pandemic. As most of the data in this review were collected in the early pandemic (April–May 2020), some of the benefits from CERB and other programs may have been missed.
Food banks are another intervention commonly used to address food insecurity in the short term, but data both prior to and during the pandemic show that very few food-insecure households use food banks on a regular basis.Footnote 13 Two studiesFootnote 13Footnote 20 utilizing the CPSS-2 dataset assessed food bank usage during the early pandemic in May 2020. Polsky et al.Footnote 20 found that only 9.3% of food-insecure households had used a community organization to access free food within the last month. Men and TarasukFootnote 13 reported that only 4.3% of households used food charity more than once in the last month. Given the low usage of food banks, other solutions that target issues of chronic poverty are required, particularly within the context of the pandemic and pandemic recovery periods.
Strengths and limitations
Findings from this review should be interpreted with caution, given a number of limitations. First, there is very limited evidence, as only three peer-reviewed and one non–peer reviewed study were identified. Second, with the exception of the CPSS-2 data, the data were limited to a single province or city, and no study included data from the territories. Third, most studies used convenience samples that favoured populations with higher socioeconomic status. While three studies used weighting methods to approximate the target population, this may provide only part generalizability, as the weighted data were still skewed in some instances. Fourth, most of the evidence is from the early pandemic (April–May 2020), with the exception of the INSPQ data (April 2021), thus we are unable to assess trends over time. Fifth, there is very serious risk of bias related to three of the four studies included. Therefore, the results should be interpreted with caution, as newly emerging evidence may change the interpretation of the results of this review. Sixth, the measures used to assess HFI differed across the four studies and we were therefore unable to pool data. Seventh, the expedited screening process may have introduced some risk of bias, due to not using two independent reviewers for screening.
Moving forward, we recommend further research on trends in HFI over time from high-quality representative surveys to compare early in the pandemic to later time points. Standardization of HFI measures is also needed to allow comparisons across populations and time. In addition, it will be important to capture other subgroups such as racialized populations, Indigenous people, LGBTQ+ communities, single parents, isolated or remote communities and people living in the territories, all of which have had traditionally higher rates of HFI. Finally, the impact of policy interventions, such as the CERB, is still unknown. Focussed research is required to determine the effect that these types of programs may have had on mitigating HFI.
Conclusion
This research draws attention to the important issue of food insecurity in Canada, especially as it affects vulnerable groups, and it adds to the limited information available that is specific to COVID-19. This review identifies knowledge gaps and can inform actions for HFI, specifically within the Canadian pandemic context. HFI is not a new issue related to the pandemic but a longstanding and prevalent problem that may have been exacerbated by the pandemic. The COVID-19 pandemic disrupted financial resources for many households, especially low-income households, those with young children, and those in tenuous work environments. Loss or reduction in employment due to the pandemic shutdown likely contributed to HFI. Populations most vulnerable to HFI appear to be households with working-age members who lost their employment or were job insecure, and households with children. This is not a departure from prepandemic vulnerable populations; the pandemic has only shone a spotlight on the already affected populations.
Acknowledgements
The authors wish to thank Veronica Belcourt and Laura Boland for their help with the GRADE assessments, as well as the Rapid Evidence Service team at the National Collaborating Centre for Methods and Tools, including Emily Belita, Emily Clark, Leah Hagerman, Izabelle Siqueira and Taylor Colangeli.
Conflicts of interest
The authors have no conflicts of interest.
Authors’ contributions and statement
LI, GG and AJG contributed to the conceptualization of the work; LI, GG and TC conducted the data extraction, risk of bias and GRADE assessment; LI and GG jointly drafted the manuscript; VT, LM, SNS, MD, SS, TC and AJG contributed to the interpretation of the data and revised the manuscript critically for important intellectual content; all co-authors reviewed, edited and approved the final manuscript.
The content and views expressed in this article are those of the authors and do not necessarily reflect those of the Government of Canada.