
Original quantitative research – Examining the use of decision trees in population health surveillance research: an application to youth mental health survey data in the COMPASS study

HPCDP Journal Home
Published by: The Public Health Agency of Canada
Date published: February 2023
ISSN: 2368-738X
Submit a manuscript
About HPCDP
Browse
Previous | Table of Contents | Next
Katelyn Battista, MMathAuthor reference footnote 1; Liqun Diao, PhDAuthor reference footnote 2; Karen A. Patte, PhDAuthor reference footnote 3; Joel A. Dubin, PhDAuthor reference footnote 1Author reference footnote 2; Scott T. Leatherdale, PhDAuthor reference footnote 1
https://doi.org/10.24095/hpcdp.43.2.03
This article has been peer reviewed.
Author references
Correspondence
Katelyn Battista, School of Public Health Sciences, University of Waterloo, 200 University Avenue West, Waterloo, ON N2L 3G1; Tel: 519-888-4567 x 46706; Email: kbattista@uwaterloo.ca
Suggested citation
Battista K, Diao L, Patte KA, Dubin JA, Leatherdale ST. Examining the use of decision trees in population health surveillance research: an application to youth mental health survey data in the COMPASS study. Health Promot Chronic Dis Prev Can. 2023;43(2):73-86. https://doi.org/10.24095/hpcdp.43.2.03
Abstract
Introduction: In population health surveillance research, survey data are commonly analyzed using regression methods; however, these methods have limited ability to examine complex relationships. In contrast, decision tree models are ideally suited for segmenting populations and examining complex interactions among factors, and their use within health research is growing. This article provides a methodological overview of decision trees and their application to youth mental health survey data.
Methods: The performance of two popular decision tree techniques, the classification and regression tree (CART) and conditional inference tree (CTREE) techniques, is compared to traditional linear and logistic regression models through an application to youth mental health outcomes in the COMPASS study. Data were collected from 74 501 students across 136 schools in Canada. Anxiety, depression and psychosocial well-being outcomes were measured along with 23 sociodemographic and health behaviour predictors. Model performance was assessed using measures of prediction accuracy, parsimony and relative variable importance.
Results: Decision tree and regression models consistently identified the same sets of most important predictors for each outcome, indicating a general level of agreement between methods. Tree models had lower prediction accuracy but were more parsimonious and placed greater relative importance on key differentiating factors.
Conclusion: Decision trees provide a means of identifying high-risk subgroups to whom prevention and intervention efforts can be targeted, making them a useful tool to address research questions that cannot be answered by traditional regression methods.
Keywords: decision trees, population health, survey methods, mental health, youth
Highlights
- Decision trees can be used within population health research to address important research questions that cannot be answered by traditional regression methods.
- A key advantage of decision trees over regression models is the ability to examine complex interactions among risk factors.
- Decision trees can be used to identify high-risk groups to whom prevention and intervention efforts can be targeted.
- While regression models may have higher prediction accuracy in some settings, decision trees place greater emphasis on key differentiating factors.
Introduction
Population health surveillance research is often carried out using large-scale survey studies that attempt to assess the impacts of wide-ranging social, economic and environmental factors on various health outcomes. The relationship between these factors and health outcomes is often characterized by complex interactions that make it impractical to identify any single factor as causal. In the context of youth mental health, outcomes have previously been associated with socioeconomic status,Footnote 1 weight status,Footnote 2 dietary behaviours,Footnote 3 physical activity and sedentary behaviours,Footnote 4 sleep habits,Footnote 5 cannabis use,Footnote 6 bullying,Footnote 7 school connectednessFootnote 8Footnote 9 and peer and family relationships,Footnote 10Footnote 11 among other factors. However, most research studies focus on examining the impact of any given factor or domain of factors in isolation; in reality, the underlying interrelationships are likely more complex.
Associations are often examined using regression models, which estimate the association between a predictor and an outcome while controlling for other factors. However, these models are rarely used to estimate complex interactions between factors, due to computational limitations and difficulty in interpretation. Additionally, the resulting model estimates do not allow for the development of risk profiles, that is, separating subjects into subgroups based on certain combinations of risk factors. The identification of high-risk subgroups is important to efficiently target resources and interventions. Decision trees comprise a different class of models that are ideally suited for segmenting populations and examining complex interactions among factors.Footnote 12
Decision trees are commonly used in clinical research that focusses on screening and diagnostics,Footnote 13 with emphasis on prediction. Decision trees are less common in population health research, where the focus is on understanding associations and identifying subgroups for targeting behavioural interventions, though their use is increasing. Within the domain of mental health, recent studies using decision trees have primarily examined associations with depressionFootnote 14Footnote 15Footnote 16Footnote 17Footnote 18Footnote 19 and suicide risk.Footnote 15Footnote 20Footnote 21Footnote 22Footnote 23Footnote 24Footnote 25Footnote 26Footnote 27Footnote 28
Two studies examined depression outcomes in youth populations specifically. Hill et al.Footnote 16 found that, among students with subclinical depressive symptoms at baseline, friend support was protective against developing major depressive disorder by age 30, with anxiety disorder and substance use disorder increasing risk among those without friend support. Seeley, Stice and RohdeFootnote 18 found poor school functioning to be a primary risk factor for major depressive disorder onset among girls with elevated depressive symptoms at baseline, with parental support acting as a protective factor only among girls with low levels of baseline depressive symptoms. Three studies examined suicide ideation in youth populations and found that mediating factors such as family relationshipsFootnote 22Footnote 26 and social supportFootnote 22Footnote 24 were only protective among students that did not have high levels of depression.
Among the studies mentioned above, few included direct performance comparisons between tree and regression methods. Smaller studies by Burke et al.,Footnote 21 Mitsui et al.Footnote 15 and Handley et al.Footnote 27 found regression models had higher predictive accuracy than corresponding tree models; however, these studies had small sample sizes (ranging from 359 to 2194 participants). Conversely, two larger studies—one by Dykxhoorn et al.Footnote 23 examining a longitudinal sample of 11 088 children, and another by Batterham et al.Footnote 17 examining a longitudinal study of 6605 adults—found decision trees to outperform corresponding logistic regression in terms of sensitivity and overall predictive accuracy. Thus, while there is some evidence to suggest that decision trees may have advantages over traditional regression methods in the case of larger sample sizes, there is an overall lack of available evidence within the domain of mental health.
Despite growing use of decision trees, regression models remain commonplace in the population health literature. This results in a missed opportunity to understand the complex interactions among risk factors and to identify high-risk subgroups to which prevention and intervention efforts can be targeted. The aim of this study was therefore to examine the use of decision trees in the analysis of large-scale population health surveillance data. In this paper, we first provide an overview of two popular types of decision tree, the classification and regression tree (CART) and the conditional inference tree (CTREE) techniques. Next, the performance of decision tree models is compared to traditional linear and logistic regression models through an application to youth mental health outcomes in the COMPASS study.Footnote 29 Tree and regression methods are evaluated based on prediction accuracy and parsimony, with additional considerations given to relative variable importance and model interpretability.
Methods
Background on decision trees
Decision trees are statistical models that examine an outcome of interest by partitioning the sample into distinct subgroups based on predictor variables. The subgroups are determined using a series of binary splits that resemble a tree structure. Various types of decision tree algorithms have been developed;Footnote 30 this analysis focusses on two popular types of decision tree: CART and CTREE. Methodological overviews of CART and CTREE in the context of epidemiological research have been previously published;Footnote 12Footnote 13 a summary of important features follows.
Classification and regression trees
CART is a widely used class of decision tree for categorical (classification) and continuous (regression) outcomes. Originally developed by Breiman et al.,Footnote 31 CART methods find optimal splits of the sample into subgroupsFootnote 32 such that subjects within a subgroup are similar and subjects across subgroups are as different as possible. Optimal splits are determined by recursively choosing the variables and cut-off levels that produce maximum separation among subgroups and minimal within-group variability with respect to the outcome.Footnote 32 Continuous and categorical variables may be split multiple times throughout the tree on different cut-points. Splitting occurs until a stopping rule is reached, typically based on minimum subgroup size.Footnote 12Footnote 32Footnote 33 Through this recursive process, the predictor space is divided into a final set of subgroups, for which the mean outcome value (regression trees) or the percent of the subgroup having the outcome (classification trees) is calculated.Footnote 33
A large tree grown by recursively splitting the predictor space tends to overfit the sample data, resulting in poor generalizability. Overfitting is mitigated using tree pruning and a cross-validation procedure, in which the large tree is pruned leading to a sequence of nested subtrees from among which an optimal tree is selected. The most commonly used pruning method is cost complexity pruning, in which an increasing sequence of complexity parameters corresponds to a sequence of nested subtrees with decreasing sizes.Footnote 33Footnote 34 The optimal subtree that minimizes the average error based on cross-validationFootnote 33 is then chosen. When working with larger samples, the “1-SE” rule is often used to choose the smallest subtree that has an average error within one standard deviation of the overall minimum error.Footnote 12Footnote 13
Conditional inference trees
CTREE is an alternative to CART developed by Hothorn et al.Footnote 35 While CART chooses the optimal split at each step among all potential variable and splitting points simultaneously, CTREE separates the splitting determination into two steps. First, the optimal variable to split on is chosen based on the strongest association to the outcome. Association to the outcome variable is measured using regression models appropriate for the outcome, for example, linear regression for continuous outcomes and logistic regression for binary outcomes.Footnote 12Footnote 35 The covariate with the smallest p value is chosen for splitting. Second, the optimal splitting point for that variable is determined.Footnote 12Footnote 35 This approach mitigates the selection bias toward variables with many splitting points often found in CART.Footnote 12Footnote 35 This splitting process continues recursively among each subgroup until a stopping rule is reached. As with CART, continuous and categorical variables can be split more than once throughout the tree at different cut-points.
The stopping rule for CTREE is based on a global null hypothesis: the algorithm stops splitting when no covariates have a significant association to the outcome based on a prespecified significance level (alpha; α).Footnote 12Footnote 35 For large samples, additional stopping criteria based on minimum subgroup sizes can also be used. No pruning is required in CTREE; the global test for significance acts as a means to prevent overfitting.Footnote 12Footnote 35
Application
The relative performance of decision trees and regression methods was compared in the context of population surveillance research using youth mental health data from the COMPASS study.Footnote 29
Ethics approval, study design and sample
COMPASS is a prospective cohort study designed to collect hierarchical health data from Canadian secondary school students.Footnote 29 COMPASS has received ethics clearance from the University of Waterloo Research Ethics Board (ORE 30118). Additional details about the COMPASS host study are available in printFootnote 29 and online.
We used student-level data from Year 7 (2018/19) of the COMPASS study. The sample consists of 74 501 students from 136 schools in Ontario (61 schools), Alberta (8 schools), British Columbia (15 schools) and Quebec (52 schools). COMPASS uses purposeful sampling to recruit whole-school samples based on their use of active-information, passive-consent parental permission protocols. The participation rate for 2018/19 was 81.9%, with the primary reason for nonparticipation being absenteeism or scheduled spare on the data collection date.
Measures
The COMPASS student questionnaire is a paper-based questionnaire completed by students during class time. The questionnaire is anonymous and self-administered, and students may decline to participate at any time. This study examined 5 mental health outcome measures related to depression, anxiety and psychosocial well-being (flourishing), as well as 23 core predictor measures related to demographics, body weight, healthy eating, movement behaviours, substance use, bullying, academics and school support, and perceived family and friend support.
Mental health outcomes
Depression
Depression is measured using the Center for Epidemiologic Studies Depression 10-item scale (CESD-10),Footnote 36Footnote 37 which has been validated in adolescent populations.Footnote 38 The CESD-10 is measured as a continuous score ranging from 0 to 30, with higher scores indicating greater degrees of depressive symptomatology and risk of unipolar depression. An additional binary measure of depression is used, with students scoring greater than or equal to 10 classified as having clinically relevant depressive symptoms.
Anxiety
Anxiety is measured using the Generalized Anxiety Disorder 7-item Scale (GAD-7),Footnote 39 which has been validated in adolescent populations.Footnote 40 The GAD-7 is measured as a continuous score ranging from 0 to 21, with higher scores indicating greater levels of anxiety. An additional binary measure of anxiety is used, with students scoring greater than or equal to 10 classified as having clinically relevant anxiety symptoms.
Flourishing
Flourishing is a component of psychological well-being and is measured using a modified version of Diener’s Flourishing Scale (FS),Footnote 41 which has been validated in young adults.Footnote 42 The FS is a continuous score ranging from 8 to 40, with higher scores indicating greater levels of flourishing.
Predictor variables
Demographic predictor variables include age, sex, ethnicity and weekly spending money (a proxy for socioeconomic status). Body weight is measured using weight perception and body mass index (BMI) classification. Healthy eating is measured using a binary indicator of whether students eat breakfast daily, as well as the number of servings of fruits and vegetables consumed daily. Movement behaviours are assessed using minutes of average daily moderate-to-vigorous physical activity (MVPA), minutes of total daily screen time and daily minutes of sleep. Substance use is measured using binary indicators of past-month use of tobacco, e-cigarettes and cannabis, as well as past-month binge drinking. Bullying is measured using two indicators: whether a student was bullied or had bullied others in the past 30 days. Academics and school support are measured using a binary indicator of whether students expect to attend a postsecondary institution, the number of classes skipped in the past four weeks and a continuous school connectedness score (with higher scores indicating higher levels of connection to school). Perceived family and friend support are measured using binary indicators of having a happy home life, feeling able to talk about problems with family and feeling able to talk about problems with friends.
In addition to the student-level measures, additional school-level predictors include total school enrolment, province, school area median income and school urbanicity. Measures of income and urbanicity are taken from Statistics Canada’s 2016 census and values linked by school forward sortation area.Footnote 43Footnote 44
Analysis
Individual mental health scale items were person-mean imputed for students missing one or two items. While mean imputation may artificially reduce variance, more complex imputation methods were not used given the primary focus of the analysis on performance rather than inference. Students with missing or outlier values on any variables were removed, resulting in a final complete case sample of 52 350 students. Sample characteristics are provided in Table 1. The sample was randomly split into training (41 795; 80%) and test (10 555; 20%) samples.
| Category | Variable | Levels | n | % |
|---|---|---|---|---|
| Total | 52 350 | 100.0% | ||
| Mental health outcomes | CESD-10 scale | Mean (SD) | 8.50 (5.85) | N/A |
| GAD-7 scale | Mean (SD) | 6.02 (5.31) | N/A | |
| Flourishing scale | Mean (SD) | 32.42 (5.39) | N/A | |
| Depression | No | 33 778 | 64.5% | |
| Yes | 18 572 | 35.5% | ||
| Anxiety | No | 40 568 | 77.5% | |
| Yes | 11 782 | 22.5% | ||
| Demographic factors | Sex | Female | 27 483 | 52.5% |
| Male | 24 867 | 47.5% | ||
| Age (years) | 12 | 2 310 | 4.4% | |
| 13 | 4 564 | 8.7% | ||
| 14 | 10 282 | 19.6% | ||
| 15 | 12 221 | 23.3% | ||
| 16 | 12 198 | 23.3% | ||
| 17 | 8 628 | 16.5% | ||
| 18 | 2 147 | 4.1% | ||
| Ethnicity | White | 37 370 | 71.4% | |
| Black | 1 565 | 3.0% | ||
| Asian | 5 559 | 10.6% | ||
| Latin American | 1 235 | 2.4% | ||
| Other/multi | 6 621 | 12.6% | ||
| Spending money | $0 | 8 099 | 15.5% | |
| $1–$20 | 12 701 | 24.3% | ||
| $21–$40 | 5 796 | 11.1% | ||
| $41–$100 | 6 469 | 12.4% | ||
| More than $100 | 10 067 | 19.2% | ||
| Don’t know | 9 218 | 17.6% | ||
| Province | Alberta | 2 222 | 4.2% | |
| British Columbia | 7 298 | 13.9% | ||
| Ontario | 20 450 | 39.1% | ||
| Quebec | 22 380 | 42.8% | ||
| Urbanicity | Large urban | 28 684 | 54.8% | |
| Medium urban | 5 044 | 9.6% | ||
| Small urban/rural | 18 622 | 35.6% | ||
| School median income (in thousands CAD) | Mean (SD) | 67.33 (17.47) | N/A | |
| School size (in hundreds of students) | Mean (SD) | 8.49 (3.52) | N/A | |
| Body weight and eating behaviours | Weight perception | Underweight | 8 300 | 15.9% |
| About the right weight | 31 877 | 60.9% | ||
| Overweight/obese | 12 173 | 23.3% | ||
| BMI classification | Underweight | 985 | 1.9% | |
| Normal weight | 29 932 | 57.2% | ||
| Overweight | 6 465 | 12.3% | ||
| Obese | 2 843 | 5.4% | ||
| Not stated | 12 125 | 23.2% | ||
| Eat breakfast daily | No | 25 373 | 48.5% | |
| Yes | 26 977 | 51.5% | ||
| Servings of fruits and vegetables | Mean (SD) | 2.98 (1.93) | N/A | |
| Movement behaviours | Average daily physical activity (min) | Mean (SD) | 96.40 (62.14) | N/A |
| Screen time (min) | Mean (SD) | 350.97 (178.28) | N/A | |
| Sleep time (min) | Mean (SD) | 451.94 (74.78) | N/A | |
| Current substance use | Tobacco use | No | 49 349 | 94.3% |
| Yes | 3 001 | 5.7% | ||
| E-cigarette use | No | 38 570 | 73.7% | |
| Yes | 13 780 | 26.3% | ||
| Binge drinking | No | 44 020 | 84.1% | |
| Yes | 8 330 | 15.9% | ||
| Cannabis use | No | 46 683 | 89.2% | |
| Yes | 5 667 | 10.8% | ||
| Bullying in the last 30 days | Was bullied | No | 46 412 | 88.7% |
| Yes | 5 938 | 11.3% | ||
| Bullied others | No | 49 702 | 94.9% | |
| Yes | 2 648 | 5.1% | ||
| Academics and school support | Expect to attend postsecondary institution | No | 12 380 | 23.6% |
| Yes | 39 970 | 76.4% | ||
| Classes skipped in past 4 weeks | 0 classes | 34 894 | 66.7% | |
| 1 or 2 classes | 10 634 | 20.3% | ||
| 3 to 5 classes | 4 246 | 8.1% | ||
| 6 or more classes | 2 576 | 4.9% | ||
| School connectedness score | Mean (SD) | 18.67 (3.14) | N/A | |
| Family and peer support | Happy home life | No | 10 219 | 19.5% |
| Yes | 42 131 | 80.5% | ||
| Talk about problems with family | No | 20 770 | 39.7% | |
| Yes | 31 580 | 60.3% | ||
| Talk about problems with friends | No | 12 748 | 24.4% | |
| Yes | 39 602 | 75.6% | ||
CART and CTREE were run for continuous (CESD-10, GAD-7, FS) and binary outcomes (depression, anxiety). CART pruning was performed using 10-fold cross-validation and the 1-SE rule. CTREE significance was set at α = 0.05 with a Bonferroni adjustment for multiple testing. Given the large sample size, an additional stopping rule was included for both CART and CTREE to limit the minimum number of observations per bucket to 1% of the sample. Linear and logistic regression models were also run for continuous and binary outcomes including all main effects. Backward variable selection using the Akaike information criterion (AIC) was performed to mimic tree pruning.
Fitted models from the training sample were applied to the test sample. Predictive performance was compared using adjusted R2 (R2adj) and root mean square error (RMSE) for continuous outcomes, and percent classification accuracy (pCA) and area under the receiving operator characteristic curve (AUC) for binary outcomes. R2adj is the amount of variation explained by the model, adjusted for the number of covariates, such that R2adj will decrease if inclusion of a given covariate does not substantially increase the explained variation. RMSE is the average of the squared difference between the actual and predicted outcome values.Footnote 33 The closer the predicted values are to the true values, the lower the RMSE. pCA simply measures the percentage of observations for which the model correctly assigns the outcome value. AUC (also known as the concordance statistic) is a more sophisticated measure of accuracy that accounts for both the sensitivity and specificity of the model.Footnote 32 Both measures range from 0 to 1, with higher values indicating higher model accuracy.
Parsimony was evaluated using the number of parameters and unique variables in the model. Relative variable importance measures were calculated based on the decrease in model fit resulting from removing a given variable from each model. For decision trees, this is measured by the sum of the goodness of split for all occurrences where the variable is used as a primary or surrogate split. For linear and logistic regression models, this is measured by the decrease to R2adj and AUC, respectively.
R version 4.0.3 (R Foundation for Statistical Computing, Vienna, AT) was used for all analyses. The functions “rpart” (package “rpart”) and “ctree” (package “partykit”) were used for CART and CTREE models, respectively. The functions “lm” and “glm” (package “MASS”) were used for linear and logistic regression models, respectively.
Results
The average CESD-10 score in the sample was 8.50 (SD = 5.85) with 33.5% of the sample classified as having clinically relevant depressive symptoms. The average GAD-7 score was 6.02 (SD = 5.31) with 22.5% classified as having clinically relevant anxiety symptoms. The average FS score was 32.42 (SD = 5.39).
Decision tree and regression model comparison
As an illustrative example, the CART and logistic regression model results for the binary anxiety outcome are presented. The final fitted CART tree for the binary anxiety outcome is presented in Figure 1. The model identified 9 final subgroups using 5 unique variables. The primary splitting variable was whether students indicated having a happy home life. Both subgroups were then split based on school connectedness, though different cut-off points were used. Splits were also made for some subgroups on sex, sleep duration and whether the student was bullied. The largest final subgroup was of students who indicated having a happy home life and had school connectedness scores of 17.5 or greater, making up 61% of the sample. Within this group, the probability of having clinically relevant anxiety symptoms was 12.7%, which was the lowest of all groups. The highest-risk subgroup comprised females who indicated not having a happy home life and low school connectedness (< 16.25), with a 64.6% probability of having clinically relevant anxiety symptoms.
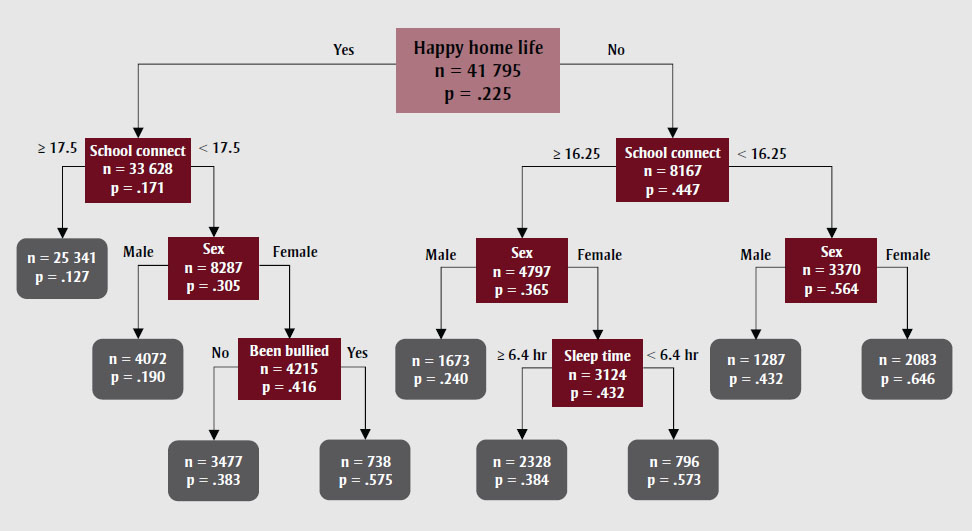
Figure 1 - Text description
| Category | n | Percentage of the subgroup |
|---|---|---|
| Happy home life | 41 795 | .225 |
| Yes | ||
| School connectedness | 33 628 | .171 |
| ≥ 17.5 | 25 341 | .127 |
| < 17.5 | ||
| Sex | 8287 | .305 |
| Male | 4072 | .190 |
| Female | ||
| Been bullied | 4215 | .416 |
| No | 3477 | .383 |
| Yes | 738 | .575 |
| No | ||
| School connectedness | 8167 | .447 |
| ≥ 16.25 | ||
| Sex | ||
| Male | 1673 | .240 |
| Female | ||
| Sleep time | ||
| ≥ 6.4 hours | 2328 | .384 |
| < 6.4 hours | 796 | .573 |
| < 16.25 | ||
| Sex | ||
| Male | 1287 | .432 |
| Female | 2083 | .646 |
Abbreviations: CART, classification and
regression tree; GAD-7, Generalized Anxiety Disorder 7-item Scale; hr, hours; school
connect, school connectedness.
Note: n is the number of students in subgroup; p is
the percentage of the subgroup with clinically relevant anxiety symptoms.
The logistic regression model result for anxiety is presented in Table 2. The final model after applying backward variable selection included 20 variables (33 parameters). Like the CART model, having a happy home life (odds ratio [OR]: 0.33; 95% CI: 0.31–0.34), male sex (OR: 0.33; 95% CI: 0.31–0.34) and school connectedness (OR: 0.88; 95% CI: 0.87–0.89) were found to be important predictors. Other factors including minority ethnicity, higher spending money, living in Quebec, small urban or rural urbanicity, “about right” weight perception, eating breakfast daily, higher sleep time and feeling able to talk about problems with family and friends were associated with lower odds of having clinically relevant anxiety symptoms. Older age, eating more fruits and vegetables, higher screen time, current tobacco use and e-cigarette use, being bullied, expecting to attend a postsecondary institution and skipping classes were associated with higher odds of having clinically relevant anxiety symptoms.
| Variable | Level | AOR (95% CI) |
|---|---|---|
| Sex (ref = female) | Male | 0.33 (0.31–0.34)Footnote *** |
| Age (years) | per year | 1.05 (1.02–1.07)Footnote *** |
| Ethnicity (ref = White) | Black | 0.5 (0.43–0.59)Footnote *** |
| Asian | 0.73 (0.66–0.81)Footnote *** | |
| Latin American | 0.83 (0.7–0.98)Footnote * | |
| Other/multi | 1.01 (0.94–1.09) | |
| Spending money (ref = $0) | $1–$20 | 0.93 (0.85–1.01) |
| $21–$40 | 0.86 (0.77–0.95)Footnote ** | |
| $41–$100 | 0.87 (0.79–0.96)Footnote ** | |
| More than $100 | 0.94 (0.86–1.03) | |
| Don’t know | 0.87 (0.79–0.96)Footnote ** | |
| Province (ref = Alberta) | British Columbia | 0.89 (0.77–1.03) |
| Ontario | 0.92 (0.81–1.05) | |
| Quebec | 0.66 (0.58–0.76)Footnote *** | |
| Urbanicity (ref = large urban) | Medium urban | 1.02 (0.93–1.12) |
| Small urban/rural | 0.86 (0.80–0.91)Footnote *** | |
| Weight perception (ref = underweight) | About the right weight | 0.78 (0.72–0.84)Footnote *** |
| Overweight | 1.03 (0.95–1.12) | |
| Eat breakfast daily | Yes | 0.76 (0.72–0.8)Footnote *** |
| Servings of fruits and vegetables | per serving | 1.03 (1.01–1.04)Footnote *** |
| Screen time (hours) | per hour | 1.05 (1.05–1.05)Footnote *** |
| Sleep time (hours) | per hour | 0.83 (0.83–0.83)Footnote *** |
| Current tobacco use | Yes | 1.12 (1.00–1.25)Footnote * |
| Current e-cigarette use | Yes | 1.08 (1.01–1.15)Footnote * |
| Was bullied in last 30 days | Yes | 2.03 (1.88–2.18)Footnote *** |
| Expect to attend postsecondary institution | Yes | 1.16 (1.09–1.24)Footnote *** |
| Classes skipped in past 4 weeks (ref = 0 classes) | 1–2 classes | 1.06 (0.99–1.13) |
| 3–5 classes | 1.16 (1.06–1.28)Footnote ** | |
| 6 or more classes | 1.23 (1.10–1.39)Footnote *** | |
| School connectedness score | per unit | 0.88 (0.87–0.89)Footnote *** |
| Happy home life | Yes | 0.50 (0.47–0.54)Footnote *** |
| Talk about problems with family | Yes | 0.73 (0.69–0.77)Footnote *** |
| Talk about problems with friends | Yes | 0.75 (0.71–0.8)Footnote *** |
Prediction accuracy and parsimony
Prediction accuracy results for continuous outcomes (CESD-10, GAD-7, FS) are presented in Table 3. The linear regression models had the highest test set R2adj and lowest RMSE for all three outcomes. The R2adj and RMSE values were similar for CART and CTREE models, with R2adj consistently 4% to 5% lower than the linear regression results and RMSE 0.13 to 0.19 higher. The CART trees included the fewest unique variables, followed by CTREE, with linear regression models including over twice as many variables. However, the number of final parameters (corresponding to number of splits for tree models) was similar for CART and linear regression, and higher for CTREE models. The absolute value of the R2adj was relatively low for all models, indicating the predictors explain less than half of the variation in the outcome. Additionally, the R2adj and RMSE calculated on the test set were similar to the training set for all models, suggesting minimal overfitting.
Prediction accuracy results for binary depression and anxiety outcomes are presented in Table 3. CART produced more parsimonious models than CTREE and logistic regression, using only 9 splits on 6 variables for depression, and 8 splits on 5 variables for anxiety. CTREE produced more complex models, using over 50 splits. The larger difference between number of subgroups and variables used in the CTREE models compared to the CART models is partially due to the model splitting on the same variable multiple times using different cut-points. Logistic regression models included 22 unique variables for depression and 20 for anxiety. Despite the difference in model complexity, the test set pCA and AUC were very similar across models, with logistic regression performing only slightly better. The absolute value of the AUC was 0.71 for depression and ranged from 0.59 to 0.63 for anxiety, which suggests mediocre discriminatory ability. As in the continuous case, training and test set performances were similar, suggesting minimal overfitting.
| Continuous outcome | Method | # Parameters | # Unique variables | Training R2adj | Training RMSE | Test R2adj | Test RMSE |
|---|---|---|---|---|---|---|---|
| CESD-10 | CART | 38 | 9 | 0.35 | 4.73 | 0.33 | 4.76 |
| CTREE | 57 | 10 | 0.36 | 4.70 | 0.34 | 4.73 | |
| Linear reg. | 34 | 20 | 0.39 | 4.59 | 0.38 | 4.57 | |
| GAD-7 | CART | 39 | 11 | 0.28 | 4.50 | 0.27 | 4.55 |
| CTREE | 63 | 15 | 0.29 | 4.49 | 0.27 | 4.55 | |
| Linear reg. | 40 | 23 | 0.32 | 4.39 | 0.31 | 4.42 | |
| FS | CART | 43 | 9 | 0.47 | 3.94 | 0.46 | 3.97 |
| CTREE | 70 | 12 | 0.47 | 3.93 | 0.46 | 3.96 | |
| Linear reg. | 40 | 24 | 0.51 | 3.79 | 0.51 | 3.78 |
| Binary outcome | Method | # Parameters | # Unique variables | Training pCA | Training AUC | Test pCA | Test AUC |
|---|---|---|---|---|---|---|---|
| Depression | CART | 9 | 6 | 0.75 | 0.71 | 0.74 | 0.70 |
| CTREE | 53 | 14 | 0.75 | 0.71 | 0.74 | 0.70 | |
| Logistic reg. | 39 | 22 | 0.76 | 0.71 | 0.76 | 0.70 | |
| Anxiety | CART | 8 | 5 | 0.80 | 0.60 | 0.79 | 0.59 |
| CTREE | 52 | 11 | 0.80 | 0.61 | 0.79 | 0.61 | |
| Logistic reg. | 34 | 20 | 0.80 | 0.63 | 0.80 | 0.63 | |
Relative variable importance
Relative variable importance percentages for continuous outcomes (CESD-10, GAD-7, FS) are presented in Figure 2. For CESD-10 and GAD-7 outcomes, CART, CTREE and logistic regression all consistently identified school connectedness, having a happy home life and sex as the three most important variables. Sleep time also ranked fourth highest in relative importance in all except the anxiety linear regression model, which ranked bullying as fourth highest. However, the CART and CTREE models gave more weight to the highest ranked variables than the linear regression models. CART and CTREE attributed 78% to 87% of the total importance to the top four variables, while linear regression attributed only 47%, with the remainder split more evenly across other variables in the model.
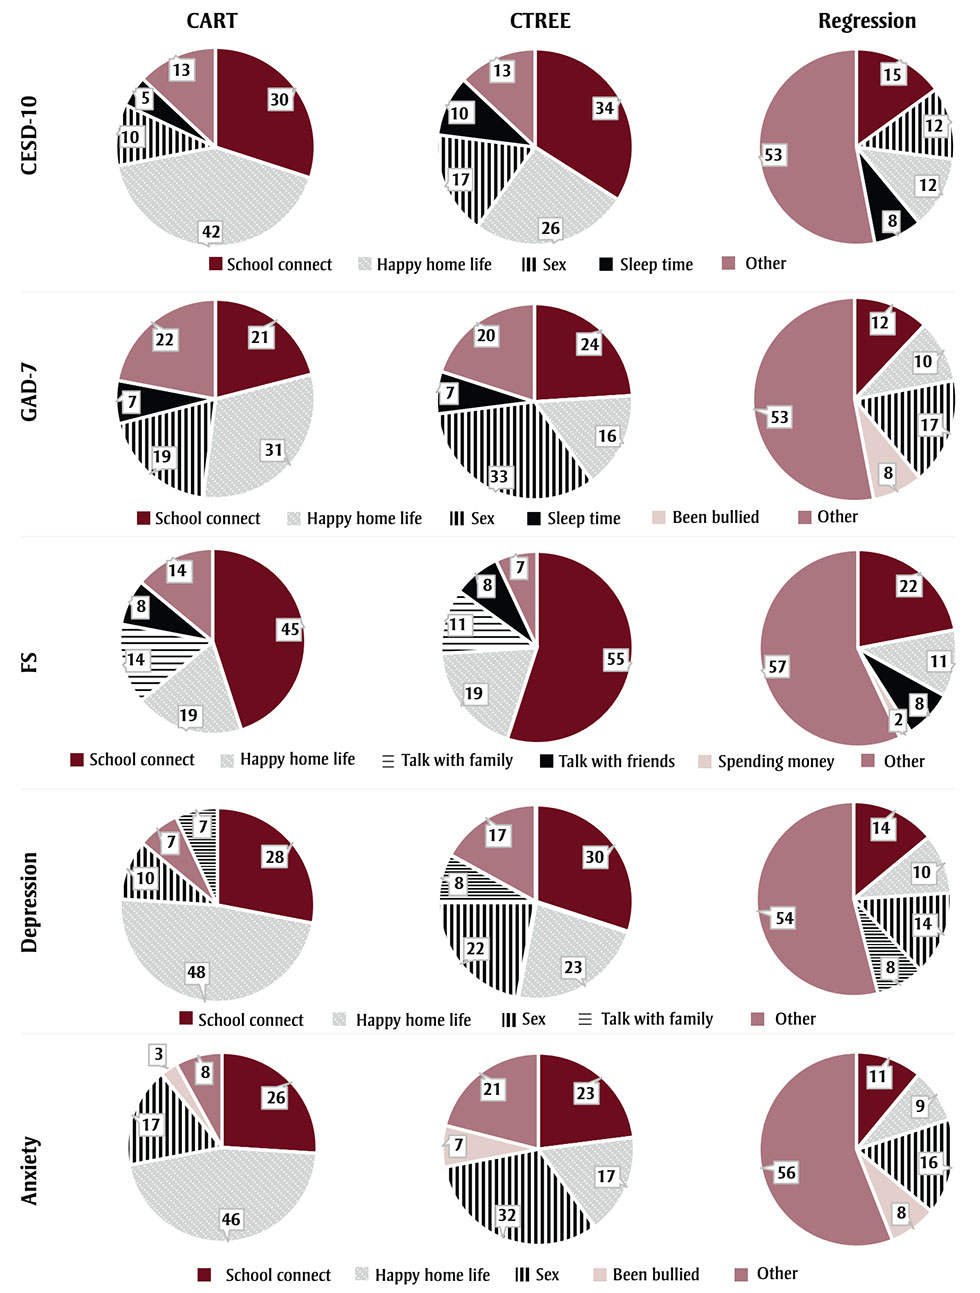
Figure 2 - Text description
| Predictor Variable | CESD-10 CART |
CESD-10 CTREE |
CESD-10 Lin. Reg. |
GAD-7 CART |
GAD-7 CTREE |
GAD-7 Lin. Reg. |
FS CART |
FS CTREE |
FS Lin. Reg. |
Depression CART |
Depression CTREE |
Depression Log. Reg. |
Anxiety CART |
Anxiety CTREE |
Anxiety Log. Reg. |
|---|---|---|---|---|---|---|---|---|---|---|---|---|---|---|---|
| School Connectedness Score | 30 | 34 | 15 | 21 | 24 | 12 | 45 | 55 | 22 | 28 | 30 | 14 | 26 | 23 | 11 |
| Happy Home Life | 42 | 26 | 12 | 31 | 16 | 10 | 19 | 19 | 11 | 48 | 23 | 10 | 46 | 17 | 9 |
| Sex | 10 | 17 | 12 | 19 | 33 | 17 | 0 | 0 | 1 | 10 | 22 | 14 | 17 | 32 | 16 |
| Talk about Problems with Family | 4 | 7 | 7 | 1 | 4 | 5 | 14 | 11 | 8 | 7 | 8 | 8 | 0 | 3 | 5 |
| Sleep Time | 5 | 10 | 8 | 7 | 7 | 7 | 6 | 1 | 4 | 1 | 8 | 8 | 1 | 6 | 7 |
| Talk about Problems with Friends | 0 | 0 | 4 | 0 | 0 | 3 | 8 | 8 | 8 | 0 | 1 | 5 | 0 | 0 | 4 |
| Was Bullied in Last 30 Days | 1 | 3 | 8 | 4 | 5 | 8 | 0 | 0 | 2 | 1 | 3 | 7 | 3 | 7 | 8 |
| Eat Breakfast Daily | 1 | 2 | 4 | 2 | 4 | 4 | 6 | 0 | 2 | 1 | 3 | 5 | 1 | 2 | 4 |
| Spending Money | 0 | 0 | 4 | 1 | 0 | 3 | 0 | 0 | 10 | 0 | 0 | 4 | 1 | 0 | 5 |
| Ethnicity | 0 | 0 | 4 | 0 | 1 | 7 | 0 | 0 | 5 | 0 | 0 | 4 | 0 | 0 | 7 |
| Screen Time | 1 | 1 | 4 | 2 | 1 | 4 | 0 | 0 | 2 | 0 | 1 | 4 | 0 | 2 | 5 |
| Weight Perception | 1 | 0 | 4 | 2 | 0 | 3 | 0 | 1 | 3 | 1 | 0 | 3 | 2 | 0 | 3 |
| Classes Skipped in Past 4 Weeks | 0 | 0 | 6 | 0 | 0 | 5 | 0 | 0 | 2 | 0 | 0 | 5 | 0 | 0 | 3 |
| Province | 0 | 0 | 1 | 2 | 3 | 2 | 1 | 1 | 2 | 0 | 0 | 1 | 0 | 7 | 4 |
| Average Daily Physical Activity | 1 | 0 | 0 | 2 | 0 | 0 | 1 | 3 | 5 | 1 | 0 | 0 | 1 | 0 | 0 |
| Expect to Attend Post-Secondary Education | 0 | 0 | 1 | 0 | 0 | 2 | 0 | 0 | 3 | 0 | 0 | 0 | 1 | 0 | 2 |
| Servings of Fruits and Vegetables | 0 | 0 | 1 | 0 | 0 | 2 | 0 | 0 | 3 | 0 | 0 | 1 | 0 | 0 | 2 |
| Age | 1 | 0 | 1 | 1 | 1 | 1 | 0 | 0 | 1 | 0 | 0 | 2 | 0 | 1 | 2 |
| Urbanicity | 0 | 0 | 2 | 0 | 0 | 2 | 0 | 0 | 0 | 0 | 0 | 2 | 0 | 0 | 2 |
| Current Tobacco Use | 0 | 0 | 2 | 0 | 0 | 1 | 0 | 0 | 1 | 0 | 0 | 1 | 0 | 0 | 1 |
| Current E-cigarette Use | 0 | 0 | 2 | 0 | 0 | 1 | 0 | 0 | 0 | 0 | 0 | 2 | 0 | 0 | 1 |
| BMI Classification | 0 | 0 | 0 | 0 | 0 | 1 | 0 | 0 | 1 | 0 | 0 | 1 | 0 | 0 | 0 |
| School Median Income | 0 | 0 | 0 | 1 | 0 | 0 | 0 | 0 | 0 | 0 | 0 | 0 | 0 | 0 | 0 |
| Bullied Others in Last 30 Days | 0 | 0 | 0 | 0 | 0 | 0 | 0 | 0 | 1 | 0 | 0 | 1 | 0 | 0 | 0 |
| Current Cannabis Use | 0 | 0 | 0 | 0 | 0 | 0 | 0 | 0 | 0 | 0 | 0 | 1 | 0 | 0 | 0 |
| School Size | 0 | 0 | 0 | 0 | 0 | 0 | 0 | 0 | 1 | 0 | 0 | 0 | 0 | 0 | 0 |
| Current Binge Drinking | 0 | 0 | 0 | 0 | 0 | 0 | 0 | 0 | 1 | 0 | 0 | 0 | 0 | 0 | 0 |
Similar results are seen for FS, though sex is not identified as important in any of the models, while talking about problems with friends is ranked within the top four for all models, family was identified as important for CART and CTREE models, and spending money was identified as important for linear regression. Again, CART and CTREE attributed 86% to 93% of total importance to the top four ranked variables, while linear regression attributed only 43%.
Relative variable importance percentages for binary outcomes are presented in Figure 2. As was seen for continuous outcomes, school connectedness, happy home life and sex were consistently identified as the three most important variables across depression and anxiety models. Talking about problems with family was ranked as fourth highest for depression across all models, while having been bullied was ranked as fourth highest for all anxiety models. CART attributed 92% to 93% of total importance to the top four variables, while CTREE attributed 79% to 83% and logistic regression attributed 44% to 46%.
Discussion
This study provided a methodological overview and comparison of two types of decision tree, CART and CTREE, to traditional linear and logistic regression methods using a novel application to large-scale youth mental health survey data. This study adds to the limited existing evidence on decision tree performance in this domainFootnote 15Footnote 17Footnote 21Footnote 23Footnote 27 by examining a large sample of youth and wide breadth of predictors. This study also examines methodological considerations of decision trees in the context of population surveillance research, in which prediction accuracy must be weighed against model interpretability. Beyond the subject matter knowledge gleaned from the results of this application to youth mental health, the implications discussed below can be used as a guide for researchers examining other large-scale survey datasets.
In the case of prediction accuracy, for linear scale outcomes linear regression outperformed CART and CTREE, with 4% to 5% higher R2adjvalues and 3% to 5% lower RMSE values. The number of model parameters was similar for CART and linear regression, while CTREE resulted in more complex models. However, while CART and linear regression had a similar number of parameters, CART identified far fewer unique variables as significant, with the high number of parameters due to multiple splits on the same continuous predictor variables. In contrast, regression models assumed a linear effect of continuous variables and provided only a single estimate representing the effect of a one-unit increase in the variable, regardless of the starting value.
In the case of binary outcomes, logistic regression models again had higher predictive performance than CART and CTREE; however, overall performance was closer than for continuous outcomes, with 1% to 2% higher prediction accuracy and 0% to 3% higher AUC. In these cases, CART produced far more parsimonious models than both CTREE and logistic regression, both in terms of total parameters and number of unique variables. Previous small studies by Burke et al.,Footnote 21 Mitsui et al.Footnote 15 and Handley et al.Footnote 27 found AUCs ranging 4% to 8% lower for CART than logistic regression, while in contrast, a study by Batterham et. alFootnote 17 found AUC 2% higher for CART than logistic regression. While direct comparison of AUC findings from these studies is difficult given the differences in study samples, outcomes and model specifications, it is still noteworthy that across all studies performance between the two techniques did not drastically differ.
Thus, while linear and logistic regression may provide slight advantages in predictive ability, the simpler models generated by CART may be more desirable, particularly for knowledge translation in the context of population health research where the focus is on understanding associations and communicating results to a nontechnical audience.
Decision tree and regression models consistently identified the same sets of most important predictors for each outcome, indicating a general level of agreement between methods. However, CART and CTREE weighted the relative importance of these top predictors much higher than the regression models, attributing more than three-quarters of total importance to the top four predictors, compared to regression models, which attributed less than half of total importance to the top predictors. This is in line with the greater parsimony seen in the CART and CTREE models and highlights the ability of decision trees to single out the most important factors.
Additionally, a common limitation of regression models is that factors with high multicollinearity tend to “wash out” when entered simultaneously, leading to inflated variance estimates or variable omission bias, which could cause factors to be overlooked.Footnote 45 This has been seen in past research comparing trees and regression,Footnote 23 suggesting that decision tree methods can offer a clearer representation of key factors to aid in decision making. This advantage of parsimony can be particularly beneficial in the domain of population-level disease prevention research, in which a myriad of competing risk factors and confounders may be present.
Higher levels of school connectedness and having a happy home life were consistently identified as key predictors and were associated with lower levels of depression and anxiety and higher flourishing. This is consistent with previous research linking family relationships to adolescent anxietyFootnote 11 and school connectedness to emotional distress and depression in youth.Footnote 8Footnote 9 Additionally, previous classification tree analysis on adolescent girls found poor school functioning to be a major risk factor for depression onset, but found that parental support was only protective among subgroups with low depression at baseline.Footnote 18 The protective association to school connectedness highlights the role of the school environment in helping to shape youth mental health and highlights why schools are an appropriate context for intervening, given the ability to reach a large section of the youth population. The decision tree method highlighted in the current study is well suited to future research evaluating complex environmental characteristics and co-occurring interventions.
As previously mentioned, an advantage of decision trees is the ability to examine complex interactions between predictors and identify high-risk subgroups to whom prevention and intervention efforts can be targeted. In the illustrative example with anxiety, bullying was significantly associated with the odds of having clinically relevant anxiety symptoms in the regression model; however, in the CART model, bullying only appears as a risk factor for higher anxiety among the subset of female students with a happy home life and lower school connectedness.
Similarly, sleep time was associated with greater odds of anxiety in the regression model, though the magnitude was small; in contrast, the CART model found sleep to be a protective factor among females without a happy home life and with high school connectedness. Estimates in the regression model correspond to the overall average association across the entire sample and do not provide any insight into the differential impacts on various subgroups. In this case, the low effect size for sleep time in the regression model masks its importance among a specific subgroup.
Studies by Handley et al.Footnote 27 and Batterham et al.,Footnote 28 which examined suicide ideation in adults, each found important factors present in decision tree analyses that were not significant in corresponding regression models. As noted by Handley, this suggests a multiplicative rather than independent impact of these factors, which would not be detected using a standard regression model of main effects. Thus, decision trees can be much more useful than regression models for researchers and practitioners seeking to identify unique characteristics of the highest risk groups to whom to tailor interventions.
Despite these findings, the stronger predictive performance of regression models compared to decision tree models seen in this study could suggest that the underlying nature of predictors is somewhat linear. In the illustrative anxiety example, school connectedness was found to be an important factor across both happy home life subgroups, while sex was found to be the next most important factor across three of four subsequent subgroups. This suggests that the effect of these factors is similar across the sample, meaning a regression analysis would adequately capture this effect through the single model estimate. Decision trees have a greater advantage over regression models when the true underlying relationships in the data are nonlinear.Footnote 12 Researchers should therefore carefully consider underlying data structures based on theory and descriptive exploration when contemplating the most appropriate analysis technique.
This study examined two types of decision trees: CART and CTREE. Both models segment the population into distinct subgroups by recursively choosing the variables and cut-off levels that produce maximum separation among subgroups and minimal within-group variability. While CART and CTREE performed similarly in terms of prediction accuracy, CART consistently produced more parsimonious models, including fewer total model parameters and unique variables. Both CART and CTREE models tended to include multiple splits on different values of the same variable, particularly for the continuous outcomes examined. Tendency to favour continuous predictors over categorical due to the greater number of potential splits is a commonly noted drawback of decision trees.Footnote 12Footnote 31 For binary outcomes, this limitation seems to be more of a concern for CTREE than CART.
Another commonly mentioned drawback of decision trees is the tendency for the models to overfit to the sample data,Footnote 35 which is partially mitigated by pruning in the case of CART and stopping rules based on tests of statistical significance in the case of CTREE.Footnote 35 In this study, similar model performance for training and test sets showed that overfitting is not a concern using either method, which may potentially be credited to the large sample size in this dataset. Interestingly, CTREE produced much more complex models than CART. CTREE models in this study used a standard statistical significance threshold of α = 0.05 with Bonferroni correction, suggesting that perhaps more stringent criteria should be used with CTREE in the case of large sample size. Thus, while previous literature tends to favour CTREE,Footnote 12 this study suggests that researchers working with larger-scale health data should instead consider using CART when parsimony and interpretability are primary concerns.
Strengths and limitations
This study provides a novel application of decision trees using large-scale Canadian health survey data. In contrast to previous limited research, this study benefits from a large sample size that allows for more complex tree structures.
However, the resulting increased tree complexity makes interpretation difficult, which diminishes one of the primary benefits of tree analysis. While this study used standard stopping and pruning criteria, additional restrictions such as limiting the number of levels and using more stringent significance thresholds could produce smaller, more easily interpretable trees. The impact of varying restrictions on overall model fit should be tested in future work. Additionally, only main effects were included in the regression models for this study; inclusion of interaction terms could have increased the relative performance, though as previously noted this can lead to issues in computation and interpretation.
Another limitation of this study is the low overall model fit. Test set R2adj values for continuous outcomes ranged from 0.27 to 0.51, indicating that the included predictors explain less than half of the overall variation in the outcomes. AUCs for binary outcomes ranged from 0.59 to 0.70, indicating low to moderate discriminative ability. While it is not uncommon for behavioural studies to have lower model fits, this suggests that other intrinsic factors that are not captured in this study may play an important role in predicting mental health outcomes. Previous studies of suicide ideation outcomes have generally seen higher AUCs around 0.80;Footnote 15Footnote 21Footnote 27 however, these studies included baseline depression, which is already a well-established predictor.
Additionally, this study uses a cross-sectional, nonrandomized study design, meaning that neither decision trees nor regression models can show causal relationships between the predictors and mental health outcomes in this case. More broadly, decision trees are generally considered to be exploratory methodsFootnote 12 used for hypothesis generation. Further, decision trees are not deterministic methods and are highly sensitive to the sample and parameter choices. Methods such as random forest, which grow multiple trees and aggregate the results into overall measures of variable importance, have been developed to overcome this instability,Footnote 46 though interpretability is sacrificed. Finally, the CART and CTREE methods used in this study do not account for the hierarchical nature of data (i.e. students clustered within schools). Newer tree methods such as RE-EMFootnote 47Footnote 48 and M-CARTFootnote 49 have been developed to account for this nonindependence of observations and should be examined in future research.
Conclusion
Despite growing use in other domains, decision trees remain an underutilized analysis technique in population health research. While the predictive performance of decision trees was found to be slightly lower than that of traditional regression methods, trees provide a means of examining complex interactions between predictors, and present results in a form that is easily interpretable by nontechnical audiences, aiding in knowledge translation. The ability of decision trees to identify high-risk subgroups to whom prevention and intervention efforts can be targeted is particularly valuable to public health practitioners facing limited resources. Decision trees can be a powerful addition to population health researchers’ methodology repertoire to address research questions that cannot be answered by traditional regression methods.
Acknowledgements
The COMPASS study has been supported by a bridge grant from the Canadian Institutes of Health Research (CIHR) Institute of Nutrition, Metabolism and Diabetes (INMD) through the “Obesity – Interventions to Prevent or Treat” priority funding awards (OOP-110788; awarded to SL); an operating grant from the CIHR Institute of Population and Public Health (MOP-114875; awarded to SL); a CIHR project grant (PJT-148562; awarded to SL); a CIHR bridge grant (PJT-149092; awarded to KP/SL); a CIHR project grant (PJT-159693; awarded to KP); and by a research funding arrangement with Health Canada (#1617-HQ-000012; contract awarded to SL) and a CIHR-Canadian Centre on Substance Abuse team grant (OF7 B1-PCPEGT 410-10-9633; awarded to SL). The COMPASS-Quebec project additionally benefits from funding from the Ministère de la Santé et des Services sociaux of the province of Quebec, and the Direction régionale de santé publique du CIUSSS de la Capitale-Nationale. LD received funding from the Natural Sciences and Engineering Research Council of Canada (RGPIN-2016-04396).
Conflicts of interest
Scott Leatherdale is an Associate Scientific Editor with the HPCDP Journal but has recused himself from the review process for this paper. The authors declare there are no other conflicts of interest.
Authors’ contributions and statement
KB conceived this work, conducted the statistical analysis and drafted the manuscript as part of her PhD dissertation at the University of Waterloo. SL and JD supervised KB in conceptualizing this work and drafting the manuscript. LD supported the analyses and interpretation of the data. LD and KP provided ideas and thoughts for discussion and revised the manuscript for important intellectual content. SL is the principal investigator of the COMPASS study and led study implementation. KP conceptualized the COMPASS mental health module. All authors informed the analysis plan, provided feedback on drafts and read and approved the final manuscript.
The content and views expressed in this article are those of the authors and do not necessarily reflect those of the Government of Canada.