
Original quantitative research – An interrupted time series evaluation of the effect of cannabis legalization on intentional self-harm in two Canadian provinces: Ontario and Alberta

HPCDP Journal Home
Published by: The Public Health Agency of Canada
Date published: September 2023
ISSN: 2368-738X
Submit a manuscript
About HPCDP
Browse
Previous | Table of Contents | Next
Michael D. Cusimano, PhDAuthor reference footnote 1Author reference footnote 2; Melissa Carpino, MScAuthor reference footnote 1; Madison Walker, MScAuthor reference footnote 1; Olli Saarela, PhDAuthor reference footnote 3; Robert Mann, PhDAuthor reference footnote 4
https://doi.org/10.24095/hpcdp.43.9.02
This article has been peer reviewed.
Author references
Correspondence
Michael D. Cusimano, Injury Prevention Research Office, St. Michael’s Hospital, 250 Yonge Street (6th floor), Toronto, ON M4S 2B2; Tel.: 416-864-5312; Email: injuryprevention@smh.ca
Suggested citation
Cusimano MD, Carpino M, Walker M, Saarela O, Mann R. An interrupted time series evaluation of the effect of cannabis legalization on intentional self-harm in two Canadian provinces: Ontario and Alberta. Health Promot Chronic Dis Prev Can. 2023;43(9):403-8. https://doi.org/10.24095/hpcdp.43.9.02
Abstract
Introduction: Despite the association between cannabis use and higher prevalence of suicidal ideation and attempt, the effect of cannabis legalization and regulation in Canada on intentional self-harm has not been determined.
Methods: We used an interrupted time series of population-based rates of emergency department (ED) visits and hospitalizations for intentional self-harm per 100 000 in Ontario and Alberta from January/April 2010 to February 2020. Aggregate monthly counts of ED visits and hospitalizations for intentional self-harm (ICD-10 codes X60–X84, R45.8) were obtained from the National Ambulatory Care Reporting System and Discharge Abstract Database, respectively.
Results: The legalization and regulation of cannabis in Canada was not significantly associated with a change in rates of ED visits for intentional self-harm in Ontario (level = 0.58, 95% CI: −1.14 to 2.31; trend = −0.17, 95% CI: −0.35 to 0.01) or Alberta (level = −0.06, 95% CI: −2.25 to 2.12; trend = −0.07, 95% CI: −0.27 to 0.13). Hospitalizations for intentional self-harm also remained unchanged in Ontario (level = −0.14, 95% CI: −0.48 to 0.20; trend = 0.01, 95% CI: −0.03 to 0.04) and Alberta (level = −0.41, 95% CI: −1.03 to 0.21; trend = −0.03, 95% CI: −0.08 to 0.03).
Conclusion: Legalization and regulation of cannabis in Canada has not increased rates of ED visits or hospitalizations for intentional self-harm in Ontario and Alberta. Individual-level analyses that account for demographic characteristics and include other provinces and territories are needed.
Keywords: cannabis, health policy, mental health, population health, substance-related harms, substance use, public health, self-harm
Highlights
- Despite the known link between cannabis use and mental health outcomes, there have been few studies on the effect of cannabis legalization and regulation on mental health outcomes.
- Cannabis legalization and regulation did not lead to an increase in the rates of admissions to hospitals or emergency departments due to intentional self-harm in two Canadian provinces at the population level.
- These findings could help inform future research exploring the effects of cannabis legalization and regulation on intentional self-harm at the individual level as well as other mental health conditions that are largely understudied in this context.
Introduction
In October 2018, Canada became the second country, after Uruguay, to legalize cannabis for recreational purposes under the Cannabis Act (Bill C-45).Footnote 1 One of the main aims of the Cannabis Act was to reduce illicit cannabis activities and the subsequent burden on the criminal justice system as well as to allow quality-controlled and legal supply and production of cannabis for purchase by adults aged 18 and older in Canada.Footnote 1 Cannabis use, which was already increasing before legalization, has continued to increase since then, that is, between 2018 and 2020,Footnote 2Footnote 3 which may be explained by the increased access.Footnote 4Footnote 5
Past-year cannabis use and cannabis use disorder are both associated with a higher prevalence of past-year suicidal ideation and attempt among young adults in the United States.Footnote 6 There is also increasing evidence that individuals are using cannabis to self-medicate for anxiety, mood problems and other medical conditions.Footnote 7 This is problematic given the existing burden of mental health conditions in Western societies, with an average of 12 deaths from suicide per day in Canada in the last 3 years.Footnote 8 Furthermore, cannabis use and intentional non-suicidal self-harm in adolescence are significantly associated, even when controlling for differences in sex, psychiatric disorders, frequent alcohol intoxication, other illicit drug use and parental psychiatric disorders.Footnote 9 Nevertheless, the effect of cannabis legalization and regulation on mental health outcomes is not well-established, with only two studies from the US reporting on the potential impacts of this policy change on emergency department (ED) visits and hospitalizations for intentional self-harm.Footnote 10Footnote 11
Canada’s experience with cannabis legalization and regulation is being observed internationally. One goal of the Cannabis Act was to set several clear legal requirements intended to protect against the risks associated with cannabis.Footnote 12 To establish national standards to protect public health and safety, it is necessary to understand the impacts of cannabis legalization and regulation on these outcomes and set the foundation for appropriate public health responses.
Through this study, we aim to determine the effect of cannabis legalization and regulation on rates of ED visits and hospitalizations for intentional self-harm in Ontario and Alberta. We hypothesized that the implementation of Canada’s Cannabis Act would be associated with increased rates of ED and hospital presentations for intentional self-harm in both provinces.
Methods
Study design
We used an interrupted time series design to clearly visualize data and account for secular trends and autocorrelation. An interrupted time series is considered the most appropriate quasi-experimental study design for measuring the outcomes of a policy change when randomization is not possible.Footnote 13Footnote 14Footnote 15 The time series were constructed from monthly rates of ED visits and hospitalizations for intentional self-harm in Ontario and Alberta. We used visits and hospitalizations that were recorded in national population-based databases from January or April 2010 to February 2020.
Ethics approval
The Research Ethics Board (REB) at Unity Health Toronto reviewed and approved this study (REB 20-330).
Setting
We obtained Ontario and Alberta population-based data from the Canadian Institute for Health Information (CIHI), using the National Ambulatory Care Reporting System (NACRS) for aggregate level counts of ED visits and the Discharge Abstract Database (DAD) for aggregate level counts of hospitalizations for intentional self-harm. Submitting ED visit data to the NACRS is only mandated in some provinces (e.g. Ontario and Alberta, which have nearly 100% coverage of ED visits).Footnote 16 The DAD captures hospitalization data from all provinces and territories except Quebec.
Because we only had ED visit data from Ontario and Alberta, we chose to include only those two provinces in our analyses of both ED visits and hospitalizations for comparability. Because ED visits in Alberta were not recorded in the NACRS until 1 April 2010, whereas ED visits were recorded in Ontario as of 1 January 2010, results were reported separately for Ontario and Alberta. Hospitalizations in Ontario and Alberta were reported in the DAD as of 1 January 2010. Cells containing non-zero counts of less than 5 were suppressed.
Outcome
In both the DAD and the NACRS, each medical record includes at least one primary diagnosis based on the International Statistical Classification of Diseases and Related Health Problems, 10th Revision, Canada (ICD-10-CA); the DAD also has optional fields for 24 additional diagnoses while the NACRS has optional fields for 9 additional diagnoses.Footnote 17 For this study, we defined intentional self-harm as an occurrence of at least one of the following ICD-10-CA codes in any field, used by CIHI to identify purposely self-inflicted poisoning or injury, including attempted suicideFootnote 17: X60–X84 and R45.8. The proposed diagnostic codes have been used in previous studies.Footnote 10Footnote 11Footnote 18 For instance, Randall et al.Footnote 18 found diagnostic codes X60–X84 to have a specificity of more than 98% and a positive predictive value of more than 80% for both suicide attempt and self-harm.
Data analysis
We used an interrupted time series analysis with segmented regression to examine the effect of cannabis legalization and regulation on ED presentations for intentional self-harm that occurred between 1 January 2010 and 1 February 2020 in Ontario and between 1 April 2010 and 1 February 2020 in Alberta as well as hospital presentations that occurred between 1 January 2010 and 1 February 2020 in both provinces. Because ED visits in Alberta did not start being recorded in the NACRS until April 2010, we based analyses of ED visits in Alberta on 119 monthly observations (April 2010 to February 2020) instead of the 122 monthly observations (January 2010 to February 2020) in Ontario.
We defined the post-intervention period for all analyses as October 2018 (given that recreational cannabis legalization was enacted midmonth) to February 2020. Segmented regression was used to estimate and statistically test the changes in y-intercept level and slope in the post-intervention period compared to the pre-intervention period, that is, to quantify immediate (level) changes in the rate of the outcome (e.g. an increase or decrease after the intervention) as well as changes in the slope (trend) over time.Footnote 19 The models were predefined to estimate both a level and trend change. An interrupted time series can distinguish between the actual effect of a policy change and existing secular trends (e.g. increasing rates of outcomes over time) at a population level by comparing the post-intervention period with the pre-intervention period (the control).Footnote 13Footnote 14Footnote 15
Monthly rates of ED visits and hospitalizations for intentional self-harm were calculated for all years of data for Ontario and Alberta separately and reported per 100 000 population. The numerator was the total number of ED visits or hospitalizations for intentional self-harm; the denominator was the total population in each province for the given month interpolated based on quarterly population estimates provided by Statistics Canada.Footnote 20 Given the difference in frequency and characteristics of presentations to the ED versus admissions to the hospital, we modelled rates of ED visits and hospitalizations separately, and presented these rates descriptively, as time series.
The main assumptions of an interrupted time series are that the trends are linear over time and the distribution of residuals is relatively normal. We checked both assumptions by inspecting the distribution of the raw data points over time. An interrupted time series analysis can accommodate seasonal trends; we checked for these by inspecting the raw data points over time. To account for autoregressive and/or moving averages correlation, which can be present in time-based data, we inspected the autocorrelation function plots of the outcome variable to determine whether autoregressive and/or moving averages correlation structures needed to be added to the final model.
We used segmented regression with autoregressive-moving averages correlation structures. The following parameters were used for the autoregressive-moving averages models (p,q): ED visits in Ontario (12,0); ED visits in Alberta (1,0); hospitalizations in Ontario (12,0); and hospitalizations in Alberta (7,0). All statistical analyses were performed using RStudio, version R 3.3.0+ (packages used: nlme and car). An alpha value of 0.05 was used to establish statistical significance.
Results
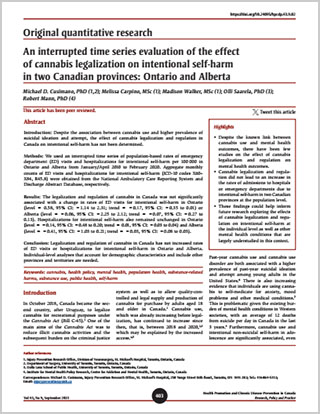
There were no months with suppressed counts of ED visits or hospitalizations for intentional self-harm in either Ontario or Alberta. Models of rates of ED visits and hospitalizations for intentional self-harm did not require adjustments for nonlinearity or seasonality. All models were adjusted for autocorrelation. Adjusted interrupted time series models of rates of ED visits and hospitalizations for intentional self-harm per 100000 population in Ontario and Alberta are depicted in Figures 1A, 1B, 2A and 2B. Both the level, referring to the immediate change, and the trend, referring to the slope change, were reported as an increase or decrease.
1A. Ontario, January 2010–February 2020
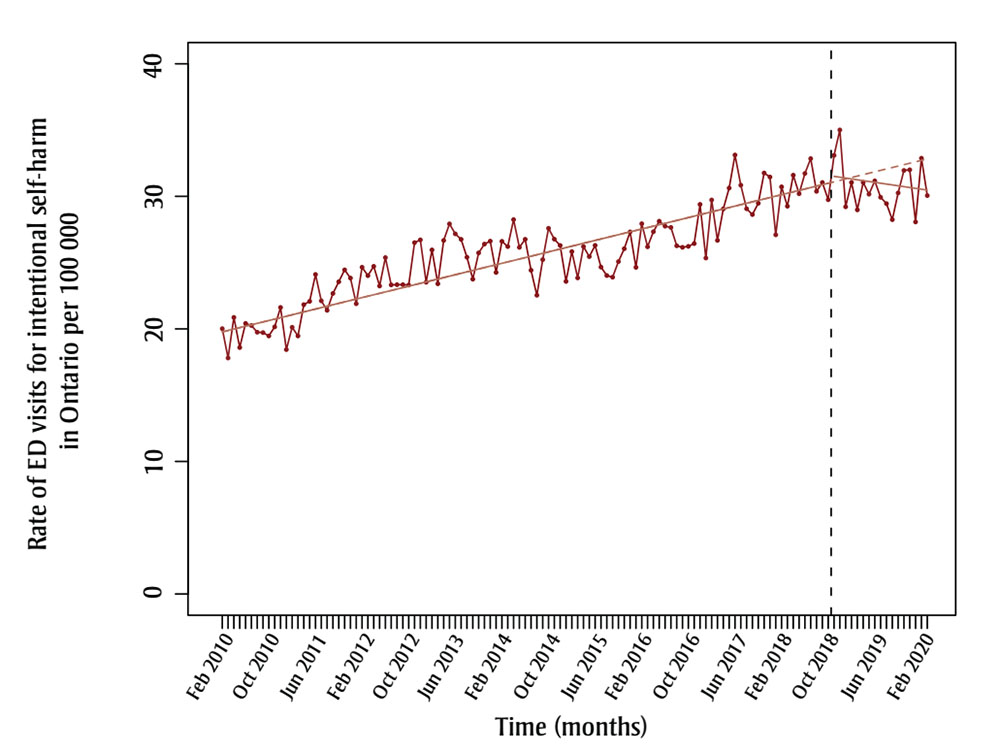
Figure 1A - Text description
| Year | Month | Rate of ED visits for intentional self-harm in Ontario per 100 000 |
|---|---|---|
| 2010 | January | 20.01771 |
| 2010 | February | 17.80458 |
| 2010 | March | 20.86774 |
| 2010 | April | 18.59704 |
| 2010 | May | 20.41548 |
| 2010 | June | 20.25503 |
| 2010 | July | 19.74759 |
| 2010 | August | 19.71714 |
| 2010 | September | 19.46592 |
| 2010 | October | 20.15264 |
| 2010 | November | 21.61594 |
| 2010 | December | 18.43913 |
| 2011 | January | 20.12327 |
| 2011 | February | 19.46411 |
| 2011 | March | 21.82799 |
| 2011 | April | 22.07684 |
| 2011 | May | 24.10377 |
| 2011 | June | 22.11466 |
| 2011 | July | 21.40049 |
| 2011 | August | 22.67486 |
| 2011 | September | 23.55712 |
| 2011 | October | 24.45025 |
| 2011 | November | 23.83411 |
| 2011 | December | 21.89552 |
| 2012 | January | 24.64849 |
| 2012 | February | 24.01802 |
| 2012 | March | 24.71604 |
| 2012 | April | 23.23898 |
| 2012 | May | 25.38158 |
| 2012 | June | 23.32139 |
| 2012 | July | 23.33721 |
| 2012 | August | 23.33721 |
| 2012 | September | 23.30734 |
| 2012 | October | 26.50551 |
| 2012 | November | 26.71392 |
| 2012 | December | 23.52075 |
| 2013 | January | 25.95818 |
| 2013 | February | 23.40699 |
| 2013 | March | 26.67221 |
| 2013 | April | 27.92581 |
| 2013 | May | 27.16845 |
| 2013 | June | 26.75264 |
| 2013 | July | 25.40934 |
| 2013 | August | 23.7514 |
| 2013 | September | 25.735 |
| 2013 | October | 26.39667 |
| 2013 | November | 26.61793 |
| 2013 | December | 24.2578 |
| 2014 | January | 26.6026 |
| 2014 | February | 26.21182 |
| 2014 | March | 28.24683 |
| 2014 | April | 26.15082 |
| 2014 | May | 26.75453 |
| 2014 | June | 24.42069 |
| 2014 | July | 22.53709 |
| 2014 | August | 25.2248 |
| 2014 | September | 27.58939 |
| 2014 | October | 26.76902 |
| 2014 | November | 26.29322 |
| 2014 | December | 23.58485 |
| 2015 | January | 25.83151 |
| 2015 | February | 23.84729 |
| 2015 | March | 26.21225 |
| 2015 | April | 25.45747 |
| 2015 | May | 26.29873 |
| 2015 | June | 24.66009 |
| 2015 | July | 24.02401 |
| 2015 | August | 23.89999 |
| 2015 | September | 25.07456 |
| 2015 | October | 26.05089 |
| 2015 | November | 27.31564 |
| 2015 | December | 24.64077 |
| 2016 | January | 27.93744 |
| 2016 | February | 26.19498 |
| 2016 | March | 27.32758 |
| 2016 | April | 28.1257 |
| 2016 | May | 27.74934 |
| 2016 | June | 27.65525 |
| 2016 | July | 26.26952 |
| 2016 | August | 26.15421 |
| 2016 | September | 26.22628 |
| 2016 | October | 26.43687 |
| 2016 | November | 29.39103 |
| 2016 | December | 25.34699 |
| 2017 | January | 29.72419 |
| 2017 | February | 26.67519 |
| 2017 | March | 29.05141 |
| 2017 | April | 30.62889 |
| 2017 | May | 33.12061 |
| 2017 | June | 30.84307 |
| 2017 | July | 29.06154 |
| 2017 | August | 28.628 |
| 2017 | September | 29.47376 |
| 2017 | October | 31.75796 |
| 2017 | November | 31.45409 |
| 2017 | December | 27.09391 |
| 2018 | January | 30.71863 |
| 2018 | February | 29.25248 |
| 2018 | March | 31.59268 |
| 2018 | April | 30.19885 |
| 2018 | May | 31.72319 |
| 2018 | June | 32.84713 |
| 2018 | July | 30.38012 |
| 2018 | August | 31.04406 |
| 2018 | September | 29.74415 |
| 2018 | October | 33.0927 |
| 2018 | November | 35.01031 |
| 2018 | December | 29.20884 |
| 2019 | January | 31.05327 |
| 2019 | February | 28.98074 |
| 2019 | March | 31.05327 |
| 2019 | April | 30.16405 |
| 2019 | May | 31.1663 |
| 2019 | June | 29.92904 |
| 2019 | July | 29.44715 |
| 2019 | August | 28.24396 |
| 2019 | September | 30.25844 |
| 2019 | October | 31.95055 |
| 2019 | November | 31.99837 |
| 2019 | December | 28.0703 |
| 2020 | January | 32.87555 |
| 2020 | February | 30.05707 |
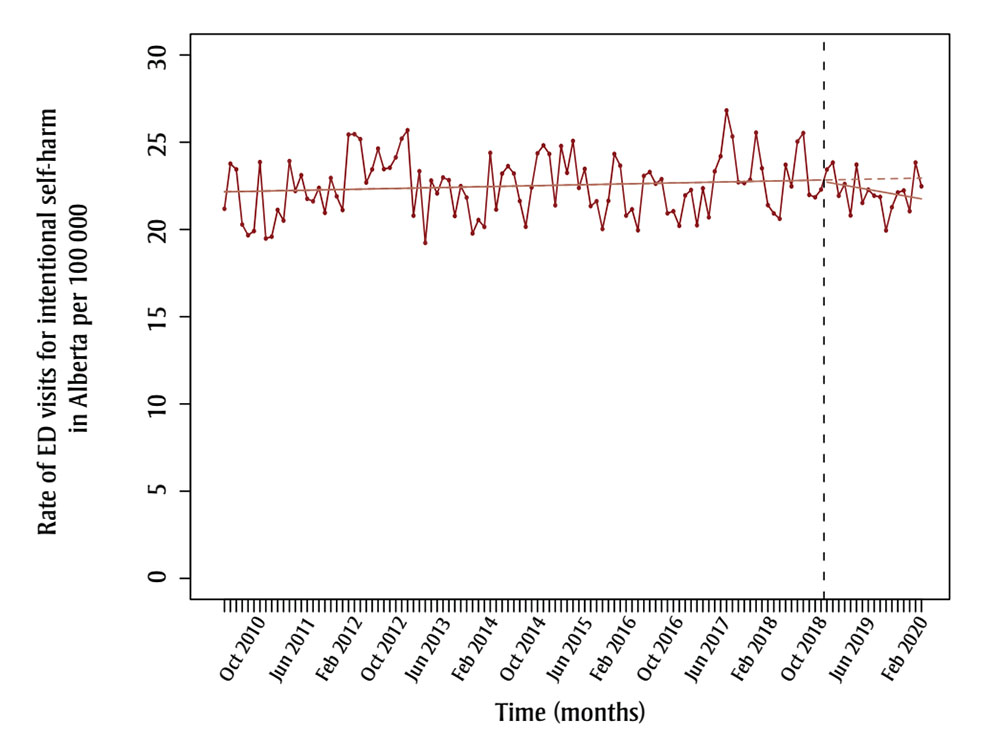
Figure 1B - Text description
| Year | Month | Rate of ED visits for intentional self-harm in Alberta per 100 000 |
|---|---|---|
| 2010 | April | 21.18454 |
| 2010 | May | 23.76867 |
| 2010 | June | 23.44566 |
| 2010 | July | 20.28358 |
| 2010 | August | 19.66731 |
| 2010 | September | 19.90846 |
| 2010 | October | 23.85765 |
| 2010 | November | 19.48108 |
| 2010 | December | 19.58782 |
| 2011 | January | 21.12175 |
| 2011 | February | 20.50914 |
| 2011 | March | 23.91845 |
| 2011 | April | 22.20882 |
| 2011 | May | 23.11097 |
| 2011 | June | 21.75774 |
| 2011 | July | 21.61503 |
| 2011 | August | 22.3804 |
| 2011 | September | 20.95523 |
| 2011 | October | 22.95333 |
| 2011 | November | 21.90284 |
| 2011 | December | 21.11496 |
| 2012 | January | 25.43743 |
| 2012 | February | 25.46357 |
| 2012 | March | 25.176 |
| 2012 | April | 22.68875 |
| 2012 | May | 23.44244 |
| 2012 | June | 24.63795 |
| 2012 | July | 23.4608 |
| 2012 | August | 23.53823 |
| 2012 | September | 24.13185 |
| 2012 | October | 25.20298 |
| 2012 | November | 25.69011 |
| 2012 | December | 20.7931 |
| 2013 | January | 23.33887 |
| 2013 | February | 19.23225 |
| 2013 | March | 22.80322 |
| 2013 | April | 22.06852 |
| 2013 | May | 22.98065 |
| 2013 | June | 22.82863 |
| 2013 | July | 20.77362 |
| 2013 | August | 22.48173 |
| 2013 | September | 21.82863 |
| 2013 | October | 19.77111 |
| 2013 | November | 20.544 |
| 2013 | December | 20.14509 |
| 2014 | January | 24.39236 |
| 2014 | February | 21.1417 |
| 2014 | March | 23.20127 |
| 2014 | April | 23.62935 |
| 2014 | May | 23.21004 |
| 2014 | June | 21.63146 |
| 2014 | July | 20.15355 |
| 2014 | August | 22.40644 |
| 2014 | September | 24.36547 |
| 2014 | October | 24.817 |
| 2014 | November | 24.32992 |
| 2014 | December | 21.38305 |
| 2015 | January | 24.78106 |
| 2015 | February | 23.25046 |
| 2015 | March | 25.0726 |
| 2015 | April | 22.38209 |
| 2015 | May | 23.47213 |
| 2015 | June | 21.3405 |
| 2015 | July | 21.61906 |
| 2015 | August | 20.02658 |
| 2015 | September | 21.64319 |
| 2015 | October | 24.32974 |
| 2015 | November | 23.65658 |
| 2015 | December | 20.79567 |
| 2016 | January | 21.15194 |
| 2016 | February | 19.95285 |
| 2016 | March | 23.07048 |
| 2016 | April | 23.2916 |
| 2016 | May | 22.62203 |
| 2016 | June | 22.88507 |
| 2016 | July | 20.92439 |
| 2016 | August | 21.04355 |
| 2016 | September | 20.20943 |
| 2016 | October | 21.95318 |
| 2016 | November | 22.26204 |
| 2016 | December | 20.24254 |
| 2017 | January | 22.35734 |
| 2017 | February | 20.69772 |
| 2017 | March | 23.32939 |
| 2017 | April | 24.19601 |
| 2017 | May | 26.82139 |
| 2017 | June | 25.33131 |
| 2017 | July | 22.70637 |
| 2017 | August | 22.65922 |
| 2017 | September | 22.84785 |
| 2017 | October | 25.55073 |
| 2017 | November | 23.50761 |
| 2017 | December | 21.39404 |
| 2018 | January | 20.91897 |
| 2018 | February | 20.61444 |
| 2018 | March | 23.7066 |
| 2018 | April | 22.46768 |
| 2018 | May | 25.03675 |
| 2018 | June | 25.52721 |
| 2018 | July | 21.98556 |
| 2018 | August | 21.84597 |
| 2018 | September | 22.28801 |
| 2018 | October | 23.43859 |
| 2018 | November | 23.83233 |
| 2018 | December | 21.93315 |
| 2019 | January | 22.60535 |
| 2019 | February | 20.80431 |
| 2019 | March | 23.71368 |
| 2019 | April | 21.52169 |
| 2019 | May | 22.28128 |
| 2019 | June | 21.93601 |
| 2019 | July | 21.86781 |
| 2019 | August | 19.94235 |
| 2019 | September | 21.27184 |
| 2019 | October | 22.12096 |
| 2019 | November | 22.23498 |
| 2019 | December | 21.04912 |
| 2020 | January | 23.83452 |
| 2020 | February | 22.47125 |
Notes: The black dotted vertical lines represent the enactment of recreational cannabis legalization (October 2018). The red dotted horizontal lines represent the counterfactual (extension of the pre-legalization period/underlying trend).
2A. Ontario, January 2010–February 2020
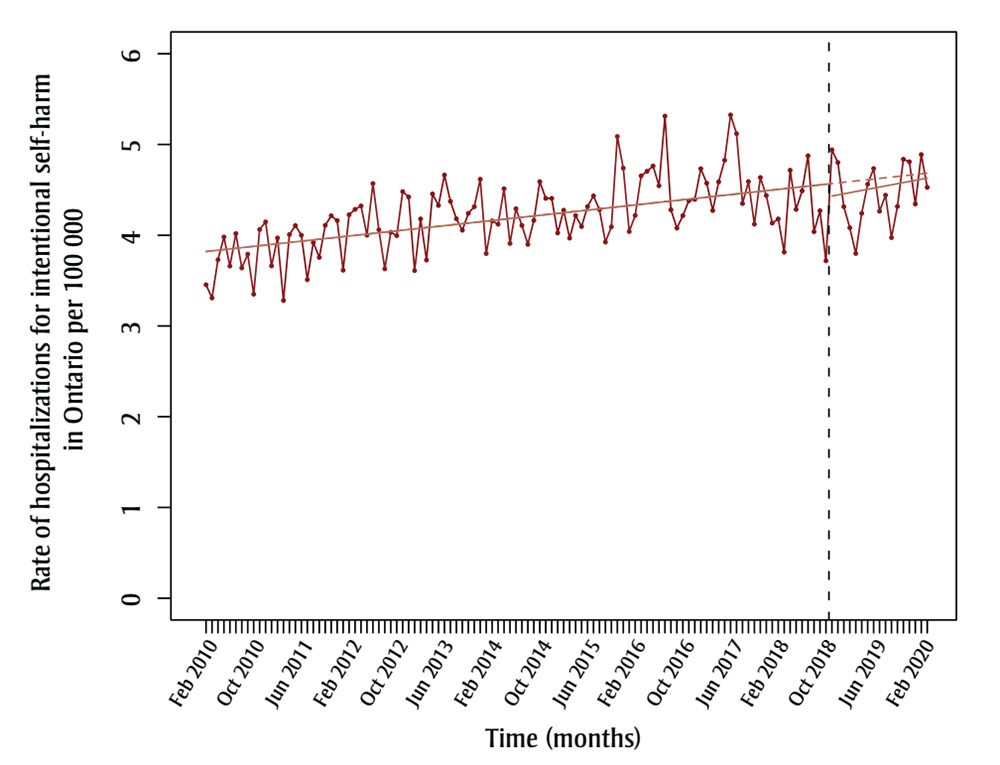
Figure 2A - Text description
| Year | Month | Rate of hospitalizations for intentional self-harm in Ontario per 100 000 |
|---|---|---|
| 2010 | January | 3.453706 |
| 2010 | February | 3.308207 |
| 2010 | March | 3.72939 |
| 2010 | April | 3.980713 |
| 2010 | May | 3.659811 |
| 2010 | June | 4.018916 |
| 2010 | July | 3.638917 |
| 2010 | August | 3.791172 |
| 2010 | September | 3.34963 |
| 2010 | October | 4.063888 |
| 2010 | November | 4.147289 |
| 2010 | December | 3.662049 |
| 2011 | January | 3.970103 |
| 2011 | February | 3.280639 |
| 2011 | March | 4.007986 |
| 2011 | April | 4.106792 |
| 2011 | May | 4.000908 |
| 2011 | June | 3.509303 |
| 2011 | July | 3.92116 |
| 2011 | August | 3.755265 |
| 2011 | September | 4.109678 |
| 2011 | October | 4.215301 |
| 2011 | November | 4.162703 |
| 2011 | December | 3.614188 |
| 2012 | January | 4.22567 |
| 2012 | February | 4.285715 |
| 2012 | March | 4.323243 |
| 2012 | April | 4.000521 |
| 2012 | May | 4.569883 |
| 2012 | June | 4.060453 |
| 2012 | July | 3.629403 |
| 2012 | August | 4.03267 |
| 2012 | September | 3.99533 |
| 2012 | October | 4.480853 |
| 2012 | November | 4.421306 |
| 2012 | December | 3.609989 |
| 2013 | January | 4.180085 |
| 2013 | February | 3.726374 |
| 2013 | March | 4.455286 |
| 2013 | April | 4.328834 |
| 2013 | May | 4.662964 |
| 2013 | June | 4.373385 |
| 2013 | July | 4.181846 |
| 2013 | August | 4.05602 |
| 2013 | September | 4.241058 |
| 2013 | October | 4.314628 |
| 2013 | November | 4.61702 |
| 2013 | December | 3.798347 |
| 2014 | January | 4.1585 |
| 2014 | February | 4.121634 |
| 2014 | March | 4.512415 |
| 2014 | April | 3.909371 |
| 2014 | May | 4.29221 |
| 2014 | June | 4.108153 |
| 2014 | July | 3.899379 |
| 2014 | August | 4.163744 |
| 2014 | September | 4.589665 |
| 2014 | October | 4.406604 |
| 2014 | November | 4.406604 |
| 2014 | December | 4.025967 |
| 2015 | January | 4.275965 |
| 2015 | February | 3.968447 |
| 2015 | March | 4.21739 |
| 2015 | April | 4.096604 |
| 2015 | May | 4.316065 |
| 2015 | June | 4.433111 |
| 2015 | July | 4.282447 |
| 2015 | August | 3.924968 |
| 2015 | September | 4.092764 |
| 2015 | October | 5.088064 |
| 2015 | November | 4.739168 |
| 2015 | December | 4.041377 |
| 2016 | January | 4.218206 |
| 2016 | February | 4.653821 |
| 2016 | March | 4.704642 |
| 2016 | April | 4.762406 |
| 2016 | May | 4.545275 |
| 2016 | June | 5.312471 |
| 2016 | July | 4.28096 |
| 2016 | August | 4.079163 |
| 2016 | September | 4.216096 |
| 2016 | October | 4.381049 |
| 2016 | November | 4.39539 |
| 2016 | December | 4.732394 |
| 2017 | January | 4.573503 |
| 2017 | February | 4.272897 |
| 2017 | March | 4.587818 |
| 2017 | April | 4.82637 |
| 2017 | May | 5.326142 |
| 2017 | June | 5.119094 |
| 2017 | July | 4.349637 |
| 2017 | August | 4.591283 |
| 2017 | September | 4.122205 |
| 2017 | October | 4.635786 |
| 2017 | November | 4.437917 |
| 2017 | December | 4.134047 |
| 2018 | January | 4.179933 |
| 2018 | February | 3.813396 |
| 2018 | March | 4.715641 |
| 2018 | April | 4.285019 |
| 2018 | May | 4.488733 |
| 2018 | June | 4.875087 |
| 2018 | July | 4.039501 |
| 2018 | August | 4.27013 |
| 2018 | September | 3.718018 |
| 2018 | October | 4.939935 |
| 2018 | November | 4.800977 |
| 2018 | December | 4.314626 |
| 2019 | January | 4.082673 |
| 2019 | February | 3.79848 |
| 2019 | March | 4.242099 |
| 2019 | April | 4.561933 |
| 2019 | May | 4.734733 |
| 2019 | June | 4.264716 |
| 2019 | July | 4.44148 |
| 2019 | August | 3.973956 |
| 2019 | September | 4.317724 |
| 2019 | October | 4.836645 |
| 2019 | November | 4.809319 |
| 2019 | December | 4.344783 |
| 2020 | January | 4.888103 |
| 2020 | February | 4.527282 |
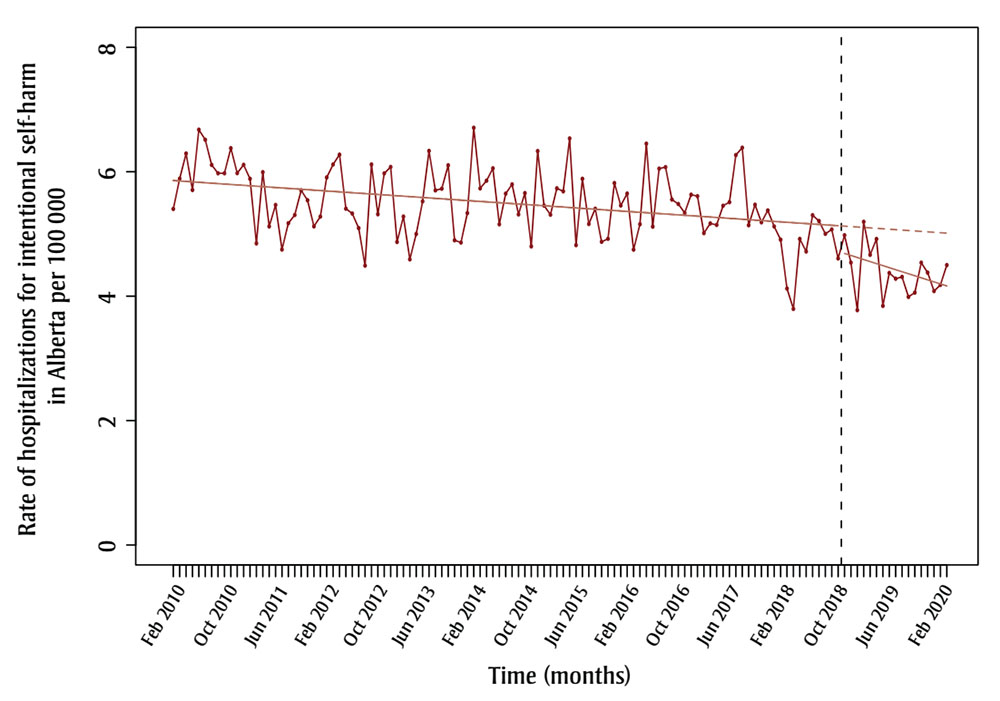
Figure 2B - Text description
| Year | Month | Rate of hospitalizations for intentional self-harm in Alberta per 100 000 |
|---|---|---|
| 2010 | January | 5.402097 |
| 2010 | February | 5.888286 |
| 2010 | March | 6.293443 |
| 2010 | April | 5.706635 |
| 2010 | May | 6.675686 |
| 2010 | June | 6.514177 |
| 2010 | July | 6.109191 |
| 2010 | August | 5.975217 |
| 2010 | September | 5.975217 |
| 2010 | October | 6.378051 |
| 2010 | November | 5.977755 |
| 2010 | December | 6.111187 |
| 2011 | January | 5.886389 |
| 2011 | February | 4.847614 |
| 2011 | March | 5.99293 |
| 2011 | April | 5.12103 |
| 2011 | May | 5.46597 |
| 2011 | June | 4.749556 |
| 2011 | July | 5.172828 |
| 2011 | August | 5.304788 |
| 2011 | September | 5.700667 |
| 2011 | October | 5.541365 |
| 2011 | November | 5.121167 |
| 2011 | December | 5.278741 |
| 2012 | January | 5.908386 |
| 2012 | February | 6.117532 |
| 2012 | March | 6.274392 |
| 2012 | April | 5.405796 |
| 2012 | May | 5.327828 |
| 2012 | June | 5.093923 |
| 2012 | July | 4.490846 |
| 2012 | August | 6.116843 |
| 2012 | September | 5.316749 |
| 2012 | October | 5.973849 |
| 2012 | November | 6.076404 |
| 2012 | December | 4.871379 |
| 2013 | January | 5.27994 |
| 2013 | February | 4.591252 |
| 2013 | March | 4.999364 |
| 2013 | April | 5.523465 |
| 2013 | May | 6.334249 |
| 2013 | June | 5.700824 |
| 2013 | July | 5.727188 |
| 2013 | August | 6.103977 |
| 2013 | September | 4.898253 |
| 2013 | October | 4.861748 |
| 2013 | November | 5.335457 |
| 2013 | December | 6.706719 |
| 2014 | January | 5.73208 |
| 2014 | February | 5.856151 |
| 2014 | March | 6.054664 |
| 2014 | April | 5.155046 |
| 2014 | May | 5.648352 |
| 2014 | June | 5.796344 |
| 2014 | July | 5.313876 |
| 2014 | August | 5.656707 |
| 2014 | September | 4.79963 |
| 2014 | October | 6.33211 |
| 2014 | November | 5.455357 |
| 2014 | December | 5.309231 |
| 2015 | January | 5.733657 |
| 2015 | February | 5.685066 |
| 2015 | March | 6.535397 |
| 2015 | April | 4.820386 |
| 2015 | May | 5.8862 |
| 2015 | June | 5.159509 |
| 2015 | July | 5.404765 |
| 2015 | August | 4.87394 |
| 2015 | September | 4.922197 |
| 2015 | October | 5.81798 |
| 2015 | November | 5.457362 |
| 2015 | December | 5.649692 |
| 2016 | January | 4.748395 |
| 2016 | February | 5.156086 |
| 2016 | March | 6.451102 |
| 2016 | April | 5.117456 |
| 2016 | May | 6.050077 |
| 2016 | June | 6.07399 |
| 2016 | July | 5.552827 |
| 2016 | August | 5.481331 |
| 2016 | September | 5.33834 |
| 2016 | October | 5.630847 |
| 2016 | November | 5.607089 |
| 2016 | December | 5.013117 |
| 2017 | January | 5.168504 |
| 2017 | February | 5.144795 |
| 2017 | March | 5.453009 |
| 2017 | April | 5.51092 |
| 2017 | May | 6.267785 |
| 2017 | June | 6.386045 |
| 2017 | July | 5.140176 |
| 2017 | August | 5.470279 |
| 2017 | September | 5.187333 |
| 2017 | October | 5.377866 |
| 2017 | November | 5.11954 |
| 2017 | December | 4.908183 |
| 2018 | January | 4.122887 |
| 2018 | February | 3.79493 |
| 2018 | March | 4.919354 |
| 2018 | April | 4.717746 |
| 2018 | May | 5.301625 |
| 2018 | June | 5.208204 |
| 2018 | July | 5.002007 |
| 2018 | August | 5.071802 |
| 2018 | September | 4.606499 |
| 2018 | October | 4.979543 |
| 2018 | November | 4.539491 |
| 2018 | December | 3.775189 |
| 2019 | January | 5.195305 |
| 2019 | February | 4.66423 |
| 2019 | March | 4.918222 |
| 2019 | April | 3.843981 |
| 2019 | May | 4.373392 |
| 2019 | June | 4.281321 |
| 2019 | July | 4.309381 |
| 2019 | August | 3.988469 |
| 2019 | September | 4.057236 |
| 2019 | October | 4.538217 |
| 2019 | November | 4.378581 |
| 2019 | December | 4.082115 |
| 2020 | January | 4.180697 |
| 2020 | February | 4.498794 |
Notes: The black dotted vertical lines represent the enactment of recreational cannabis legalization (October 2018). The red dotted horizontal lines represent the counterfactual (extension of the pre–legalization period/underlying trend).
There was no statistically significant association between cannabis legalization and rates of presentations to the ED or hospital for intentional self-harm after legalization enactment in Ontario or Alberta. Rates of ED visits for intentional self-harm per 100 000 population were not affected by cannabis legalization in Ontario (level = 0.58, 95% confidence interval [CI]: −1.14 to 2.31, p = 0.51; trend = −0.17, 95% CI: −0.35 to 0.01, p = 0.06) and Alberta (level = −0.06, 95% CI: −2.25 to 2.12, p = 0.95; trend = −0.07, 95% CI: −0.27 to 0.13, p = 0.52). Similarly, hospitalizations for intentional self-harm per 100 000 population remained unchanged after cannabis legalization enactment in Ontario (level = −0.14, 95% CI: −0.48 to 0.20, p = 0.42; trend = 0.01, 95% CI: −0.03 to 0.04, p = 0.75) and Alberta (level = −0.41, 95% CI: −1.03 to 0.21, p = 0.20; trend = −0.03, 95% CI: −0.08 to 0.03, p = 0.38).
Discussion
Our study demonstrated that cannabis legalization and regulation is not associated with increases in presentations to the ED or hospital for diagnoses related to intentional self-harm in Ontario and Alberta.
There are many possible explanations for why cannabis legalization appeared to have a minimal impact on rates of intentional self-harm at the population level, despite the literature pointing to an association between cannabis use and mental health conditions. National public health measures have been implemented by Health Canada since the Cannabis Act came into force, including educational campaigns (e.g. evidence-based information tools, advertising and marketing campaigns, etc.) that highlight the health risks of cannabis use, including mental health impacts.Footnote 21 Also, access to cannabis for medical purposes has been permitted in Canada under various sets of regulations since 2001.
Our results align with findings from two US studies that found no change in total population rates of self-harmFootnote 11 and death by suicideFootnote 10after recreational cannabis legalization and regulation. However, these studies showed increases for certain age groupsFootnote 10Footnote 11 and male sex.Footnote 11
Future directions
To better assess the effects of cannabis legalization and regulation on intentional self-harm, future studies should repeat these methods using individual-level data. There are known age, sex and socioeconomic differences for the prevalence of mental health conditions (e.g. attempted suicide is higher among females)Footnote 22Footnote 23Footnote 24 and risk of disordered cannabis use (e.g. higher risk for youth aged 15–24 years, males and lower-income populations).Footnote 25 Given this, demographic differences in the effect of cannabis legalization on intentional self-harm should also be explored.
Other mental health outcomes, including but not limited to cannabis use disorder, anxiety, depression, post-traumatic stress disorder and psychosis, should be studied in relation to cannabis legalization and regulation in all jurisdictions that have implemented cannabis legalization, including Canada. Future studies should also consider analyzing data across all provinces and territories or perform a combined nationwide analysis.
Limitations and strengths
Our study has several limitations that may affect the interpretation of results. First, our results are based on aggregate (population) data that limit inferences about individuals. Our study also did not consider important demographics, such as age and sex, that may modify any effect of cannabis legalization on intentional self-harm.
Since only ED and hospitalization data were considered, our study was unable to account for intentional self-harm events that did not end up in ambulatory care or the hospital during this period. Furthermore, study data were limited to Ontario and Alberta and patterns may not be generalizable to the rest of Canada and jurisdictions abroad.
Finally, our model did not take into account whether the impact of cannabis legalization might be lagged or delayed, as the modelling approach was determined a priori.
A major strength of our study is the use of an interrupted time series design, which is considered the strongest design for population-level health interventions when randomization is not possible.Footnote 26 Using this design, our study was able to account for secular trends, seasonality and autocorrelation, which are common concerns of using time series data.Footnote 13Footnote 14 Further, the NACRS encompasses almost all ED visits in Ontario and Alberta, providing an accurate estimate of the effect of cannabis legalization on ED visits for intentional self-harm for the Canadian population.
Conclusion
The findings of our study show that cannabis legalization and regulation in Canada did not impact rates of ED visits and hospitalizations for intentional self-harm. Analyses of individual-level data that account for demographics and from other provinces and territories are needed to confirm these findings.
Acknowledgements
This research was supported and funded by the Public Health Agency of Canada. The funding source had a role in the study design and data extraction, but not in the collection, analysis and interpretation of data; in the writing of the report; or in the decision to submit this article for publication. We would like to specifically acknowledge Steve McFaull and Stephanie Toigo of the Public Health Agency of Canada for their assistance with data curation and for their review of the protocol and penultimate draft of this manuscript.
Additional information: Coauthor Dr. Robert Mann passed away on 3 May 2022, prior to the submission of this manuscript.
Conflicts of interest
MDC is a practising neurosurgeon who treats patients who sustained head injuries or trauma that may have been a result of substance use and intoxication, including due to cannabis. MDC had financial support from the Public Health Agency of Canada for the submitted work. MDC also received a grant from the Canadian Institutes of Health Research for a similar study, which might have an interest in the submitted work (RM and OS were listed as co-applicants). MDC and MW received a research grant from the Toronto Cannabis and Cannabinoid Research Consortium, which might have an interest in the submitted work. MC reports no financial interests, activities, relationships or affiliations that could appear to have influenced the submitted work. Each author confirms that this study has not been previously published in any form and is not currently under consideration by any other journal.
Authors’ contributions and statement
MDC: Conceptualization, Methodology, Supervision, Writing – Original Draft, Writing – Review & Editing, Funding Acquisition
MC: Formal analysis, Investigation, Methodology, Writing – Original Draft, Writing – Review & Editing, Visualization
MW: Formal analysis, Investigation, Methodology, Writing – Original Draft, Writing – Review & Editing, Visualization, Funding Acquisition
OS: Conceptualization, Formal analysis, Methodology, Writing – Review & Editing
RM: Conceptualization, Methodology, Writing – Review & Editing
All the authors approved the final version of this paper and agree to be accountable for all aspects of the work presented.
The content and views expressed in this article are those of the authors and do not necessarily reflect those of the Government of Canada.