
Original quantitative research – Implementing a smoke-free generation policy for Canada: estimates of the long-term impacts

HPCDP Journal Home

Published by: The Public Health Agency of Canada
Date published: January 2025
ISSN: 2368-738X
Submit a manuscript
About HPCDP
Browse
Previous | Table of Contents | Next
Doug Coyle, PhD
https://doi.org/10.24095/hpcdp.45.1.03
This article has been peer reviewed.

Recommended Attribution
Research article by Coyle D in the HPCDP Journal licensed under a Creative Commons Attribution 4.0 International License
Author reference
School of Epidemiology and Public Health, Faculty of Medicine, University of Ottawa, Ottawa, Ontario, Canada
Correspondence
Doug Coyle, School of Epidemiology and Public Health, Faculty of Medicine, University of Ottawa, 600 Peter Morand (301K), Ottawa, ON K1G 5Z3; Tel: 613 562 5410; Email: dcoyle@uottawa.ca
Suggested citation
Coyle D. Implementing a smoke-free generation policy for Canada: estimates of the long-term impacts. Health Promot Chronic Dis Prev Can. 2025;45(1):39-53. https://doi.org/10.24095/hpcdp.45.1.03
Abstract
Introduction: The aim of this study was to assess the potential impacts of the introduction of a smoke-free generation (SFG) policy in Canada with a perpetual ban on cigarette sales to anyone born after 2009 instigated on 1 January 2025.
Methods: An existing Canadian model relating to smoking cessation was adapted and augmented to assess the impact of an SFG policy on quality-adjusted life years (QALYs), life expectancy, health care costs, smoking-related taxes, and Canadian tobacco industry gross domestic product (GDP). The cumulative impact of the policy for the entire Canadian population was assessed for time horizons up to 90 years with an annual discount rate of 1.5%.
Results: After 50 years, this SFG policy would lead to 476 814 more QALYs, $2.3 billion less in health care costs, $7.4 billion less in smoking-related taxes and a $3.1 billion reduction in tobacco industry GDP. The combined value of health benefits gained and health care costs averted would exceed the sum of tax revenues foregone and reduced GDP, if the value of a QALY was at least $17 147. Use of higher discount rates and inclusion of unrelated health care costs had little impact on the interpretation of the results.
Conclusion: The implementation of an SFG policy will bring substantive health benefits to the population in Canada. Although health care cost savings are lower than the combination of lost tax revenues and the decline in the GDP from the Canadian tobacco industry, the value of the health benefits realized outweigh the negative offsets.
Keywords: tobacco smoking, health policy, smokefree generation
Highlights
- A smoke-free generation (SFG) policy involves prohibiting the sale of tobacco products to people born after a specific date for their lifetime.
- The impact of an SFG policy on quality-adjusted life years, life expectancy, health care costs, smoking-related taxes and Canadian tobacco industry gross domestic product was assessed for up to 90 years.
- Implementing an SFG policy leads to substantive health gains and significant health care cost savings.
Introduction
Although the prevalence of smoking has decreased consistently over the last 50 years, the proportion of Canadians who are current daily smokers showed a small increase, from 8.4% to 9.1%, in 2022.Footnote 1 Despite the decreasing trend in prevalence, smoking remains a major cause of preventable disease and mortality in Canada.Footnote 2
The current target of federal government policy is to reduce tobacco use to less than 5% by 2035.Footnote 3 The strategy focuses on helping Canadians who are current smokers to quit and on protecting those who do not smoke, particularly youth, from developing a tobacco addiction. However, provinces vary with respect to smoking cessation initiatives such as the age when it becomes legal to purchase tobacco (between 18 and 21 years).
Despite the restrictions on the sale of tobacco products, responses to the Canadian Student Tobacco, Alcohol and Drugs Survey show that 3% of students in Grades 7 to 12 in 2018 to 2019 (aged 11–18 years) were currently smoking cigarettes.Footnote 4 In addition, 58% of the students responded that it would be “fairly easy” or “very easy” to get a cigarette if they wanted one.Footnote 4 By the time they were aged 18 years, 7.5% of males and 4.6% of females reported that they were current daily smokers.Footnote 4
Various jurisdictions across the world have contemplated introducing a smoke-free generation policy (SFG) to limit tobacco consumption.Footnote 5Footnote 6 An SFG policy involves prohibiting the sale of tobacco products to people born after a specific date for their lifetime. Concerns with current legislation are that smoking initiation continues among individuals who are prohibited from purchasing tobacco and that those individuals for whom the protective measures apply will reach an age where the restriction of tobacco sales is no longer valid. An SFG policy can address both of these concerns.
To determine the impacts of an SFG policy, an existing Markov model for assessing the impact of smoking cessation in Canada was adapted to determine the impacts on life expectancy, quality-adjusted life years (QALYs), smoking-related health care costs, taxes raised through tobacco sales and the Canadian gross domestic product (GDP).
Methods
Analytical approach
An approach was adopted that was similar to a previous analysis that examined the impact of vaping by teenagers on the uptake of smoking tobacco and the subsequent impacts on QALYs and costs.Footnote 7 The revised model adopts the same approach to modelling smoking commencement, cessation and relapse and focuses on health states related to smoking status.Footnote 7 The model simulates a Canadian population aged 15 years and older and the transition of individuals between the following states: current smokers, former smokers, never smokers and dead. The model predicts the proportion of the cohort in each of these states every 6 months. The numbers of males and females turning age 15 years in 2025 were based on the most recent census figures adjusted for both mortality and immigration.Footnote 8Footnote 9Footnote 10
All data used in the analysis are presented in Table 1.
| Age, years | Males | Females |
|---|---|---|
| 6-month probability of starting smoking | ||
| 15–17 | 0.0067 | 0.00272 |
| 18–19 | 0.00735 | 0.00695 |
| 20–24 | 0.00785 | 0.00336 |
| 25–29 | 0.00275 | 0.00105 |
| 30–34 | 0.000001 | 0.000001 |
| 35–39 | 0.000001 | 0.000001 |
| 40–44 | 0.000001 | 0.00096 |
| 45–49 | 0.000001 | 0.000001 |
| 50–54 | 0.000001 | 0.000001 |
| 55–59 | 0.000001 | 0.000001 |
| 60–64 | 0.000001 | 0.000001 |
| 65–69 | 0.000001 | 0.000001 |
| 70–74 | 0.000001 | 0.000001 |
| 75–79 | 0.000001 | 0.000001 |
| ≥ 80 | 0.000001 | 0.000001 |
| 6-month probability of quitting smoking | ||
| 15–17 | 0.3 | 0.176 |
| 18–19 | 0.143 | 0.164 |
| 20–24 | 0.1113 | 0.0979 |
| 25–29 | 0.1513 | 0.0788 |
| 30–34 | 0.0682 | 0.0825 |
| 35–39 | 0.0883 | 0.0648 |
| 40–44 | 0.093 | 0.0749 |
| 45–49 | 0.0636 | 0.0592 |
| 50–54 | 0.0638 | 0.0345 |
| 55–59 | 0.0447 | 0.049 |
| 60–64 | 0.0796 | 0.0562 |
| 65–69 | 0.087 | 0.0665 |
| 70–74 | 0.012 | 0.0404 |
| 75–79 | 0.046 | 0.00009 |
| ≥ 80 | 0.0958 | 0.038 |
| 6-month probability of smoking relapse | 0.011 | 0.011 |
| Lung cancer prevalence | ||
| < 45 | 0.00004 | 0.00004 |
| 45–54 | 0.00086 | 0.00106 |
| 55–64 | 0.00394 | 0.00388 |
| 65–74 | 0.01036 | 0.00913 |
| 75–84 | 0.01715 | 0.01273 |
| ≥ 85 | 0.01736 | 0.00917 |
| Stroke prevalence | ||
| 20–34 | 0.00118 | 0.00143 |
| 35–49 | 0.00572 | 0.00648 |
| 50–64 | 0.02441 | 0.02048 |
| 65–79 | 0.07701 | 0.05942 |
| ≥ 80 | 0.18326 | 0.16371 |
| CHD prevalence | ||
| 20–34 | 0.00256 | 0.00207 |
| 35–49 | 0.02051 | 0.01231 |
| 50–64 | 0.10480 | 0.05616 |
| 65–79 | 0.28235 | 0.16995 |
| ≥ 80 | 0.46176 | 0.34595 |
| COPD prevalence | ||
| 35–39 | 0.009 | 0.009 |
| 40–44 | 0.025 | 0.025 |
| 45–49 | 0.044 | 0.048 |
| 50–54 | 0.069 | 0.074 |
| 55–59 | 0.093 | 0.094 |
| 60–64 | 0.119 | 0.115 |
| 65–69 | 0.154 | 0.144 |
| 70–74 | 0.197 | 0.175 |
| 75–79 | 0.242 | 0.2 |
| 80–84 | 0.284 | 0.222 |
| ≥ 85 | 0.315 | 0.236 |
| Relative risks | ||
| Lung cancer – current smokers | 8.05 | 7.32 |
| Lung cancer – former smokers | 3.08 | 2.92 |
| COPD – current smokers | 4.11 | 3.28 |
| COPD – former smokers | 2.87 | 2.02 |
| Stroke – current smokers | 1.67 | 1.83 |
| Stroke – former smokers | 1.08 | 1.17 |
| CHD – current smokers | 1.6 | 1.7 |
| CHD – former smokers | 1.1 | 1.4 |
| Death – former smokers | 2.24 | 2.29 |
| Death – current smokers | 1.3 | 1.35 |
| 6-month disease costs, $ | ||
| Lung cancer | 10 052 | 10 164 |
| COPD | 3251 | 3521 |
| Stroke | 8220 | 8220 |
| CHD | 2235 | 2235 |
| Utility values | ||
| Non-smoker | ||
| 16–24 | 0.95 | 0.93 |
| 25–34 | 0.95 | 0.91 |
| 35–44 | 0.92 | 0.9 |
| 45–54 | 0.88 | 0.86 |
| 55–64 | 0.82 | 0.8 |
| 65–74 | 0.79 | 0.79 |
| > 75 | 0.74 | 0.71 |
| Former smoker | ||
| 16–24 | 0.93 | 0.91 |
| 25–34 | 0.93 | 0.9 |
| 35–44 | 0.91 | 0.89 |
| 45–54 | 0.86 | 0.85 |
| 55–64 | 0.8 | 0.78 |
| 65–74 | 0.78 | 0.77 |
| > 75 | 0.74 | 0.7 |
| Current smoker | ||
| 16–24 | 0.92 | 0.89 |
| 25–34 | 0.91 | 0.88 |
| 35–44 | 0.89 | 0.87 |
| 45–54 | 0.84 | 0.83 |
| 55–64 | 0.78 | 0.76 |
| 65–74 | 0.76 | 0.75 |
| > 75 | 0.71 | 0.68 |
| Annual probability of death | ||
| 15 | 0.00024 | 0.00017 |
| 16 | 0.00033 | 0.00022 |
| 17 | 0.00042 | 0.00026 |
| 18 | 0.0005 | 0.00028 |
| 19 | 0.00057 | 0.00028 |
| 20 | 0.00064 | 0.00029 |
| 21 | 0.00071 | 0.0003 |
| 22 | 0.00076 | 0.00031 |
| 23 | 0.00081 | 0.00032 |
| 24 | 0.00084 | 0.00034 |
| 25 | 0.00087 | 0.00036 |
| 26 | 0.00089 | 0.00038 |
| 27 | 0.00092 | 0.0004 |
| 28 | 0.00095 | 0.00042 |
| 29 | 0.00098 | 0.00045 |
| 30 | 0.00101 | 0.00047 |
| 31 | 0.00104 | 0.0005 |
| 32 | 0.00107 | 0.00052 |
| 33 | 0.0011 | 0.00054 |
| 34 | 0.00113 | 0.00057 |
| 35 | 0.00115 | 0.00059 |
| 36 | 0.00119 | 0.00061 |
| 37 | 0.00123 | 0.00065 |
| 38 | 0.00128 | 0.00069 |
| 39 | 0.00134 | 0.00074 |
| 40 | 0.00141 | 0.0008 |
| 41 | 0.0015 | 0.00087 |
| 42 | 0.00159 | 0.00094 |
| 43 | 0.0017 | 0.00103 |
| 44 | 0.00181 | 0.00111 |
| 45 | 0.00194 | 0.00121 |
| 46 | 0.00209 | 0.00132 |
| 47 | 0.00225 | 0.00143 |
| 48 | 0.00243 | 0.00155 |
| 49 | 0.00263 | 0.00168 |
| 50 | 0.00286 | 0.00182 |
| 51 | 0.00311 | 0.00198 |
| 52 | 0.00339 | 0.00215 |
| 53 | 0.00369 | 0.00234 |
| 54 | 0.00403 | 0.00254 |
| 55 | 0.00439 | 0.00277 |
| 56 | 0.0048 | 0.00302 |
| 57 | 0.00524 | 0.0033 |
| 58 | 0.00573 | 0.0036 |
| 59 | 0.00627 | 0.00394 |
| 60 | 0.00686 | 0.00432 |
| 61 | 0.00751 | 0.00473 |
| 62 | 0.00823 | 0.00519 |
| 63 | 0.00903 | 0.00571 |
| 64 | 0.00991 | 0.00627 |
| 65 | 0.01088 | 0.00691 |
| 66 | 0.01196 | 0.00761 |
| 67 | 0.01315 | 0.0084 |
| 68 | 0.01447 | 0.00928 |
| 69 | 0.01593 | 0.01025 |
| 70 | 0.01755 | 0.01135 |
| 71 | 0.01934 | 0.01257 |
| 72 | 0.02134 | 0.01394 |
| 73 | 0.02355 | 0.01548 |
| 74 | 0.02602 | 0.0172 |
| 75 | 0.02875 | 0.01914 |
| 76 | 0.0318 | 0.02131 |
| 77 | 0.03519 | 0.02376 |
| 78 | 0.03897 | 0.02652 |
| 79 | 0.04319 | 0.02963 |
| 80 | 0.04789 | 0.03313 |
| 81 | 0.05314 | 0.03709 |
| 82 | 0.059 | 0.04157 |
| 83 | 0.06555 | 0.04664 |
| 84 | 0.07287 | 0.05238 |
| 85 | 0.08106 | 0.05889 |
| 86 | 0.09024 | 0.06627 |
| 87 | 0.10051 | 0.07466 |
| 88 | 0.11203 | 0.0842 |
| 89 | 0.12495 | 0.09506 |
| 90 | 0.13946 | 0.10743 |
| 91 | 0.15535 | 0.12121 |
| 92 | 0.1723 | 0.13613 |
| 93 | 0.19026 | 0.1522 |
| 94 | 0.20917 | 0.16939 |
| 95 | 0.2303 | 0.18813 |
| 96 | 0.2506 | 0.20746 |
| 97 | 0.27158 | 0.22783 |
| 98 | 0.29308 | 0.24911 |
| 99 | 0.31492 | 0.27115 |
| 100 | 0.33693 | 0.29378 |
| 101 | 0.3589 | 0.31677 |
| 102 | 0.38065 | 0.33993 |
| 103 | 0.40199 | 0.36302 |
| 104 | 0.42277 | 0.38583 |
Comparators
Two scenarios were compared: (1) the status quo, where no SFG policy is implemented and the uptake and retention of smoking behaviour over the course of the model is informed by current age–gender specific start and quit rates; and (2) the existence of an SFG policy whereby a perpetual ban is instigated, on 1 January 2025, on cigarette sales to anyone born after 2009, with the aim of no uptake of smoking by Canadians born after 2009.
Despite current age restrictions on the purchase of tobacco, consumption appears to begin during the early teenage years. To allow for potential access to tobacco for those in their early teens during the initial years of the SFG policy, two scenario analyses were conducted: assuming a 5‑year lag such that those born between 2009 and 2013 could obtain tobacco illegally despite the restrictions of an SFG policy from 1 January 2025; and assuming an SFG policy that reduces the uptake of smoking in the relevant age cohorts by 90% rather than 100%.
Model design
Markov models for both males and females were developed to model the transition of a population cohort between states of being a current smoker, former smoker, never smoker or dead from age 15 years to death (Figure 1). Stratification by gender was necessary due to differential input parameters relating to onset of smoking, smoking cessation, utility values and underlying mortality data. The model facilitates estimating the cumulative impacts on life expectancy, QALYs, health care costs, tax revenue and GDP over time horizons of up to 90 years.
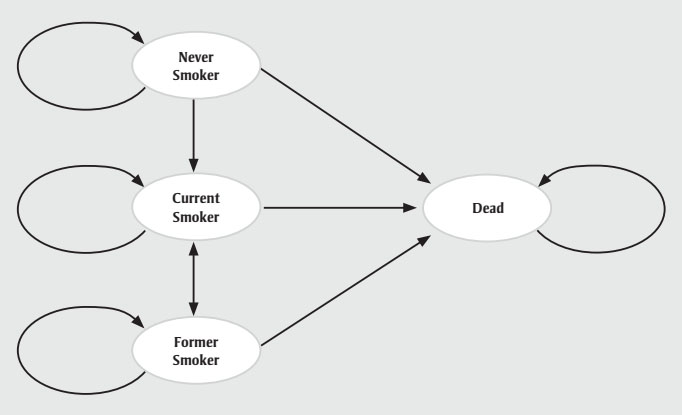
Figure 1 : Descriptive text
| Node number | Name of node | Name of node(s) this node is connected to with a one-way arrow |
|---|---|---|
| 1 | Never smoker | “Never smoker,” “Current smoker,” “Dead” |
| 2 | Current smoker | “Current smoker,” “Former smoker,” “Dead” |
| 3 | Former smoker | “Former smoker,” “Current smoker,” “Dead” |
| 4 | Dead | Dead |
Transitions
For the no SFG policy scenario, age–gender specific probabilities were required for the transition from never smoker to current smoker (“start”), current smoker to former smoker (“quit”) and former smoker to current smoker (“relapse”). Probabilities of starting and quitting were derived from data from the 2017 Canadian Tobacco, Alcohol and Drugs Survey (CTADS),Footnote 11 while the long-term probability of relapse after cessation was based on Krall et al.Footnote 12 For the SFG policy scenario, in the base (primary) analysis, after policy initiation all individuals were assumed to remain in the never smoker category until death.
The six-month probabilities of dying for each age–gender cohort by smoking status were derived through a calibration process using Statistics Canada mortality data, current smoking status from CTADS data and the relative risk of mortality by smoking status.Footnote 13
Costs of smoking-related diseases
The base analysis focuses on the health care costs associated with the four smoking-related diseases that comprise 75% of smoking-related mortality in developed countries: chronic obstructive pulmonary disease (COPD), coronary heart disease (CHD), stroke and lung cancer.Footnote 25 The six-month probabilities of having each of these diseases for each age–gender cohort by smoking status was derived through a calibration process using prevalence data, current smoking status data and the relative risk of disease by smoking status. Age–gender specific prevalence rates were obtained from Canadian population-based data for COPD, CHD and stroke.Footnote 14 Due to the lack of prevalence data, lung cancer prevalence was estimated by dividing available incidence data by estimates of average life expectancy.Footnote 15 Relative risks of disease by smoking status were obtained from published literature.Footnote 16Footnote 17Footnote 18Footnote 19
Average six-month Canadian costs for each of the diseases were derived from the available literature.Footnote 20Footnote 21Footnote 22Footnote 23 Costs were estimated in 2023 Canadian dollars, with adjustments where necessary using the Bank of Canada Inflation Calculator.Footnote 26
Additional health care costs
Delaying mortality and avoiding smoking-related diseases may lead to an increase in health care expenditures for other conditions. Thus, a scenario analysis was conducted to include health care costs that are not related to the smoking-related diseases. Values for six-month additional health care costs were derived for individuals with differential values applied depending on whether the individuals died or survived the cycle.Footnote 27Footnote 28 These values were obtained by adjusting available estimates of annual health care costs by age group and gender, and health care costs in the last year of life by the prevalence of smoking-related diseases and their costs and by the age–gender specific mortality rates.
Utility values
Utility values represent individuals’ preferences for different health states on a scale of 0 to 1 where 0 represents death and 1 represents perfect health. Age–gender specific utility values by smoking status were obtained from Vogl et al.Footnote 24 Values incorporated the impact of smoking-related diseases on health-related quality of life. Thus, further disutilities associated with the four smoking-related illnesses were excluded as this would lead to double counting of the impact of smoking.
Tobacco industry GDP
Tobacco industry GDP is a measure of the total output created through the production of tobacco-related goods and services. The current magnitude of the GDP for the Canadian tobacco industry was divided by the estimated number of smokers in Canada to obtain an average annual contribution to the GDP per smoker of $711.25.Footnote 29
Tobacco-related taxes
The average tobacco-related tax contributed by a smoker in Canada was estimated at $1685 a year.Footnote 30
Analysis
The model calculated the impact of enacting an SFG policy for each year of the analysis across all affected birth year cohorts. For Year 1 (2025), outcomes were assessed for those born in 2010 (i.e. for the year they turned 15). For Year 2 (2026), outcomes were assessed for both those born in 2010 (i.e. for the year they turned 16) and those born in 2011 (i.e. for the year they turned 15). Calculations for further years followed the same logical approach.
Results
The cumulative impact each year up to 90 years, and specifically for time horizons of 10, 25, 50 and 90 years are shown in Figures 2a, b and c and Tables 2, 3a, 3b, 3c and 3d. Analysis determined the threshold value of a QALY whereby the value of health benefits (QALYs weighted by the threshold value) plus health care costs avoided exceeded the sum of tax revenues foregone and the decline in GDP.
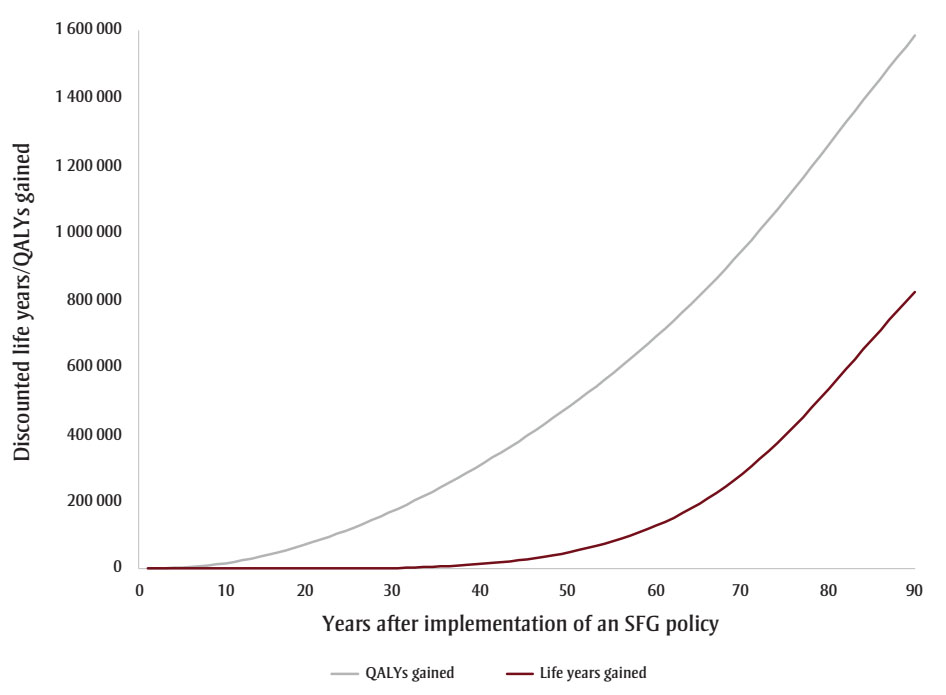
Figure 2a : Descriptive text
| Years after implementation of a SFG policy | QALYs gained | Life years gained |
|---|---|---|
| 1 | 175 | 0 |
| 2 | 531 | 0 |
| 3 | 1 109 | 0 |
| 4 | 1 972 | 0 |
| 5 | 3 183 | 0 |
| 6 | 4 787 | 0 |
| 7 | 6 822 | 0 |
| 8 | 9 320 | 0 |
| 9 | 12 308 | 0 |
| 10 | 15 824 | 0 |
| 11 | 19 863 | 0 |
| 12 | 24 407 | 0 |
| 13 | 29 438 | 0 |
| 14 | 34 944 | 0 |
| 15 | 40 914 | 0 |
| 16 | 47 328 | 0 |
| 17 | 54 168 | 0 |
| 18 | 61 414 | 0 |
| 19 | 69 050 | 0 |
| 20 | 77 072 | 0 |
| 21 | 85 486 | 7 |
| 22 | 94 284 | 32 |
| 23 | 103 459 | 82 |
| 24 | 113 005 | 169 |
| 25 | 122 917 | 299 |
| 26 | 133 192 | 484 |
| 27 | 143 829 | 732 |
| 28 | 154 827 | 1,053 |
| 29 | 166 185 | 1,455 |
| 30 | 177 901 | 1,949 |
| 31 | 189 971 | 2,544 |
| 32 | 202 392 | 3,250 |
| 33 | 215 163 | 4,078 |
| 34 | 228 281 | 5,037 |
| 35 | 241 747 | 6,139 |
| 36 | 255 560 | 7,396 |
| 37 | 269 722 | 8,819 |
| 38 | 284 234 | 10,422 |
| 39 | 299 100 | 12,219 |
| 40 | 314 295 | 14,223 |
| 41 | 329 796 | 16,449 |
| 42 | 345 608 | 18,914 |
| 43 | 361 738 | 21,634 |
| 44 | 378 192 | 24,627 |
| 45 | 394 979 | 27,912 |
| 46 | 412 105 | 31,509 |
| 47 | 429 580 | 35,439 |
| 48 | 447 411 | 39,725 |
| 49 | 465 609 | 44,389 |
| 50 | 484 158 | 49,455 |
| 51 | 503 044 | 54,948 |
| 52 | 522 279 | 60,892 |
| 53 | 541 879 | 67,314 |
| 54 | 561 857 | 74,241 |
| 55 | 582 231 | 81,701 |
| 56 | 603 019 | 89,724 |
| 57 | 624 245 | 98,341 |
| 58 | 645 930 | 107,586 |
| 59 | 668 102 | 117,498 |
| 60 | 690 746 | 128,115 |
| 61 | 713 853 | 139,481 |
| 62 | 737 450 | 151,642 |
| 63 | 761 568 | 164,642 |
| 64 | 786 234 | 178,526 |
| 65 | 811 476 | 193,337 |
| 66 | 837 317 | 209,119 |
| 67 | 863 777 | 225,909 |
| 68 | 890 872 | 243,737 |
| 69 | 918 611 | 262,623 |
| 70 | 946 995 | 282,579 |
| 71 | 976 021 | 303,606 |
| 72 | 1 005 676 | 325,694 |
| 73 | 1 035 937 | 348,819 |
| 74 | 1 066 774 | 372,946 |
| 75 | 1 098 144 | 398,022 |
| 76 | 1 129 995 | 423,981 |
| 77 | 1 162 265 | 450,741 |
| 78 | 1 194 881 | 478,206 |
| 79 | 1 227 763 | 506,271 |
| 80 | 1 260 824 | 534,817 |
| 81 | 1 293 978 | 563,726 |
| 82 | 1 327 135 | 592,877 |
| 83 | 1 360 213 | 622,154 |
| 84 | 1 393 133 | 651,450 |
| 85 | 1 425 828 | 680,668 |
| 86 | 1 458 238 | 709,727 |
| 87 | 1 490 318 | 738,558 |
| 88 | 1 522 029 | 767,108 |
| 89 | 1 553 345 | 795,337 |
| 90 | 1 584 249 | 823,218 |
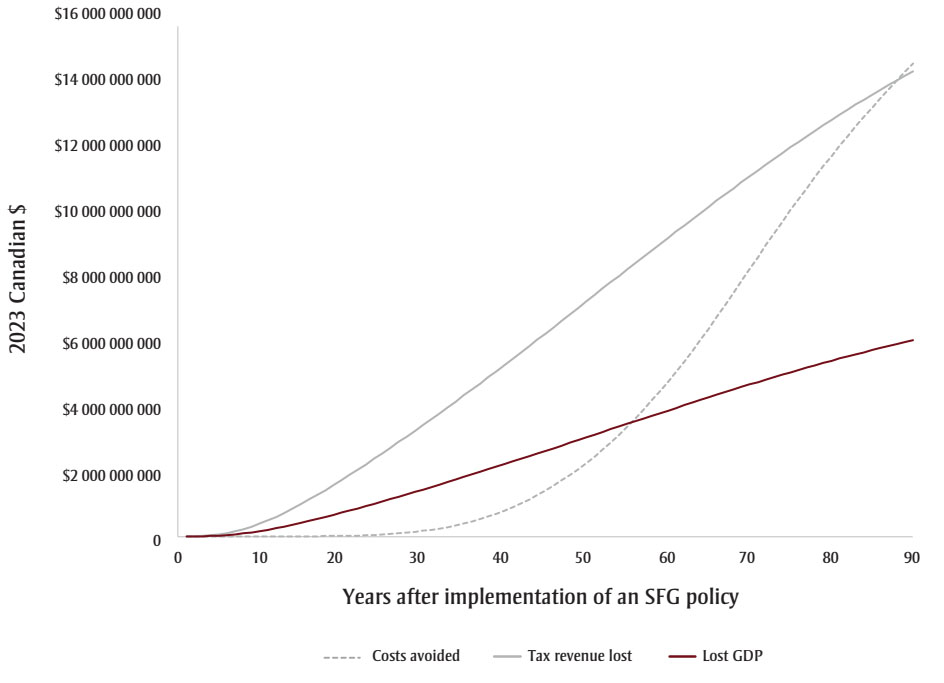
Figure 2b : Descriptive text
| Years after implementation of a SFG policy | Costs avoided (2023 Canadian $) | Tax revenue lost (2023 Canadian $) | Lost GDP (2023 Canadian $) |
|---|---|---|---|
| 1 | 0 | 2 442 142 | 1 030 845 |
| 2 | 0 | 9 191 353 | 3 879 733 |
| 3 | 7 266 | 21 178 878 | 8 939 749 |
| 4 | 34 977 | 40 894 384 | 17 261 798 |
| 5 | 139 669 | 70 529 536 | 29 770 998 |
| 6 | 384 406 | 111 486 170 | 47 059 073 |
| 7 | 781 615 | 164 722 673 | 69 530 565 |
| 8 | 1 340 964 | 230 884 012 | 97 457 717 |
| 9 | 2 069 958 | 310 377 208 | 131 012 338 |
| 10 | 3 006 357 | 403 428 778 | 170 290 041 |
| 11 | 4 163 903 | 508 205 558 | 214 517 034 |
| 12 | 5 522 506 | 622 790 109 | 262 883 955 |
| 13 | 7 067 301 | 745 777 775 | 314 797 889 |
| 14 | 8 787 104 | 876 126 968 | 369 819 173 |
| 15 | 10 670 664 | 1 013 054 172 | 427 617 080 |
| 16 | 12 704 855 | 1 155 776 847 | 487 861 295 |
| 17 | 14 879 450 | 1 303 587 870 | 550 253 337 |
| 18 | 17 185 445 | 1 455 890 877 | 614 541 476 |
| 19 | 19 614 842 | 1 612 180 468 | 680 512 379 |
| 20 | 23 019 437 | 1 772 025 978 | 747 984 259 |
| 21 | 28 195 818 | 1 935 003 229 | 816 778 069 |
| 22 | 35 068 224 | 2 100 735 881 | 886 734 953 |
| 23 | 43 566 154 | 2 268 904 303 | 957 719 991 |
| 24 | 53 623 541 | 2 439 235 001 | 1 029 617 741 |
| 25 | 66 139 465 | 2 611 492 135 | 1 102 328 653 |
| 26 | 81 995 497 | 2 785 587 145 | 1 175 815 345 |
| 27 | 101 106 057 | 2 961 473 396 | 1 250 058 132 |
| 28 | 123 386 251 | 3 139 102 029 | 1 325 036 391 |
| 29 | 148 751 827 | 3 318 421 867 | 1 400 728 518 |
| 30 | 178 402 781 | 3 499 379 475 | 1 477 111 959 |
| 31 | 213 463 356 | 3 681 912 264 | 1 554 160 295 |
| 32 | 253 751 119 | 3 865 950 834 | 1 631 844 232 |
| 33 | 299 086 352 | 4 051 421 816 | 1 710 132 799 |
| 34 | 349 292 005 | 4 238 248 783 | 1 788 993 737 |
| 35 | 406 278 336 | 4 426 352 989 | 1 868 393 806 |
| 36 | 471 876 944 | 4 615 715 578 | 1 948 325 047 |
| 37 | 545 806 433 | 4 806 326 496 | 2 028 783 217 |
| 38 | 627 783 834 | 4 998 163 639 | 2 109 758 984 |
| 39 | 717 525 137 | 5 191 194 537 | 2 191 238 644 |
| 40 | 816 027 442 | 5 385 377 795 | 2 273 204 722 |
| 41 | 924 241 067 | 5 580 687 595 | 2 355 646 322 |
| 42 | 1 041 816 048 | 5 777 094 828 | 2 438 551 155 |
| 43 | 1 168 399 237 | 5 974 559 883 | 2 521 902 503 |
| 44 | 1 303 634 731 | 6 173 033 938 | 2 605 679 756 |
| 45 | 1 448 150 817 | 6 372 460 113 | 2 689 858 905 |
| 46 | 1 602 426 367 | 6 572 642 517 | 2 774 357 264 |
| 47 | 1 765 925 549 | 6 773 366 543 | 2 859 084 246 |
| 48 | 1 938 133 956 | 6 974 444 187 | 2 943 960 491 |
| 49 | 2 118 554 721 | 7 175 709 174 | 3 028 915 816 |
| 50 | 2 309 781 615 | 7 377 012 961 | 3 113 887 518 |
| 51 | 2 514 103 412 | 7 578 185 161 | 3 198 803 677 |
| 52 | 2 730 660 364 | 7 779 065 274 | 3 283 596 544 |
| 53 | 2 958 622 487 | 7 979 512 390 | 3 368 206 639 |
| 54 | 3 197 183 279 | 8 179 401 327 | 3 452 581 124 |
| 55 | 3 446 676 826 | 8 378 619 466 | 3 536 672 460 |
| 56 | 3 707 631 056 | 8 577 236 141 | 3 620 509 914 |
| 57 | 3 979 466 021 | 8 775 353 650 | 3 704 136 667 |
| 58 | 4 261 546 496 | 8 973 044 831 | 3 787 583 464 |
| 59 | 4 553 184 575 | 9 170 354 794 | 3 870 869 345 |
| 60 | 4 855 930 286 | 9 367 302 551 | 3 954 002 338 |
| 61 | 5 170 980 371 | 9 563 856 608 | 4 036 969 147 |
| 62 | 5 497 119 128 | 9 759 963 081 | 4 119 747 028 |
| 63 | 5 833 112 241 | 9 955 556 453 | 4 202 308 325 |
| 64 | 6 177 709 808 | 10 150 559 857 | 4 284 620 592 |
| 65 | 6 531 470 667 | 10 344 885 476 | 4 366 646 762 |
| 66 | 6 894 067 366 | 10 538 300 362 | 4 448 288 506 |
| 67 | 7 263 235 909 | 10 730 563 868 | 4 529 444 244 |
| 68 | 7 636 893 176 | 10 921 472 850 | 4 610 028 228 |
| 69 | 8 013 117 692 | 11 110 853 674 | 4 689 967 166 |
| 70 | 8 390 297 669 | 11 298 556 297 | 4 769 197 725 |
| 71 | 8 766 930 348 | 11 484 450 012 | 4 847 664 730 |
| 72 | 9 141 495 532 | 11 668 420 472 | 4 925 319 917 |
| 73 | 9 512 634 307 | 11 850 367 735 | 5 002 121 099 |
| 74 | 9 879 159 092 | 12 030 205 052 | 5 078 031 658 |
| 75 | 10 240 065 050 | 12 207 858 226 | 5 153 020 275 |
| 76 | 10 594 540 961 | 12 383 265 326 | 5 227 060 809 |
| 77 | 10 941 979 242 | 12 556 376 785 | 5 300 132 337 |
| 78 | 11 281 981 268 | 12 727 155 630 | 5 372 219 254 |
| 79 | 11 614 352 546 | 12 895 577 363 | 5 443 311 216 |
| 80 | 11 939 086 509 | 13 061 629 343 | 5 513 402 890 |
| 81 | 12 256 337 389 | 13 225 309 719 | 5 582 493 494 |
| 82 | 12 566 385 717 | 13 386 626 002 | 5 650 586 198 |
| 83 | 12 869 599 884 | 13 545 593 391 | 5 717 687 418 |
| 84 | 13 166 397 434 | 13 702 233 058 | 5 783 806 091 |
| 85 | 13 457 209 750 | 13 856 570 532 | 5 848 952 991 |
| 86 | 13 742 453 069 | 14 008 634 293 | 5 913 140 143 |
| 87 | 14 022 507 597 | 14 158 454 649 | 5 976 380 338 |
| 88 | 14 297 705 198 | 14 306 062 891 | 6 038 686 784 |
| 89 | 14 568 324 914 | 14 451 490 704 | 6 100 072 857 |
| 90 | 14 834 594 662 | 14 594 769 797 | 6 160 551 940 |
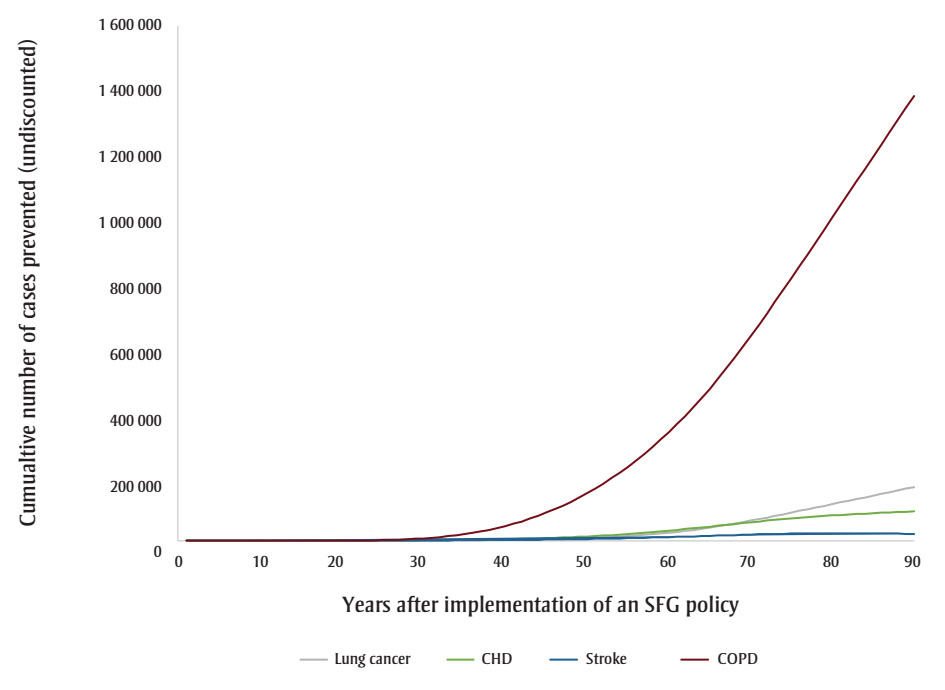
Figure 2c : Descriptive text
| Years after implementation of a SFG policy | Lung cancer (Cumulative number of cases prevented (undiscounted)) | CHD (Cumulative number of cases prevented (undiscounted)) | Stroke (Cumulative number of cases prevented (undiscounted)) | COPD (Cumulative number of cases prevented (undiscounted)) |
|---|---|---|---|---|
| 1 | 0 | 0 | 0 | 0 |
| 2 | 0 | 0 | 0 | 0 |
| 3 | 0 | 0 | 0 | 0 |
| 4 | 1 | 0 | 0 | 0 |
| 5 | 3 | 0 | 1 | 0 |
| 6 | 5 | 0 | 3 | 0 |
| 7 | 8 | 0 | 6 | 0 |
| 8 | 12 | 0 | 11 | 0 |
| 9 | 18 | 0 | 18 | 0 |
| 10 | 24 | 1 | 26 | 0 |
| 11 | 31 | 5 | 37 | 0 |
| 12 | 39 | 11 | 49 | 0 |
| 13 | 48 | 20 | 62 | 0 |
| 14 | 58 | 30 | 77 | 0 |
| 15 | 69 | 43 | 93 | 0 |
| 16 | 81 | 58 | 111 | 0 |
| 17 | 93 | 75 | 129 | 0 |
| 18 | 106 | 94 | 150 | 0 |
| 19 | 119 | 115 | 171 | 0 |
| 20 | 133 | 144 | 196 | 35 |
| 21 | 148 | 186 | 225 | 141 |
| 22 | 164 | 242 | 261 | 317 |
| 23 | 180 | 310 | 301 | 563 |
| 24 | 197 | 391 | 346 | 878 |
| 25 | 214 | 485 | 396 | 1 325 |
| 26 | 232 | 592 | 451 | 1 972 |
| 27 | 250 | 711 | 511 | 2 817 |
| 28 | 270 | 844 | 576 | 3 862 |
| 29 | 289 | 989 | 646 | 5 108 |
| 30 | 318 | 1 147 | 722 | 6 636 |
| 31 | 361 | 1 318 | 802 | 8 526 |
| 32 | 420 | 1 502 | 888 | 10 778 |
| 33 | 495 | 1 698 | 979 | 13 390 |
| 34 | 586 | 1 907 | 1 075 | 16 361 |
| 35 | 692 | 2 154 | 1 182 | 19 784 |
| 36 | 814 | 2 462 | 1 308 | 23 755 |
| 37 | 951 | 2 831 | 1 453 | 28 273 |
| 38 | 1 105 | 3 261 | 1 615 | 33 335 |
| 39 | 1 275 | 3 752 | 1 797 | 38 941 |
| 40 | 1 484 | 4 302 | 1 996 | 45 158 |
| 41 | 1 756 | 4 910 | 2 213 | 52 054 |
| 42 | 2 091 | 5 578 | 2 448 | 59 626 |
| 43 | 2 489 | 6 303 | 2 701 | 67 871 |
| 44 | 2 950 | 7 086 | 2 971 | 76 784 |
| 45 | 3 477 | 7 926 | 3 259 | 86 443 |
| 46 | 4 072 | 8 822 | 3 564 | 96 923 |
| 47 | 4 734 | 9 772 | 3 885 | 108 211 |
| 48 | 5 460 | 10 775 | 4 222 | 120 297 |
| 49 | 6 249 | 11 827 | 4 573 | 133 169 |
| 50 | 7 148 | 12 973 | 4 954 | 146 901 |
| 51 | 8 204 | 14 252 | 5 376 | 161 561 |
| 52 | 9 410 | 15 659 | 5 837 | 177 134 |
| 53 | 10 764 | 17 186 | 6 335 | 193 600 |
| 54 | 12 260 | 18 830 | 6 867 | 210 943 |
| 55 | 13 896 | 20 584 | 7 432 | 229 262 |
| 56 | 15 673 | 22 444 | 8 028 | 248 658 |
| 57 | 17 593 | 24 410 | 8 655 | 269 113 |
| 58 | 19 658 | 26 476 | 9 313 | 290 608 |
| 59 | 21 867 | 28 639 | 9 998 | 313 117 |
| 60 | 24 291 | 30 893 | 10 711 | 336 754 |
| 61 | 26 993 | 33 232 | 11 448 | 361 617 |
| 62 | 29 964 | 35 646 | 12 207 | 387 658 |
| 63 | 33 195 | 38 123 | 12 984 | 414 827 |
| 64 | 36 673 | 40 652 | 13 775 | 443 068 |
| 65 | 40 400 | 43 246 | 14 587 | 472 446 |
| 66 | 44 365 | 45 903 | 15 415 | 502 998 |
| 67 | 48 544 | 48 597 | 16 246 | 534 626 |
| 68 | 52 915 | 51 302 | 17 065 | 567 234 |
| 69 | 57 460 | 53 995 | 17 860 | 600 726 |
| 70 | 62 149 | 56 655 | 18 619 | 635 043 |
| 71 | 66 957 | 59 261 | 19 332 | 670 120 |
| 72 | 71 868 | 61 795 | 19 989 | 705 855 |
| 73 | 76 868 | 64 241 | 20 582 | 742 150 |
| 74 | 81 943 | 66 586 | 21 106 | 778 910 |
| 75 | 87 080 | 68 820 | 21 553 | 816 044 |
| 76 | 92 267 | 70 933 | 21 923 | 853 469 |
| 77 | 97 492 | 72 923 | 22 212 | 891 110 |
| 78 | 102 747 | 74 788 | 22 423 | 928 901 |
| 79 | 108 023 | 76 533 | 22 558 | 966 787 |
| 80 | 113 313 | 78 163 | 22 622 | 1 004 723 |
| 81 | 118 613 | 79 689 | 22 621 | 1 042 677 |
| 82 | 123 918 | 81 120 | 22 563 | 1 080 625 |
| 83 | 129 226 | 82 470 | 22 455 | 1 118 553 |
| 84 | 134 535 | 83 752 | 22 306 | 1 156 455 |
| 85 | 139 843 | 84 978 | 22 124 | 1 194 328 |
| 86 | 145 151 | 86 161 | 21 915 | 1 232 173 |
| 87 | 150 458 | 87 310 | 21 686 | 1 269 994 |
| 88 | 155 763 | 88 435 | 21 443 | 1 307 797 |
| 89 | 161 069 | 89 542 | 21 189 | 1 345 584 |
| 90 | 166 373 | 90 637 | 20 928 | 1 383 361 |
Abbreviations: CHD, coronary heart disease; COPD, chronic obstructive pulmonary disease; GDP, gross domestic product; QALY, quality-adjusted life year; SFG, smoke-free generation.
| Results | Net impact of a smoke-free generation policy | |||
|---|---|---|---|---|
| After 10 years | After 25 years | After 50 years | After 90 years | |
| Discounted | ||||
| Life years gained, n (95% CI) | 0 (0, 0) | 214 (182, 248) | 39 475 (33 848, 45 220) | 769 042 (668 060, 869 939) |
| QALYs gained, n (95% CI) | 15 700 (1031, 30 175) | 122 766 (69 351, 175 793) | 476 814 (356 366, 596 756) | 1 545 288 (1 313 033, 1 786 258) |
| Health care costs of smoking-related diseases averted, $ (95% CI) | 3 026 244 (1 982 557, 4 440 914) | 66 717 071 (47 722 982, 89 691 232) | 2 347 379 210 (1 555 158 031, 3 374 988 738) | 15 323 097 839 (10 080 762 862, 22 120 111 561) |
| Decline in tax revenue from smoking, $ (95% CI) | 403 529 109 (402 420 408, 404 743 294) | 2 614 073 547 (2 585 016 743, 2 645 492 764) | 7 399 915 299 (7 202 870 009, 7 610 491 722) | 14 692 321 355 (14 110 794 329, 15 311 629 335) |
| Decline in GDP from Canadian tobacco industry, $ (95% CI) | 170 332 391 (169 864 401, 170 844 907) | 1 103 418 285 (1 091 153 210, 1 116 680 551) | 3 123 554 752 (3 040 380 590, 3 212 440 497) | 6 201 729 118 (5 956 262 592, 6 463 143 243) |
| Undiscounted | ||||
| Cases of lung cancer prevented, n (95% CI) | 24 (21, 27) | 215 (194, 234) | 7239 (6579, 7860) | 170 971 (152 642, 188 052) |
| Cases of CHD prevented, n (95% CI) | 1 (1, 2) | 494 (158, 842) | 13 403 (2295, 24 824) | 98 012 (−45 697, 240 391) |
| Cases of stroke prevented, n (95% CI) | 27 (22, 31) | 398 (334, 463) | 5057 (4149, 5963) | 23 474 (9877, 37 022) |
| Cases of COPD prevented, n (95% CI) | 0 (0, 0) | 1335 (1145, 1525) | 149 095 (128 616, 170 048) | 1 420 646 (1 226 684, 1 612 460) |
| Results | No smoke-free generation policy | Smoke-free generation policy | Net impact of policy | ||||||
|---|---|---|---|---|---|---|---|---|---|
| Male | Female | Total | Male | Female | Total | Male | Female | Total | |
| Discounted | |||||||||
| Life years gained, n (95% CI) | 6 289 113 (6 288 151, 6 290 013) | 5 969 755 (5 969 002, 5 970 475) | 12 258 868 (12 257 662, 12 260 031) | 6 289 113 (6 288 151, 6 290 013) | 5 969 755 (5 969 002, 5 970 475) | 12 258 868 (12 257 662, 12 260 031) | 0 (0, 0) | 0 (0, 0) | 0 (0, 0) |
| QALYs gained, n (95% CI) | 5 978 358 (5 939 437, 6 017 829) | 5 520 463 (5 483 037, 5 558 178) | 11 498 821 (11 444 768, 11 554 338) | 5 988 227 (5 944 238, 6 032 445) | 5 526 294 (5 483 930, 5 567 853) | 11 514 521 (11 453 218, 11 576 460) | 9869 (−734, 20 826) | 5831 (−3882, 15 855) | 15 700 (1031, 30 175) |
| Health care costs of smoking-related diseases averted, $ (95% CI) | 58 878 268 (40 782 393, 80 444 989) | 60 066 018 (40 900 215, 83 268 876) | 118 944 285 (81 709 064, 163 298 593) | 57 306 239 (39 757 437, 78 139 228) | 58 611 802 (39 919 047, 81 331 301) | 115 918 041 (79 628 414, 159 391 265) | 1 572 029 (992 507, 2 321 612) | 1 454 216 (904 217, 2 193 476) | 3 026 244 (1 982 557, 4 440 914) |
| Net health benefit (QALY = $50 000), $ (95% CI) | 298 917 889 091 (296 971 865 193, 300 891 448 755) | 276 023 160 904 (274 151 838 195, 277 908 921 343) | 574 941 049 995 (572 238 386 412, 577 716 887 479) | 299 411 326 311 (297 211 895 581, 301 622 239 415) | 276 314 708 720 (274 196 479 930, 278 392 672 093) | 575 726 035 030 (572 660 893 203, 578 823 009 444) | 493 437 220 (−36 689 829, 1 041 309 221) | 291 547 816 (−194 097 359, 792 752 767) | 784 985 036 (51 571 870, 1 508 728 083) |
| Number of years as current smoker, n (95% CI) | 150 783 (150 319, 151 290) | 88 701 (88 506, 88 913) | 239 483 (238 825, 240 204) | 0 (0, 0) | 0 (0, 0) | 0 (0, 0) | −150 783 (−150 319, −151 290) | −88 701 (−88 506, −88 913) | −239 483 (−238 825, −240 204) |
| Tax revenue from smoking, $ (95% CI) | 254 068 541 (253 287 884, 254 923 614) | 149 460 568 (149 131 881, 149 818 317) | 403 529 109 (402 420 408, 404 743 294) | 0 (0, 0) | 0 (0, 0) | 0 (0, 0) | −254 068 541 (−253 287 884, −254 923 614) | −149 460 568 (−149 131 881, −149 818 317) | −403 529 109 (−402 420 408, −404 743 294) |
| GDP from Canadian tobacco industry, $ (95% CI) | 107 244 065 (106 914 544, 107 604 997) | 63 088 326 (62 949 585, 63 239 334) | 170 332 391 (169 864 401, 170 844 907) | 0 (0, 0) | 0 (0, 0) | 0 (0, 0) | −107 244 065 (−106 914 544, −107 604 997) | −63 088 326 (−62 949 585, −63 239 334) | −170 332 391 (−169 864 401, −170 844 907) |
| Undiscounted | |||||||||
| Number of cases of lung cancer prevented, n (95% CI) | 109 (106, 112) | 130 (127, 133) | 239 (234, 243) | 95 (90, 101) | 119 (114, 124) | 215 (207, 222) | 14 (11, 16) | 11 (9, 13) | 24 (21, 27) |
| Number of cases of CHD prevented, n (95% CI) | 706 (705, 707) | 542 (541,542) | 1248 (1247, 1249) | 705 (704, 707) | 541 (541, 542) | 1247 (1245, 1248) | 1 (0, 1) | 1 (0, 1) | 1 (1, 2) |
| Number of cases of stroke prevented, n (95% CI) | 410 (405, 415) | 474 (469, 479) | 885 (878, 891) | 397 (389, 405) | 461 (452, 469) | 858 (846, 870) | 13 (10, 17) | 13 (10, 17) | 27 (22, 31) |
| Number of cases of COPD prevented, n (95% CI) | 0 (0, 0) | 0 (0, 0) | 0 (0, 0) | 0 (0, 0) | 0 (0, 0) | 0 (0, 0) | 0 (0, 0) | 0 (0, 0) | 0 (0, 0) |
| Results | No smoke-free generation policy | Smoke-free generation policy | Net impact of policy | ||||||
|---|---|---|---|---|---|---|---|---|---|
| Male | Female | Total | Male | Female | Total | Male | Female | Total | |
| Discounted | |||||||||
| Life years gained, n (95% CI) | 30 488 796 (30 481 955, 30 495 578) | 28 997 998 (28 992 903, 29 002 947) | 59 486 794 (59 478 302, 59 495 129) | 30 488 960 (30 482 135, 30 495 756) | 28 998 048 (28 992 955, 29 002 997) | 59 487 008 (59 478 502, 59 495 344) | 164 (134, 196) | 50 (42, 59) | 214 (182, 248) |
| QALYs gained, n (95% CI) | 28 879 242 (28 753 933, 29 008 817) | 26 670 799 (26 546 917, 26 794 001) | 55 550 041 (55 373 149, 55 734 650) | 28 958 539 (28 814 893, 29 107 278) | 26 714 268 (26 574 728, 26 853 500) | 55 672 807 (55 468 836, 55 884 786) | 79 298 (39 542, 120 136) | 43 469 (8890, 78 194) | 122 766 (69 351, 175 793) |
| Health care costs of smoking-related diseases averted, $ (95% CI) | 847 564 426 (598 859 239, 1 144 156 758) | 800 104 443 (553 286 022, 1 104 312 757) | 1 647 668 869 (1 150 794 631, 2 234 142 455) | 808 484 259 (564 542 610, 1 095 470 224) | 772 467 539 (532 862 274, 1 067 635 865) | 1 580 951 798 (1 099 481 539, 2 148 079 667) | 39 080 167 (26 314 329, 54 521 281) | 27 636 904 (19 542 762, 37 721 224) | 66 717 071 (47 722 982, 89 691 232) |
| Net health benefit (QALY = $50 000), $ (95% CI) | 1 443 962 081 828 (1 437 696 663 635, 1 450 440 835 930) | 1 333 539 970 215 (1 327 345 831 442, 1 339 700 051 781) | 2 777 502 052 044 (2 768 657 430 995, 2 786 732 512 214) | 1 447 926 967 221 (1 440 744 647 303, 1 455 363 890 591) |
1 335 713 405 304 (1 328 736 382 167, 1 342 675 007 639) |
2 783 640 372 525 (2 773 441 796 527, 2 794 239 279 783) |
3 964 885 393 (1 977 120 415, 6 006 791 680) |
2 173 435 088 (444 523 273, 3 909 710 469) | 6 138 320 481 (3 467 545 898, 8 789 649 726) |
| Years as current smoker, n (95% CI) | 960 075 (948 771, 972 272) | 591 304 (585 364, 597 758) | 1 551 379 (1 534 135, 1 570 025) | 0 (0, 0) | 0 (0, 0) | 0 (0, 0) | −960 075 (−948 771, −972 272) |
−591 304 (−585 364, −597 758) | −1 551 379 (−1 534 135, −1 570 025) |
| Tax revenue from smoking, $ (95% CI) | 1 617 726 185 (1 598 678 344, 1 638 278 737) | 996 347 362 (986 339 119, 1 007 222 344) | 2 614 073 547 (2 585 016 743, 2 645 492 764) | 0 (0, 0) | 0 (0, 0) | 0 (0, 0) | −1 617 726 185 (−1 598 678 344, −1 638 278 737) |
−996 347 362 (−986 339 119, −1 007 222 344) | −2 614 073 547 (−2 585 016 743, −2 645 492 764) |
| GDP from Canadian tobacco industry, $ (95% CI) | 682 853 263 (674 813 040, 691 528 636) |
420 565 022 (416 340 474, 425 155 426) |
1 103 418 285 (1 091 153 210, 1 116 680 551) |
0 (0, 0) | 0 (0, 0) | 0 (0, 0) | −682 853 263 (−674 813 040, −691 528 636) |
−420 565 022 (−416 340 474, −425 155 426) | −1 103 418 285 (−1 091 153 210, −1 116 680 551) |
| Undiscounted | |||||||||
| Number of cases of lung cancer prevented, n (95% CI) | 555 (527, 584) | 654 (625, 683) | 1209 (1168, 1250) | 432 (392, 475) | 563 (522, 603) | 995 (938, 1053) | 123 (107, 138) | 92 (79, 104) | 215 (194, 234) |
| Number of cases of CHD prevented, n (95% CI) | 12 724 (12 154, 13 251) | 8555 (8239, 8854) | 21 279 (20 634, 21 890) | 12 450 (11 633, 13 230) | 8336 (7935, 8724) | 20 785 (19 890, 21 684) | 274 (−42, 611) | 220 (122, 320) | 494 (158, 842) |
| Number of cases of stroke prevented, n (95% CI) | 6390 (6276, 6500) | 7128 (6967, 7276) | 13 518 (13 328, 13 708) | 6189 (6030, 6343) | 6931 (6724, 7120) | 13 120 (12 868, 13 370) | 201 (153, 251) | 197 (155, 242) | 398 (334, 463) |
| Number of cases of COPD prevented, n (95% CI) | 3879 (3636, 4122) | 3861 (3458, 4262) | 7740 (7271, 8209) | 2913 (2607, 3244) | 3492 (3023, 3970) | 6405 (5832, 6981) | 966 (808, 1126) | 369 (264, 478) | 1335 (1145, 1525) |
| Results | No smoke-free generation policy | Smoke-free generation policy | Net impact of policy | ||||||
|---|---|---|---|---|---|---|---|---|---|
| Male | Female | Total | Male | Female | Total | Male | Female | Total | |
| Discounted | |||||||||
| Life years gained, n (95% CI) | 91 976 913 (91 946 884, 92 006 798) |
87 834 418 (87 812 521, 87 855 727) |
179 811 331 (179 772 950, 179 848 254) |
92 005 198 (91 974 125, 92 036 689) |
87 845 607 (87 823 736, 87 867 190) |
179 850 806 (179 811 393, 179 888 656) |
28 286 (23 032, 33 665) |
11 190 (9569, 12 875) |
39 475 (33 848, 45 220) |
| QALYs gained, n (95% CI) | 85 568 194 (85 301 369, 85 831 402) |
79 545 776 (79 284 306, 79 800 930) |
165 113 970 (164 743 330, 165 503 487) |
85 878 657 (85 566 416, 86 184 007) |
79 712 128 (79 413 427, 80 002 740) |
165 590 784 (165 164 872, 166 037 423) |
310 462 (216 976, 405 535) |
166 352 (88 836, 244 376) |
476 814 (356 366, 596 756) |
| Health care costs of smoking-related diseases averted, $ (95% CI) | 15 910 895 359 (11 777 285 676, 20 749 681 443) |
13 450 743 721 (9 889 792 985, 17 606 524 271) |
29 361 639 080 (21 803 430 445, 38 191 016 475) |
14 395 952 578 (10 557 852 116, 18 892 106 774) |
12 618 307 291 (9 247 080 757, 16 554 797 229) |
27 014 259 869 (19 950 650 961, 35 223 714 920) |
1 514 942 781 (958 187 999, 2 238 337 990) |
832 436 429 (550 018 994, 1 205 731 984) |
2 347 379 210 (1 555 158 031, 3 374 988 738) |
| Net health benefit (QALY = $50,000), $ (95% CI) | 4 278 409 716 667 (4 265 068 426 626, 4 291 570 076 847) |
3 977 288 794 754 (3 964 215 304 702, 3 990 046 500 116) |
8 255 698 511 420 (8 237 166 484 257, 8 275 174 333 474) |
4 293 932 833 048 (4 278 320 780 257, 4 309 200 372 204) |
3 985 606 388 981 (3 970 671 337 491, 4 000 137 010 818) |
8 279 539 222 029 (8 258 243 617 598, 8 301 871 137 059) |
15 523 116 381 (10 848 777 289, 20 276 757 543) |
8 317 594 227 (4 441 794 956, 12 218 787 877) |
23 840 710 609 (17 818 295 378, 29 837 775 244) |
| Years as current smoker, n (95% CI) | 2 662 548 (2 587 442, 2 743 057) |
1 729 093 (1 687 374, 1 773 608) |
4 391 641 (4 274 700, 4 516 612) |
0 (0, 0) | 0 (0, 0) | 0 (0, 0) | −2 662 548 (−2 587 442, −2 743 057) |
−1 729 093 (−1 687 374, −1 773 608) |
−4 391 641 (−4 274 700, −4 516 612) |
| Tax revenue from smoking, $ (95% CI) | 4 486 393 321 (4 359 840 381, 4 622 050 666) |
2 913 521 978 (2 843 225 373, 2 988 529 238) |
7 399 915 299 (7 202 870 009, 7 610 491 722) |
0 (0, 0) | 0 (0, 0) | 0 (0, 0) | −4 486 393 321 (−4 359 840 381, −4 622 050 666) |
−2 913 521 978 (−2 843 225 373, −2 988 529 238) |
−7 399 915 299 (−7 202 870 009, −7 610 491 722) |
| GDP from Canadian tobacco industry, $ (95% CI) | 1 893 737 240 (1 840 318 380, 1 950 999 131) |
1 229 817 511 (1 200 144 835, 1 261 478 588) |
3 123 554 752 (3 040 380 590, 3 212 440 497) |
0 (0, 0) | 0 (0, 0) | 0 (0, 0) | −1 893 737 240 (−1 840 318 380, −1 950 999 131) |
−1 229 817 511 (−1 200 144 835, −1 261 478 588) |
−3 123 554 752 (−3 040 380 590, −3 212 440 497) |
| Undiscounted | |||||||||
| Number of cases of lung cancer prevented, n (95% CI) | 11 815 (10 456, 13 275) |
12 871 (11 536, 14 332) |
24 687 (22 719, 26 779) |
7635 (5997, 9512) |
9813 (8224, 11 567) |
17 448 (15 129, 19 961) |
4180 (3636, 4692) |
3059 (2732, 3358) |
7239 (6579, 7860) |
| Number of cases of CHD prevented, n (95% CI) | 301 623 (281 821, 320 785) |
159 344 (150 134, 168 521) |
460 966 (439 210, 482 999) |
294 219 (264 920, 323 346) |
153 344 (141 602, 165 210) |
447 563 (416 301, 479 517) |
7404 (−3132, 18 569) |
5999 (3149, 8926) |
13 403 (2295, 24 824) |
| Number of cases of stroke prevented, n (95% CI) | 104 462 (102 207, 106 636) |
96 745 (94 064, 99 244) |
201 207 (197 823, 204 591) |
101 889 (99 007, 104 665) |
94 260 (91 103, 97 236) |
196 149 (192 032, 200 253) |
2573 (1822, 3337) |
2484 (1994, 2977) |
5057 (4149, 5963) |
| Number of cases of COPD prevented, n (95% CI) | 417 631 (393 573, 442 403) |
455 660 (413 323, 498 229) |
873 291 (824 507, 922 540) |
315 381 (281 557, 351 963) |
408 815 (355 616, 463 137) |
724 196 (660 192, 789 233) |
102 250 (86 133, 118 267) |
46 845 (33 895, 59 938) |
149 095 (128 616, 170 048) |
| Results | No smoke-free generation policy | Smoke-free generation policy | Net impact of policy | ||||||
|---|---|---|---|---|---|---|---|---|---|
| Male | Female | Total | Male | Female | Total | Male | Female | Total | |
| Discounted | |||||||||
| Life years gained, n (95% CI) | 192 915 709 (192 693 114, 193 134 803) |
187 012 518 (186 869 949, 187 156 504) |
379 928 227 (379 660 107, 380 193 875) |
193 421 910 (193 117 349, 193 722 988) |
187 275 359 (187 100 769, 187 453 443) |
380 697 269 (380 338 043, 381 055 107) |
506 201 (417 054, 595 379) |
262 841 (226 234, 300 422) |
769 042 (668 060, 869 939) |
| QALYs gained, n (95% CI) | 173 848 749 (173 373 157, 174 329 696) |
163 965 575 (163 496 187, 164 414 343) |
337 814 324 (337 156 863, 338 493 163) |
174 847 855 (174 256 442, 175 429 440) |
164 511 757 (163 973 199, 165 034 534) |
339 359 612 (338 583 746, 340 183 119) |
999 106 (817 314, 1 183 333) |
546 182 (403 412, 691 922) |
1 545 288 (1 313 033, 1 786 258) |
| Health care costs of smoking-related diseases averted, $ (95% CI) | 131 938 140 902 (97 817 123 657, 171 816 474 092) | 111 909 799 243 (83 264 333 301, 145 469 720 163) | 243 847 940 144 (181 447 284 445, 316 435 856 745) | 122 298 985 620 (89 672 787 208, 161 242 850 360) | 106 225 856 685 (78 432 404 217, 138 724 681 598) | 228 524 842 306 (169 153 393 774, 299 108 804 401) | 9 639 155 281 (5 831 184 944, 14 455 892 953) | 5 683 942 557 (3 797 918 731, 8 170 599 406) | 15 323 097 839 (10 080 762 862, 22 120 111 561) |
| Net health benefit (QALY = $50 000), $ (95% CI) | 8 692 437 440 717 (8 668 657 833 082, 8 716 484 824 609) | 8 198 278 766 050 (8 174 809 354 000, 8 220 717 134 964) | 16 890 716 206 767 (16 857 843 135 812, 16 924 658 141 232) | 8 742 392 754 849 (8 712 822 122 780, 8 771 472 015 818) | 8 225 587 843 059 (8 198 659 928 943, 8 251 726 723 861) | 16 967 980 597 907 (16 929 187 282 075, 17 009 155 957 215) | 49 955 314 131 (40 865 724 922, 59 166 666 211) | 27 309 077 009 (20 170 602 989, 34 596 097 788) | 77 264 391 140 (65 651 649 620, 89 312 881 425) |
| Years as current smoker, n (95% CI) | 5 203 169 (4 988 795, 5 432 735) |
3 516 310 (3 386 173, 3 654 644) |
8 719 479 (8 374 359, 9 087 020) |
0 (0, 0) | 0 (0, 0) | 0 (0, 0) | −5 203 169 (−4 988 795, −5 432 735) |
−3 516 310 (−3 386 173, −3 654 644) |
−8 719 479 (−8 374 359, −9 087 020) |
| Tax revenue from smoking, $ (95% CI) | 8 767 338 970 (8 406 119 782, 9 154 158 767) |
5 924 982 384 (5 705 701 087, 6 158 074 954) |
14 692 321 355 (14 110 794 329, 15 311 629 335) |
0 (0, 0) | 0 (0, 0) | 0 (0, 0) | −8 767 338 970 (−8 406 119 782, −9 154 158 767) |
−5 924 982 384 (−5 705 701 087, −6 158 074 954) |
−14 692 321 355 (−14 110 794 329, −15 311 629 335) |
| GDP from Canadian tobacco industry, $ (95% CI) | 3 700 753 616 (3 548 280 531, 3 864 032 892) |
2 500 975 502 (2 408 415 370, 2 599 365 466) |
6 201 729 118 (5 956 262 592, 6 463 143 243) |
0 (0, 0) | 0 (0, 0) | 0 (0, 0) | −3 700 753 616 (−3 548 280 531, −3 864 032 892) |
−2 500 975 502 (−2 408 415 370, −2 599 365 466) |
−6 201 729 118 (−5 956 262 592, −6 463 143 243) |
| Undiscounted | |||||||||
| Number of cases of lung cancer, n (95% CI) prevented | 306 025 (274 686, 341 714) |
276 420 (250 681, 304 563) |
582 444 (540 219, 628 176) |
198 473 (154 043, 248 974) |
213 000 (180 289, 248 966) |
411 473 (355 068, 473 635) |
107 551 (92 110, 121 938) |
63 420 (55 323, 71 148) |
170 971 (152 642, 188 052) |
| Number of cases of CHD prevented, n (95% CI) | 3 852 811 (3 523 108 4 189 395) |
2 382 767 (2 234 011, 2 532 652) |
6 235 578 (5 879 444, 6 608 787) |
3 819 676 (3 353 667, 4 290 419) |
2 317 890 (2 125 288, 2 510 913) |
6 137 566 (5 641 229, 6 653 979) |
33 135 (−100 553, 170 771) |
64 876 (21 738, 108 089) |
98 012 (−45 697, 240 391) |
| Number of cases of stroke prevented, n (95% CI) | 1 486 974 (1 456 183, 1 516 655) |
1 330 371 (1 304 597, 1 355 247) |
2 817 345 (2 778 458, 2 856 348) |
1 481 096 (1 438 583, 1 522 112) |
1 312 775 (1 280 187, 1 344 536) |
2 793 871 (2 741 924, 2 845 769) |
5878 (−5595, 17 873) |
17 597 (10 753, 24 557) |
23 474 (9877, 37 022) |
| Number of cases of COPD prevented, n (95% CI) | 4 395 740 (4 111 603, 4 710 568) |
4 889 478 (4 442 902, 5 342 165) |
9 285 217 (8 742 023, 9 832 232) |
3 421 595 (3 014 181, 3 874 428) |
4 442 976 (3 870 131, 5 026 020) |
7 864 571 (7 137 476, 8 596 963) |
974 145 (829 220, 1 107 103) |
446 501 (314 440, 575 948) |
1 420 646 (1 226 684, 1 612 460) |
Analysis adhered to guidelines for economic evaluations in Canada.Footnote 31 To account for uncertainty in inputs, outcomes were assessed by probabilistic analysis through a Monte Carlo simulation of 5000 replications to ensure stability of the data. Probability distributions were used to account for uncertainty around the parameters of interest, and the choice of distribution was based on common practice.Footnote 31 To allow for society’s preferences with regards to the timing of events, an annual discount rate of 1.5% was applied to all costs and utilities.Footnote 31
Scenario analyses
The following scenario analyses were presented as cumulative impacts at 50 years:
- A 90% reduction in smoking initiation to allow for potential illicit market adoption.
- An SFG policy only impacting initiation of smoking after 5 years based on the assumption that individuals may be able to access cigarettes despite the restrictions.
- Different discount rates (0%, 3% and 5%) to assess the impact of discounting.
- Inclusion of additional costs of health care not related to the specific smoking-related diseases.
Base analysis
Table 2 summarizes the impact of an SFG policy after 10, 25, 50 and 90 years. The annual impacts tend to increase over time, although the annual number of disease cases prevented declines in later years, leading to a reduction in the annual health care costs avoided (Figures 2a, 2b and 2c). This results in a non-linear increase in cumulative impacts (Figures 3a, 3b and 3c).
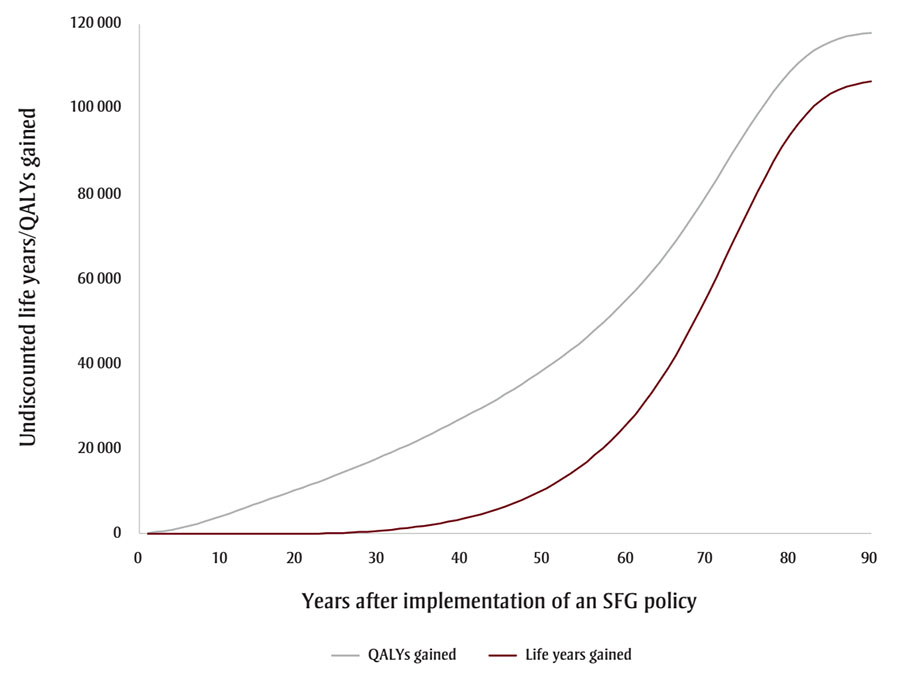
Figure 3a : Descriptive text
| Years after implementation of a SFG policy | QALYs gained | Life years gained |
|---|---|---|
| 1 | 177 | 0 |
| 2 | 367 | 0 |
| 3 | 604 | 0 |
| 4 | 916 | 0 |
| 5 | 1 305 | 0 |
| 6 | 1 755 | 0 |
| 7 | 2 259 | 0 |
| 8 | 2 814 | 0 |
| 9 | 3 417 | 0 |
| 10 | 4 079 | 0 |
| 11 | 4 759 | 0 |
| 12 | 5 433 | 0 |
| 13 | 6 106 | 0 |
| 14 | 6 782 | 0 |
| 15 | 7 463 | 0 |
| 16 | 8 140 | 0 |
| 17 | 8 810 | 0 |
| 18 | 9 473 | 0 |
| 19 | 10 131 | 0 |
| 20 | 10 805 | 0 |
| 21 | 11 502 | 10 |
| 22 | 12 208 | 34 |
| 23 | 12 922 | 71 |
| 24 | 13 647 | 123 |
| 25 | 14 381 | 190 |
| 26 | 15 132 | 272 |
| 27 | 15 900 | 371 |
| 28 | 16 686 | 486 |
| 29 | 17 492 | 620 |
| 30 | 18 313 | 772 |
| 31 | 19 149 | 944 |
| 32 | 20 002 | 1 137 |
| 33 | 20 873 | 1 353 |
| 34 | 21 764 | 1 592 |
| 35 | 22 674 | 1 856 |
| 36 | 23 609 | 2 148 |
| 37 | 24 568 | 2 469 |
| 38 | 25 554 | 2 823 |
| 39 | 26 568 | 3 210 |
| 40 | 27 564 | 3 635 |
| 41 | 28 540 | 4 100 |
| 42 | 29 550 | 4 607 |
| 43 | 30 596 | 5 160 |
| 44 | 31 680 | 5 762 |
| 45 | 32 805 | 6 419 |
| 46 | 33 971 | 7 134 |
| 47 | 35 181 | 7 913 |
| 48 | 36 438 | 8 758 |
| 49 | 37 745 | 9 674 |
| 50 | 39 050 | 10 665 |
| 51 | 40 355 | 11 737 |
| 52 | 41 719 | 12 893 |
| 53 | 43 146 | 14 138 |
| 54 | 44 641 | 15 478 |
| 55 | 46 207 | 16 919 |
| 56 | 47 854 | 18 467 |
| 57 | 49 593 | 20 133 |
| 58 | 51 428 | 21 927 |
| 59 | 53 369 | 23 859 |
| 60 | 55 325 | 25 940 |
| 61 | 57 301 | 28 187 |
| 62 | 59 397 | 30 609 |
| 63 | 61 617 | 33 212 |
| 64 | 63 963 | 36 003 |
| 65 | 66 436 | 38 984 |
| 66 | 69 035 | 42 163 |
| 67 | 71 750 | 45 528 |
| 68 | 74 573 | 49 066 |
| 69 | 77 489 | 52 759 |
| 70 | 80 483 | 56 584 |
| 71 | 83 537 | 60 516 |
| 72 | 86 626 | 64 522 |
| 73 | 89 724 | 68 567 |
| 74 | 92 801 | 72 608 |
| 75 | 95 823 | 76 597 |
| 76 | 98 752 | 80 483 |
| 77 | 101 550 | 84 212 |
| 78 | 104 179 | 87 729 |
| 79 | 106 603 | 90 985 |
| 80 | 108 795 | 93 937 |
| 81 | 110 733 | 96 556 |
| 82 | 112 408 | 98 825 |
| 83 | 113 819 | 100 742 |
| 84 | 114 977 | 102 318 |
| 85 | 115 902 | 103 579 |
| 86 | 116 618 | 104 557 |
| 87 | 117 157 | 105 294 |
| 88 | 117 551 | 105 833 |
| 89 | 117 828 | 106 213 |
| 90 | 118 018 | 106 474 |
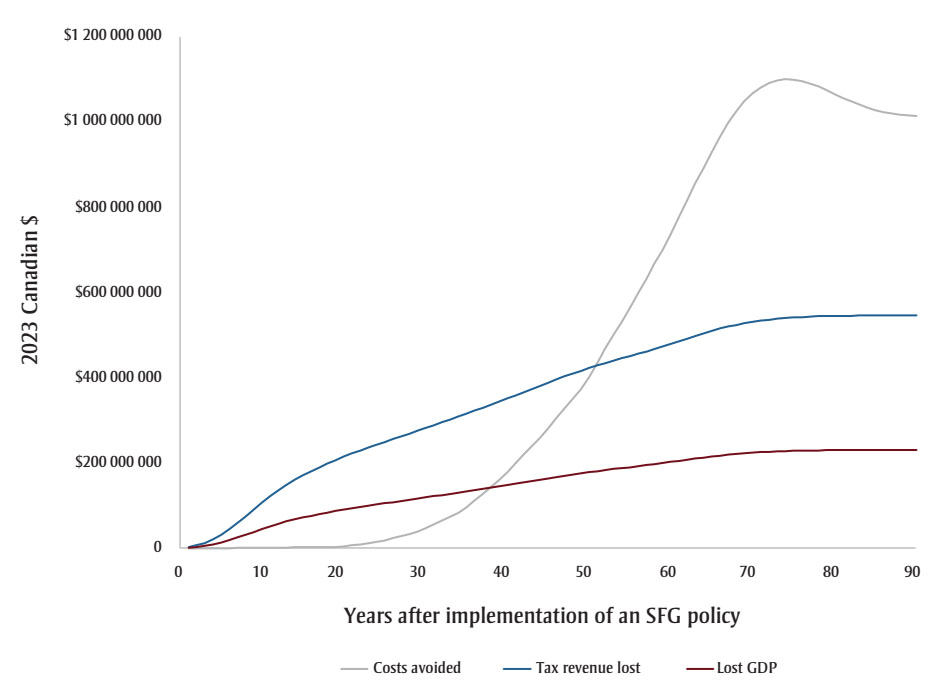
Figure 3b : Descriptive text
| Years after implementation of a SFG policy | Costs avoided (2023 Canadian $) | Tax revenue lost (2023 Canadian $) | Lost GDP (2023 Canadian $) |
|---|---|---|---|
| 1 | 0 | 2 478 774 | 1 046 308 |
| 2 | 0 | 6 953 205 | 2 934 995 |
| 3 | 7 598 | 12 535 096 | 5 291 150 |
| 4 | 29 412 | 20 925 319 | 8 832 720 |
| 5 | 112 782 | 31 925 475 | 13 475 961 |
| 6 | 267 606 | 44 783 756 | 18 903 529 |
| 7 | 440 840 | 59 084 262 | 24 939 870 |
| 8 | 630 103 | 74 530 258 | 31 459 731 |
| 9 | 833 525 | 90 891 723 | 38 366 017 |
| 10 | 1 086 729 | 107 990 146 | 45 583 378 |
| 11 | 1 363 530 | 123 421 696 | 52 097 140 |
| 12 | 1 624 371 | 136 999 372 | 57 828 370 |
| 13 | 1 874 690 | 149 251 983 | 63 000 281 |
| 14 | 2 118 378 | 160 558 364 | 67 772 781 |
| 15 | 2 354 887 | 171 190 782 | 72 260 797 |
| 16 | 2 581 358 | 181 113 011 | 76 449 038 |
| 17 | 2 800 924 | 190 383 603 | 80 362 218 |
| 18 | 3 014 720 | 199 111 911 | 84 046 497 |
| 19 | 3 223 690 | 207 388 589 | 87 540 139 |
| 20 | 4 585 497 | 215 288 726 | 90 874 840 |
| 21 | 7 076 411 | 222 799 328 | 94 045 117 |
| 22 | 9 535 901 | 229 964 611 | 97 069 632 |
| 23 | 11 968 291 | 236 844 563 | 99 973 707 |
| 24 | 14 377 064 | 243 488 212 | 102 778 036 |
| 25 | 18 159 922 | 249 935 688 | 105 499 560 |
| 26 | 23 351 328 | 256 391 381 | 108 224 552 |
| 27 | 28 566 469 | 262 914 800 | 110 978 131 |
| 28 | 33 804 005 | 269 502 102 | 113 758 676 |
| 29 | 39 062 492 | 276 149 056 | 116 564 401 |
| 30 | 46 346 819 | 282 851 258 | 119 393 446 |
| 31 | 55 624 529 | 289 593 094 | 122 239 221 |
| 32 | 64 876 364 | 296 361 786 | 125 096 332 |
| 33 | 74 099 495 | 303 148 459 | 127 961 033 |
| 34 | 83 290 997 | 309 945 260 | 130 830 010 |
| 35 | 95 958 217 | 316 745 159 | 133 700 293 |
| 36 | 112 117 176 | 323 647 087 | 136 613 644 |
| 37 | 128 251 149 | 330 667 367 | 139 576 953 |
| 38 | 144 345 668 | 337 786 512 | 142 581 992 |
| 39 | 160 386 577 | 344 986 800 | 145 621 283 |
| 40 | 178 684 995 | 352 252 005 | 148 687 975 |
| 41 | 199 246 029 | 359 610 006 | 151 793 838 |
| 42 | 219 729 664 | 367 055 090 | 154 936 459 |
| 43 | 240 113 098 | 374 567 479 | 158 107 489 |
| 44 | 260 373 361 | 382 128 652 | 161 299 112 |
| 45 | 282 415 216 | 389 721 227 | 164 503 990 |
| 46 | 306 009 596 | 397 067 044 | 167 604 709 |
| 47 | 329 169 488 | 404 113 487 | 170 579 061 |
| 48 | 351 904 141 | 410 897 799 | 173 442 765 |
| 49 | 374 216 204 | 417 449 841 | 176 208 427 |
| 50 | 402 578 969 | 423 793 271 | 178 886 032 |
| 51 | 436 599 119 | 429 868 994 | 181 450 636 |
| 52 | 469 684 607 | 435 683 528 | 183 904 991 |
| 53 | 501 837 292 | 441 265 578 | 186 261 212 |
| 54 | 533 046 812 | 446 637 353 | 188 528 675 |
| 55 | 565 837 388 | 451 815 579 | 190 714 440 |
| 56 | 600 707 020 | 457 208 266 | 192 990 729 |
| 57 | 635 140 380 | 462 900 090 | 195 393 287 |
| 58 | 668 965 124 | 468 832 541 | 197 897 415 |
| 59 | 702 005 834 | 474 947 391 | 200 478 535 |
| 60 | 739 674 310 | 481 186 655 | 203 112 171 |
| 61 | 781 282 647 | 487 428 131 | 205 746 741 |
| 62 | 820 912 806 | 493 612 955 | 208 357 397 |
| 63 | 858 402 625 | 499 706 266 | 210 929 425 |
| 64 | 893 591 257 | 505 671 988 | 213 447 597 |
| 65 | 931 113 290 | 511 473 110 | 215 896 290 |
| 66 | 968 685 133 | 516 712 164 | 218 107 731 |
| 67 | 1 001 035 589 | 521 340 767 | 220 061 496 |
| 68 | 1 028 405 301 | 525 432 868 | 221 788 799 |
| 69 | 1 051 003 125 | 529 045 368 | 223 313 660 |
| 70 | 1 069 477 339 | 532 222 586 | 224 654 786 |
| 71 | 1 083 944 384 | 534 999 905 | 225 827 111 |
| 72 | 1 094 164 067 | 537 406 776 | 226 843 068 |
| 73 | 1 100 417 312 | 539 469 146 | 227 713 608 |
| 74 | 1 103 038 001 | 541 211 406 | 228 449 028 |
| 75 | 1 102 420 346 | 542 657 912 | 229 059 608 |
| 76 | 1 099 020 869 | 543 834 029 | 229 556 055 |
| 77 | 1 093 359 343 | 544 767 348 | 229 950 015 |
| 78 | 1 086 007 438 | 545 488 212 | 230 254 297 |
| 79 | 1 077 558 420 | 546 028 698 | 230 482 440 |
| 80 | 1 068 589 968 | 546 421 070 | 230 648 063 |
| 81 | 1 059 625 151 | 546 696 176 | 230 764 187 |
| 82 | 1 051 101 988 | 546 882 051 | 230 842 646 |
| 83 | 1 043 352 345 | 547 002 799 | 230 893 615 |
| 84 | 1 036 592 017 | 547 078 064 | 230 925 384 |
| 85 | 1 030 923 373 | 547 123 006 | 230 944 355 |
| 86 | 1 026 349 121 | 547 148 688 | 230 955 195 |
| 87 | 1 022 794 242 | 547 162 723 | 230 961 120 |
| 88 | 1 020 131 979 | 547 170 058 | 230 964 216 |
| 89 | 1 018 209 618 | 547 173 725 | 230 965 764 |
| 90 | 1 016 870 455 | 547 175 478 | 230 966 504 |
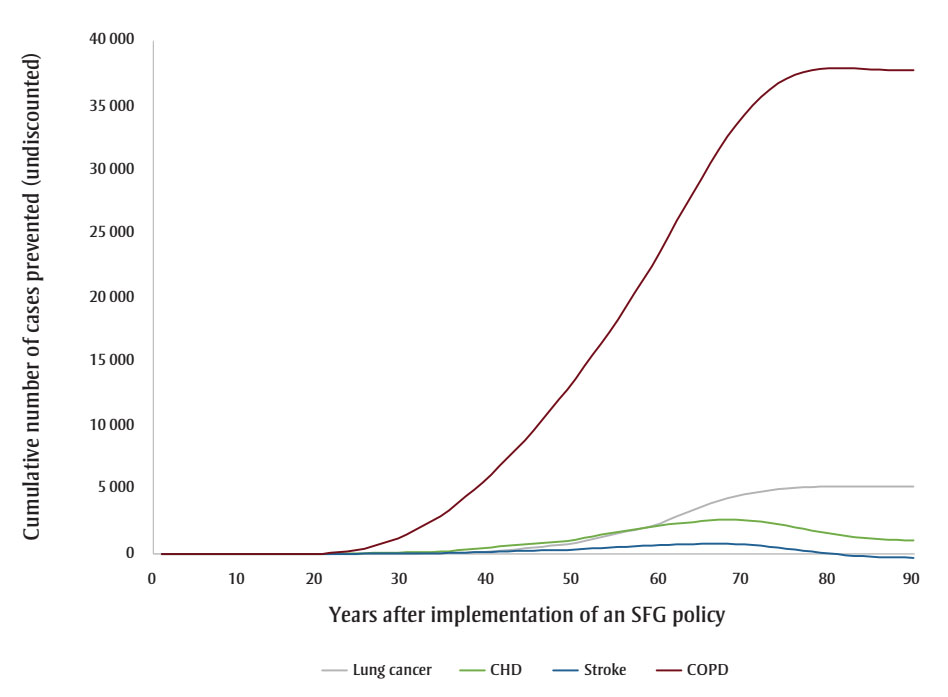
Figure 3c : Descriptive text
| Years after implementation of a SFG policy | Lung cancer (Cumulative number of cases prevented (undiscounted)) | CHD (Cumulative number of cases prevented (undiscounted)) | Stroke (Cumulative number of cases prevented (undiscounted)) | COPD (Cumulative number of cases prevented (undiscounted)) |
|---|---|---|---|---|
| 1 | 0 | 0 | 0 | 0 |
| 2 | 0 | 0 | 0 | 0 |
| 3 | 0 | 0 | 0 | 0 |
| 4 | 1 | 0 | 0 | 0 |
| 5 | 2 | 0 | 1 | 0 |
| 6 | 2 | 0 | 2 | 0 |
| 7 | 3 | 0 | 3 | 0 |
| 8 | 4 | 0 | 5 | 0 |
| 9 | 5 | 0 | 7 | 0 |
| 10 | 6 | 1 | 9 | 0 |
| 11 | 7 | 4 | 10 | 0 |
| 12 | 8 | 6 | 12 | 0 |
| 13 | 9 | 8 | 13 | 0 |
| 14 | 10 | 11 | 15 | 0 |
| 15 | 11 | 13 | 16 | 0 |
| 16 | 11 | 15 | 18 | 0 |
| 17 | 12 | 17 | 19 | 0 |
| 18 | 13 | 19 | 20 | 0 |
| 19 | 14 | 21 | 21 | 0 |
| 20 | 14 | 29 | 25 | 35 |
| 21 | 15 | 42 | 30 | 106 |
| 22 | 15 | 55 | 35 | 176 |
| 23 | 16 | 68 | 40 | 246 |
| 24 | 17 | 81 | 45 | 315 |
| 25 | 17 | 94 | 50 | 448 |
| 26 | 18 | 107 | 55 | 646 |
| 27 | 19 | 120 | 60 | 845 |
| 28 | 19 | 132 | 65 | 1 045 |
| 29 | 20 | 145 | 70 | 1 246 |
| 30 | 28 | 158 | 75 | 1 528 |
| 31 | 44 | 171 | 81 | 1 890 |
| 32 | 59 | 184 | 86 | 2 252 |
| 33 | 75 | 196 | 91 | 2 612 |
| 34 | 90 | 209 | 96 | 2 971 |
| 35 | 106 | 246 | 108 | 3 424 |
| 36 | 122 | 308 | 126 | 3 971 |
| 37 | 138 | 369 | 144 | 4 517 |
| 38 | 154 | 430 | 163 | 5 062 |
| 39 | 170 | 491 | 181 | 5 606 |
| 40 | 209 | 550 | 199 | 6 217 |
| 41 | 272 | 609 | 217 | 6 896 |
| 42 | 335 | 667 | 235 | 7 572 |
| 43 | 398 | 725 | 253 | 8 245 |
| 44 | 461 | 783 | 270 | 8 913 |
| 45 | 527 | 840 | 288 | 9 660 |
| 46 | 595 | 896 | 305 | 10 480 |
| 47 | 661 | 950 | 321 | 11 288 |
| 48 | 726 | 1 002 | 337 | 12 086 |
| 49 | 789 | 1 053 | 352 | 12 872 |
| 50 | 900 | 1 146 | 381 | 13 732 |
| 51 | 1 055 | 1 279 | 422 | 14 660 |
| 52 | 1 206 | 1 406 | 461 | 15 572 |
| 53 | 1 353 | 1 528 | 498 | 16 467 |
| 54 | 1 497 | 1 644 | 532 | 17 343 |
| 55 | 1 636 | 1 754 | 565 | 18 319 |
| 56 | 1 777 | 1 861 | 596 | 19 396 |
| 57 | 1 920 | 1 965 | 627 | 20 455 |
| 58 | 2 065 | 2 066 | 657 | 21 495 |
| 59 | 2 209 | 2 163 | 686 | 22 510 |
| 60 | 2 424 | 2 255 | 713 | 23 637 |
| 61 | 2 702 | 2 339 | 737 | 24 863 |
| 62 | 2 971 | 2 413 | 759 | 26 041 |
| 63 | 3 230 | 2 477 | 777 | 27 169 |
| 64 | 3 479 | 2 530 | 791 | 28 241 |
| 65 | 3 727 | 2 594 | 811 | 29 378 |
| 66 | 3 965 | 2 657 | 828 | 30 552 |
| 67 | 4 179 | 2 693 | 830 | 31 628 |
| 68 | 4 372 | 2 705 | 819 | 32 608 |
| 69 | 4 544 | 2 693 | 795 | 33 492 |
| 70 | 4 689 | 2 660 | 759 | 34 317 |
| 71 | 4 808 | 2 606 | 713 | 35 077 |
| 72 | 4 911 | 2 534 | 657 | 35 735 |
| 73 | 5 000 | 2 446 | 594 | 36 295 |
| 74 | 5 075 | 2 345 | 523 | 36 759 |
| 75 | 5 137 | 2 233 | 448 | 37 134 |
| 76 | 5 187 | 2 113 | 369 | 37 425 |
| 77 | 5 225 | 1 990 | 290 | 37 641 |
| 78 | 5 255 | 1 866 | 211 | 37 791 |
| 79 | 5 276 | 1 745 | 135 | 37 886 |
| 80 | 5 290 | 1 630 | 64 | 37 936 |
| 81 | 5 300 | 1 525 | -1 | 37 954 |
| 82 | 5 305 | 1 431 | -58 | 37 948 |
| 83 | 5 308 | 1 350 | -108 | 37 929 |
| 84 | 5 309 | 1 282 | -149 | 37 902 |
| 85 | 5 308 | 1 226 | -182 | 37 873 |
| 86 | 5 308 | 1 183 | -209 | 37 845 |
| 87 | 5 307 | 1 149 | -229 | 37 822 |
| 88 | 5 306 | 1 125 | -243 | 37 802 |
| 89 | 5 305 | 1 107 | -254 | 37 788 |
| 90 | 5 305 | 1 095 | -261 | 37 777 |
Abbreviations: CHD, coronary heart disease; COPD, chronic obstructive pulmonary disease; GDP, gross domestic product; QALY, quality-adjusted life year; SFG, smoke-free generation.
After 10 years, the policy would not impact life years but would lead to substantive gains in QALYs (15700) and a modest decrease in health care costs for smoking-related diseases ($3.0 million). The benefits increase over time with life years gained increasing to 214 after 25 years, 39475 after 50 years and 769042 after 90 years, QALYs gained increasing to 122766 after 25 years, 476814 after 50 years and 1545288 after 90 years and health care costs averted increasing to $66.7 million after 25 years, $2.3 billion after 50 years and $15.3 billion after 90 years. Similarly, the negative impacts of a policy on tobacco tax revenue and Canadian GDP from the tobacco industry increase over time: tax revenues foregone will be $403.5 million after 10 years, $2.6 billion after 25 years, $7.4 billion after 50 years and $14.7 billion after 90 years; decline in GDP would be $170.3 million after 10 years, $1.1 billion after 25 years, $3.1 billion after 50 years and $6.2 billion after 90 years (Table 2).
At 50 years, the proportion of outcomes that occur in females is 28% for life years, 35% for both QALYs and health care costs avoided, and 39% for both tax revenues foregone and decline in GDP (data not shown). Up until Year 9, the largest number of cumulative disease cases prevented is for lung cancer; from Year 10 until Year 21, the largest number of cumulative cases prevented is for CHD and thereafter the largest number of cumulative cases prevented is for COPD (Figure 3c).
For all years the cumulative health care costs averted are less than the sum of tax revenues foregone and decline in GDP, though after 58 years, the annual health care costs averted exceed the sum of tax revenues foregone and decline in GDP (Figures 2b and 3b). After 50 years, if a QALY was valued at at least $17147, the combined value of the QALYs gained and the health care costs averted would exceed the sum of lost tax revenues and reduction in GDP by $36423 after 10 years, $29738 after 25 years and $3605 after 90 years (data not shown).
Scenario analyses
Scenario analyses for cumulative outcomes up to 50 years show that results are consistent across all scenarios explored (Table 4). Although the magnitude of impacts varies across scenarios, the relative values across each component remains consistent. Within the scenario analyses, the necessary threshold value for a QALY required for the SFG policy to be optimal, which was $17147 in the base case, varies between $14091 and $20909, highlighting the consistency in the results.
| Group/scenario | Net impact of a smoke-free generation policy after 50 years | |||||
|---|---|---|---|---|---|---|
| Life years gained | QALYs gained | Health care costs averted, $ | Decline in tax revenue, $ | Reduction in GDP, $ | Threshold value of a QALY, $ | |
| Base case | 39 475 | 476 814 | 2 347 379 210 | 7 399 915 299 | 3 123 554 752 | 17 147 |
| Males | 28 286 | 310 462 | 1 514 942 781 | 4 486 393 321 | 1 893 737 240 | 15 671 |
| Females | 11 190 | 166 352 | 832 436 429 | 2 913 521 978 | 1 229 817 511 | 19 903 |
| 0% discount rate | 108 341 | 918 711 | 5 835 615 560 | 13 206 427 893 | 5 574 523 346 | 14 091 |
| 3% discount rate | 20 981 | 295 559 | 1 278 456 727 | 4 789 828 352 | 2 021 819 238 | 18 721 |
| 5% discount rate | 9271 | 165 492 | 587 057 331 | 2 846 037 620 | 1 201 331 904 | 20 909 |
| 5-year lag in impact | 20 133 | 362 395 | 1 363 694 271 | 5 930 627 350 | 2 503 358 280 | 19 510 |
| 90% reduction in smoking uptake | 35 528 | 429 133 | 2 112 641 289 | 6 659 923 769 | 2 811 199 276 | 17 147 |
| Include non-smoking-related disease health care costs | 39 475 | 476 814 | 2 002 394 607 | 7 399 915 299 | 3 123 554 752 | 17 871 |
Discussion
The results show that, based on the study assumptions, imposing an SFG policy will lead to substantive health benefits and reduced health care expenses that are only partially offset by reduced tax revenues from smoking and a decline in GDP.
The general conclusions hold across multiple scenario analyses—including adding non–smoking-related disease health care costs, as scenario analysis found that when including all health care costs allowing for the increased life expectancy from the SFG policy, the SFG policy was still associated with reduced health care costs (a reduction of $2 002 394 607 rather than $2 347 379 210).
Analysis predicts that the government’s target for smoking prevalence of less than 5% would be achieved in 2035, should the SFG policy be introduced. Without the SFG policy, and based on current trends, the model predicts that a prevalence of less than 5% would be reached in 2040. The SFG policy would achieve further prevalence targets much more quickly. Of note, a smoking prevalence of less than 2.5% would be achieved in 2050 if the SFG policy were introduced but, without an SFG policy, this rate would not be reached until 2075.
Programs that reduce tobacco smoking also aim to reduce premature deaths, defined by Statistics Canada as deaths prior to age 75 years.Footnote 32 The model predicts that for a cohort of 15-year-olds, premature deaths would be reduced from 20.2% without the SFG policy to 19.3% with the SFG policy, a relative reduction of 4.6%.
Strengths and limitations
A major strength of this study is that it uses data pertinent to the Canadian population. However, a number of caveats and limitations should be considered when reviewing the results.
Analysis included the impact of the imposition of an SFG policy on both the amount of tax revenues raised through tobacco sales and the reduction in GDP from the tobacco industry. A concern to do with the introduction of smoking cessation policies is the impact on tax revenue and government expenditure. The percentage reduction in overall tax revenue from an SFG policy is minimal when considered alongside total taxes and government expenditure: equivalent to only 0.2% of total income tax raised and 0.06% of total government expenditure. It is also worth noting that the current analysis does not consider the additional income tax raised by extensions to life expectancy through the SFG policy.
Further, decline in tax revenues is not a loss from a societal perspective as taxation is merely a transfer of funds from individuals to government. The impact of decreasing taxes will be uncertain as the changes in the level of taxation can be associated with either an increase or decrease in economic growth. Reducing the consumption of tobacco will lead to more disposable income available to consume other resources. Thus, by including both lost taxation and a decline in GDP as a negative offset, the estimated threshold values of a QALY required for an SFG policy to be beneficial are likely overestimated.
The analysis does not consider alternative policy options such as raising the legal age for the purchase of tobacco, access to vaping products, reducing nicotine standards for smoked tobacco products, increasing taxation on tobacco products or further restrictions on smoking in public.Footnote 33 Such policies are not necessarily mutually exclusive when considering an SFG policy as many of these target current rather than potential smokers. Of note, an SFG policy is akin to raising the legal age for smoking by one year each year. Thus, it avoids the concern that by raising the legal age for smoking to a fixed age there is the high likelihood that those below the legal age will access tobacco products as the disparity between the legal age and the age at which smoking commences remains minimal.
Another limitation with the analysis is that it relies on data for some input parameters (e.g. smoking-related mortality, relapse) that are not recent. Analysis is based on the most contemporaneous data available, but if input parameters have changed noticeably, results may vary.
In addition, although input parameters for the uptake of smoking and quit rates for smoking are based on the most contemporaneous data, they may change over time. This analysis is based on the assumption that such rates will be stable over the time horizon of the model. If uptake rates were to decline without an SFG policy, then the benefits of the SFG policy would decline proportionally. However, the general conclusion is that the benefits are higher than the negative consequences would hold.
Another limitation with the analysis is that it does not consider all the potential benefits and costs of implementing an SFG policy. As noted, the analysis does not include any additional income tax raised by the increased life expectancy through the SFG policy. The analysis also does not consider the impact of an SFG policy on existing illegal markets for tobacco purchase or the costs of enforcing tobacco-related legislation (estimated at $37.6 million per year in 2012).Footnote 34 Enforcement costs may grow in the initial years of implementation of an SFG policy but could subsequently decline as the prevalence of smoking declines across the population.
The arguments against tobacco control policies such as an SFG policy from advocates for the tobacco industry tend to focus on three areas: the denial of freedom of behaviour; the unworkability of such a policy; and the contribution of the tobacco industry to society through both GDP and tax generation.Footnote 6 It could be argued that the first argument is the least addressed by the analysis in this study. However, it is important to note that tobacco addiction is often initiated during childhood or at least before the age of 21 years, the minimum age for selling tobacco in many provinces. Further, the analysis does not incorporate any additional health and health care benefits from the decline in passive smoking as a result of an SFG policy. Analysis does demonstrate the substantive benefits of an SFG policy even if there is a lag in its effects or a less than perfect cessation of smoking uptake. Thus, concerns relating to unworkability are irrelevant. Analysis directly addresses the final argument by not focusing solely on the impacts on health and health care consumption.
Conclusion
This study highlights the impacts of imposing an SFG policy across Canada, and demonstrates that the health benefits and reduction in health care costs outweigh any positive contribution of tobacco smoking to the Canadian population.
Acknowledgements
Analysis is based on a revised version of a model developed in partnership with Dr. Catherine Pound of the University of Ottawa, Ottawa, Ontario, Canada.
Funding
None.
Conflicts of interest
None.
Author’s contributions and statement
DC: Conceptualization, methodology, formal analysis, writing – original draft, writing – review & editing.
The content and views expressed in this article are those of the author and do not necessarily reflect those of the Government of Canada.