
Transfusion Error Surveillance System (TESS): 2008-2011 Summary Results
Transfusion Error Surveillance System (TESS)
Acknowledgments: The development of the Transfusion Error Surveillance System (TESS) would not have been possible without the collaborative support and continued commitment of the many transfusion safety officers, medical laboratory technologists and other healthcare professionals in hospitals and blood transfusion services. Their dedication to reducing errors and increasing patient safety has led to the collection and analysis of the 2008-2011 the TESS data.
N.B. This document must be cited as the source for any information extracted and used from it.
Suggested citation: Public Health Agency of Canada. Transfusion Error Surveillance System (TESS) 2008-2011 Summary Results. Centre for Communicable Diseases and Infection Control, Public Health Agency of Canada, 2014.
Centre for Communicable Diseases and Infection Control
Public Health Agency of Canada
Tunney’s Pasture, AL 0602B
Ottawa, Ontario, K1A 0K9
E-mail: ccdic-clmti@phac-aspc.gc.ca
Information to the Reader of the Transfusion Error Surveillance System (TESS) 2008-2011 Summary Results
The Centre for Communicable Diseases and Infection Control (CCDIC) of the Public Health Agency of Canada (the Agency) is pleased to present the Transfusion Error Surveillance System (TESS) 2008-2011 Summary Results. These tabulated results present transfusion error surveillance data submitted by Canadian sentinel hospitals that participated in the Transfusion Error Surveillance System (TESS) from 2008 to 2011.
The TESS is a voluntary surveillance system established by the Agency to capture non-nominal data on errors occurring at any point in the transfusion chain, including those detected before or after transfusion of the blood product to the patient, as well as those that may or may not have resulted in adverse transfusion reactions. The overall goal of the TESS is to identify potential areas for improvement in the transfusion chain and, ultimately, improve patient safety in Canada.
CCDIC is responsible for the collection, management and analysis of the TESS data, as well as the production of reports summarizing key findings. CCDIC supports the use of these data to inform public health and policy action. In addition, CCDIC supports the Agency’s ongoing commitment to improving data quality, and to defining and setting surveillance standards.
Summary
The Transfusion Error Surveillance System (TESS) is a voluntary, anonymous, sentinel system that monitors the blood transfusion process for errors that involve patients who receive blood components or blood products (also known as plasma derivatives). Errors are defined as unexpected, unplanned deviations (attributable to human and the system/process) from standard operating procedures that could adversely affect the safety of patients or the quality of blood components or blood products. Initially launched as a pilot in 2005 with 11 hospitals from four Canadian provinces, the TESS moved to sentinel-type surveillance in 2008 with subsequent gradual recruitment of additional hospitals (one in 2008, two in 2009 and one more in 2010) to achieve a current total of 15 reporting hospitals. The sentinel hospitals participating in the TESS are responsible for about 9% of the transfusions of blood components and blood products performed in Canada each year.
From 2008 to 2011, 34,088 errors were reported to the TESS and of these, 33,622 (98.6%) were detected before and 466 (1.4%) after the blood component or blood product was transfused to the patient. Of the errors discovered before transfusion, no adverse outcomes were reported for 33,617 cases (99.99%) although there was a delay in the transfusion process for 1,036 (3.1%) of these cases. The remaining five cases (0.01%) were lost to follow up before any outcome could be determined. The majority of the errors discovered before transfusion (72%, n=24,173) occurred in clinical settings (hospitals units/wards where patients can receive a transfusion) with the remaining (28%, n=9,449) occurring in laboratory settings (blood suppliers, supplier/service providers, laboratory, and transfusion services). This distribution was very similar to that of the 466 errors identified after transfusion of the blood components or blood products with 74.9% occurring in clinical settings versus 25.1% occurring in the laboratory settings.
For the 466 errors discovered after the actual transfusion, which could have resulted in a patient developing an adverse reaction, the potential severity was assessed using an ordinal (low-medium-high) scale. Errors that had potential to cause serious injury or fatal outcome were assigned high potential severity, whereas those with potential to cause minor/transient injury were assigned medium potential severity. Low potential severity was assigned to errors with no potential for adverse effects. Of the 466 errors discovered after the actual transfusion had occurred, 66 (14.2%) were classified as potential high severity, 8 (1.7%) classified as potential medium severity and the remaining 392 (84.1%) were deemed to be of potential low severity. For the 400 low and medium potential severity errors, 59 (14.8%) were lost to follow up and the remaining 341 (85.2%) had no negative impact on the patients.
For the 66 errors of potential high severity, 16 resulted in an adverse transfusion reaction; 44 (66.7%) had no negative impact to the patients at all and no outcome data were available for the remaining 6 (9.1%) errors. The 16 (24.2%) errors that were associated with a transfusion reaction had the following outcomes: 8 were classified as a transfusion-associated circulatory overload (TACO), 2 as febrile non-hemolytic reaction, 1 as a mild transfusion reaction, and 5 could not be specified though were definitely related to transfusion. Errors that resulted in TACO were linked to inappropriate/incorrect/ order of blood components or blood products (n=6) and not following guidelines for infusion time (n=2), whereas the cases of febrile non-hemolytic (n=2) and mild (n=1) transfusion reactions were linked to administration of product with an incompatible IV fluid, incorrect order of blood component/blood product and not following guidelines for infusion time, respectively.
In conclusion, of the total 34,088 errors reported during the 2008 to 2011 time period, there were only 16 errors (1.4%) that resulted in adverse reactions and there were no deaths reported.
1. Types of errors
1.1. Coding of Transfusion Errors
Errors captured through the TESS are of different types (Table 1) depending on where they occurred in the blood transfusion chain (Figure 1) and when they are discovered (either before or after the actual transfusion). For instance, distributor code (DC) errors can originate from blood suppliers, which in the TESS context include not only the Canadian Blood Services (CBS) and Héma-Québec (HQ), but also hospitals of larger capacity that serve as intermediary between the blood suppliers and hospitals of smaller capacity. Those involving sample collection (SC) usually occur on hospital wards in general compared to sample receipt (SR) and sample testing (ST) errors that will only occur in the transfusion laboratory where testing takes place. Errors like those involving sample handling (SH) or unit storage (US) errors could occur at multiple locations in the blood transfusion chain (Figure 1). Within each type of errors, specific errors were assigned numerical codes and the complete list of these codes is available in the surveillance manual and can be provided upon request.
1.2. Calculation of the Occurrence Rates of Transfusion Errors
Annual rates of occurrence of errors involving DC, PC, US, IM, PR, RP, PS, UM, UI and UT were calculated using the total units of product received, requested, prepared or issued per surveillance year as denominator (Table 1). For errors related to sample collection (SC), sample handling (SH), and sample receipt (SR), the corresponding denominator was the total number of samples received during the surveillance year, whereas for sample testing (ST) errors, it was the total number of tests performed.
Overall, a total of 625,907 blood samples were received by the laboratories where over a million and two hundred thousand tests were performed (Tables 2A & 2B). In parallel, blood banks of the TESS network received over 881,366 requests for blood components and blood products and issued a total of 859,624. Since 2009, the number of samples received, and the numbers of units of product requested and received have been decreasing gradually. At the same time, that of the tests performed has been increasing after a 25% decrease in 2009 (Table 2A). Table 2B displays the breakdown of the denominator data by the different categories of hospitals defined by the volume of transfusions preformed per year.
| Error code | Type of error | Description | Corresponding denominator |
|---|---|---|---|
| DC | Distributor codes |
|
Units of product received |
| PC | Product check-in |
|
|
| US | Unit storage |
|
|
| IM | Inventory Management |
|
|
| PR | Product request |
|
Units of product requested |
| RP | Request for pick-up |
|
|
| PS | Product selection |
|
Units of product prepared |
| UM | Unit manipulation |
|
|
| UI | Unit issued |
|
Units of product issued (by Blood Bank) |
| UT | Unit transfusion |
|
|
| SC | Sample collection |
|
Samples received |
| SH | Sample handling |
|
|
| SR | Sample receipt |
|
|
| ST | Sample testing |
|
Tests performed (including screening) |
| MS | Miscellaneous |
|
- |
| 2008 | 2009 | 2010 | 2011 | Total | |
|---|---|---|---|---|---|
| Total number of samples received | 166,703 | 169,942 | 149,945 | 139,317 | 625,907 |
| Total number of tests performed | 359,740 | 270,706 | 277,039 | 294,944 | 1,202,429 |
| Total units of products received | 231,042 | 230,572 | 210,846 | 206,866 | 879,326 |
| Total units of products requested | 221,226 | 228,817 | 218,882 | 212,441 | 881,366 |
| Total units of products prepared | 233,142 | 239,239 | 237,203 | 249,635 | 959,219 |
| Total units of products issued | 214,850 | 223,115 | 215,836 | 205,823 | 859,624 |
| Hospitals of small capacity (< 2,000 blood component transfusions) |
Hospitals of medium capacity (2,000 to 10,000 blood component transfusions) |
Hospitals of large capacity (>10,000 blood component Transfusions) |
Total | |
|---|---|---|---|---|
| Total number of samples received | 52,218 | 207,668 | 366,021 | 625,907 |
| Total number of tests performed | 48,969 | 336,516 | 816,944 | 1,202,429 |
| Total units of products received | 25,339 | 234,864 | 619,123 | 879,326 |
| Total units of products requested | 19,926 | 239,668 | 621,772 | 881,366 |
| Total units of products prepared | 20,542 | 283,842 | 654,835 | 959,219 |
| Total units of products issued | 18,527 | 234,389 | 606,708 | 859,624 |
Figure 1. Blood Transfusion Chain: Transfusion Process & types of errors associated with each step

Text Equivalent - Figure 1
The transfusion chain described in Figure 1 indicates where each category of errors occurs. They are errors that occur only in laboratory (blood suppliers, laboratory services, supplier/ service providers or transfusion services) or clinical settings (i.e. hospital units/wards where patients receive transfusion care: operating room, emergency room, outpatient clinic, intensive care unit, obstetrics, etc.) and errors that can occur in both. DC, PC, IM, SR, ST, UI and UM errors occur only in laboratory setting while errors related to SC or UT only occur in clinical setting.
N.B. * Miscellaneous (MS) errors can be captured outside of the standardized codes presented in this figure.
Overall, 34,088 transfusion errors met the surveillance criteria and of these, the most common were related to the collections (n=13,680) and handling (n=3,547) of blood samples which accounted for over 50% of the cases (Figure 2). Errors involving unit transfusions (n=3,013), product requests (n=2,673), sample receipt (n=2,124) and sample testing (n=2,476) constituted the second most frequent groups and accounted for over 39% of the cases (Figure 3). The least common of all the errors were those related to product storage (Figure 2) as only 70 cases were reported for the entire 2008-2011 period (Figure 2).
Figure 2. Annual frequency of transfusion errors by type (n=34,088), TESS 2008-2011
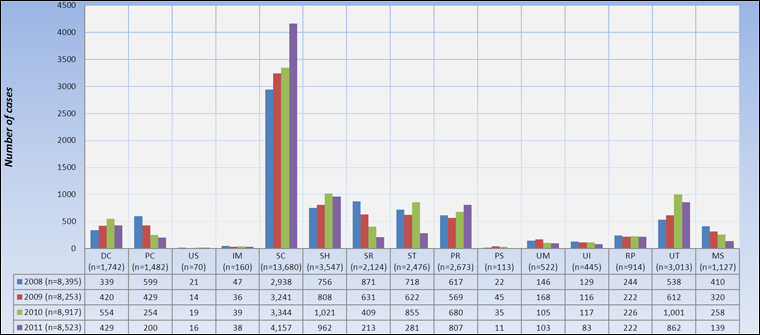
Text Equivalent - Figure 2
| 2008 (n=8,395) | 2009 (n=8,253) | 2010 (n=8,917) | 2011 (n=8,523) | |
|---|---|---|---|---|
| DC (n=1,742) | 339 | 420 | 554 | 429 |
| PC (n=1,482) | 599 | 429 | 254 | 200 |
| US (n=70) | 21 | 14 | 19 | 16 |
| IM (n=160) | 47 | 36 | 39 | 38 |
| SC (n=13,680) | 2,938 | 3,241 | 3,344 | 4,157 |
| SH (n=3,547) | 756 | 808 | 1,021 | 962 |
| SR (n=2,124) | 871 | 631 | 409 | 213 |
| ST (n=2,476) | 718 | 622 | 855 | 281 |
| PR (n=2,673) | 617 | 569 | 680 | 807 |
| PS (n=113) | 22 | 45 | 35 | 11 |
| UM (n=522) | 146 | 168 | 105 | 103 |
| UI (n=445) | 129 | 116 | 117 | 83 |
| RP (n=914) | 244 | 222 | 226 | 222 |
| UT (n=3,013) | 538 | 612 | 1,001 | 862 |
| MS (n=1,127) | 410 | 320 | 258 | 139 |
Overall, 34,088 transfusion errors met the surveillance criteria and of these, the most common were related to the collections (n=13,680) and handling (n=3,547) of blood samples which accounted for over 50% of the cases (Figure 2). Errors involving unit transfusions (n=3,013), product requests (n=2,673), sample receipt (n=2,124) and sample testing (n=2,476) constituted the second most frequent groups and accounted for over 39% of the cases (Figure 3). The least common of all the errors were those related to product storage (Figure 2) as only 70 cases were reported for the entire 2008-2011 period (Figure 2).
The number of errors related to sample collection (n=13,680) has been increasing significantly (p<0.05) over time (Figure 3). The most common of these errors (Table 3) have been haemolysis of samples (34.9%), labelingFootnote 1 (34.9%), and unnecessary collections (21.7%). Locations which reported highest numbers (Table 3) included emergency rooms (39.7%), medical/surgical wards (29.8%), and outpatient clinics (13.3%).
| Sample collection Errors | Transfusion Service | Supplier/ Service provider | Laboratory service | Medical/ Surgical Ward | Emergency Room | Outpatient clinic | Intensive care unit | Operating Room | Obstetrics unit | Recovery room | Overall | |||||||||||
|---|---|---|---|---|---|---|---|---|---|---|---|---|---|---|---|---|---|---|---|---|---|---|
| Freq. | % | Freq. | % | Freq. | % | Freq. | % | Freq. | % | Freq. | % | Freq. | % | Freq. | % | Freq. | % | Freq. | % | Freq. | % | |
| SC 01 | 0 | 0.0% | 2 | 0.0% | 0 | 0.0% | 45 | 0.3% | 44 | 0.3% | 48 | 0.4% | 27 | 0.2% | 10 | 0.1% | 67 | 0.5% | 0 | 0.0% | 243 | 1.8% |
| SC 02 | 0 | 0.0% | 1 | 0.0% | 0 | 0.0% | 91 | 0.7% | 109 | 0.8% | 50 | 0.4% | 74 | 0.5% | 12 | 0.1% | 42 | 0.3% | 0 | 0.0% | 379 | 2.8% |
| SC 03 | 0 | 0.0% | 0 | 0.0% | 0 | 0.0% | 32 | 0.2% | 38 | 0.3% | 13 | 0.1% | 9 | 0.1% | 1 | 0.0% | 12 | 0.1% | 0 | 0.0% | 105 | 0.8% |
| SC 04 | 0 | 0.0% | 0 | 0.0% | 0 | 0.0% | 157 | 1.1% | 83 | 0.6% | 50 | 0.4% | 85 | 0.6% | 10 | 0.1% | 48 | 0.4% | 1 | 0.0% | 434 | 3.2% |
| SC 05 | 0 | 0.0% | 0 | 0.0% | 0 | 0.0% | 33 | 0.2% | 106 | 0.8% | 7 | 0.1% | 6 | 0.0% | 0 | 0.0% | 8 | 0.1% | 0 | 0.0% | 160 | 1.2% |
| SC 06 | 0 | 0.0% | 1 | 0.0% | 0 | 0.0% | 746 | 5.5% | 3,120 | 22.8% | 452 | 3.3% | 205 | 1.5% | 167 | 1.2% | 79 | 0.6% | 2 | 0.0% | 4,772 | 34.9% |
| SC 07 | 0 | 0.0% | 1 | 0.0% | 6 | 0.0% | 697 | 5.1% | 508 | 3.7% | 273 | 2.0% | 248 | 1.8% | 57 | 0.4% | 91 | 0.7% | 1 | 0.0% | 1,882 | 13.8% |
| SC 08 | 1 | 0.0% | 0 | 0.0% | 0 | 0.0% | 1,336 | 9.8% | 773 | 5.7% | 264 | 1.9% | 309 | 2.3% | 97 | 0.7% | 188 | 1.4% | 0 | 0.0% | 2,968 | 21.7% |
| SC 09 | 0 | 0.0% | 0 | 0.0% | 1 | 0.0% | 42 | 0.3% | 60 | 0.4% | 39 | 0.3% | 41 | 0.3% | 1 | 0.0% | 7 | 0.1% | 0 | 0.0% | 191 | 1.4% |
| SC 10 | 0 | 0.0% | 0 | 0.0% | 0 | 0.0% | 5 | 0.0% | 3 | 0.0% | 16 | 0.1% | 1 | 0.0% | 0 | 0.0% | 1 | 0.0% | 0 | 0.0% | 26 | 0.2% |
| SC 12 | 2 | 0.0% | 3 | 0.0% | 5 | 0.0% | 850 | 6.2% | 539 | 3.9% | 524 | 3.8% | 191 | 1.4% | 49 | 0.4% | 65 | 0.5% | 0 | 0.0% | 2,228 | 16.3% |
| SC 99 | 1 | 0.0% | 1 | 0.0% | 0 | 0.0% | 44 | 0.3% | 48 | 0.4% | 79 | 0.6% | 29 | 0.2% | 54 | 0.4% | 35 | 0.3% | 1 | 0.0% | 292 | 2.1% |
| Total | 4 | 0.0% | 9 | 0.1% | 12 | 0.1% | 4,078 | 29.8% | 5,431 | 39.7% | 1,815 | 13.3% | 1,225 | 9.0% | 458 | 3.3% | 643 | 4.7% | 5 | 0.0% | 13,680 | 100% |
|
|
|||||||||||||||||||||
1. Occurrence and discovery locations of errors reported through the TESS from 2008 to 2011
Over 98% (N=33,622) of all reported transfusion errors were detected before transfusion (Figure 3), therefore did not cause any harm to the patients. This shows a robust system with checks and balances in place in Canadian hospitals participating in the TESS.
Figure 3. Frequency of transfusion errors by processes during which they were discovered, TESS 2008-2011
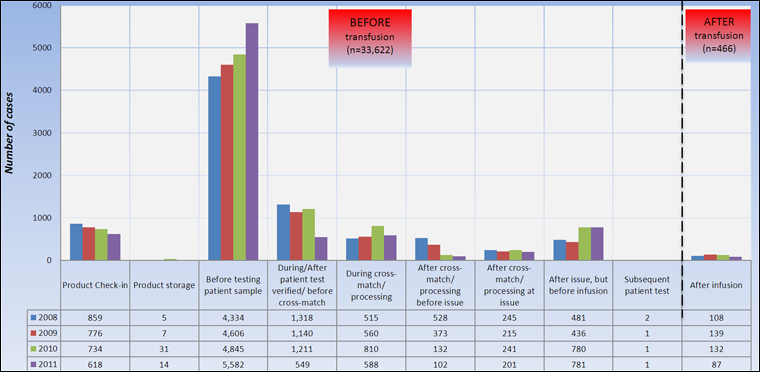
Text Equivalent - Figure 3
| 2008 | 2009 | 2010 | 2011 | |
|---|---|---|---|---|
| Product Check-in | 859 | 776 | 734 | 618 |
| Product storage | 5 | 7 | 31 | 14 |
| Before testing patient sample | 4,334 | 4,606 | 4,845 | 5,582 |
| During/After patient test verified/ before cross-match | 1,318 | 1,140 | 1,211 | 549 |
| During cross-match/ processing | 515 | 560 | 810 | 588 |
| After cross-match/ processing before issue | 528 | 373 | 132 | 102 |
| After cross-match/ processing at issue | 245 | 215 | 241 | 201 |
| After issue, but before infusion | 481 | 436 | 780 | 781 |
| Subsequent patient test | 2 | 1 | 1 | 1 |
| After infusion | 108 | 139 | 132 | 87 |
Over 98% (N=33,622) of all reported transfusion errors were detected before transfusion (Figure 3), therefore did not cause any harm to the patients. This shows a robust system with checks and balances in place in Canadian hospitals participating in the TESS.
Transfusion service reported the highest proportion of errors (22.5%) and the highest detection rate (95.4%) as displayed in Table 3. The vast majority of errors occurring in other settings (87.5% to 98.1%) were detected by the transfusion service (Table 3).
| Discovery location | ||||||||||||
|---|---|---|---|---|---|---|---|---|---|---|---|---|
| Occurrence location | Transfusion service | Blood Supplier | Supplier / Service provider | Laboratory service | Medical/ Surgical unit | Emergency Room | Outpatient clinic | Intensive care unit | Operating Room | Obstetrics unit | Recovery room | Total |
| Transfusion Service | 7,354 | 7 | 12 | 6 | 71 | 14 | 92 | 36 | 60 | 11 | 3 | 7,666 |
| Blood Supplier | 1,297 | 10 | 0 | 0 | 22 | 5 | 21 | 12 | 11 | 0 | 0 | 1,378 |
| Supplier/Service provider | 380 | 5 | 1 | 1 | 4 | 4 | 3 | 3 | 1 | 0 | 0 | 402 |
| Laboratory Service | 111 | 0 | 0 | 5 | 2 | 0 | 0 | 2 | 0 | 0 | 0 | 120 |
| Medical/ Surgical Unit | 6,864 | 0 | 0 | 7 | 261 | 0 | 6 | 2 | 4 | 0 | 0 | 7,144 |
| Emergency Room | 6,920 | 0 | 1 | 5 | 10 | 122 | 1 | 3 | 3 | 0 | 0 | 7,065 |
| Outpatient Clinic | 3,901 | 0 | 0 | 2 | 1 | 0 | 140 | 0 | 6 | 0 | 1 | 4,051 |
| Intensive care Unit | 2,868 | 0 | 2 | 6 | 1 | 2 | 0 | 387 | 1 | 0 | 0 | 3,267 |
| Operating Room | 1,430 | 0 | 0 | 5 | 1 | 0 | 0 | 5 | 126 | 0 | 4 | 1,571 |
| Obstetrics Unit | 1,365 | 0 | 0 | 6 | 1 | 0 | 1 | 0 | 0 | 19 | 0 | 1,392 |
| Recovery Room | 28 | 0 | 0 | 0 | 1 | 0 | 0 | 1 | 0 | 0 | 2 | 32 |
| Total | 32,518 | 22 | 16 | 43 | 375 | 147 | 264 | 451 | 212 | 30 | 10 | 34,088 |
2. Errors Discovered after Transfusion, TESS 2008 - 2011
Overall, 466 (1.4%) transfusion errors reported through the TESS between 2008 and 2011were discovered after the actual transfusion (Figure 3). Errors related to storage (n=1) and requests for pick-up of blood components/products (n=1) were the fewest and occurred respectively once per 879,326 or 881,366 units of products requested; whereas those related to unit transfusions (n=278) were the most frequent with an occurrence rate of 1 per 3,092 units of products transfused (Table 5A). However, the frequency of unit transfusion errors discovered after transfusion has been decreasing significantly (p<0.05) after a substantial 50% increase in 2009 (Table 5A). In 2010, it decreased by 16% and the following year by 33% (Table 5A).
| Error codeTable 5A - Footnote 1 | 2008 | 2009 | 2010 | 2011 | Total | ||||||||||
|---|---|---|---|---|---|---|---|---|---|---|---|---|---|---|---|
| Freq. | Rate per 100,000 | Risk of one error | Freq. | Rate per 100,000 | Risk of one error | Freq. | Rate per 100,000 | Risk of one error | Freq. | Rate per 100,000 | Risk of one error | Freq. | Rate per 100,000 | Risk of one error | |
| DC | 0 | 0 | - | 0 | 0 | - | 2 | 1 | 1: 105,423 | 0 | 0 | - | 2 | 0 | 1: 439,663 |
| PR | 18 | 8 | 1: 12,290 | 12 | 5 | 1: 19,068 | 16 | 7 | 1: 13,680 | 18 | 8 | 1: 11,802 | 64 | 7 | 1: 13,771 |
| RP | 1 | 0 | 1: 221,226 | 0 | 0 | - | 0 | 0 | - | 0 | 0 | - | 1 | 0 | 1: 881,366 |
| PC | 2 | 1 | 1: 115,521 | 0 | 0 | - | 0 | 0 | - | 1 | 0 | 1: 206,866 | 3 | 0 | 1: 293,109 |
| US | 0 | 0 | - | 1 | 0 | 1: 230,572 | 0 | 0 | - | 0 | 0 | - | 1 | 0 | 1: 879,326 |
| IM | 2 | 1 | 1: 115,521 | 0 | 0 | - | 2 | 1 | 1: 105,423 | 3 | 1 | 1: 68,955 | 7 | 1 | 1: 125,618 |
| UM | 1 | 0 | 1: 233,142 | 0 | 0 | - | 4 | 2 | 1: 59,301 | 1 | 0 | 1: 249,635 | 6 | 1 | 1: 159,870 |
| PS | 1 | 0 | 1: 233,142 | 7 | 3 | 1: 34,177 | 4 | 2 | 1: 59,301 | 1 | 0 | 1: 249,635 | 13 | 1 | 1: 73,786 |
| UI | 10 | 5 | 1: 21,485 | 14 | 6 | 1: 15,937 | 11 | 5 | 1: 19,621 | 8 | 4 | 1: 25,728 | 43 | 5 | 1: 19,991 |
| UT | 63 | 29 | 1: 3,410 | 95 | 43 | 1: 2,349 | 78 | 36 | 1: 2,767 | 42 | 20 | 1: 4,901 | 278 | 32 | 1: 3,092 |
| SH | 1 | 1 | 1: 166,703 | 2 | 1 | 1: 84,971 | 3 | 2 | 1: 49,982 | 1 | 1 | 1: 139,317 | 7 | 1 | 1: 89,415 |
| SR | 4 | 2 | 1: 41,676 | 5 | 3 | 1: 33,988 | 7 | 5 | 1: 21,421 | 6 | 4 | 1: 23,220 | 22 | 4 | 1: 28,450 |
| ST | 5 | 3 | 1: 33,341 | 3 | 2 | 1: 56,647 | 5 | 3 | 1: 29,989 | 4 | 3 | 1: 34,829 | 17 | 3 | 1: 70,731 |
| MSTable 4A - Footnote 2 | 0 | - | - | 0 | - | - | 0 | - | - | 2 | - | - | 2 | - | - |
| TotalTable 4A - Footnote 2 | 108 | - | - | 139 | - | - | 132 | - | - | 87 | - | - | 466 | - | - |
| Error codeTable 5B - Footnote 1 | Small (less than 2,000 transfusions per year) |
Medium (between 2,000 & 10,000 transfusions per year) |
Large (more than 10,000 transfusions per year) |
Total | ||||||||
|---|---|---|---|---|---|---|---|---|---|---|---|---|
| Freq. | Rate per 100,000 | Risk of one error | Freq. | Rate per 100,000 | Risk of one error | Freq. | Rate per 100,000 | Risk of one error | Freq. | Rate per 100,000 | Risk of one error | |
| DC | 0 | 0.0 | - | 2 | 0.9 | 1: 117,432 | 0 | 0.0 | - | 2 | 0.2 | 1: 439,663 |
| PR | 3 | 15.1 | 1: 6,642 | 5 | 2.1 | 1: 47,934 | 56 | 9.0 | 1: 11,103 | 64 | 7.3 | 1: 13,771 |
| RP | 0 | 0.0 | - | 0 | 0.0 | - | 1 | 0.2 | 1: 621,772 | 1 | 0.1 | 1: 881,366 |
| PC | 0 | 0.0 | - | 0 | 0.0 | - | 3 | 0.5 | 1: 206,374 | 3 | 0.3 | 1: 293,109 |
| US | 0 | 0.0 | - | 0 | 0.0 | - | 1 | 0.2 | 1: 619,123 | 1 | 0.1 | 1: 879,326 |
| IM | 2 | 7.9 | 1: 12,670 | 3 | 1.3 | 1: 78,288 | 2 | 0.3 | 1: 309,562 | 7 | 0.8 | 1: 125,618 |
| UM | 0 | 0.0 | - | 4 | 1.4 | 1: 70,961 | 2 | 0.3 | 1: 327,418 | 6 | 0.6 | 1: 159,870 |
| PS | 0 | 0.0 | - | 3 | 1.1 | 1: 94,614 | 10 | 1.5 | 1: 65,484 | 13 | 1.4 | 1: 73,786 |
| UI | 2 | 10.8 | 1: 9,264 | 11 | 4.7 | 1: 21,308 | 30 | 4.9 | 1: 20,224 | 43 | 5.0 | 1: 19,991 |
| UT | 4 | 21.6 | 1: 4,632 | 192 | 81.9 | 1: 1,221 | 82 | 13.5 | 1: 7,399 | 278 | 32.3 | 1: 3,092 |
| SH | 0 | 0.0 | - | 0 | 0.0 | - | 7 | 1.9 | 1: 52,289 | 7 | 1.1 | 1: 89,415 |
| SR | 0 | 0.0 | - | 4 | 1.9 | 1: 51,917 | 18 | 4.9 | 1: 20,335 | 22 | 3.5 | 1: 28,450 |
| ST | 0 | 0.0 | - | 3 | 0.9 | 1: 112,172 | 14 | 1.7 | 1: 58,353 | 17 | 1.4 | 1: 70,731 |
| MS | 0 | - | - | 0 | - | - | 2 | - | - | 0 | - | - |
| Total | 11 | - | - | 227 | - | - | 228 | - | - | 466 | - | - |
|
||||||||||||
Table 5B provides the rate of each of the errors discovered after transfusion by the hospitals’ capacity. For example, errors related to UT occurred at different frequencies depending on the type of hospitals: they were rare in hospitals of large capacity (one in 7,399 units of products issued against one in 4,632 or one in 1,221 respectively in hospitals of low and medium capacity (Table 5B).
Figure 4. Location of occurrence of errors discovered AFTER transfusion (n=466), TESS 2008-2011
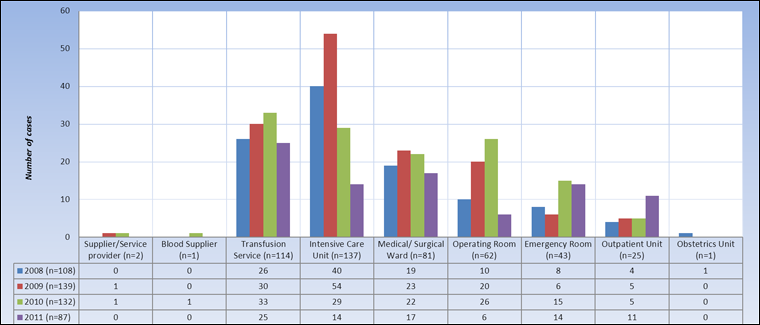
Text Equivalent - Figure 4
| 2008 (n=108) | 2009 (n=139) | 2010 (n=132) | 2011 (n=87) | |
|---|---|---|---|---|
| Supplier/Service provider (n=2) | 0 | 1 | 1 | 0 |
| Blood Supplier (n=1) | 0 | 0 | 1 | 0 |
| Transfusion Service (n=114) | 26 | 30 | 33 | 25 |
| Intensive Care Unit (n=137) | 40 | 54 | 29 | 14 |
| Medical/ Surgical Ward (n=81) | 19 | 23 | 22 | 17 |
| Operating Room (n=62) | 10 | 20 | 26 | 6 |
| Emergency Room (n=43) | 8 | 6 | 15 | 14 |
| Outpatient Unit (n=25) | 4 | 5 | 5 | 11 |
| Obstetrics Unit (n=1) | 1 | 0 | 0 | 0 |
The majority of errors discovered after the actual blood transfusion originated from intensive care units (n=137), transfusion services (n=114), medical/surgical wards (n=81) and operating rooms (n=62). Also, after peaking at a total of 139 cases in 2009, the number of these errors did not change until 2011 when it declined significantly (p<0.01) from 132 to 87. Operating rooms and intensive care units recorded highest (p<0.01) decreases: 77% (from 26 cases in 2010 to six in 2011) and 52% (from 29 cases in 2010 to 14 in 2011), respectively (Figure 4).
The majority of errors discovered after the actual blood transfusion originated from intensive care units (n=137), transfusion services (n=114), medical/surgical wards (n=81) and operating rooms (n=62). Also, after peaking at a total of 139 cases in 2009, the number of these errors did not change until 2011 when it declined significantly (p<0.01) from 132 to 87. Operating rooms and intensive care units recorded highest (p<0.01) decreases: 77% (from 26 cases in 2010 to six in 2011) and 52% (from 29 cases in 2010 to 14 in 2011), respectively (Figure 4).
Figure 5. Detection timeline (time delay between occurrence & detection) of errors discovered AFTER (n=466) transfusion, TESS 2008 – 2011
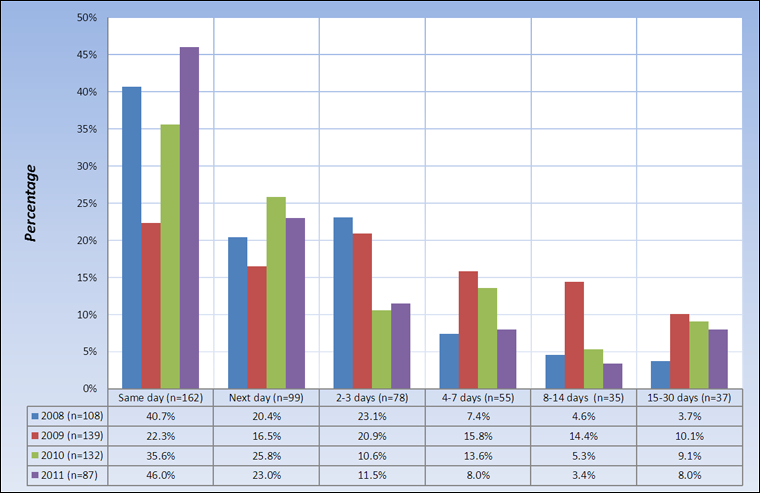
Text Equivalent - Figure 5
| 2008 (n=108) | 2009 (n=139) | 2010 (n=132) | 2011 (n=87) | |
|---|---|---|---|---|
| Same day (n=162) | 40.7% | 22.3% | 35.6% | 46.0% |
| Next day (n=99) | 20.4% | 16.5% | 25.8% | 23.0% |
| 2-3 days (n=78) | 23.1% | 20.9% | 10.6% | 11.5% |
| 4-7 days (n=55) | 7.4% | 15.8% | 13.6% | 8.0% |
| 8-14 days (n=35) | 4.6% | 14.4% | 5.3% | 3.4% |
| 15-30 days (n=37) | 3.7% | 10.1% | 9.1% | 8.0% |
Overall same-day detection rate of transfusion errors discovered after transfusion had occurred, ranged from 22.3% in 2009 to 46.0% in 2011 (Figure 5). It initially sharply declined from 40.7% in 2008 to 22.3% in 2009 and has significantly (p=0.05) been increasing since then. This is an indication that hospitals participating in the TESS are continuously making efforts to ensure transfusion safety.
Overall same-day detection rate of transfusion errors discovered after transfusion had occurred, ranged from 22.3% in 2009 to 46.0% in 2011 (Figure 5). It initially sharply declined from 40.7% in 2008 to 22.3% in 2009 and has significantly (p=0.05) been increasing since then. This is an indication that hospitals participating in the TESS are continuously making efforts to ensure transfusion safety.
Over 82% (n=385) of the errors discovered after transfusion were errors related to requests (PR), issuance (UI) and transfusion (UT) of products (Figure 6). Unlike PR-related errors most of which were detected within 24 hours of their occurrence (56.3%), most of UI (53.5%) and UT (69.8%) errors were detected only a day or more after they had occurred (Figure 6).
Figure 6. Detection timeline of different types of errors discovered AFTER (n=466) transfusion, TESS 2008-2011

Text Equivalent - Figure 6
Over 82% (n=385) of the errors discovered after transfusion were errors related to requests (PR), issuance (UI) and transfusion (UT) of products (Figure 6). Unlike PR-related errors most of which were detected within 24 hours of their occurrence (56.3%), most of UI (53.5%) and UT (69.8%) errors were detected only a day or more after they had occurred (Figure 6).
3. Potential Severity of Errors Discovered after Transfusion (n=466), TESS 2008 - 2011
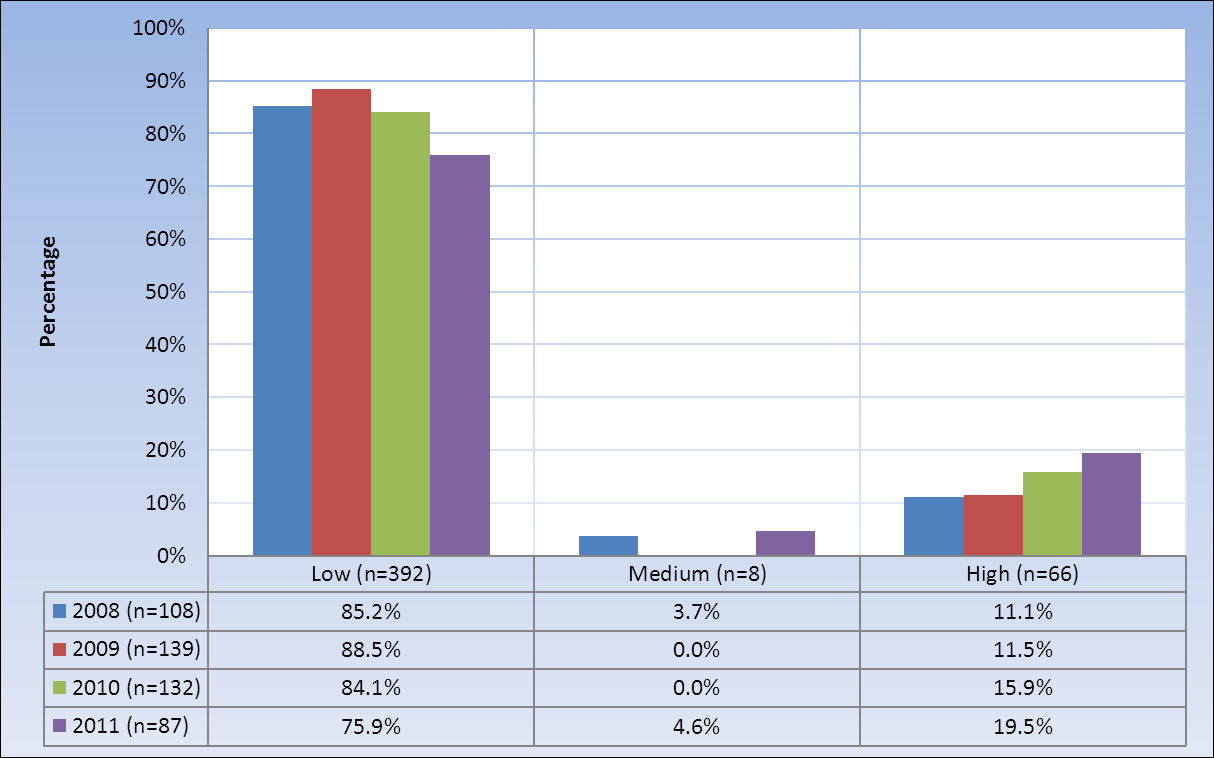
The majority (n=392) of errors discovered after blood transfusion were of potential low severity (Figure 7). However, the proportion has incrementally been decreasing in favour of the potential high severity group which started at 11% in 2008 and has since reached almost 20% (Figure 7).
Figure 7. Potential severity of errors discovered AFTER (n=466) transfusion, TESS 2008 - 2011

Text Equivalent - Figure 7
| 2008 (n=108) | 2009 (n=139) | 2010 (n=132) | 2011 (n=87) | |
|---|---|---|---|---|
| Low (n=392) | 85.2% | 88.5% | 84.1% | 75.9% |
| Medium (n=8) | 3.7% | 0.0% | 0.0% | 4.6% |
| High (n=66) | 11.1% | 11.5% | 15.9% | 19.5% |
The majority (n=392) of errors discovered after blood transfusion were of potential low severity (Figure 7). However, the proportion has incrementally been decreasing in favour of the potential high severity group which started at 11% in 2008 and has since reached almost 20% (Figure 7).
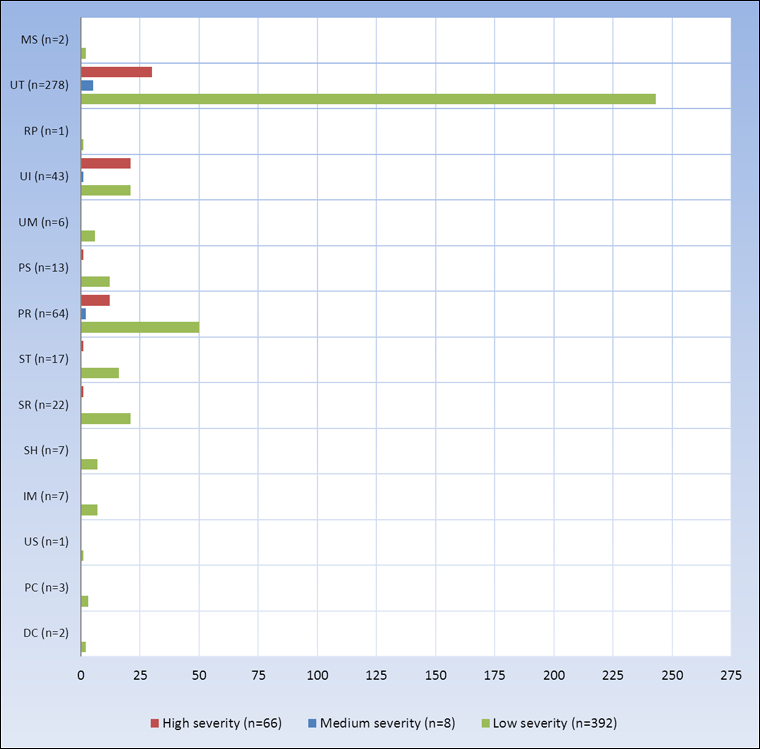
Only eight (1.7%) of these errors were assigned medium level of potential severity (Figures 8 & 9): these were errors related to unit transfusions (n=5), product requests (n=2) and units issued (n=1).
Figure 8. Type of errors detected AFTER transfusion (n=466) by level of potential severity, TESS 2008 - 2011
Text Equivalent - Figure 8
Only eight (1.7%) of these errors were assigned medium level of potential severity (Figures 8 & 9): these were errors related to unit transfusions (n=5), product requests (n=2) and units issued (n=1).
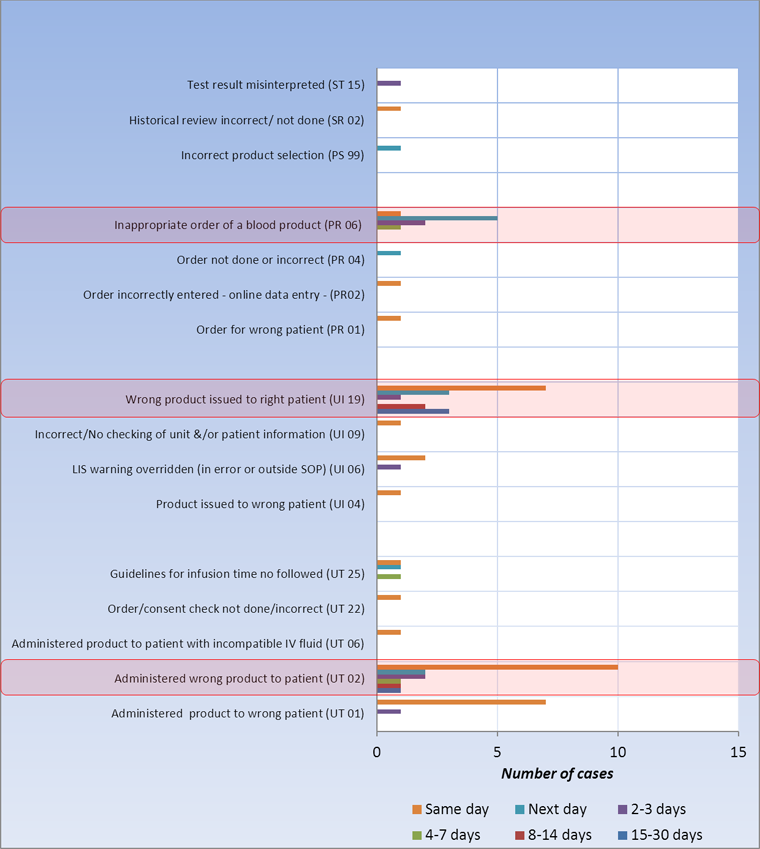
Potential high severity errors discovered after the actual transfusion (n=66) were primarily related to requests (n=12), issuance (n=21) and transfusion (n=30) of products (Figures 8 & 9). The most common of the subtypes were issuing (UI 19) and administering (UT 02) wrong products to the patients which together accounted for 50% of the 66 cases.
4. Potential High Severity Errors Discovered after Transfusion (n=66), TESS 2008 - 2011
Potential high severity errors discovered after the actual transfusion (n=66) were primarily related to requests (n=12), issuance (n=21) and transfusion (n=30) of products (Figures 8 & 9). The most common of the subtypes were issuing (UI 19) and administering (UT 02) wrong products to the patients which together accounted for 50% of the 66 cases.
Figure 9. Errors of potential high severity errors discovered AFTER (n=66) transfusion, TESS 2008-2011

Text Equivalent - Figure 9
Only eight (1.7%) of these errors were assigned medium level of potential severity (Figures 8 & 9): these were errors related to unit transfusions (n=5), product requests (n=2) and units issued (n=1).
Potential high severity errors discovered after the actual transfusion (n=66) were primarily related to requests (n=12), issuance (n=21) and transfusion (n=30) of products (Figures 8 & 9). The most common of the subtypes were issuing (UI 19) and administering (UT 02) wrong products to the patients which together accounted for 50% of the 66 cases.
The overall same-day detection rate for errors of potential high severity discovered after transfusion was 53% (Figure 10) and had gradually declined from 66.7% in 2008 to 47.1% in 2011 (Figures 11A-D).
Figure 10. Detection timeline of potential high severity errors discovered AFTER (n=66) transfusion, TESS 2008-2011
Text Equivalent - Figure 10
The overall same-day detection rate for errors of potential high severity discovered after transfusion was 53% (Figure 10) and had gradually declined from 66.7% in 2008 to 47.1% in 2011 (Figures 11A-D).
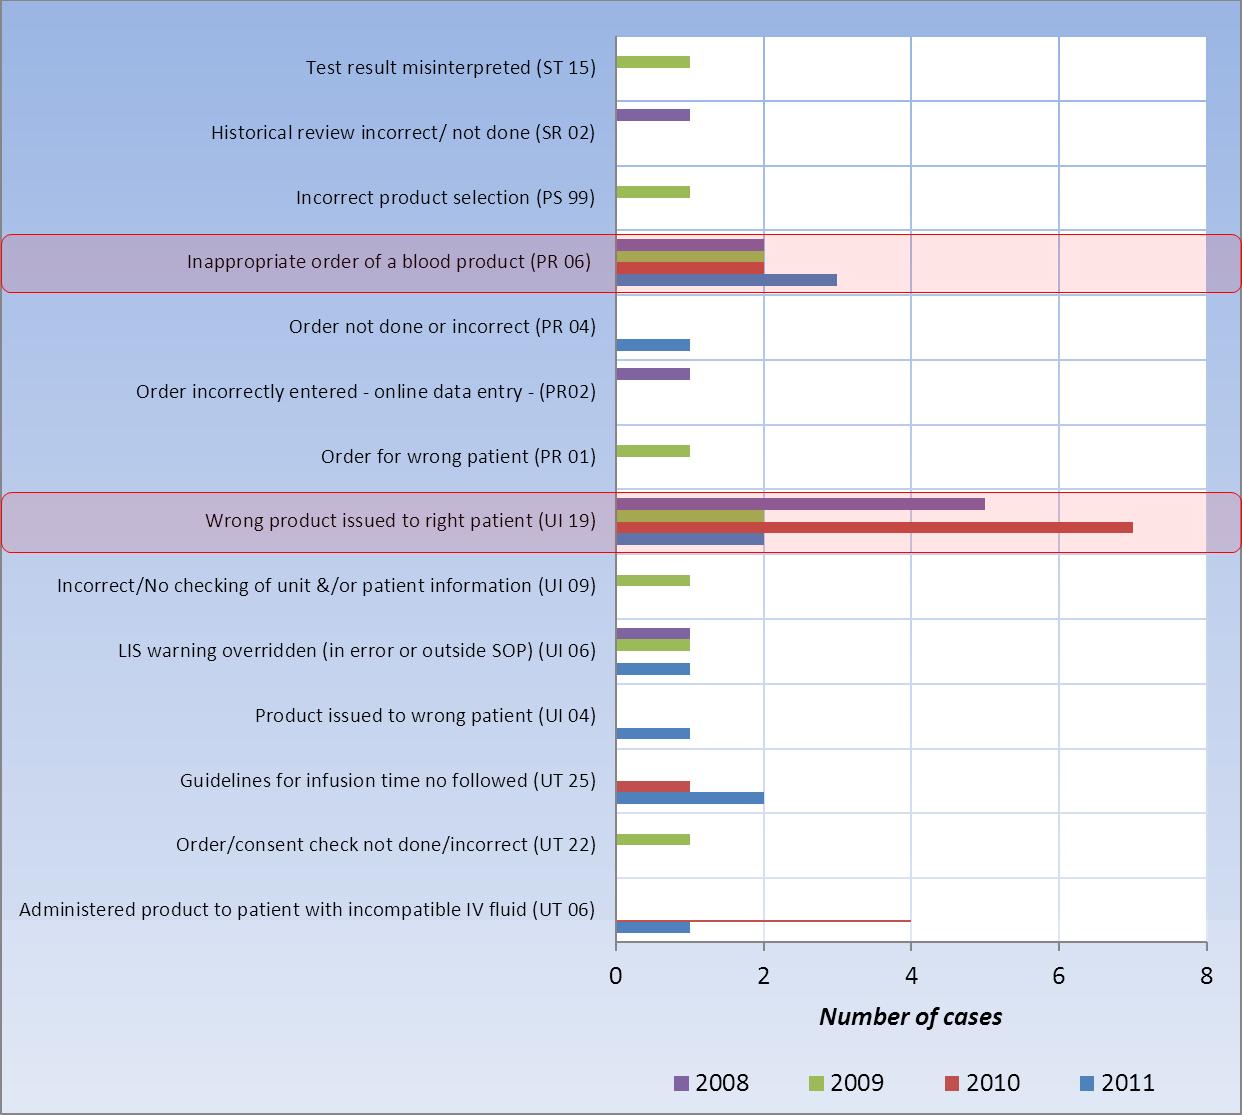
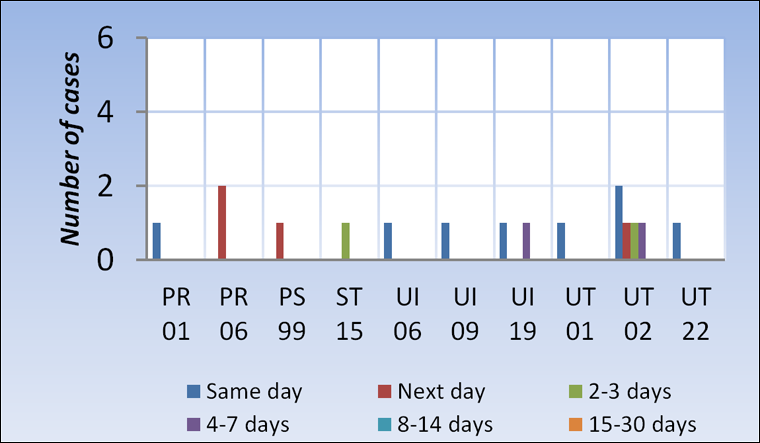
Figure 11A. Detection timeline of potential high severity of errors discovered AFTER transfusion (n=12), TESS 2008

Text Equivalent - Figure 11A
Same-day detection rate was 66.7% (Figure 11A). Four cases of PR 06 and UI 19 went undetected for more than 24 hours.
Same-day detection rate was 66.7% (Figure 11A).
Four cases of PR 06 and UI 19 went undetected for more than 24 hours.
Figure 11B. Detection timeline of potential high severity of errors discovered AFTER transfusion (n=16), TESS 2009
Text Equivalent - Figure 11B
Same-day detection rate was 50.0% (Figure 11B).
Four cases were detected a day later and another four 2-7 days later (Figure 11B).
Same-day detection rate was 50.0% (Figure 11B).
Four cases were detected a day later and another four 2-7 days later (Figure 11B).
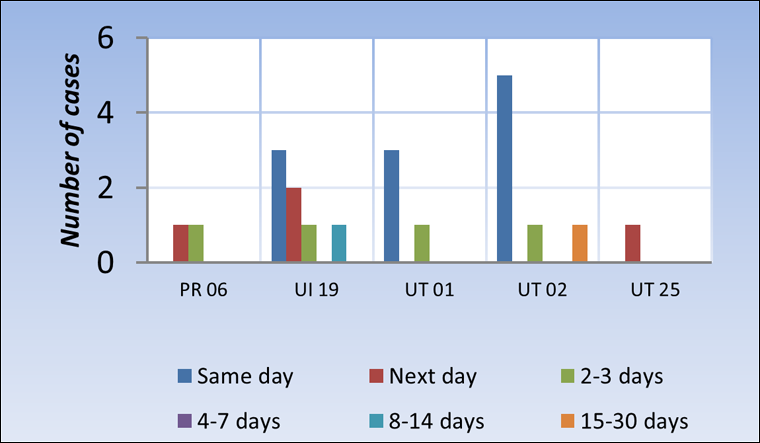
Figure 11C. Detection timeline of potential high severity of errors discovered AFTER transfusion (n=21), TESS 2010
Text Equivalent - Figure 11C
Same-day detection rate was 52.4% (Figure 11C). Eight cases were detected within the following three days, and the remaining two more than a week later (Figure 11C).
Same-day detection rate was 52.4% (Figure 11C).
Eight cases were detected within the following three days, and the remaining two more than a week later (Figure 11C).
Figure 11D. Detection timeline of potential high severity of errors discovered AFTER transfusion (n=17), TESS 2011

Text Equivalent - Figure 11D
Same-day detection rate was 47.1% (Figure 11D). Four cases were detected a day later, another four within a week, and the remaining five within a week (n=4) or two (n=1).
Same-day detection rate was 47.1% (Figure 11D).
Four cases were detected a day later, another four within a week, and the remaining five within a week (n=4) or two (n=1).
5. Outcome of Transfusion Errors
The overwhelming majority (n=33,622) of the transfusion errors reported through the TESS network between 2008 and 2011 were discovered before the actual transfusion of blood products/components and therefore, had no negative impact on the patient’s health. Similarly, errors of low (n=392) and medium (n=8) potential severity discovered after transfusion had occurred caused no harm to the patients involved. Only some high potential severity errors discovered after transfusion negatively impacted the health of the patients involved. Of the 66 such cases, 16 (24.2%) were found to be associated with adverse events (Table 6) that included transfusion related circulatory overload (n=8), febrile non-hemolytic (n=2) and mild (n=1) reactions, as well as adverse reactions unspecified nature (n=5), but definitely related to transfusion. Transfusion related circulatory overload was caused by inappropriate/incorrect/no order of blood product or blood component (n=6) and not following guidelines for infusion time (n=2), which were also causes for the single mild adverse reaction reported and one of the two cases of febrile non-hemolytic reaction (Table 6), the other case of febrile non-hemolytic reaction resulted from the transfusion of a product with an incompatible IV fluid. However, none of all these adverse reactions resulted in death (Table 6).
| Transfusion error | Transfusion-associated circulatory overload (CQ 03) |
Febrile non-hemolytic (CQ 03) |
Mild transfusion reaction (CQ 03) |
Transfusion reaction of unspecified nature (CQ 03) |
Total | |
|---|---|---|---|---|---|---|
| Description | Code | |||||
| Incorrect/no product order | PR 04 | 1 | 0 | 0 | 0 | 1 |
| Inappropriate product order | PR 06 | 5 | 1 | 0 | 2 | 8 |
| Incorrect/no historical review | SR 02 | 0 | 0 | 0 | 1 | 1 |
| Wrong product issued to a patient | UI 19 | 0 | 0 | 0 | 2 | 2 |
| Administration of product with incompatible fluid | UT 06 | 0 | 1 | 0 | 0 | 1 |
| Guidelines for infusion time not followed | UT 25 | 2 | 0 | 1 | 0 | 3 |
| Total | - | 8 | 2 | 1 | 5 | 16 |
6. Conclusion
In conclusion, of the total 34,088 errors reported during the 2008 to 2011 time period, there were only 16 errors (1.4%) that resulted in adverse reactions and there were no deaths reported. Although a few errors of potential high severity did result in adverse transfusion reactions that impacted the patients’ health, the vast majority of errors were detected before transfusion and resulted in no adverse reactions. Monitoring of transfusion errors as well as a regular review of prevention and safety Standard Operating Procedures (SOPs) in the blood transfusion chain are important to ensure patient safety, particularly where it relates to product requests/order, issuance and transfusion of blood components/products.