
Canadian Armed Forces Pension Plans Annual Report for the Fiscal Year ended 31 March 2024
On this page
- Message from the Deputy Commander of Military Personnel Command (MILPERSCOM)
- About this report
- About the plans and its members
- Financial overview
- Fiscal year highlights
- Investment performance
- Administrative expenses
- Governance and oversight
- Financial Statements of the Canadian Forces Pension Plan
- Financial statements of the Reserve Force Pension Plan
- Account Transaction Statements
- Glossary
- Contact Information
Message from the Deputy Commander of Military Personnel Command (MILPERSCOM)

I am pleased to present the Annual Report on the Canadian Armed Forces Pension Plans for the fiscal year ended 31 March 2024. This report provides plan members, parliamentarians, and the Canadian public with insight into how the plans were managed in the last fiscal year.
Canadian Armed Force (CAF) members and the Government of Canada contribute to a pension plan that provides a strong foundation on which to build a secure financial future when CAF members retire. The CAF pension is a key part of the overall CAF compensation package and, along with personal savings, investments, and benefits from the Canada Pension Plan (CPP)/Québec Pension Plan (QPP) and Old Age Security, provide the basis for financially stable retirement years.
As Chair of the Canadian Forces Pension Advisory Committee (CFPAC), my responsibilities include the administration, policy development, and improvement of the CAF pension plans. The CAF will continue to recruit Canada’s best, and work hard to enable their lasting service in the CAF. We will continue to care for those who are ill or injured, whether physically or mentally. We will care for our military families, who have such a central role to play in keeping us strong. Service to Canada is highly valued, and the government’s investment in CAF pension plans reflects the importance it places on that service.

Major General Erick Simoneau
Deputy Commander Military Personnel Command / Assistant Chief Military Personnel
About this report
This report provides information on the Canadian Forces Pension Plan (CFPP) and Reserve Force Pension Plan (RFPP) for the fiscal year ended 31 March 2024. It is prepared and tabled in Parliament in accordance with section 57 of the Canadian Forces Superannuation Act (CFSA). The report includes the plans’ annual financial statements prepared in accordance with the stated accounting policies set out in Note 2 to the statements.
About the plans and its members
First established in 1901 under the Militia Pension Act, the CAF pension plans are administered in accordance with the provisions of CFSA and its supporting regulations.
The CAF pension plans cover all members of the Regular Force component of the CAF and Reserve Force members who have sufficient qualifying service. Regular Force members are members of the CFPP, while Reserve Force members who have sufficient qualifying service and pensionable earnings are members of either the CFPP or the RFPP, depending on their employment status and earnings.
Both CFPP and RFPP are contributory defined benefit pension plans. A contributory defined benefit plan is one to which both the employer and the employee make payments, and in which the benefits payable on death, disability, termination of service, and retirement are specified in the plan document—in this case, the CFSA and its Regulations. The benefits are directly related to the employee's earnings and years of pensionable service.
The plans provide survivor benefits for a member’s eligible spouse, common-law partner, and eligible children.
Plan contributions
For Fiscal Year 2023-2024, CFPP members contributed 9.35% of their pensionable earnings for the first nine months and 9.35% for the last three months, up to the Canada Pension Plan Yearly Maximum Pensionable Earnings (YMPE). Contributions on earnings in excess of the YMPE were made at the rate of 12.37% for the first nine months and 12.25% for the last three months. The YMPE was $66,600 in calendar year 2023 and increased to $68,500 for calendar year 2024.
For FY 2023-2024, part-time members of the Reserve Force who participated in the RFPP contributed 5.2% of salary for the year (unchanged from the prior year) in respect of basic pension benefits and their indexation.
Each year the Government, as the employer, contributes an amount that ensures sufficient future funds will be available for the benefits earned by employees in respect of that year, as determined by the President of the Treasury Board.
Plan benefits
Regular Force members and qualified full-time members of the Reserve Force who retire with 25 years or the equivalent of 9,131 days or more of CAF service are eligible for an immediate annuity.
An immediate annuity is based on the pension plan member’s average salary during the best five consecutive years of pensionable earnings, multiplied by the number of years of pensionable service to a maximum of 35 years times 2%, which includes a bridge benefit to age 65.
In general, Reserve Force members who participate in the RFPP and who retire with at least 9,131 days of CAF service are eligible for an immediate annuity based on the total pensionable years of service, age, and other factors (section 43 of the Reserve Force Pension Plan Regulations).
RFPP pension is based on cumulative pensionable earnings only. The basic benefit formula is 2% multiplied by indexed pensionable earnings, which includes a bridge benefit to age 65. Those Reserve Force members with sufficient qualifying service are automatically converted to membership under the CFPP.
Annuities and member and survivor annual allowances are subject to cost-of-living increases pursuant to the CFSA.
Financial overview
The CFPP and RFPP financial statements provide a comprehensive presentation of the plans’ financial positions. These statements were prepared in accordance with accounting policies of the Canadian accounting standards for pension plans in Part IV of the Chartered Professional Accountants (CPA) Canada Handbook. The Office of the Auditor General of Canada (OAG) audits the financial statements.
The Superannuation Account has been established in the accounts of Canada under the CFSA. It represents a tracking of all contributions, benefit payments, interest revenue, charges, and transfers that pertain to service prior to April 1, 2000. The Account portrays a notional portfolio of bonds, and as such, does not hold any investment assets. The amount of interest credited on the Account is as though net cash flows were invested quarterly in 20-year Government bonds issued at prescribed rates and held to maturity. For service accrued after 31 March 2000, contributions and benefit payments in respect of pensionable service accrued after are recorded in the CFPP in the accounts of Canada, in accordance with the Canadian accounting standards for pension plans. Contributions net of current benefits and administration expenses are regularly transferred to the Public Sector Pension Investment Board (PSPIB) for investment in capital markets to build assets to pay future benefits.
The RFPP is governed by the CFSA and its RFPP Regulations. The RFPP provides pension benefits for all eligible members of the Reserve Force. As with the CFPP, contributions net of current benefits and administration expenses are transferred to PSPIB to be invested in capital markets.
Fiscal year highlights
| CFPP | RFPP | |
|---|---|---|
| Active contributors | 69,298 | 19,235 |
| Retired members | 94,185 | 2,826 |
| Deferred annuitants | 7,748 | 16,349 |
| Survivors receiving benefits | 22,242 | 229 |
| CFPP | RFPP | |
|---|---|---|
| Net assets available for benefits ($millions) | 50,897 | 929 |
| Total Annuity Payments ($millions) | 3,809 | 15 |
| Average Annuity Payment per Member ($) | 38,040 | 5,516 |
| Death Benefits paid ($thousands) | 34,421 | 207 |
| Assets under investment with PSPIB ($millions) | 57,798 | 1,233 |
Investment performance
CFPP and RFPP funds are invested in private and public markets in accordance with the Public Sector Pension Investment Board Act (PSPIBA). PSPIB manages invested pension funds in the best interests of plan contributors and beneficiaries and maximizes returns without undue risk of loss, taking into account the funding, policies, and requirements of the pension plans and the ability of those pension plans to meet their financial obligations. Pension funds are diversified across a variety of investment vehicles.
Asset Mix

Image description
A circular graph indicating that the pension fund’s assets are composed of:
- 21.0 percent Public Market Equities,
- 23.9 percent Government Fixed Income,
- 15.3 percent Private Equity,
- 10.3 percent Real Estate,
- 13.0 percent Infrastructure,
- 9.9 percent Credit Investments,
- 5.7 percent Natural Resources,
- 0.9 percent Complementary Portfolio.
5 year average benchmark rate of return
The investment gain reflects a consolidated 5-year net annual rate of return of 7.9% in FY 2023-2024. The 5-year average rate of return for the plan, as compared to the 5-year average benchmark rate, shows the plan consistently outperforming the comparable benchmark.
Further details and analysis of the investment performance and the overall state of investment markets are available in the 2024 Annual Report of PSPIB.
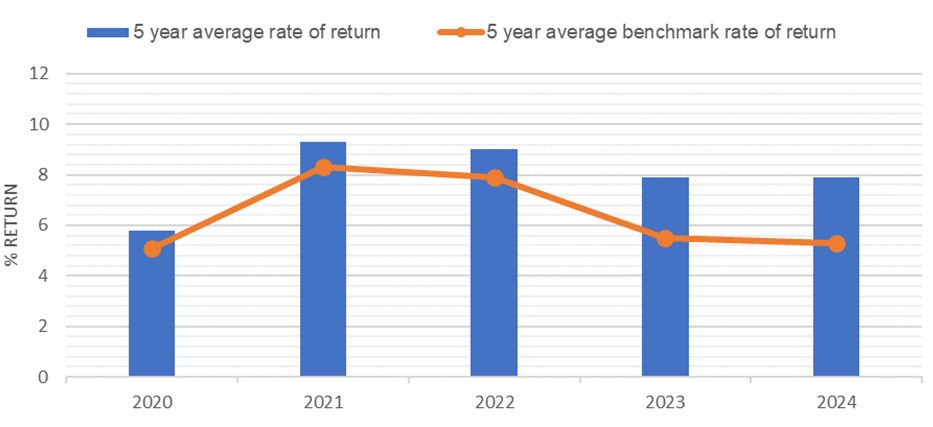
Image description
This bar graph compares the five year average rate of return of the pension fund against the five year average benchmark rate of return. Overall, the pension fund's performance slightly exceeded the benchmark for each year:
- For year 2020 the average rate of return was 5.8 percent compared to a 5.1 percent average benchmark rate of return
- For year 2021 the average rate of return was 9.3 percent compared to a 8.3 percent average benchmark rate of return
- For year 2022 the average rate of return was 9 percent compared to a 7.9 percent average benchmark rate of return
- For year 2023 the average rate of return was 7.9 percent compared to a 5.5 percent average benchmark rate of return.
- For year 2024 the average rate of return was 7.9 percent compared to a 5.3 percent average benchmark rate of return.
Administrative expenses
Under CFSA legislation, authorized government organizations and the PSPIB charge eligible administrative expenses to the plans. These are expenses that departments incur for plan administration and for the operating expenses of the PSPIB.
While many aspects of the two pension plans are administered jointly, the CFPP and the RFPP each issue independent financial statements. Where expenses incurred can be specifically attributed to the CFPP or RFPP, they are charged accordingly. Expenses which cannot be specifically attributed to one of the pension plans, such as office supplies, are shared between each of the pension plans based on an appropriate allocation method.
| CFPP | RFPP | Total | |
|---|---|---|---|
| Public Services and Procurement Canada (PSPC) | |||
| Salaries and employee benefits | $27,982 | $4,263 | $32,245 |
| Operation and maintenance | 11,627 | 1,771 | 13,398 |
| Subtotal—PSPC | $39,609 | $6,034 | $45,643 |
| Department of National Defence (DND) | |||
| Salaries and employee benefits | $3,024 | $460 | $3,484 |
| Operation and maintenance | 1,089 | 166 | 1,255 |
| Subtotal—DND | $4,113 | $626 | $4,739 |
| Office of the Chief Actuary—Actuarial fees | 936 | 143 | 1,079 |
| Total - Government Departments | $44,658 | $6,803 | $51,461 |
| Public Service Pension Investment Board (PSPIB) | |||
| Salaries and employee benefits | $85,000 | $1,850 | $86,850 |
| Operation and maintenance | 22,000 | 572 | 22,572 |
| Professional and consulting fees | 22,000 | 471 | 22,471 |
| Other | 5,000 | 5,000 | |
| Total - PSPIB | $134,000 | $2,893 | $136,893 |
| Total administrative expenses | $178,658 | $9,696 | $188,354 |
Governance and oversight
Minister of National Defence (MND): The Minister of National Defence is responsible for the oversight of the pension plans. Within the Department of National Defence (DND), the Directorate of Pension Policy and Social Programs (DPSP) oversees the financial analysis, program and policy advice and interpretation, including amendments to the CFSA and its Regulations, on behalf of the MND. DPSP also prepares the Annual Report of the Canadian Armed Forces pension plans.
Treasury Board of Canada Secretariat (TBS): TBS is responsible for the overall pension policy for the four major federal public sector pension plans. The CFSA requires the President of the Treasury Board to consult with the MND on funding matters. TBS provides general guidance to the DND on the accounting for the pension plans through the Office of the Comptroller General.
Canadian Forces Pension Advisory Committee (CFPAC): Chaired by the Deputy Commander Military Personnel Command, CFPAC is an advisory committee to the Minister of National Defence, comprised of up to ten members—one pensioner, three members representing active Regular Force contributors, one member representing Reserve Force personnel, and five other members—all appointed by the Minister of National Defence. CFPAC reviews and provides advice and recommendations to the Minister on pension issues and considers any pension-related matters that the Minister may refer to it.
Public Services and Procurement Canada (PSPC): Under the direction of its Minister, PSPC has assumed the day-to-day administration of the pension plans, alongside the Public Service Pension Plan and Royal Canadian Mounted Police Pension Plan. This includes benefit calculation, and member communications and support. As Receiver General for Canada, the Minister of PSPC is responsible for the central treasury and payments functions.
Public Sector Pension Investment Board (PSPIB): PSPIB is a Crown corporation that reports to Parliament through the President of the Treasury Board. In accordance with the Public Sector Pension Investment Board Act and its Regulations, net pension contributions are transferred to PSPIB and invested in equities, fixed income securities, real estate, private equity, and infrastructure. The relevant financial results of PSPIB are included in the pension plans’ financial statements.
Office of the Superintendent of Financial Institutions (OSFI): OSFI performs an actuarial valuation of the pension plans every three years. This triennial valuation, which is tabled in Parliament by the President of the Treasury Board, is used to compare the pension plans’ assets and liabilities and estimate the contribution rates required to ensure the pension plans’ ongoing financial sustainability. For accounting purposes, the triennial actuarial valuation is updated annually using management’s best estimate assumptions, and actual data on annuitants and contributors.
Office of the Auditor General (OAG): The OAG is responsible for the annual audit of the pension plans’ year-end financial statements to provide assurance that the financial statements are presented fairly, in accordance with Canadian accounting standards for pension plans and that the CAF pension plans comply with the key legislative authorities.
Financial Statements of the Canadian Forces Pension Plan for the fiscal year ended 31 March 2024
Statement of Responsibility
Responsibility for the integrity and fairness of the financial statements of the Canadian Forces Pension Plan (the pension plan) rests with the management of the Department of National Defence. In support of this responsibility, management has developed and maintained books, records, internal controls and management practices designed to provide reasonable assurance as to the reliability of the financial information and to ensure that transactions are in accordance with the Canadian Forces Superannuation Act and regulations, as well as the Financial Administration Act and regulations.
The financial statements of the pension plan for the year ended 31 March 2024, have been prepared in accordance with the stated accounting policies set out in Note 2 to the financial statements, which are based on Canadian accounting standards for pension plans, and on a basis consistent with that of the preceding year. The information included in the financial statements is based on management’s best estimates and judgement, with due consideration given to materiality.
Additional information is obtained as required, from the Public Sector Pension Investment Board (PSPIB) to meet accounting and reporting requirements. PSPIB maintains its own systems of financial management and internal controls to account for the funds managed on behalf of the pension plan in accordance with the Public Sector Pension Investment Board Act, regulations and by-laws.
These financial statements have been audited by the Auditor General of Canada, the independent auditor for the Government of Canada.
Approved by:
Original signed by
Stefanie Beck
Deputy Minister
Major General Erick Simoneau
Deputy Commander MILPERSCOM
Ottawa, Canada
Independent Auditor’s Report
To the Minister of National Defence
Report on the Audit of the Financial Statements
Opinion
We have audited the financial statements of the Canadian Forces Pension Plan (the pension plan), which comprise the statement of financial position as at 31 March 2024, and the statement of changes in net assets available for benefits and statement of changes in pension obligations for the year then ended, and notes to the financial statements, including a summary of significant accounting policies.
In our opinion, the accompanying financial statements present fairly, in all material respects, the financial position of the pension plan as at 31 March 2024, and the changes in its net assets available for benefits and changes in its pension obligations for the year then ended in accordance with Canadian accounting standards for pension plans.
Basis for Opinion
We conducted our audit in accordance with Canadian generally accepted auditing standards. Our responsibilities under those standards are further described in the Auditor’s Responsibilities for the Audit of the Financial Statements section of our report. We are independent of the pension plan in accordance with the ethical requirements that are relevant to our audit of the financial statements in Canada, and we have fulfilled our other ethical responsibilities in accordance with these requirements. We believe that the audit evidence we have obtained is sufficient and appropriate to provide a basis for our opinion.
Other Information
Management is responsible for the other information. The other information comprises the information included in the annual report, but does not include the financial statements and our auditor’s report thereon.
Our opinion on the financial statements does not cover the other information and we do not express any form of assurance conclusion thereon.
In connection with our audit of the financial statements, our responsibility is to read the other information and, in doing so, consider whether the other information is materially inconsistent with the financial statements or our knowledge obtained in the audit, or otherwise appears to be materially misstated. If, based on the work we have performed, we conclude that there is a material misstatement of this other information, we are required to report that fact. We have nothing to report in this regard.
Responsibilities of Management and Those Charged with Governance for the Financial Statements
Management is responsible for the preparation and fair presentation of the financial statements in accordance with the stated accounting policies set out in Note 2 of the financial statements, which are based on Canadian accounting standards for pension plans, and for such internal control as management determines is necessary to enable the preparation of financial statements that are free from material misstatement, whether due to fraud or error.
In preparing the financial statements, management is responsible for assessing the pension plan’s ability to continue as a going concern, disclosing, as applicable, matters related to going concern and using the going concern basis of accounting unless management either intends to liquidate the pension plan or to cease operations, or has no realistic alternative but to do so.
Those charged with governance are responsible for overseeing the pension plan’s financial reporting process.
Auditor’s Responsibilities for the Audit of the Financial Statements
Our objectives are to obtain reasonable assurance about whether the financial statements as a whole are free from material misstatement, whether due to fraud or error, and to issue an auditor’s report that includes our opinion. Reasonable assurance is a high level of assurance, but is not a guarantee that an audit conducted in accordance with Canadian generally accepted auditing standards will always detect a material misstatement when it exists. Misstatements can arise from fraud or error and are considered material if, individually or in the aggregate, they could reasonably be expected to influence the economic decisions of users taken on the basis of these financial statements.
As part of an audit in accordance with Canadian generally accepted auditing standards, we exercise professional judgment and maintain professional skepticism throughout the audit. We also:
- Identify and assess the risks of material misstatement of the financial statements, whether due to fraud or error, design and perform audit procedures responsive to those risks, and obtain audit evidence that is sufficient and appropriate to provide a basis for our opinion. The risk of not detecting a material misstatement resulting from fraud is higher than for one resulting from error, as fraud may involve collusion, forgery, intentional omissions, misrepresentations, or the override of internal control
- Obtain an understanding of internal control relevant to the audit in order to design audit procedures that are appropriate in the circumstances, but not for the purpose of expressing an opinion on the effectiveness of the pension plan’s internal control
- Evaluate the appropriateness of accounting policies used and the reasonableness of accounting estimates and related disclosures made by management
- Conclude on the appropriateness of management’s use of the going concern basis of accounting and, based on the audit evidence obtained, whether a material uncertainty exists related to events or conditions that may cast significant doubt on the pension plan’s ability to continue as a going concern. If we conclude that a material uncertainty exists, we are required to draw attention in our auditor’s report to the related disclosures in the financial statements or, if such disclosures are inadequate, to modify our opinion. Our conclusions are based on the audit evidence obtained up to the date of our auditor’s report. However, future events or conditions may cause the pension plan to cease to continue as a going concern
- Evaluate the overall presentation, structure and content of the financial statements, including the disclosures, and whether the financial statements represent the underlying transactions and events in a manner that achieves fair presentation
- Obtain sufficient appropriate audit evidence regarding the financial information of the entities or business activities within the pension plan to express an opinion on the financial statements. We are responsible for the direction, supervision, and performance of the group audit. We remain solely responsible for our audit opinion
We communicate with those charged with governance regarding, among other matters, the planned scope and timing of the audit and significant audit findings, including any significant deficiencies in internal control that we identify during our audit.
Report on Compliance with Specified Authorities
Opinion
In conjunction with the audit of the financial statements, we have audited transactions of the Canadian Forces Pension Plan coming to our notice for compliance with specified authorities. The specified authorities against which compliance was audited are the Canadian Forces Superannuation Act and regulations, the Public Sector Pension Investment Board Act and regulations, and the by-laws of the Public Sector Pension Investment Board.
In our opinion, the transactions of the Canadian Forces Pension Plan that came to our notice during the audit of the financial statements have complied, in all material respects, with the specified authorities referred to above.
Responsibilities of Management for Compliance with Specified Authorities
Management is responsible for the Canadian Forces Pension Plan’s compliance with the specified authorities named above, and for such internal control as management determines is necessary to enable the Canadian Forces Pension Plan to comply with the specified authorities.
Auditor’s Responsibilities for the Audit of Compliance with Specified Authorities
Our audit responsibilities include planning and performing procedures to provide an audit opinion and reporting on whether the transactions coming to our notice during the audit of the financial statements are in compliance with the specified authorities referred to above.
Original signed by
Mimma Venema, CPA, CA, CGA
Principal
for the Auditor General of Canada
Ottawa, Canada
26 February 2025
CFPP Financial Statements
| As at 31 March 2024 | As at 31 March 2023 | |
|---|---|---|
| Assets | ||
| Canadian Forces Pension Fund (Note 4) | $79 | $25 |
| Investments (Note 5) | 57,798 | 54,514 |
| Contributions receivable | ||
| From plan members (Note 8) | 92 | 86 |
| From employer (Note 8) | 150 | 137 |
| Transfers receivable from Reserve Force (Note 4 and Note 8) | 59 | 61 |
| Other assets | 36 | 36 |
| Total assets | $58,214 | $54,859 |
| Liabilities | ||
| Investment-related liabilities (Note 5) | 2,064 | 3,023 |
| Accounts payable and other liabilities | 95 | 101 |
| Borrowings (Note 5 and Note 9) | 5,158 | 4,624 |
| Total liabilities | $7,317 | $7,748 |
| Net assets available for benefits | $50,897 | $47,111 |
| Pension obligations | ||
| Funded (Note 12) | $41,431 | $39,256 |
| Unfunded (Note 12 and Note 20) | $43,956 | $46,838 |
| Total pension obligations | $85,387 | $86,094 |
| Deficit to be financed by the Government of Canada (Note 13) | $(34,490) | $(38,983) |
Table 4 NoteCommitments (Note 23) The accompanying notes are an integral part of these financial statements. |
||
| 2024 | 2023 | |
|---|---|---|
| Net assets available for benefits, beginning of year | $47,111 | $44,987 |
| Increase in net assets available for benefits | ||
| Investment income, excluding changes in fair values of investment assets and investment liabilities (Note 14) | 1,525 | 1,265 |
| Changes in fair values of investment assets and investment liabilities, realized and unrealized gains (Note 14) | 2,381 | 1,075 |
| Contributions | ||
| From plan members (Note 15) | 669 | 547 |
| From employer (Note 15) | 1,073 | 893 |
| Transfers from other pension plans (Note 4) | 45 | 73 |
| Total increase in net assets available for benefits | $5,693 | $3,853 |
| Decrease in net assets available for benefits | ||
| Benefits paid with respect to service after 31 March 2000 (Note 17) | 1,204 | 1,072 |
| Change in transfers receivable from Reserve Force | 2 | 12 |
| Refunds and transfers (Note 17) | 159 | 241 |
| Investment-related expenses (Note 18) | 370 | 236 |
| Administrative expenses (Note 19) | 172 | 168 |
| Total decrease in net assets available for benefits | $1,907 | $1,729 |
| Net increase in net assets available for benefits | $3,786 | $2,124 |
| Net assets available for benefits, end of year | $50,897 | $47,111 |
Table 5 NoteThe accompanying notes are an integral part of these financial statements. |
||
| 2024 Funded | 2024 Unfunded | 2024 Total | 2023 Funded | 2023 Unfunded | 2023 Total | |
|---|---|---|---|---|---|---|
| Pension obligations, beginning of year | $39,256 | $46,838 | $86,094 | $37,552 | $50,316 | $87,868 |
| Increase in pension obligations | ||||||
| Interest on pension obligations | 2,436 | 1,384 | 3,820 | 2,072 | 1,172 | 3,244 |
| Benefits earned | 1,436 | 0 | 1,436 | 1,477 | 0 | 1,477 |
| Experience losses (Note 12) | 260 | 287 | 547 | 642 | 1,118 | 1,760 |
| Cost of new elections | 16 | 0 | 16 | 17 | 0 | 17 |
| Transfers from other pension plans | 45 | 0 | 45 | 73 | 0 | 73 |
| Total increase in pension obligations | $4,193 | $1,671 | $5,864 | $4,281 | $2,290 | $6,571 |
| Decrease in pension obligations | ||||||
| Benefits paid (Note 17) | $1,204 | $2,605 | $3,809 | $1,072 | $2,525 | $3,597 |
| Changes in actuarial assumptions: gains (Note 12) | 617 | 1,932 | 2,549 | 1,240 | 3,214 | 4,454 |
| Refunds and transfers (Note 17) | 159 | 10 | 169 | 241 | 13 | 254 |
| Administrative expenses included in the service cost (Note 19 and Note 20) | 38 | 6 | 44 | 24 | 16 | 40 |
| Total decrease in pension obligations | $2,018 | $4,553 | $6,571 | $2,577 | $5,768 | $8,345 |
| Net increase (decrease) in pension obligations | $2,175 | $(2,882) | $(707) | $1,704 | $(3,478) | $(1,774) |
| Pension obligations, end of year | $41,431 | $43,956 | $85,387 | $39,256 | $46,838 | $86,094 |
Table 6 NoteThe accompanying notes are an integral part of these financial statements. |
||||||
1. Description of the Canadian Forces Pension Plan
The Canadian Forces Pension Plan (the pension plan), governed by Part I of the Canadian Forces Superannuation Act (CFSA), provides pension benefits for all members of the Regular Force component and eligible members of the Reserve Force component of the Canadian Forces. Established in 1901 under the Militia Pension Act, the present-day version of the pension plan is administered in accordance with the CFSA.
The main provisions of the pension plan are summarized below.
(A) General
The pension plan is a contributory defined benefit plan covering all members of the Regular Force component and eligible members of the Reserve component of the Canadian Forces. Membership in the pension plan is compulsory for all members of the Regular Force regardless of length of service. Members of the Reserve Force component of the Canadian Forces contribute to the pension plan when they meet eligibility criteria.
The Government of Canada (the government) is the sole sponsor of the pension plan. The Minister of National Defence is the Minister responsible for the CFSA. The Department of National Defence is responsible for the management of the pension plan and maintains the books of account, while Public Services and Procurement Canada (PSPC) provides the day-to-day administration. The Office of the Chief Actuary (OCA), an independent unit within the Office of the Superintendent of Financial Institutions (OSFI), performs periodic actuarial valuations of the pension plan.
Until 1 April 2000, separate invested funds were not set aside to provide for payment of pension benefits. Instead, transactions relating to the pension plan were recorded in a Canadian Forces Superannuation Account (superannuation account) created by legislation in the accounts of Canada. Pursuant to the CFSA, as amended by the Public Sector Pension Investment Board Act, transactions relating to service since 1 April 2000 are now recorded in the Canadian Forces Pension Fund (pension fund). While the pension plan matures, an amount equal to contributions in excess of benefit payments and administrative costs is transferred regularly to the Public Sector Pension Investment Board (PSPIB) for investment. PSPIB is a Crown corporation whose statutory objectives are to manage the funds transferred to it for investment and to maximize investment returns without undue risk of loss, having regard to the funding, policies and requirements of the three main public sector pension plans (public service, Royal Canadian Mounted Police (RCMP) and Canadian Armed Forces). When the pension plan is mature to a state where benefit payments are greater than incoming contributions, which is the normal state for any mature pension plan, PSPIB will transfer amounts to the Consolidated Revenue Fund (CRF) for benefit payments and administrative costs, or as required under the circumstance of a non-permitted surplus (refer to CFSA subsection 55.4 (5) for the definition of non-permitted surplus).
(B) Funding policy
The pension plan is funded from plan member and employer contributions, and from investment earnings. For the fiscal year, members of the pension plan contributed 9.35% (9.36% in 2023) for the first nine months and 9.35% (9.35% in 2023) for the last three months of pensionable earnings, up to the maximum covered by the Canada Pension Plan (CPP) or Québec Pension Plan (QPP), and 12.37% (12.48% in 2023) for the first nine months and 12.25% (12.37% in 2023) for the last three months of pensionable earnings above that maximum.
The government’s contribution is made monthly to provide for the cost (net of plan member contributions) of the benefits that have accrued in respect of that month at a rate determined by the President of the Treasury Board. The contribution rates are determined based on actuarial valuations for funding purposes, which are performed triennially.
The CFSA provides that all pension obligations arising from the pension plan be met by the government. The CFSA requires that any actuarial deficit in the pension fund be dealt with by transferring equal instalments to the pension fund over a period of up to 15 years, starting in the year in which the actuarial report is tabled in Parliament. The CFSA also allows any surplus to be lowered by reducing employer and plan member contributions. In addition, if there is an amount considered to be a non-permitted surplus related to the pension fund, no further government pension contributions are permitted, while plan member contributions under the pension fund may be reduced and amounts managed by PSPIB may be transferred to the government’s CRF.
(C) Benefits
The pension plan provides pension benefits based on the number of years of pensionable service up to a maximum of 35 years. Benefits are determined by a formula set out in the legislation; they are not based on the financial status of the pension plan. The basic benefit formula is 2 % per year of pensionable service multiplied by the average salary of the five consecutive years of highest paid service. To reflect the Income Tax Act restrictions on registered pension plan benefits, separate retirement compensation arrangements (RCAs) have been implemented to provide benefits that exceed the limits established in the Income Tax Act. Since the RCAs are covered by separate legislation, their account balances in the accounts of Canada are not consolidated in these financial statements; however, condensed information is presented in Note 21.
Pension benefits are coordinated with the CPP and QPP and are reduced when the plan member reaches age 65 or earlier if the member receives a disability benefit from the CPP or QPP. The pension reduction factor is 0.7% for members born before 1943, declining gradually for members born from 1943 to 1946 until it reaches 0.625% for members born after 1946. Benefits are fully indexed to the annual increase in the Consumer Price Index.
Other benefits include survivor pensions, deferred annuities, annual allowances, transfer values, cash termination allowances or minimum benefits in the event of death, unreduced early retirement pensions, and disability pensions.
2. Significant accounting policies
The significant accounting policies that have been applied in the preparation of these financial statements are summarized below.
(A) Basis of presentation
These financial statements present information on the pension plan on a going-concern basis. They are prepared to assist plan members and others in reviewing the activities of the pension plan for the year, not to portray the funding requirements of the pension plan.
These financial statements are prepared in Canadian dollars, the pension plan’s functional currency, in accordance with the accounting policies stated below, which are based on Canadian accounting standards for pension plans in Part IV of the Chartered Professional Accountants (CPA) Canada Handbook (Section 4600). Section 4600 provides specific accounting guidance on investments and pension obligations. For accounting policies that do not relate to either investments or pension obligations, the pension plan complies with International Financial Reporting Standards (IFRS) in Part I of the CPA Canada Handbook. To the extent that IFRS in Part I are inconsistent with Section 4600, Section 4600 takes precedence. The presentation and results using the stated accounting policies do not result in any significant differences from Canadian accounting standards for pension plans.
PSPIB is a Crown corporation whose statutory objectives are to manage the funds transferred to it for investment and to maximize investment returns without undue risk of loss. PSPIB qualifies as an investment entity as defined under IFRS 10 Consolidated Financial Statements and forms part of the pension plan reporting entity. Pursuant to Section 4600, PSPIB’s subsidiaries that are formed to hold investments or those that provide PSPIB with services that relate to its investment activities are consolidated, since these entities are not considered investment assets. PSPIB’s investment in subsidiaries, associates, and joint ventures that are considered investment assets are measured at fair value in accordance with Section 4600. Financial liabilities are also measured at fair value in accordance with Section 4600.
The financial statements for the year ended 31 March 2024 were authorized for issue by the signatories on 26 February 2025.
(B) Interests in other entities
Management, through the activities of PSPIB, assesses control, joint control and significant influence with respect to the investees disclosed in Note 6 as follows:
(I) Control and significant influence
A subsidiary is an entity which is controlled by PSPIB. PSPIB determines that it controls an investee when it has power over the investee, is exposed, or has rights, to variable returns from its investment in the investee and has the ability to affect those returns through its power over the investee.
An associate is an entity over which PSPIB has significant influence, as in certain cases, PSPIB does not have control over an investee but has the power to participate in the financial and operating policy decisions of the investee. In such cases, PSPIB determines that it has significant influence over the investee.
In the context of control or significant influence, power over an investee is obtained through voting rights conveyed by PSPIB’s ownership interest, other contractual arrangements, or a combination thereof.
(II) Joint control
PSPIB determines that it is party to a joint venture arrangement when it has joint control over an investee and has rights to the net assets of the investee. Such investees are reported as jointly controlled. Joint control is established through a contractual arrangement which requires the unanimous consent of the parties sharing control for the activities that significantly affect the returns of the arrangement.
Generally, decision-making regarding such activities is governed through voting rights conveyed by the ownership interest of each party. In certain cases, it is governed solely through contractual arrangements or in conjunction with the ownership interest of each party.
(C) Financial instruments
(I) Classification
Financial assets representing investments are managed, together with related financial liabilities, according to the entity’s business model to maximize the rate of return. The performance of such financial instruments is evaluated on a fair value basis and they are classified at fair value through profit or loss (FVTPL). They are described in detail in Note 5(A).
Borrowings, as described under Note 9, are financial liabilities that are designated to be measured at FVTPL since they are part of the portfolios of investments that are managed together and whose performance is evaluated on a fair value basis.
(II) Recognition
Financial assets and financial liabilities are recorded at the date upon which PSPIB becomes a party to the associated contractual provisions. In the case of traded financial assets, they are recorded as of the trade date.
(III) Initial and subsequent measurement
All financial assets and financial liabilities are recorded in the statement of financial position at fair value and continue to be measured as such on a recurring basis. After initial measurement, subsequent changes in the fair value of financial assets and financial liabilities classified at FVTPL are recorded in the statement of changes in net assets available for benefits.
(IV) Derecognition
A financial asset (or, where applicable, a part thereof) is derecognized when the following conditions are met:
- The rights to receive cash flows from the asset have expired, or
- PSPIB has transferred its rights to receive cash flows from the asset or has assumed an obligation to pay the received cash flows to a third party, and
- PSPIB has transferred substantially all the risks and rewards of the asset, or
- In cases where PSPIB has neither transferred nor retained substantially all the risks and rewards of the asset, it has transferred control of the asset
A financial liability is derecognized when the obligation under the liability is discharged, cancelled or expired.
(D) Determination of fair value
Fair value is the price that would be received to sell an asset or paid to transfer a liability in an orderly transaction between market participants at the measurement date.
At initial recognition, PSPIB evaluates the facts and circumstances related to a transaction to confirm that the transaction price represents the fair value of an asset or a liability. At each subsequent reporting date, market prices are used to determine fair value where an active market exists (such as a recognized securities exchange), as they reflect actual and regularly occurring market transactions on an arm’s length basis. If quoted market prices are not available, then fair value is estimated using valuation techniques based on inputs existing at the end of the reporting period that are derived from observable market data.
Valuation techniques are generally applied to investments in private markets, alternative investments, over-the-counter (OTC) derivatives and certain fixed income securities. The values derived from applying these techniques are impacted by the choice of valuation model and the underlying assumptions made concerning factors such as the amounts and timing of future cash flows, discount rates, volatility and credit risk. In certain cases, such assumptions are not supported by market observable data.
The determination of fair value of all financial assets and financial liabilities is described in Note 5.
(E) Foreign currency translation
Foreign currency transactions during the period, including purchases and sales of securities, income and expenses, are translated at the rate of exchange prevailing on the date of the transaction.
Monetary assets and liabilities that are denominated in foreign currencies are translated at the functional currency rate of exchange prevailing at the end of the reporting period.
Foreign currency transaction gains and losses on all monetary assets and liabilities are included in investment income.
(F) Securities lending and securities borrowing and related collateral
PSPIB participates in securities lending and borrowing programs whereby it lends and borrows securities in order to enhance portfolio returns. Lending and borrowing transactions including related collateral under such programs do not transfer the risks or rewards of ownership of the securities to the counterparty. Consequently, PSPIB does not derecognize securities lent or pledged as collateral or recognize securities borrowed or received as collateral. Cash amounts received are recognized as described in Note 5(A) (IX).
The securities lending and borrowing programs require collateral in cash, high-quality debt instruments or securities. Collateral transactions are conducted under terms that are usual and customary in standard securities lending and borrowing programs. PSPIB and its counterparties are authorized to sell, repledge or otherwise use collateral held. The same securities or equivalent securities must be returned to the counterparty at the end of the contract, unless an event of default occurs.
(G) Securities sold under repurchase agreements and purchased under reverse repurchase agreements and related collateral
PSPIB is party to repurchase and reverse repurchase agreements. Such agreements involve the sale of securities by one counterparty with a simultaneous agreement to repurchase such securities at a specified price and at a specified future date.
Securities sold or purchased under the repurchase and reverse repurchase agreements respectively, including related collateral, are not derecognized or recognized as all risks and rewards of ownership related to such securities are not transferred. As such, in the case where PSPIB is the counterparty selling securities under such agreements, all income (loss) related to such securities continues to be reported in investment income, and obligations to repurchase the securities sold are accounted for as investment-related liabilities.
The difference between the fair value of the securities sold and the repurchase price is recorded as interest expense within investment-related expenses. In the case where PSPIB is the counterparty purchasing securities under such agreements, no income (loss) related to such securities is recognized, and obligations to resell the securities are accounted for as investment-related receivables. The difference between the fair value of the securities purchased and resale price is recorded in investment income.
Transactions under repurchase and reverse repurchase agreements involve pledging collateral consisting of cash or securities deemed acceptable by the counterparties. Collateral transactions are conducted under terms that are usual and customary in standard repurchase arrangements. Such terms require the relevant counterparty to pledge additional collateral based on the changes in the fair value of the existing collateral pledged, as well as the related securities sold or purchased. The counterparties are authorized to sell, repledge or otherwise use collateral held. The securities pledged as collateral must be returned to the relevant counterparty at the end of the contract, unless an event of default occurs.
(H) Offsetting of financial instruments
Financial assets and financial liabilities are offset with the net amount reported in the statement of financial position only if PSPIB has a current legally enforceable right to offset the recognized amounts and the intent to settle on a net basis, or to realize the assets and settle the liabilities simultaneously.
(I) Pension obligations
The present value of accrued pension benefits is calculated by the OCA on behalf of the pension plan sponsor, the government, using the projected benefit method prorated on service, based on management’s best estimate of streamed expected rates of return on invested funds for funded pension benefits, and the government’s cost of borrowing derived from the yields on the actual zero-coupon yield curve for Government of Canada bonds, which reflect the timing of the expected future cash flows for unfunded pension benefits.
(J) Investment income
Investment income is made up of interest, dividends, gains (losses) on the disposal of financial assets and financial liabilities, as well as gains (losses) which reflect the change in unrealized appreciation (depreciation) of financial assets held and financial liabilities outstanding at the end of the reporting period. Interest is recognized, on a consistent basis, using the prescribed rates until maturity. Dividends are recognized when the right to receive them has been obtained, generally on the ex-dividend date.
(K) Contributions
Contributions for current service are recorded in the year in which the related payroll costs are incurred. Contributions for past service that are receivable over a period in excess of one year are recorded at the estimated net present value of the contributions to be received.
(L) Benefits earned, benefits paid, and refunds and transfers
Benefits earned are accrued as employees render pensionable services.
The funded and unfunded benefits paid are recognized as a reduction of pension obligations when the payments are made. The funded benefits paid are recognized as a reduction of net assets available for benefits when the payments are made.
Benefit payments, refunds to former members and transfer payments to other plans are recorded in the period in which they are paid.
(M) Investment-related expenses
Investment-related expenses are made up of interest expense, transaction costs, external investment management fees and other (net).
Transaction costs are incremental costs directly attributable to the acquisition, due diligence, issue, or disposal of a financial asset or financial liability, and they are expensed as incurred.
External investment management fees are directly attributable to the external management of assets on behalf of PSPIB. These fees are paid directly by PSPIB and comprise base fees accrued as a percentage of the fair value of the assets managed externally and performance fees accrued as a function of various performance indicators. This excludes amounts not paid directly by PSPIB for certain pooled fund investments classified under alternative investments and for investments in private markets as outlined in Note 18.
(N) Significant accounting judgments, estimates and assumptions
In preparing the financial statements, management makes certain judgments, estimates and assumptions that can affect the amounts reported therein. Significant judgments include those related to the determination of the investment entity status of PSPIB as described in Note 2(A).
Management also makes estimates and assumptions in the measurement, risk assessment and related disclosures surrounding investments in private markets, certain fixed income securities and the pension obligations.
The main assumptions made by management regarding measurement of financial instruments are outlined in Note 5(C) (III), and those regarding the assessment of risk are outlined in Note 7.
The pension obligations are actuarially determined, and the actual experience may differ significantly from the assumptions used in the calculation of the pension obligations. The significant actuarial assumptions used in measuring the pension obligations are found in Note 12.
The economic environment continues to be subject to global uncertainty and heightened geopolitical tensions, which could impact the actuarial assumptions used to measure the present value of the pension obligations and the market value of PSPIB’s portfolio. The pension obligations and the investments held by PSPIB, as at 31 March 2024, as well as the return on investments for the year, reflect the impacts resulting from these events to the extent known and estimable at the reporting date.
Although assumptions reflect management’s best estimates, actual results may differ from such estimates due to the uncertainties involved in using them.
3. Current and future changes in accounting standards
Management has determined that there is no anticipated material impact on the financial statements arising from new standards, amendments and interpretations that have been issued by the IASB but that are not yet effective.
4. Canadian Forces Pension Fund
The government has a statutory obligation to pay benefits relating to the pension plan. This pension obligation is to plan members and their beneficiaries.
In 1999, the pension legislation was amended to allow the government to invest funds in order to provide for the pension obligation. This legislation created the PSPIB to manage and invest amounts that are transferred regularly to it from the CRF related to service since 1 April 2000. The transactions are recorded in the Canadian Forces Pension Fund. The Canadian Forces Pension Fund is a flow through account. At year-end, the balance in the Canadian Forces Pension Fund represents net contributions transferable to the PSPIB, and would also reflect any amounts transferred from the PSPIB. PSPIB investment assets and investment related liabilities are reflected directly in the pension plan’s financial statements.
In order for the government to track the transactions related to contributions, benefit payments, interest and transfers for service prior to 1 April 2000, the government established the Canadian Forces Superannuation Account in the accounts of Canada. The Canadian Forces Superannuation Account has no capacity to pay pensions and is not considered an asset of the pension plan. All cash receipts and disbursements go to or come from the CRF. The details of the transactions of the Canadian Forces Superannuation Account are provided in Note 20.
Related Party—Reserve Force Pension Plan
The Canadian Forces Pension Plan is related, through common legislation (the CFSA), to the Reserve Force Pension Plan. Transactions with the Reserve Force Pension Plan related to member service and contributions are considered to be in the normal course of operations, in accordance with the Section 83 of the Reserve Force Pension Plan Regulations (RFPPR) and are recorded at the exchange amount as required by that section. For the year ended 31 March 2024, $45 million (2023—$73 million) was transferred between the fund accounts. The value of the pensionable service due between the pension plans has been estimated at 31 March 2024 to be $59 million (2023—$61 million).
5. Financial assets and financial liabilities
(A) Classes of financial assets and financial liabilities
Financial assets and financial liabilities are aggregated in the following table, in classes that reflect their respective exposure as well as in investment sectors.
| 2024 | 2023 | |
|---|---|---|
| Investments Public markets |
||
| Canadian equity | $535 | $862 |
| Foreign equity | 8,022 | 6,787 |
| Private markets | ||
| Real estate | 7,106 | 7,914 |
| Private equity | 7,565 | 6,907 |
| Infrastructure | 7,794 | 6,915 |
| Natural resources | 4,154 | 3,590 |
| Fixed income | ||
| Cash and cash equivalentstable 7 note 1 | 677 | 1,346 |
| Money market securitiestable 7 note 1 | 1,617 | 1,604 |
| Government and corporate bonds | 5,150 | 4,466 |
| Inflation-linked bonds | 3,431 | 2,200 |
| Private debt securities | 5,694 | 5,840 |
| Alternative investments | 4,940 | 4,789 |
| Total Investments | $56,685 | $53,220 |
| Investment-related assets | ||
| Amounts receivable from pending trades | $244 | $488 |
| Interest receivable | 121 | 97 |
| Dividends receivable | 52 | 40 |
| Securities purchased under reverse repurchase agreements | 437 | 246 |
| Derivative-related assets | 259 | 423 |
| Total investment-related assets | $1,113 | $1,294 |
| Investments representing financial assets at FVTPLtable 7 note 2 | $57,798 | $54,514 |
| Investment-related liabilities | ||
| Amounts payable from pending trades | $(103) | $(209) |
| Interest payable | (32) | (22) |
| Securities sold short | (613) | (480) |
| Collateral payable | (128) | (184) |
| Securities sold under repurchase agreements | (1,001) | (1,814) |
| Derivative-related liabilities | (187) | (314) |
| Investment-related liabilities representing financial liabilities at FVTPL | $(2,064) | $(3,023) |
| Borrowings | ||
| Capital market debt financing | $(5,158) | $(4,624) |
| Borrowings representing financial liabilities designated at FVTPL | $(5,158) | $(4,624) |
| Net investments | $50,576 | $46,867 |
Table 7 Notes
|
||
(I) Public markets
Public markets consist of Canadian and foreign investments in the following securities: common shares, American depository receipts, global depository receipts, participation notes, preferred shares, income trust units, exchange traded funds units, pooled funds units, and securities convertible into common shares of publicly listed issuers.
Valuation techniques
Direct investments in Canadian and foreign equities are measured at fair value using quoted prices in active markets and are based on the most representative price within the bid-ask spread.
In the case of investments in pooled funds, fair value is measured using unit values obtained from each of the funds’ administrators, which are derived from the fair value of the underlying investments in each pooled fund. PSPIB reviews the fair value received, and where necessary, the impact of restrictions on the sale or redemption of such investments is taken into consideration.
(II) Private markets
Private markets consist of investments in real estate, private equity, infrastructure and natural resources.
Real estate investments are comprised of direct equity positions in various private entities, fund investments, as well as properties in the real estate sector. Real estate investments focus on partnerships, companies and properties operating mainly in the retirement and residential, office, retail, and industrial sectors, as well as private funds invested in real estate assets. Real estate investments are presented net of all third-party financing.
Private equity investments are comprised of fund investments with similar objectives, co-investments in private entities, as well as direct equity positions.
Infrastructure investments are comprised of direct equity positions, fund investments and co-investments in various private entities. Infrastructure investments focus on entities engaged in the management, ownership or operation of assets in energy, transportation and other regulated businesses. Infrastructure investments are presented net of all third-party financing.
Natural resources investments are comprised of direct equity positions, fund investments and co-investments in various private entities. Natural resources investments focus on entities engaged in the management, ownership or operation of assets in timberlands, agriculture and upstream oil and gas. Natural resources investments are presented net of all third-party financing.
Valuation techniques
The process for fair value measurement of private markets investments is described in Note 5(C) (II) and the valuation techniques, together with the significant inputs used, are described in Note 5(C) (III).
(III) Fixed income
Cash and cash equivalents
Cash includes demand deposits with financial institutions.
Cash equivalents include treasury bills, certificates of deposit, bankers’ acceptances and other fixed-income securities with maturities of 90 days or less that are held to meet short-term financial commitments. Such instruments are readily convertible into known amounts of cash and have an insignificant risk of change in value.
Money market securities, bonds and private debt securities
Fixed income consists of money market securities, government and corporate bonds, inflation-linked bonds and private debt securities. Money market securities include instruments having a maximum term to maturity of one year, such as treasury bills, certificates of deposit and bankers’ acceptances.
Government and corporate bonds include Canadian and foreign, federal, provincial, territorial and municipal bonds, floating rate notes, asset-backed term notes and mortgage-backed securities. Inflation-linked bonds are fixed income securities that earn inflation-adjusted returns.
Private debt securities are fixed income securities of private companies held directly or through private funds. Such debt securities take the form of senior debt, mezzanine and distressed debt and primary and secondary investments in leveraged loans. Private debt securities also include third-party loans such as junior and senior debts, construction loans, bridge loans, income-participating loans, as well as other structured finance products in the real estate sector.
Valuation techniques
Treasury bills are valued based on prices obtained from third-party pricing sources. Such prices are determined using the most representative price within a spread of dealer quotations. Certificates of deposit and bankers’ acceptances are recorded at cost plus accrued interest, which approximates their fair value given their short-term nature.
Fair values of government and most corporate bonds, inflation-linked bonds and mortgage-backed securities are based on prices obtained from third-party pricing sources. Such prices are determined using either an appropriate interest rate curve with a spread associated with the credit quality of the issuer or other generally accepted pricing methodologies.
The fair values of certain corporate bonds, private debt securities and asset-backed term notes are determined using valuation techniques. Such techniques, together with the significant inputs used, are described in Note 5(C) (III).
The fair value measurement of fund investments included as part of private debt securities is described in Note 5(C) (II).
(IV) Alternative investments
Alternative investments consist mainly of units of funds that hold a mix of equity, fixed income and derivative instruments, as well as hedge funds.
Valuation techniques
The fair value of these investments is determined based on the fair values reported by the funds’ administrators or general partners and reflects the fair value of the underlying equity, fixed income or derivative instruments, as applicable. PSPIB reviews the fair value received and, where necessary, the impact of restrictions on the sale or redemption of such investments is taken into consideration.
(V) Amounts receivable and payable from pending trades
Amounts receivable from pending trades consist of proceeds on sales of investments, excluding derivative financial instruments, which have been traded but remain unsettled at the end of the reporting period.
Amounts payable from pending trades consist of the cost of purchases of investments, excluding derivative financial instruments, which have been traded but remain unsettled at the end of the reporting period.
Valuation techniques
The fair value of amounts receivable and payable from pending trades reflects the value at which their underlying original sale or purchase transactions were undertaken.
(VI) Interest and dividends receivable
Interest and dividends are recorded at the amounts expected to be received at the end of the reporting period, which due to their short-term maturity, approximates fair value.
(VII) Interest payable
With respect to the borrowings described in Note 5(A) (XI), interest is accrued at the amount expected to be paid at the end of the reporting period, which approximates fair value.
(VIII) Securities sold short
Securities sold short reflect PSPIB’s obligation to purchase securities pursuant to short selling transactions. In such transactions, PSPIB sells securities it does not own with an obligation to purchase similar securities on the market to cover its position.
Valuation techniques
Using quoted market prices that are based on the most representative price within the bid-ask spread, the fair value of securities sold short is measured using the same method as the similar long positions presented within public markets and fixed income.
(IX) Collateral payable
As part of securities lending and certain OTC derivative transactions, when cash is received, it is recognized as collateral payable. The payable balance reflects the obligation of the transferee to return the amount to the transferor at the end of the transaction in the absence of an event of default by the transferor.
(X) Securities sold under repurchase agreements and purchased under reverse repurchase agreements
As described in Note 2(G), PSPIB is party to repurchase and reverse repurchase agreements.
Valuation techniques
Obligations to repurchase or resell the securities sold or purchased under such agreements are recorded at cost plus accrued interest, which due to their short-term maturity, approximates fair value.
(XI) Borrowings under the capital market debt program
PSPIB’s capital market debt program is described in Note 9(B).
Valuation techniques
Short-term promissory notes are recorded at cost plus accrued interest, which due to their short-term maturity, approximates fair value. The fair value of PSPIB’s medium-term notes is based on prices that are obtained from third-party pricing sources. Such prices are determined using an interest rate curve with a spread consistent with PSPIB’s credit quality.
(B) Derivative-related assets and liabilities
Derivative financial instruments are financial contracts that are settled at a future date. The value of such instruments is derived from changes in the value of the underlying assets, interest or exchange rates. Derivative financial instruments do not, typically, require an initial net investment. In certain cases, they require an initial net investment that is less than what would be required to hold the underlying position directly. Derivative financial instruments can be listed or traded OTC. OTC instruments consist of those that are bilaterally negotiated and settled, and those that are cleared (OTC-cleared) by a central clearing party (CCP).
PSPIB uses derivative financial instruments to enhance returns or to replicate investments synthetically. Derivatives are also used to reduce the risk associated with existing investments.
PSPIB uses the following types of derivative financial instruments:
(I) Swaps
Swaps are transactions whereby two counterparties exchange cash flow streams with each other based on predetermined conditions that include a notional amount and a term. Swaps are used to increase returns or to adjust exposures of certain assets without directly purchasing or selling the underlying assets.
(II) Futures
Futures are standardized contracts to take or make delivery of an asset (buy or sell) at a predefined price and predefined future date. Futures are used to adjust exposures to specified assets without directly purchasing or selling the underlying assets.
(III) Forwards
Forwards are contracts involving the sale by one party and the purchase by another party of a predefined amount of an underlying instrument, at a predefined price and at a predefined date in the future. Forwards are used to adjust exposures to specified assets without directly purchasing or selling the underlying assets.
(IV) Options
Options are contracts where the seller gives the purchaser the right, but not the obligation, to buy or sell a given amount of an underlying security, index, commodity, currency, interest rate, credit or other financial instrument, at an agreed-upon price stipulated in advance, either at a determined date or at any time before the predefined maturity date.
(V) Warrants and rights
Warrants are options to purchase an underlying asset which is in the form of a transferable security and which can be listed on an exchange or traded OTC.
Rights are securities giving shareholders entitlement to purchase new shares issued by a corporation at a predetermined price (normally less than the current market price) in proportion to the number of shares already owned. Rights are issued only for a short period of time, after which they expire.
Valuation techniques
(i) Determination of fair value of derivative financial instruments
Listed derivative financial instruments are recorded at fair value using quoted market prices that are based on the most representative price within the bid-ask spread. OTC-cleared derivatives are recorded at fair value using prices obtained from the CCP. OTC derivatives are valued using appropriate valuation techniques such as discounted cash flows. These techniques use significant inputs that are observable in the market such as current market yields.
(ii) Notional values and fair values of derivative-related assets and liabilities
Notional values of derivative financial instruments are not recorded as assets or liabilities as they represent the face amount of the contract. Except for credit derivatives, notional values do not represent the potential gain or loss associated with the market or credit risk of such transactions disclosed below. Rather, they serve as the basis upon which the cash flows and the fair value of the contracts are determined.
| 2024 | 2023 | |||||
|---|---|---|---|---|---|---|
| Notional value | Fair value | Notional value | Fair value | |||
| Assets | Liabilities | Assets | Liabilities | |||
| Equity and commodity derivatives | ||||||
| Listed: Futures | $1,071 | $0 | $0 | $710 | $0 | $0 |
| Listed: Options: Purchased | 30 | 0 | 0 | 175 | 6 | 0 |
| Written | 0 | 0 | 0 | 230 | 0 | (3) |
| OTC | ||||||
| Swaps | 4,256 | 94 | (41) | 3,979 | 127 | (44) |
| Options: Purchased | 0 | 0 | 0 | 16 | 0 | 0 |
| Currency derivatives | ||||||
| Listed: Futures | 72 | 0 | 0 | 44 | 0 | 0 |
| OTC | ||||||
| Forwards | 11,191 | 42 | (66) | 20,670 | 136 | (160) |
| Swaps | 236 | 0 | (6) | 686 | 17 | (6) |
| Options: Purchased | 174 | 1 | 0 | 396 | 2 | 0 |
| Written | 202 | 0 | (1) | 512 | 0 | (2) |
| Interest rate derivatives | ||||||
| Listed: Futures | 2,080 | 0 | 0 | 423 | 0 | 0 |
| Listed: Options: Purchased | 7,994 | 4 | 0 | 9,334 | 1 | 0 |
| Written | 8,255 | 0 | (3) | 8,548 | 0 | (1) |
| OTC | ||||||
| Forwards | 153 | 0 | (1) | 272 | 2 | (1) |
| Swaps | 467 | 1 | (4) | 670 | 6 | (3) |
| Options: Purchased | 10,247 | 114 | 0 | 12,623 | 123 | 0 |
| Written | 13,315 | 0 | (62) | 14,735 | 0 | (92) |
| OTC‑cleared | ||||||
| Swaps | 12,591 | 0 | 0 | 15,559 | 0 | 0 |
| Credit derivatives | ||||||
| OTC | ||||||
| Credit default swaps: | ||||||
| Purchased | 119 | 0 | (3) | 108 | 0 | (2) |
| Writtentable 8 note 1 | 382 | 3 | 0 | 232 | 3 | 0 |
| OTC-cleared | ||||||
| Credit default swaps: | ||||||
| Purchased | 565 | 0 | 0 | 389 | 0 | 0 |
| Total | - | $259 | $(187) | - | $423 | $(314) |
Table 8 Note
|
||||||
| 2024 | 2023 | |||||
|---|---|---|---|---|---|---|
| Notional value | Fair value | Notional value | Fair value | |||
| Assets | Liabilities | Assets | Liabilities | |||
| Listed derivatives | $19,452 | $4 | $(3) | $19,464 | $7 | $(4) |
| OTC derivatives | 40,742 | 255 | (184) | 54,899 | 416 | (310) |
| OTC-cleared derivatives | 13,156 | 0 | 0 | 15,948 | 0 | 0 |
| Total | - | $259 | $(187) | - | $423 | $(314) |
| 2024 | 2023 | |
|---|---|---|
| Less than 3 months | $32,936 | $44,180 |
| 3 to 12 months | 21,558 | 28,656 |
| Over 1 year | 18,856 | 17,475 |
(C) Fair value hierarchy
(I) Classification
Financial assets and financial liabilities described under Note 5(A) are classified within the fair value hierarchy, described as follows, based on the lowest level of input that is significant to the fair value measurement as a whole.
- Level 1 inputs are quoted prices (unadjusted) in active markets for identical assets or liabilities that PSPIB can access at the end of the reporting period
- Level 2 inputs are inputs other than quoted prices included within Level 1 that are observable for the asset or the liability, either directly or indirectly. Level 2 inputs include:
- quoted prices for similar assets or liabilities in active markets
- quoted prices for identical or similar assets or liabilities in markets that are not active
- inputs other than quoted prices that are observable for the asset or liability
- market-corroborated inputs
- Level 3 inputs are unobservable inputs for the asset or liability that are used within model-based techniques. They reflect PSPIB’s assessment of the assumptions that market participants would use in pricing the assets or liabilities
The classification within the levels of the hierarchy is established at the time of the initial determination of fair value of the asset or liability and reviewed at the end of each reporting period. PSPIB determines whether a transfer between levels has occurred and recognizes such transfers at the beginning of the reporting period.
| Level 1 | Level 2 | Level 3 | Total fair value | |
|---|---|---|---|---|
| Investments Public markets |
||||
| Canadian equity | $185 | $350 | $0 | $535 |
| Foreign equity | 7,478 | 98 | 446 | 8,022 |
| Private markets | ||||
| Real estate | 0 | 0 | 7,106 | 7,106 |
| Private equity | 0 | 0 | 7,565 | 7,565 |
| Infrastructure | 0 | 0 | 7,794 | 7,794 |
| Natural resources | 0 | 0 | 4,154 | 4,154 |
| Fixed income | ||||
| Cash and cash equivalents | 256 | 421 | 0 | 677 |
| Money market securities | 1,487 | 130 | 0 | 1,617 |
| Government and corporate bonds | 1,329 | 3,820 | 1 | 5,150 |
| Inflation-linked bonds | 3,410 | 21 | 0 | 3,431 |
| Private debt securities | 0 | 0 | 5,694 | 5,694 |
| Alternative investments | 0 | 3,030 | 1,910 | 4,940 |
| Total investments | $14,145 | $7,870 | $34,670 | $56,685 |
| Investment-related assets | ||||
| Amounts receivable from pending trades | $0 | $244 | $0 | $244 |
| Interest receivable | 0 | 121 | 0 | 121 |
| Dividends receivable | 0 | 52 | 0 | 52 |
| Securities purchased under reverse repurchase agreements | 0 | 437 | 0 | 437 |
| Derivative-related assets | 4 | 255 | 0 | 259 |
| Total investment-related assets | $4 | $1,109 | $0 | $1,113 |
| Investments representing financial assets at FVTPL | $14,149 | $8,979 | $34,670 | $57,798 |
| Investment-related liabilities | ||||
| Amounts payable from pending trades | $0 | $(103) | $0 | $(103) |
| Interest payable | 0 | (32) | 0 | (32) |
| Securities sold short | (613) | 0 | 0 | (613) |
| Collateral payable | 0 | (128) | 0 | (128) |
| Securities sold under repurchase agreements | 0 | (1,001) | 0 | (1,001) |
| Derivative-related liabilities | (3) | (184) | 0 | (187) |
| Investment-related liabilities representing financial liabilities at FVTPL | $(616) | $(1,448) | $0 | $(2,064) |
| Borrowings | ||||
| Capital market debt financing | $0 | $(5,158) | $0 | $(5,158) |
| Borrowings representing financial liabilities designated at FVTPL | $0 | $(5,158) | $0 | $(5,158) |
| Net investments | $13,533 | $2,373 | $34,670 | $50,576 |
| Level 1 | Level 2 | Level 3 | Total fair value | |
|---|---|---|---|---|
| Investments Public markets |
||||
| Canadian equity | $529 | $333 | $0 | $862 |
| Foreign equity | 6,400 | 199 | 188 | 6,787 |
| Private markets | ||||
| Real estate | 0 | 0 | 7,914 | 7,914 |
| Private equity | 0 | 0 | 6,907 | 6,907 |
| Infrastructure | 0 | 0 | 6,915 | 6,915 |
| Natural resources | 0 | 0 | 3,590 | 3,590 |
| Fixed income | ||||
| Cash and cash equivalentstable 12 note 1 | 635 | 711 | 0 | 1,346 |
| Money market securitiestable 12 note 1 | 1,459 | 145 | 0 | 1,604 |
| Government and corporate bonds | 1,563 | 2,902 | 1 | 4,466 |
| Inflation-linked bonds | 2,200 | 0 | 0 | 2,200 |
| Private debt securities | 0 | 0 | 5,840 | 5,840 |
| Alternative investments | 0 | 2,963 | 1,826 | 4,789 |
| Total investments | $12,786 | $7,253 | $33,181 | $53,220 |
| Investment-related assets | ||||
| Amounts receivable from pending trades | $0 | $488 | $0 | $488 |
| Interest receivable | 0 | 97 | 0 | 97 |
| Dividends receivable | 0 | 40 | 0 | 40 |
| Securities purchased under reverse repurchase agreements | 0 | 246 | 0 | 246 |
| Derivative-related assets | 7 | 416 | 0 | 423 |
| Total investment-related assets | $7 | $1,287 | $0 | $1,294 |
| Investments representing financial assets at FVTPL | $12,793 | $8,540 | $33,181 | $54,514 |
| Investment-related liabilities | ||||
| Amounts payable from pending trades | $0 | $(209) | $0 | $(209) |
| Interest payable | 0 | (22) | 0 | (22) |
| Securities sold short | (449) | (31) | 0 | (480) |
| Collateral payable | 0 | (184) | 0 | (184) |
| Securities sold under repurchase agreements | 0 | (1,814) | 0 | (1,814) |
| Derivative-related liabilities | (4) | (310) | 0 | (314) |
| Investment-related liabilities representing financial liabilities at FVTPL | $(453) | $(2,570) | $0 | $(3,023) |
| Borrowings | ||||
| Capital market debt financing | $0 | $(4,624) | $0 | $(4,624) |
| Borrowings representing financial liabilities designated at FVTPL | $0 | $(4,624) | $0 | $(4,624) |
| Net investments | $12,340 | $1,346 | $33,181 | $46,867 |
Table 12 Note
|
||||
As at 31 March 2023, foreign equity securities with a fair value of $6 million were indirectly held and classified as Level 2. During the year ended 31 March 2024, these securities were transferred to Level 1 as they became directly held by PSPIB.
There were no significant transfers between Level 1 and Level 2 during the year ended 31 March 2023.
(II) Process for Level 3 fair value determination
The valuation process is monitored and governed by an internal valuation committee (VC). This committee is responsible for overseeing all aspects of fair value determination. This includes valuation methodologies and procedures for each type of investment and ensuring they are complied with. Valuation methodologies established are based on widely recognized practices that are consistent with professional appraisal standards. Such standards include, among others, the International Private Equity and Venture Capital Valuation Guidelines, the Canadian Uniform Standards of Professional Appraisal Practice and the Uniform Standards of Professional Appraisal Practice in the United States of America.
For the year ended 31 March 2024, the fair value of investments classified as Level 3 in private markets was determined quarterly and adjusted to reflect the impact of any significant market or investment‑specific events or circumstances. For the year ended 31 March 2023, such fair value was determined at least semi-annually. For each investment, the relevant valuation methodology is applied consistently over time as appropriate in the prevailing circumstances. The appropriateness of significant changes in valuation methodologies is reviewed by the VC.
In cases where the services of third-party appraisers are used, PSPIB ensures their independence and that the valuation methods used are consistent with professional appraisal standards outlined above. In validating the work performed by appraisers, PSPIB ensures that the assumptions used correspond to financial information and forecasts of the underlying investment.
With respect to fund investments classified as Level 3, the annual fair value is generally determined based on the most recent audited financial statements received from the fund’s general partner. For interim reporting periods, fair value is obtained from information provided by the fund’s administrators and is reviewed by PSPIB to ensure reasonableness and adherence to acceptable industry valuation methods. Where necessary, the impact of restrictions on the sale or redemption of such investments is taken into consideration in determining fair value.
To reflect the impact, where applicable, of significant market movements or other events occurring up to the end of the reporting period, adjustments to private markets and fund investments are made as appropriate. Such adjustments are based on a number of factors including public market trading comparables, investment-specific characteristics as well as market conditions and uncertainties at that time.
(III) Level 3 significant inputs
| Financial assets | Type of investment | Fair value ($ millions) | Significant valuation techniques | Significant unobservable inputs | Range (weighted average) |
|---|---|---|---|---|---|
| Public markets | |||||
| Foreign equity | Direct investments | $446 | NAVtable 13 note 1 | n/a | n/a |
| Private markets | |||||
| Real estate | Direct and co-investments | $6,439 | Discounted cash flow (DCF) | Discount ratetable 13 note 2 table 13 note 3 | 2.90%-18.00% (7.80%) |
| Terminal capitalization ratetable 13 note 2 table 13 note 3 | 3.20%-12.25% (6.08%) | ||||
| Direct capitalization | Capitalization ratetable 13 note 2 table 13 note 4 | 2.51%—10.00% (4.85%) | |||
| Stabilized occupancy ratetable 13 note 4 table 13 note 5 | 98.00%—100.00% (99.57%) | ||||
| Sales comparison approach | Price per square foottable 13 note 4 table 13 note 5 | $4.28—$1,827.48 ($165.83) | |||
| NAVtable 13 note 1 | n/a | n/a | |||
| Transaction price | n/a | n/a | |||
| Fund investments | $667 | NAVtable 13 note 1 | n/a | n/a | |
| Other private markets | Direct and co-investments | $14,325 | DCF | Discount ratetable 13 note 2 | 5.19%—18.50% (9.58%) |
| Market comparables | n/a | n/a | |||
| NAVtable 13 note 1 | n/a | n/a | |||
| Transaction price | n/a | n/a | |||
| Fund investments | $5,188 | NAVtable 13 note 1 | n/a | n/a | |
| Fixed income | |||||
| Corporate bonds | Asset-backed term notes | $1 | Third-party pricingtable 13 note 1 | n/a | n/a |
| Private debt securities | Direct and co-investments | $4,310 | DCF | Discount ratetable 13 note 2 | 7.02%—30.09% (12.24%) |
| NAVtable 13 note 1 | n/a | n/a | |||
| Transaction price | n/a | n/a | |||
| Fund investments | $1,384 | NAVtable 13 note 1 | n/a | n/a | |
| Alternative investments | Fund investments | $1,910 | NAVtable 13 note 1 | n/a | n/a |
| Total | $34,670 | ||||
Table 13 Notes
|
|||||
| Financial assets | Type of investment | Fair value ($ millions) | Significant valuation techniques | Significant unobservable inputs | Range (weighted average) |
|---|---|---|---|---|---|
| Public markets | |||||
| Foreign equity | Direct investments | $188 | NAVtable 14 note 1 | n/a | n/a |
| Private markets | |||||
| Real estate | Direct and co-investments | $7,247 | Discounted cash flow (DCF) | Discount ratetable 14 note 2 table 14 note 3 | 3.30%—19.00% (7.40%) |
| Terminal capitalization ratetable 14 note 2 table 14 note 3 | 3.56%—12.00% (5.60%) | ||||
| Direct capitalization | Capitalization ratetable 14 note 2 table 14 note 4 | 2.35%—10.00% (4.62%) | |||
| Stabilized occupancy ratetable 14 note 4 table 14 note 5 | 98.00%—100.00% (99.55%) | ||||
| Sales comparison approach | Price per square foottable 14 note 4 table 14 note 5 | $3.42—$1,750.44 ($256.48) | |||
| NAVtable 14 note 1 | n/a | n/a | |||
| Transaction price | n/a | n/a | |||
| Fund investments | $667 | NAVtable 14 note 1 | n/a | n/a | |
| Other private markets | Direct and co-investments | $12,528 | DCF | Discount ratetable 14 note 2 | 5.50%—20.00% (9.68%) |
| Market comparables | n/a | n/a | |||
| NAVtable 14 note 1 | n/a | n/a | |||
| Transaction price | n/a | n/a | |||
| Fund investments | $4,884 | NAVtable 14 note 1 | n/a | n/a | |
| Fixed income | |||||
| Corporate bonds | Asset-backed term notes | $1 | Third-party pricingtable 14 note 1 | n/a | n/a |
| Private debt securities | Direct and co-investments | $4,416 | DCF | Discount ratetable 14 note 2 | 4.25%—23.48% (12.56%) |
| NAVtable 14 note 1 | n/a | n/a | |||
| Transaction price | n/a | n/a | |||
| Fund investments | $1,424 | NAVtable 14 note 1 | n/a | n/a | |
| Alternative investments | Fund investments | $1,826 | NAVtable 14 note 1 | n/a | n/a |
| Total | $33,181 | ||||
Table 14 Notes
|
|||||
(IV) Level 3 reconciliation
| Opening balance | Purchases | Sales | Settlements | Realized gains | Unrealized gains (losses)table 15 note 1 | Transfer out of Level 3 | Closing balance | |
|---|---|---|---|---|---|---|---|---|
| Public markets | $188 | $87 | $(26) | $0 | $15 | $182 | $0 | $446 |
| Private markets | 25,326 | 2,698 | (1,778) | 0 | 423 | (62) | 12 | 26,619 |
| Fixed income | 5,841 | 1,164 | (1,404) | 0 | 55 | 39 | 0 | 5,695 |
| Alternative investments | 1,826 | 107 | (210) | 0 | 49 | 138 | 0 | 1,910 |
| Total | $33,181 | $4,056 | $(3,418) | $0 | $542 | $297 | $12 | $34,670 |
Table 15 Note
|
||||||||
As at 31 March 2023, listed foreign equity securities with a fair value of $12 million were classified under Level 1. During the year ended 31 March 2024, those securities were transferred to Level 3 as the investment became privately held and its fair value was determined based on significant unobservable inputs.
| Opening balance | Purchases | Sales | Settlements | Realized gains (losses) | Unrealized gains (losses)table 16 note 1 | Transfer in (out) of Level 3 | Closing balance | |
|---|---|---|---|---|---|---|---|---|
| Public markets | $262 | $7 | $(25) | $0 | $5 | $(52) | $(9) | $188 |
| Private markets | 22,899 | 3,522 | (1,951) | 0 | 666 | 232 | (42) | 25,326 |
| Fixed income | 4,974 | 1,531 | (837) | 0 | 69 | 104 | 0 | 5,841 |
| Alternative investments | 1,642 | 133 | (113) | 0 | 21 | 143 | 0 | 1,826 |
| Total | $29,777 | $5,193 | $(2,926) | $0 | $761 | $427 | $(51) | $33,181 |
Table 16 Note
|
||||||||
1. Includes the pension plan allocation adjustments.
As at 31 March 2022, a public market investment of $9 million in a non-listed fund that held listed securities was classified under Level 3 due to the nature of the contractual restrictions on the redemption of fund units. During the year ended 31 March 2023, the listed securities held by the fund were transferred to PSPIB and were classified as Level 1. Additionally, as at 31 March 2022, a private market investment of $42 million was classified under Level 3 as its fair value was determined based on significant unobservable inputs. During the year ended 31 March 2023, this investment was transferred to Level 2 as the related securities became publicly traded. These securities held by PSPIB are unregistered and can only be sold upon their registration.
(V) Level 3 sensitivity analysis
In the course of measuring fair value of financial instruments classified as Level 3, valuation techniques used incorporate assumptions that are based on non-observable data. Significant assumptions used for each asset class are described in Note 5(C) (III). Although such assumptions reflect PSPIB’s best judgment, with all other variables held constant, the use of reasonably possible alternative assumptions could yield different fair value measures representing, at a minimum, a 3% increase and 3% decrease as at 31 March 2024 (31 March 2023—4% increase and 4% decrease) in the fair value of financial instruments categorized as Level 3 This excludes fund investments where a sensitivity analysis is not possible given the underlying assumptions used are not available to PSPIB. In the case of fund investments, the fair value is determined as indicated in Note 5(C) (II).
(D) Collateral pledged and received
PSPIB is party to agreements that involve pledging and holding collateral, as outlined in Notes 2(F), 2(G) and 7(B) (I). The following table illustrates the fair values of the pension plan’s allocated collateral, as well as the securities under the lending and borrowing programs and the securities under the repurchase and reverse repurchase agreements.
| 2024 | 2023 | |
|---|---|---|
| Securities lending and borrowing | ||
| Securities lent | $786 | $842 |
| Collateral heldtable 17 note 1 | 815 | 882 |
| Securities borrowed | 501 | 371 |
| Collateral pledgedtable 17 note 2table 17 note 3 | 516 | 394 |
| Securities repurchase and reverse repurchase agreements | ||
| Securities sold under repurchase agreements | 1,003 | 1,836 |
| Collateral pledgedtable 17 note 3 | 1,003 | 1,825 |
| Securities purchased under reverse repurchase agreements | 438 | 249 |
| Collateral heldtable 17 note 4 | 438 | 248 |
| Derivative contracts | ||
| Collateral pledgedtable 17 note 3 | 420 | 417 |
| Collateral heldtable 17 note 5 | 384 | 359 |
Table 17 Notes
|
||
6. Interest in other entities
(A) Subsidiaries, joint ventures and associates
In the normal course of business, investments in private markets are commonly held through investment entity subsidiaries formed by PSPIB. As at 31 March 2024, 145 investment entity subsidiaries were incorporated in North America, 28 in Europe, 19 in Oceania, 8 in Central and South America, 2 in Asia and 1 in Africa (31 March 2023—128 in North America, 28 in Europe, 19 in Oceania, 8 in Central and South America, 2 in Asia and 1 in Africa).
In addition, PSPIB controlled 92 investees directly or through its investment entity subsidiaries as at 31 March 2024 (31 March 2023—84 investees).
The following tables present, in descending order, the most significant investees held directly or indirectly by PSPIB where it has control, joint control or significant influence.
| Entity’s name | Financial asset class | Principal place of business | Ownership interest held by PSPIB (%) | Relationship to PSPIB |
|---|---|---|---|---|
| AviAlliance GmbH | Infrastructure | Europe | 100 | Controlled |
| Roadis Transportation Holding, S.L.U. | Infrastructure | Global | 100 | Controlled |
| American Wholesale Insurance Holding Company, LLC | Private equity | North America | 17 | Associate |
| SEGRO European Logistics Partnership S.à.r.l. | Real estate | Europe | 50 | Jointly controlled |
| Kaingaroa Timberlands Limited | Natural resources | Oceania | 56 | Jointly controlled |
| Andante InvesteeCo Inc. | Infrastructure | Oceania | 30 | Jointly controlled |
| Willow Topco Limited | Infrastructure | Europe | 63 | Jointly controlled |
| TDF S.A.S. | Infrastructure | Europe | 22 | Associate |
| Forth Ports Limited | Infrastructure | Europe | 51 | Jointly controlled |
| Cubico Sustainable Investments Limited | Infrastructure | Global | 50 | Jointly controlled |
| Entity’s name | Financial asset class | Principal place of business | Ownership interest held by PSPIB (%) | Relationship to PSPIB |
|---|---|---|---|---|
| AviAlliance GmbH | Infrastructure | Europe | 100 | Controlled |
| American Wholesale Insurance Holding Company, LLC | Private equity | North America | 22 | Associate |
| SEGRO European Logistics Partnership S.à.r.l. | Real estate | Europe | 50 | Jointly controlled |
| Kaingaroa Timberlands Limited | Natural resources | Oceania | 56 | Jointly controlled |
| Roadis Transportation Holding, S.L.U. | Infrastructure | Global | 100 | Controlled |
| Willow Topco Limited | Infrastructure | Europe | 74 | Jointly controlled |
| TDF S.A.S. | Infrastructure | Europe | 22 | Associate |
| Revera inc. | Real estate | North America | 100 | Controlled |
| Forth Ports Limited | Infrastructure | Europe | 51 | Jointly controlled |
| Alliant | Private equity | North America | 12 | Associate |
In addition to the above, PSPIB consolidates wholly owned subsidiaries that solely provide it with services that relate to its investment activities. Such services consist of investment management and financing of private market investments within the context of PSPIB’s capital market debt program described in Note 9(B).
(B) Structured entities
PSPIB holds interests in partnerships and funds mainly in the context of its investments in private markets. Given their nature, such entities commonly have the characteristics of a structured entity, that is, an entity where contractual arrangement matter more than voting rights in determining control and directing relevant activities. These entities are held as investments and do not expose PSPIB to additional risks or returns compared to interests held in non-structured entities.
Information regarding structured entities is included, as applicable, within disclosures of investment risk management under Note 7, guarantees and indemnities under Note 22 and commitments under Note 23.
7. Investment risk management
PSPIB is required to act in the best interests of the contributors and beneficiaries under the pension plan and for maximizing returns without undue risk of loss. In pursuit of this objective, PSPIB established an Enterprise Risk Management Policy (ERM Policy). The ERM Policy provides a framework for identifying, evaluating, managing, mitigating, monitoring and reporting the investment and non-investment risks to which PSPIB is exposed.
As part of the overall ERM policy, the objective of the Investment Risk Management Policy (IRM Policy) is to support the management of risk inherent to the investment decision-making process. The IRM Policy outlines a framework detailing how investment activities should comply with PSPIB’s risk philosophy and align with the tolerance and limits of its risk appetite. The IRM Policy also supplements the Statement of Investment Policies, Standards and Procedures (SIP&P), whose objective is to effectively manage investment risks related to the implementation of PSPIB’s various investment strategies. Investment risks include market, credit and liquidity risks.
(A) Market risk
Market risk is the risk that the value of an investment will fluctuate as a result of an adverse financial outcome due to changes in the factors that drive that value, such as changes in market prices, changes caused by factors specific to the individual investment, volatility in share and commodity prices, interest rate, foreign exchange or other factors affecting similar securities traded in the market.
(I) Measurement of market risk
As at 31 March 2024, the active annualized Value at Risk (“Active VaR”) was used as a primary measure of total portfolio market risk, to supplement the absolute annualized VaR (“Absolute VaR”) and monitor more closely the market risk directly attributable to PSPIB’s active investment management decisions. Active and Absolute VaR are used as key measures of total portfolio market risk.
The Absolute VaR quantifies, with a given confidence level, the loss in value of the total portfolio that one can expect, due to fluctuations in market prices, not to be exceeded over a given period. The VaR is also evaluated on an active basis by measuring the Active VaR. This measurement helps determine if the total portfolio deviates significantly from the Policy Portfolio, established with the SIP&P in mind.
For both Active VaR and Absolute VaR, PSPIB uses a historical VaR incorporating ten years’ worth of market returns scaled to a twelve-month holding period at a 95% confidence level. That is, statistically PSPIB would expect to see its total portfolio underperformance relative to the Policy Portfolio exceed the Active VaR and its total portfolio losses exceed the Absolute VaR only 5% of the time over a one-year period. For investments that are not actively traded, the calculation of the VaR uses securities with similar risk attributes as a proxy.
The VaR is statistically valid under normal market conditions. Although it includes potential losses derived from observed historical returns, it also assumes that the future will behave in a pattern similar to the past. Consequently, if future market conditions differ significantly from those of the past, potential losses may differ from those originally estimated.
| 31 March 2024 | 31 March 2023 | |
|---|---|---|
| Active VaR | 5.0% | 4.8% |
| Absolute VaR | 19.2% | 19.6% |
Stress testing
Although the VaR is a widely accepted risk measure, it is complemented by other risk measurement methodologies that provide greater insight on market risk. PSPIB uses stress testing and scenario analysis to examine the impact on financial results of abnormally large movements in risk factors. Such techniques are used to test a portfolio’s sensitivity to various risk factors and key model assumptions. These methods also use historically stressed periods to evaluate how a current portfolio reacts under such circumstances. Stress testing and scenario analysis are also deployed to assess new product performance.
(II) Interest rate risk
Interest rate risk refers to the risk that fluctuations in interest rates will directly affect the fair value of the pension plan’s net asset values.
| Less than 1 year | 1 to 5 years | 5 to 10 years | Over 10 years | Other | Total | |
|---|---|---|---|---|---|---|
| Cash and cash equivalents | $0 | $0 | $0 | $0 | $677table 21 note 1 | $677 |
| Money market securities | 0 | 0 | 0 | 0 | 1,617table 21 note 1 | 1,617 |
| Government and corporate bonds | 88 | 1,936 | 1,826 | 1,254 | 46table 21 note 2 | 5,150 |
| Inflation-linked bonds | 0 | 1,750 | 979 | 702 | 0 | 3,431 |
| Private debt securities | 7 | 2,130 | 1,386 | 746 | 1,425table 21 note 3 | 5,694 |
| Total fixed income | $95 | $5,816 | $4,191 | $2,702 | $3,765 | $16,569 |
Table 21 Notes
|
||||||
| Less than 1 year | 1 to 5 years | 5 to 10 years | Over 10 years | Other | Total | |
|---|---|---|---|---|---|---|
| Cash and cash equivalents | $0 | $0 | $0 | $0 | $1,346table 22 note 1 table 22 note 4 | $1,346 |
| Money market securities | 0 | 0 | 0 | 0 | 1,604table 22 note 1 table 22 note 4 | 1,604 |
| Government and corporate bonds | 131 | 1,962 | 1,280 | 1,029 | 64table 22 note 2 | 4,466 |
| Inflation-linked bonds | 0 | 937 | 763 | 500 | 0 | 2,200 |
| Private debt securities | 200 | 1,288 | 2,190 | 798 | 1,364table 22 note 3 | 5,840 |
| Total fixed income | $331 | $4,187 | $4,233 | $2,327 | $4,378 | $15,456 |
Table 22 Notes
|
||||||
All equity investments within Canadian equity, foreign equity, real estate, private equity, infrastructure and natural resources amounting to $35,176 million as at 31 March 2024 ($32,975 million as at 31 March 2023) do not have specified terms to maturity nor are they significantly exposed to interest rate risk.
Alternative investments described in Note 5(A) (IV), which amounted to $4,940 million as at 31 March 2024 ($4,789 million as at 31 March 2023), also have no specified terms to maturity. Certain of these investments, as well as reverse repurchase agreements and derivative contracts described in Notes 5(A) (X) and 5(B), respectively, are subject to interest rate risk exposures. These exposures are reflected in the VaR calculation described in Note 7(A) (I).
The terms to maturity of PSPIB’s capital market debt financing are disclosed in Note 9(B).
Interest Rate Benchmark Reform
PSPIB holds a number of financial instruments that will mature after the date the Interbank Offered Rate (IBOR) to which they refer is anticipated to be discontinued as a result of the reform. A steering committee oversees the transition from IBORs to alternative reference rates (ARRs) to mitigate the risks related to the discontinuation or unavailability of such rates, which are primarily operational. With respect to non-derivative financial instruments, PSPIB has been identifying agreements referring to IBORs and engaging in a timely contract remediation process with the related counterparties. For derivative contracts, PSPIB has adhered to the International Swaps and Derivatives Association (ISDA) Fallbacks Protocol that took effect on 25 January 2021, which provides an efficient mechanism to switch to ARRs as IBORs become unavailable.
The following table shows the fair value of non-derivative financial instruments and the notional value of derivative financial instruments that have yet to transition to ARRs.
| CDOR | |
|---|---|
| Non-derivative financial assets fair value | $70 |
| Derivatives notional | $143 |
- Foreign currency risk
PSPIB is exposed to currency risk through holding of investments that is, (i.e. direct and indirect holdings of securities, units in pooled funds and units in limited partnerships) or investment-related liabilities in various currencies. Fluctuations in the relative value of the Canadian dollar against these foreign currencies can result in a positive or a negative effect on the fair value of the investments. To mitigate this risk, PSPIB may take, through foreign forward contracts or cross currency swaps, positions in foreign currencies.
| Currency | 2024 | |
|---|---|---|
| Fair value | % of total | |
| U.S. dollar | $32,641 | 67.2 |
| Euro | 5,136 | 10.6 |
| Japanese yen | 1,893 | 3.9 |
| British pound | 1,807 | 3.7 |
| Indian rupee | 1,097 | 2.3 |
| Australian dollar | 832 | 1.7 |
| Mexican peso | 792 | 1.6 |
| Brazilian real | 599 | 1.2 |
| Swiss franc | 463 | 1.0 |
| Singapore dollar | 335 | 0.7 |
| Hong Kong dollar | 320 | 0.7 |
| New Taiwan dollar | 299 | 0.6 |
| Others | 2,339 | 4.8 |
| Total | $48,553 | 100.0 |
As at 31 March 2024, PSPIB and its investment entity subsidiaries also had commitments, denominated in foreign currencies of $45,568 million for the pension plan (US $29,342 million, €589 million, £79 million, 212 million Mexican pesos, 26 million Australian dollars, 196 million Indian rupees, and 601 million Japanese yen), which were not included in the foreign currency exposure table above.
| Currency | 2023 | |
|---|---|---|
| Fair value ($ millions) | % of total | |
| US dollar | $29,690 | 66.0 |
| Euro | 5,428 | 12.1 |
| Hong Kong dollar | 2,029 | 4.5 |
| British pound | 1,660 | 3.7 |
| Japanese yen | 1,091 | 2.4 |
| Indian rupee | 725 | 1.6 |
| Mexican peso | 708 | 1.6 |
| New Taiwan dollar | 402 | 0.9 |
| Singapore dollar | 390 | 0.9 |
| Swiss franc | 361 | 0.8 |
| South African rand | 326 | 0.7 |
| Others | 2,154 | 4.8 |
| Total | $44,964 | 100.0 |
As at 31 March 2023, PSPIB and its investment entity subsidiaries also had commitments, denominated in foreign currencies of $6,283 million for the pension plan (U.S. $3,950 million, €490 million, £80 million, 4 million South African rands, 348 million Mexican pesos, 45 million Australian dollars, 424 million Indian rupees and 818 million Japanese yen) which were not included in the foreign currency exposure table above.
(B) Credit risk
PSPIB is exposed to credit risk, which is the risk of non-performance of a debtor on whom PSPIB relies to fulfill contractual or financial obligations. That is, the risk that the issuer of a debt security or that the counterparty to a derivative contract, to a securities lending and borrowing transaction or to securities purchased under reverse repurchase agreements, is unable to meet its financial obligations.
Credit risk encompasses the risk of a deterioration of creditworthiness and the relevant concentration risk. Credit risk monitoring entails an evaluation of the credit quality of each issuer and counterparty that transacts with PSPIB. To perform this evaluation for public issuers and counterparties, PSPIB relies on four recognized credit rating agencies. A minimum of two credit ratings are used to classify each security. If the agencies disagree as to a security’s credit quality, PSPIB uses the lowest of the available ratings. For private issuers, PSPIB assigns internal credit ratings to issuers and measures the combined risk profile against set targets. To assign risk ratings to issuers, PSPIB uses methodologies comparable to those used by recognized rating agencies.
As at 31 March 2024, the pension plan’s maximum exposure to credit risk amounted to $17 billion (31 March 2023—$16 billion). This amount is presented before collateral held and netting arrangements that do not qualify for offsetting under IFRS. The maximum credit exposure excludes guarantees disclosed in Note 22 as well as investments in funds classified as alternative investments in Note 5(A). Such funds hold fixed income securities among other types of instruments.
To monitor the evolution of credit risk, PSPIB periodically produces a concentration report by credit rating of credit-sensitive securities. The concentration of credit risk by credit rating was as follows.
| Government and corporate bondstable 26 note 1 | Inflation-linked bondstable 26 note 1 | Cash equivalentstable 26 note 1 | Money market securitiestable 26 note 1 | Reverse repurchase agreements | OTC derivativestable 26 note 2 | Private debt securitiestable 26 note 1 | Totaltable 26 note 1 | |
|---|---|---|---|---|---|---|---|---|
| AAA-AA | $3,316 | $3,420 | $484 | $1,487 | $199 | $7 | $0 | $8,913 |
| A | 1,484 | 0 | 93 | 26 | 200 | 248 | 0 | 2,051 |
| BBB | 241 | 21 | 0 | 0 | 38 | 0 | 14 | 314 |
| BB or below | 139 | 0 | 0 | 0 | 0 | 0 | 5,731 | 5,870 |
| No ratingtable 26 note 3 | 16 | 0 | 0 | 0 | 0 | 0 | 13 | 29 |
| Total | $5,196 | $3,441 | $577 | $1,513 | $437 | $255 | $5,758 | $17,177 |
Table 26 Notes
|
||||||||
| Government and corporate bondstable 27 note 1 | Inflation-linked bondstable 27 note 1 | Cash equivalentstable 27 note 1 table 27 note 4 | Money market securitiestable 27 note 1 table 27 note 4 | Reverse repurchase agreements | OTC derivativestable 27 note 2 | Private debt securitiestable 27 note 1 | Totaltable 27 note 1 | |
|---|---|---|---|---|---|---|---|---|
| AAA-AA | $2,912 | $2,205 | $976 | $1,495 | $31 | $14 | $0 | $7,633 |
| A | 1,296 | 0 | 265 | 8 | 204 | 402 | 0 | 2,175 |
| BBB | 128 | 0 | 0 | 0 | 11 | 0 | 67 | 206 |
| BB or below | 145 | 0 | 0 | 0 | 0 | 0 | 5,774 | 5,919 |
| No ratingtable 27 note 3 | 20 | 0 | 0 | 0 | 0 | 0 | 53 | 73 |
| Total | $4,501 | $2,205 | $1,241 | $1,503 | $246 | $416 | $5,894 | $16,006 |
Table 27 Notes
|
||||||||
(I) Counterparty risk
Counterparty risk represents the credit risk from current and potential exposure related to transactions involving derivative contracts, securities lending and borrowing as well as securities repurchase and reverse repurchase agreements. In order to minimize counterparty risk, PSPIB requires that counterparties provide adequate collateral and meet its credit rating requirements. PSPIB frequently monitors the credit rating of its counterparties as determined by recognized credit rating agencies. With respect to derivative contracts, PSPIB has the ability to terminate all trades with most counterparties whose credit rating is downgraded below its requirements.
For OTC derivatives, PSPIB’s policy also requires the use of the ISDA Master Agreement with all counterparties to derivative contracts. The ISDA Master Agreement provides the contractual framework within which dealing activities across a full range of OTC products are conducted. In the case of OTC-cleared derivatives, trading activities are regulated between parties under terms that are customary to such transactions.
As a credit mitigation technique, the ISDA Master Agreement contractually binds counterparties to close-out netting provisions in the case of default by one of the counterparties. Additionally, the Credit Support Annex (CSA) to the ISDA Master Agreement enables PSPIB to realize any collateral placed with it in the case of default of the counterparty. The CSA also requires PSPIB to contribute further collateral when requested. All collateral transactions under the CSA are in cash, high-quality debt instruments or securities. The CSA also regulates the exchange of collateral when the credit exposure to a counterparty exceeds a predetermined threshold. Counterparties are generally authorized to sell, repledge or otherwise use collateral held. Similarly, in the case of OTC-cleared derivatives, collateral is required in cash, high quality debt instruments or securities and can be sold, repledged or otherwise used. PSPIB does not sell, repledge or otherwise use any collateral held in the form of securities but does reinvest all cash collateral, with respect to derivative contracts.
With respect to transactions involving securities lending and borrowing agreements as well as securities repurchase and reverse repurchase agreements, collateral requirements are in place to mitigate counterparty risk. Notes 2(F) and 2(G) describe collateral requirements in securities lending and borrowing programs as well as securities repurchase and reverse repurchase agreements.
Information in connection with collateral pledged by PSPIB and its counterparties is disclosed in Note 5(D).
In the case of the securities lending program, PSPIB’s exposure to counterparty risk is further mitigated as the custodian of the securities lent assumes the risk that a counterparty will be unable to meet its obligations associated with the collateral requirements.
PSPIB is responsible for counterparty risk monitoring and mitigation as well as maintaining a comprehensive, disciplined, and enterprise-wide process for tracking and managing counterparty risk. As such, PSPIB measures counterparty risk on an ongoing basis, evaluates and tracks the creditworthiness of current counterparties and mitigates counterparty risk through collateral management.
(II) Offsetting
PSPIB is subject to ISDA Master Agreements in relation to its OTC derivative financial instruments as described. Such agreements contain close-out netting provisions applicable only in the case of default. In certain cases, such agreements also allow for offsetting. In cases where the conditions for offsetting were met, financial instruments have been presented net in the Statement of Financial Position. Securities repurchase and reverse repurchase agreements, described in Notes 2(G) and 5(D) are subject to similar arrangements; however, they are not offset as the conditions for offsetting are not met.
The following tables present the financial assets and liabilities described above ($ millions):
| Gross amount of recognized financial assets | Less: gross amount of recognized financial liabilities set off | Net amount of financial assets presented in the statement of financial position | Less: related amounts not set off in the statement of financial position | |||
|---|---|---|---|---|---|---|
| Recognized financial liabilities | Collateral held and not recognized | Net | ||||
| As at 31 March 2024 | ||||||
| Reverse repurchase agreements | $437 | $0 | $437table 28 note 1 | $149 | $288 | $0 |
| OTC- derivatives | 255 | 0 | 255table 28 note 2 | 168 | 83 | 4 |
| Total | $692 | $0 | $692 | $317 | $371 | $4 |
| As at 31 March 2023 | ||||||
| Reverse repurchase agreements | $ 246 | $0 | $246table 28 note 1 | $235 | $11 | $0 |
| OTC-derivatives | 416 | 0 | 416table 28 note 2 | 296 | 89 | 31 |
| Total | $662 | $0 | $662 | $531 | $100 | $31 |
Table 28 Notes
|
||||||
| Gross amount of recognized financial liabilities | Less: gross amount of recognized financial assets set off | Net amount of financial liabilities presented in the statement of financial position | Less: related amounts not set off in the statement of financial position | |||
|---|---|---|---|---|---|---|
| Recognized financial assets | Collateral pledged and not derecognized | Net | ||||
| As at 31 March 2024 | ||||||
| Repurchase agreements | $1,001 | $0 | $1,001table 29 note 1 | $149 | $852 | $0 |
| OTC-derivatives | 184 | 0 | 184table 29 note 2 | 147 | 32 | 5 |
| Collateral payable | 23 | 0 | 23table 29 note 3 | 21 | 0 | 2 |
| Total | $1,208 | $0 | $1,208 | $317 | $884 | $7 |
| As at 31 March 2023 | ||||||
| Repurchase agreements | $1,814 | $0 | $1,814table 29 note 1 | $235 | $1,579 | $0 |
| OTC-derivatives | 310 | 0 | 310table 29 note 2 | 276 | 33 | 1 |
| Collateral payable | 22 | 0 | 22table 29 note 3 | 20 | 0 | 2 |
| Total | $2,146 | $0 | $2,146 | $531 | $1,612 | $3 |
Table 29 Notes
|
||||||
(C) Liquidity risk
Liquidity risk corresponds to the risk that PSPIB will not be able to meet its financial obligations on a timely basis, with sufficient and readily available cash resources. PSPIB’s cash position is monitored on a daily basis. In general, investments in cash, money market securities, floating rate notes, bonds and public equities are expected to be highly liquid as they will be invested in securities that are actively traded. PSPIB utilizes appropriate measures and controls to monitor liquidity risk in order to ensure that there is sufficient liquidity to meet financial obligations as they come due. A liquidity report taking into consideration future forecasted cash flows is prepared and presented to PSPIB’s senior management on a weekly basis. This ensures that sufficient cash reserves are available to meet forecasted cash outflows. Additionally, sufficient sources of liquidity are maintained for deployment in case of market disruption.
PSPIB has the ability to raise additional capital through the use of its capital market debt program. This program allows PSPIB to issue short-term promissory notes and medium-term notes. Note 9(B) provides additional information on the usage of the capital market debt program. Furthermore, PSPIB maintains credit facilities for general corporate purposes. Note 9(A) provides additional information with respect to such credit facilities.
The terms to maturity of the notional amount of derivatives are disclosed in Note 5(B).
Financial liabilities
The following tables present the fair value of non-derivative-related financial liabilities as well as derivative-related financial instruments, aggregated according to their maturities and excluding the impact of guarantees and indemnities disclosed in Note 22:
| Less than 3 months | 3 to 12 months | Over 1 year | Total | |
|---|---|---|---|---|
| Non-derivative-related financial liabilitiestable 30 note 1 | ||||
| Amounts payable from pending trades | $(103) | $0 | $0 | $(103) |
| Interest payable | (27) | (5) | 0 | (32) |
| Securities sold short | (613) | 0 | 0 | (613) |
| Collateral payable | (128) | 0 | 0 | (128) |
| Securities sold under repurchase agreements | (936) | (65) | 0 | (1,001) |
| Capital market debt financingtable 30 note 2 | (1,202) | (896) | (3,060) | (5,158) |
| Trade payable and other liabilities | (67) | (1) | (27) | (95) |
| Total | $(3,076) | $(967) | $(3,087) | $(7,130) |
| Derivative-related financial instruments | ||||
| Derivative-related assets | $115 | $56 | $88 | $259 |
| Derivative-related liabilitiestable 30 note 1 | (98) | (45) | (44) | (187) |
| Total | $17 | $11 | $44 | $72 |
Table 30 Notes
|
||||
| Less than 3 months | 3 to 12 months | Over 1 year | Total | |
|---|---|---|---|---|
| Non-derivative-related financial liabilitiestable 31 note 1 | ||||
| Amounts payable from pending trades | $(209) | $0 | $0 | $(209) |
| Interest payable | (20) | (2) | 0 | (22) |
| Securities sold short | (480) | 0 | 0 | (480) |
| Collateral payable | (184) | 0 | (0) | (184) |
| Securities sold under repurchase agreements | (1,687) | (127) | 0 | (1,814) |
| Capital market debt financingtable 31 note 2 | (719) | (933) | (2,972) | (4,624) |
| Trade payable and other liabilities | (72) | (1) | (28) | (101) |
| Total | $(3,371) | $(1,063) | $(3,000) | $(7,434) |
| Derivative-related financial instruments | ||||
| Derivative-related assets | $232 | $120 | $71 | $423 |
| Derivative-related liabilitiestable 31 note 1 | (177) | (98) | (39) | (314) |
| Total | $55 | $22 | $32 | $109 |
Table 31 Notes
|
||||
8. Contributions receivable
(A)Contributions receivable
| 2024 | 2023 | |
|---|---|---|
| Contributions receivable from plan members for past service | $92 | $86 |
| Contributions receivable from employer for past service | 150 | 137 |
| Total contributions receivable | $242 | $223 |
(B)Transfers receivable from Reserve Force
| 2024 | 2023 | |
|---|---|---|
| Transfers receivable from Reserve Force | $59 | $61 |
| Total transfers receivable from Reserve Force | $59 | $61 |
Members of the Reserve Force Pension Plan are automatically eligible for inclusion in the Canadian Forces Pension Plan when an eligibility threshold of 55 months of full-time service in a 60 month period is reached. Once qualified, the present value of service accumulated under the Reserve Force Pension Plan is calculated and transferred to the Canadian Forces Pension Plan; however a timing difference exists between the time when the amounts become eligible for a transfer and when the transfer occurs. The value of these assets will continue to be reassessed every year by OCA to factor in any changes to the actuarial assumptions.
9. Borrowings
(A) Credit facilities
PSPIB maintains a revolving credit facility in the amount of $2 billion and a demand line of credit in the amount of $1 billion (together “the credit facilities”).
The credit facilities are for general corporate purposes and are available in either Canadian or U.S. currencies. Subject to customary terms and conditions, these credit facilities are available at variable interest rates such as the prime rate and the U.S. base rate.
These credit facilities were not drawn upon as at 31 March 2024, and 31 March 2023.
(B) Capital market debt financing
PSPIB’s capital market debt program consists of the private placement of short-term promissory notes as well as medium-term notes issued by PSP Capital Inc., a wholly-owned subsidiary of PSPIB. The capital raised is primarily used to finance private market investments. It is unconditionally and irrevocably guaranteed by PSPIB in accordance with its corporate leverage policy.
The maximum amount authorized by PSPIB’s Board of Directors for the capital market debt program is limited to $12 billion for all aggregate short-term note programs, 6 billion Australian dollars for the Australian dollar-denominated medium-term note program and $20 billion for the medium-term note program.
PSPIB’s capital market debt financing was in compliance with the limits authorized by PSPIB’s Board of Directors during the years ended 31 March 2024, and 31 March 2023
| 2024 | 2023 | ||||||
|---|---|---|---|---|---|---|---|
| Currency | Term at issuance | Interest Rate (%) | Capital amounts payable at maturity | Fair value | Interest rate (%) | Capital amounts payable at maturity | Fair value |
| CAD | 180 days or less | 0 | $0 | $0 | 4.41—4.44 | $8 | $8 |
| USD | 365 days or less | 4.73—5.49 | 1,051 | 1,036 | 2.40—5.56 | 1,395 | 1,376 |
| EUR | 215 days or less | 3.85—3.93 | 137 | 136 | 0 | 0 | 0 |
| GBP | 245 days or less | 5.18—5.24 | 100 | 100 | 0 | 0 | 0 |
| AUD | 79 days or less | 4.28 | 25 | 25 | 0 | 0 | 0 |
| Total short-term notes | $1,313 | $1,297 | $1,403 | $1,384 | |||
| 2024 | 2023 | ||||||
|---|---|---|---|---|---|---|---|
| Maturity | Series | Currency | Interest Rate | Capital Amounts Payable at Maturity | Fair Value | Capital Amounts Payable at Maturity | Fair Value |
| November 2023 | 9 | CAD | 2.09% | $0 | $0 | $272 | $268 |
| April 2024 | 7 | CAD | 3.29% | 227 | 227 | 253 | 250 |
| September 2024 | G2 | USD | 0.50% | 323 | 316 | 325 | 309 |
| March 2025 | G5 | USD | SOFRtable 35 note 1+24 bps | 258 | 258 | 260 | 259 |
| November 2025 | 11 | CAD | 3.00% | 222 | 217 | 240 | 236 |
| June 2026 | 13 | CAD | 0.90% | 272 | 253 | 278 | 255 |
| June 2026 | G1 | USD | 1.00% | 258 | 238 | 260 | 236 |
| June 2027 | G6 | USD | 3.50% | 258 | 250 | 260 | 254 |
| March 2028 | 14 | CAD | 1.50% | 186 | 170 | 192 | 175 |
| October 2028 | G3 | USD | 1.63% | 258 | 228 | 260 | 229 |
| February 2029 | A1 | AUD | 4.63% | 253 | 255 | 0 | 0 |
| June 2029 | G8 | CAD | 3.75% | 267 | 266 | 267 | 271 |
| January 2030 | 12 | CAD | 2.05% | 239 | 216 | 238 | 217 |
| December 2030 | G13table 35 note 2 | CAD | 4.40% | 191 | 196 | 0 | 0 |
| March 2032 | G4table 35 note 2 | CAD | 2.60% | 191 | 172 | 192 | 177 |
| August 2032 | G7 | AUD | 4.57% | 39 | 38 | 40 | 40 |
| January 2033 | G9 | AUD | 4.82% | 34 | 34 | 35 | 35 |
| June 2033 | G11 | CAD | 4.15% | 477 | 476 | 0 | 0 |
| March 2038 | G10 | EUR | 3.68% | 28 | 29 | 28 | 29 |
| July 2043 | G12 | EUR | 3.68% | $21 | $22 | $0 | $0 |
| Total medium-term notes | $4,002 | $3,861 | $3,400 | $3,240 | |||
| Total capital market debt financing | $5,315 | $5,158 | $4,803 | $4,624 | |||
Table 35 Notes
|
|||||||
Unrealized losses in connection with borrowings amounted to $7 million for the year ended 31 March 2024 (unrealized losses of $50 million for the year ended 31 March, 2023).
| 2024 | 2023 | |
|---|---|---|
| Short-term promissory notes | $69 | $43 |
| Medium-term notes | 98 | 64 |
| Total | $167 | $107 |
(C) Reconciliation of liabilities arising from financing activities
The following provides a reconciliation of liabilities arising from financing activities, including both changes arising from cash and non-cash changes.
| Non-cash changes | ||||||
|---|---|---|---|---|---|---|
| Opening balance | Proceeds from borrowings | Repayment of borrowings | Foreign exchange losses | Fair valuetable 37 note 1 gains | Closing balance | |
| Capital market debt financing | $4,624 | $6,028 | $(5,500) | $(18) | $24 | $5,158 |
| Borrowings | $4,624 | $6,028 | $(5,500) | $(18) | $24 | $5,158 |
Table 37 Note
|
||||||
| Non-cash changes | ||||||
|---|---|---|---|---|---|---|
| Opening balance | Proceeds from borrowings | Repayment of borrowings | Foreign exchange losses | Fair valuetable 38 note 1 gains | Closing balance | |
| Capital market debt financing | $4,409 | $5,444 | $(5,294) | $115 | $(50) | $4,624 |
| Borrowings | $4,409 | $5,444 | $(5,294) | $115 | $(50) | $4,624 |
Table 38 Note
|
||||||
10. Related party transactions
(A) Certain investees
Transactions between PSPIB and its unconsolidated subsidiaries, jointly controlled investees and associates or subsidiaries of such entities are related party transactions. PSPIB enters into investment transactions with such related parties in the normal course of its business, more specifically, as part of private markets and certain fixed income investments described under Note 5(A) as well as guarantees, indemnities and commitments described under Notes 22 and 23, respectively. Since balances in connection with all investment transactions are measured at FVTPL, those transactions undertaken with related parties have the same impact on net assets available for benefits as those with unrelated parties.
Transactions between PSPIB and its consolidated subsidiaries, as well as related balances are eliminated upon consolidation and, therefore, are not disclosed in this note.
(B) Government-related entities
Since PSPIB is a Crown corporation, it is considered to be a government-related entity. Other entities that are controlled, jointly controlled or significantly influenced by the government are also considered government-related entities.
PSPIB may enter into investment transactions with government-related entities in the normal course of its business, more specifically, as part of private markets and certain fixed income investments described under Note 5(A). Such investment transactions are carried out on terms that are equivalent to those that may prevail in transactions with unrelated parties and are subject to the same internal processes. In this respect, transactions with such related parties have the same impact on the net assets available for benefits as those with unrelated parties. Consequently, management is availing itself of the exemption under IAS 24 Related Parties from making specific disclosures on transactions and balances with such government-related entities.
Transactions between Canadian Forces Pension Plan and Reserve Force Pension Plan are disclosed in Note 4 and in Note 8(B).
11. Capital management
PSPIB manages the pension plan’s investments. PSPIB’s investment objectives are:
- To invest fund transfers in the best interests of the beneficiaries and contributors under the CFSA. The funds received are invested with a view of achieving a maximum rate of return, without undue risk of loss, having regard to the funding, policies and requirements of the pension plan established under the CFSA and the ability of the pension plan to meet its financial obligations. The funds are also invested in accordance with PSPIB’s Investment Risk Management policy which is outlined in Note 7
- To maintain an appropriate credit rating to achieve access to the capital markets at the lowest cost of capital. Through PSP Capital Inc. and its leverage policies, PSPIB has the ability to raise capital by issuing short-term promissory notes and medium-term notes. Note 9(B) provides information on the capital market debt financing, and Note 7(C) provides information on PSPIB’s liquidity
The pension plan’s capital consists of the actuarial funding surplus or deficit determined regularly by the actuarial funding valuation prepared by the OCA. The purpose of this actuarial valuation is to determine the financial position of the pension plan by testing its ability to meet obligations to current plan members and their survivors. Using various assumptions, the OCA projects the future pension benefits to estimate the current value of the pension obligations on a funding basis, which is compared with the sum of: the investment assets held by PSPIB (net of investment-related liabilities and borrowings), including their projected earnings; and the discounted value of future plan member and government contributions, including future earnings on contributions. The result of this comparison is either an actuarial surplus or an actuarial deficit.
It is government policy that the obligations pertaining to service before 1 April 2000, are unfunded and are paid as they become due. For the obligations pertaining to service since 1 April 2000, the objective of managing the capital position of the pension plan is to ensure that the investments held by PSPIB are sufficient to meet the related future pension obligations.
12. Pension obligations
The OCA performs an actuarial valuation for accounting purposes as at 31 March of each fiscal year to measure and report the pension obligations, and to attribute the costs of the benefits to the period using the projected benefit method prorated on service. The assumptions used in the actuarial valuation are based on management’s best estimates of expected long-term experience and short-term forecasts, as well as the majority of the demographic assumptions underlying the triennial actuarial valuation for funding purposes of the pension plan, as at 31 March 2022. The assumptions include estimates of discount rates, future inflation, returns on investments, general wage increases, workforce composition, retirement rates and mortality rates.
The discount rates used to measure the present value of the pension obligations are as follows:
- for funded pension benefits, the streamed expected rates of return on invested funds; and
- for unfunded pension benefits, the government’s cost of borrowing derived from the yields on the actual zero-coupon yield curve for Government of Canada bonds which reflect the timing of the expected future cash flows
| 2024 (%) |
2023 (%) |
|
|---|---|---|
| Discount rates | ||
| Funded pension benefitstable 39 note 1 | 6.1 | 6.0 |
| Unfunded pension benefitstable 39 note 2 | 3.4 | 3.0 |
| Long-term rate of inflation | 2.0 | 2.0 |
| Long-term general wage increase | 2.5 | 2.6 |
Table 39 Notes
|
||
For the year ended 31 March 2024, the pension plan recorded total net gains of $2,002 million (total net gains of $2,694 million in 2023) consisting of net gains of $2,549 million (net gains of $4,454 million in 2023) due to changes in actuarial assumptions and net losses of $547 million (net losses of $1,760 million in 2023) due to experience.
13. Deficit to be financed by the Government of Canada
The financial statement deficit does not impact the benefit payments to plan members because the government has a statutory obligation to pay the pension benefits it sponsors. Pursuant to pension legislation, the transactions for funded and unfunded pension benefits are tracked in the pension accounts within the accounts of Canada.
(A) Funded pension benefits
The pension plan is financed from employee and employer contributions, as well as from investment earnings. Funded pension benefits relate to post-March 2000 service that falls within the Income Tax Act limits. An amount equal to contributions less benefit payments and other charges is invested by PSPIB. Funded pension benefits also include pre-April 2000 service purchased since 1 April 2000.
(B) Unfunded pension benefits
Unfunded pension benefits related to pre-April 2000 service are tracked in the pension plan superannuation account since there are no invested funds maintained for this account (see Note 20). Employee and employer contributions for unfunded pension benefits are part of the CRF.
14. Investment income
The investment income of the pension plan is presented for each major class of financial assets and liabilities and has two categories: interest and dividends, and net unrealized and realized gains (losses). This presentation reflects the substance of the investment income generated by the underlying investments, whether directly held by PSPIB or by its investment entity subsidiaries.
| 2024 | 2023 | |||||
|---|---|---|---|---|---|---|
| Interest and dividends | Change in fair valuetable 40 note 1 | Total investment Income | Interest and dividends | Change in fair valuetable 40 note 1 | Total investment income | |
| Public markets | $206 | $1,219table 40 note 2 | $1,425 | $223 | $(328)table 40 note 2 | $(105) |
| Private markets | ||||||
| Real estate | 110 | (971)table 40 note 2 | (861) | 100 | (55)table 40 note 2 | 45 |
| Private equity | 90 | 760table 40 note 2 | 850 | 30 | 221table 40 note 2 | 251 |
| Infrastructure | 173 | 747table 40 note 2 | 920 | 161 | 765table 40 note 2 | 926 |
| Natural resources | 56 | 72table 40 note 2 | 128 | 83 | 176table 40 note 2 | 259 |
| Fixed income | 876 | 57table 40 note 2 | 933 | 655 | 104table 40 note 2 | 759 |
| Alternative investments | 3 | 451 | 454 | 3 | 382 | 385 |
| Total before giving effect to investment-related assets and liabilities | $1,514 | $2,335 | $3,849 | $1,255 | $1,265 | $2,520 |
| Investment-related assets and liabilities | 11 | 55 | 66 | 10 | (43) | (33) |
| Capital market debt financing | 0 | (9) | (9) | 0 | (147) | (147) |
| Investment income | $1,525 | $2,381 | $3,906 | $1,265 | $1,075 | $2,340 |
Table 40 Notes
|
||||||
15. Contributions
| 2024 | 2023 | |
|---|---|---|
| From plan members | ||
| Current service contributions | $641 | $537 |
| Past service contributions | 22 | 20 |
| Change in contributions receivable | 6 | (10) |
| Total plan member contributions | $669 | $547 |
| From employer | ||
| Current service contributions | $1,025 | $879 |
| Past service contributions | 35 | 32 |
| Change in contributions receivable | 13 | (18) |
| Total employer contributions | $1,073 | $893 |
| Total plan member and employer contributions | $1,742 | $1,440 |
16.Special employer contribution for actuarial deficit
The CFSA requires that any actuarial deficit be dealt with by the government, through transferring equal instalments to the pension fund over a period of up to 15 years by means of special employer contributions based on triennial actuarial valuations for funding purposes, starting in the fiscal year in which the actuarial report is tabled in Parliament.
No special employer contribution was made to the pension fund in the fiscal year ended 31 March 2024 (no special employer contribution in 2023) since no actuarial deficit was identified in the triennial actuarial valuation of the pension plan as at 31 March 2022, that was tabled in Parliament on 24 November 2023. The next triennial actuarial valuation of the pension plan as at 31 March 2025, is expected to be tabled in Parliament in calendar year 2026.
17. Benefit payments and refunds and transfers
(A) Benefit payments
| 2024 | 2023 | |
|---|---|---|
| Retirement benefit payments | $1,202 | $1,070 |
| Minimum benefit payments | 2 | 2 |
| Total benefit payments | $1,204 | $1,072 |
(B) Refunds and transfers
| 2024 | 2023 | |
|---|---|---|
| Returns of contributions and transfer value payments | $126 | $203 |
| Payments with respect to division of pension benefits | 32 | 37 |
| Transfers to other pension plans | 1 | 1 |
| Total refunds and transfers | $159 | $241 |
18. Investment-related expenses
| 2024 | 2023 | |
|---|---|---|
| Interest expense | $259 | $155 |
| Transaction costs | 30 | 27 |
| External investment management feestable 44 note 1 | 10 | 13 |
| Other (net)table 44 note 2 | 71 | 41 |
| Total | $370 | $236 |
Table 44 Notes
|
||
19. Administrative expenses
The legislation provides for administrative expenses to be charged to the pension plan. The Treasury Board approves the administrative expenses chargeable to the pension plan.
PSPC, as the day-to-day administrator, recovers from the pension plan administrative expenses for the activities directly attributable to its administration. These costs include salaries and benefits, systems maintenance and development, accommodation, and other operating costs of administering the pension plan within the department.
DND, as the program manager of the pension plan, provides policy interpretation support, information to plan members, financing and funding services and support to the Pension Advisory Committee, and charges its administrative costs to the pension plan.
The OCA provides actuarial valuation services. The costs related to these services are charged to the pension plan.
PSPIB’s costs of operation are charged to the four plans for which PSPIB provides investment services, namely, the public service pension plan, the Canadian Forces Pension Plan, the Reserve Force Pension Plan and the Royal Canadian Mounted Police Pension Plan. PSPIB allocates the direct costs of investment activities, such as external investment management fees and custodial fees that are included in each pension plan’s administrative expenses, based upon the net investments of each pension plan at the time the expense was incurred.
In 2024, 19.2% of PSPIB’s costs of operation were allocated to the Canadian Forces Pension Plan (19.4% in 2023) as plan-related administrative expenses, such as salaries and employee benefits, operations and maintenance, professional and consulting fees, and other operating fees.
| 2024 | 2023 | |
|---|---|---|
| PSPC | ||
| Salaries and employee benefits | $28 | $24table 45 note 2 |
| Operations and maintenance | 12 | 11table 45 note 2 |
| PSPC Total | $40 | $35 |
| DND | ||
| Salaries and employee benefits | $3 | $3 |
| Operations and maintenance | 1 | 1 |
| DND Total | $4 | $4 |
| OCA | ||
| Actuarial fees | $1 | $1 |
| Total for government departments (included in the service cost) | $45 | $40 |
| PSPIB | ||
| Salaries and employee benefits | $85 | $88 |
| Operations and maintenance | 22 | 22 |
| Professional and consulting fees | 22 | 27 |
| Other | 5 | 7 |
| PSPIB Total | $134 | $144 |
| Total administrative expensestable 45 note 1 | $179 | $184 |
Table 45 Notes
|
||
20. Superannuation account
A separate superannuation account has been established within the accounts of Canada in accordance with the CFSA and is not consolidated in the pension plan financial statements. In order for the government to track transactions made through the CRF, the superannuation account records contributions, benefit payments, interest and transfers that pertain to service before 1 April 2000. The superannuation account does not contain separate invested funds; rather, it is credited with notional interest as though net cash flows were invested quarterly in 20-year Government of Canada bonds issued at prescribed rates and held to maturity.
The following summarizes the financial position of the superannuation account and contributions receivable for service before 1 April 2000.
| 2024 | 2023 | |
|---|---|---|
| Balance of account | ||
| Superannuation account | $46,170 | $44,158 |
| Contributions receivable from plan members for past service | 7 | 7 |
| Contributions receivable from employer for past service | 7 | 7 |
| Subtotal | $46,184 | $44,172 |
| Pension obligationtable 46 note 1 | $43,956 | $46,838 |
| Excess/(Shortfall) of the balance of the account over the pension obligation | $2,228 | $(2,666) |
Table 46 Notes
|
||
The CFSA requires that any actuarial shortfall resulting from a lower balance in the superannuation account than the actuarial liability is addressed by the government, through crediting the superannuation account in equal instalments over a period of up to 15 years by means of special employer contributions based on triennial actuarial valuations for funding purposes, starting in the fiscal year in which the actuarial report is tabled in Parliament.
For the year ended 31 March 2024, a special employer contribution of $3,298 million was credited to the superannuation account (no special employer contribution in 2023) to cover the actuarial shortfall, based on the triennial actuarial valuation of the pension plan as at March 31 2022.
The CFSA also allows the excess, based on the actuarial valuation for funding purposes, to be reduced by decreasing the superannuation account over a period of up to 15 years; however, if the balance of the superannuation account exceeds 110% of the amount required to meet the cost of the benefits payable, the excess amount must be reduced by decreasing the superannuation account annually over a period of up to 15 years.
| 2024 | 2023 | |
|---|---|---|
| Opening balance | $44,172 | $45,319 |
| Increase | ||
| Contributions by plan members | 2 | 2 |
| Contributions by employer | ||
| Regular contributions | 2 | 2 |
| Special contributions | 3,298 | 0 |
| Net change in prior service contributions receivable | 0 | (2) |
| Interest income | 1,331 | 1,405 |
| Total increase | $4,633 | $1,407 |
| Decrease | ||
| Benefits paid | $2,605 | $2,525 |
| Refunds and transfers | 10 | 13 |
| Administrative expenses | 6 | 16 |
| Total decrease | $2,621 | $2,554 |
| Closing balance | $46,184 | $44,172 |
21. Retirement compensation arrangement
The retirement compensation arrangement (RCA) has been established under the authority of the Special Retirement Arrangements Act to provide supplementary pension benefits to certain plan members. Since this arrangement is covered by separate legislation, the balance of the RCA and the related pension obligations are not consolidated in the financial statements of the pension plan.
RCA provides for benefits in excess of those permitted under the Income Tax Act restrictions for registered pension plans.
Pursuant to the legislation, transactions pertaining to the RCA, such as contributions, benefits, and interest credits, are recorded in the RCA account, which is maintained within the accounts of Canada. The legislation also requires that the RCA account be credited with interest quarterly at the same rates as those credited to the Superannuation account.
The RCA is registered with the Canada Revenue Agency (CRA), and a transfer is made annually between the RCA account and the CRA either to remit a 50% refundable tax in respect of the net increase in the accounts (contributions and interest credits less payments and other charges) or to receive a 50% tax reimbursement in respect of the net decrease in the accounts (payments and other charges less contributions and interest credits).
| 2024 | 2023 | |
|---|---|---|
| Balance of the accounts | ||
| RCA account | $537 | $515 |
| Refundable tax receivable | 530 | 510 |
| Subtotal | $1,067 | $1,025 |
| Pension obligations | $1,013 | $953 |
| Excess/(Shortfall) of the balance of the account over the pension obligations | $54 | $72 |
The actuarial assumptions used to value the pension obligations pertaining to the RCA account are consistent in all respects with those used for the superannuation account.
| 2024 | 2023 | |
|---|---|---|
| Opening balance | $1,025 | $992 |
| Increase | ||
| Contributions by plan members | 6 | 4 |
| Contributions by employer | 38 | 28 |
| Interest income | 16 | 16 |
| Increase in refundable tax receivable | 20 | 17 |
| Total increase | $80 | $65 |
| Decrease | ||
| Benefits paid | $15 | $14 |
| Refunds and transfers | 3 | 1 |
| Refundable tax remittance | 20 | 17 |
| Total decrease | $38 | $32 |
| Closing balance | $1,067 | $1,025 |
Actuarial shortfalls resulting from a lower balance in the RCA account than the actuarial liabilities are addressed by crediting the RCA account in equal instalments over a period of up to 15 years through special employer contributions based on triennial actuarial valuations for funding purposes, starting in the fiscal year in which the actuarial report is tabled in Parliament.
For the year ended 31 March 2024, no special employer contribution was credited to RCA (no special employer contribution in 2023), since no actuarial shortfalls were identified in the triennial actuarial valuation of the pension plan as at 31 March 2022.
22.Guarantees and indemnities
PSPIB provides indemnification to its directors, its officers, its employees and to certain PSPIB representatives asked to serve as directors or officers of entities in which PSPIB or its investment entity subsidiaries have made an investment or have a financial interest. As a result, but subject to the Public Sector Pension Investment Board Act, PSPIB may be required to indemnify these representatives for costs incurred, such as claims, actions or litigation in connection with the exercise of their duties, unless the liability of such a representative relates to a failure to act honestly and in good faith. To date, PSPIB has not received any claims or made any payment for such indemnities.
In certain cases, PSPIB also provides indemnification to third parties in the normal course of business. As a result, PSPIB may be required to indemnify such third parties in connection with the performance of their contractual obligations. To date, PSPIB has not received any claims nor made any payments for such indemnities.
PSPIB unconditionally and irrevocably guarantees all credit facilities, as well as short-term promissory notes and medium-term notes issued by PSP Capital Inc., as described in Note 9.
In certain investment transactions, PSPIB and its investment entity subsidiaries provided guarantees, indemnifications or issued letters of credit to third parties, the most significant of which are as follows:
- As at 31 March 2024 and 2023, PSPIB and its investment entity subsidiaries agreed to guarantee and, in some cases, provide indemnification for the performance of certain investees under contractual agreements. The majority of these agreements are borrowing arrangements. In the event a default occurs under such agreements, which is of limited recourse in certain cases, PSPIB or its investment entity subsidiaries could assume obligations of up to $2,717 million as at 31 March 2024 (31 March 2023—$2,643 million), of which $519 million has been allocated to the pension plan (31 March 2023—$508 million) plus applicable interest and other related costs. The arrangements mature between May 2024 and June 2042 as of 31 March 2024 (31 March 2023—between June 2023 and June 2042)
- Additionally, PSPIB and its investment entity subsidiaries issued letters of credit totalling $1 million as at 31 March 2024 (31 March 2023—$1 million), of which nil has been allocated to the pension plan (31 March 2023—nil) in relation to investment transactions
23. Commitments
PSPIB and its investment entity subsidiaries have committed to enter into investment transactions, which will be funded over the next several years in accordance with agreed terms and conditions.
| 2024 | 2023 | |
|---|---|---|
| Foreign equity | $1 | $1 |
| Real estate | 737 | 882 |
| Private equity | 2,171 | 2,529 |
| Infrastructure | 762 | 1,136 |
| Natural resources | 92 | 129 |
| Private debt securities | 1,651 | 1,339 |
| Alternative investments | 297 | 394 |
| Total | $5,711 | $6,410 |
Funding in connection with the above commitments can be called upon at various dates extending until 2041 as at 31 March 2024 (31 March 2023—2041).
Financial statements of the Reserve Force Pension Plan for the fiscal year ended 31 March 2024
Statement of Responsibility
Responsibility for the integrity and fairness of the financial statements of the Reserve Force Pension Plan (the pension plan) rests with the management of the Department of National Defence. In support of this responsibility, management has developed and maintained books, records, internal controls and management practices designed to provide reasonable assurance as to the reliability of the financial information and to ensure that transactions are in accordance with the Canadian Forces Superannuation Act (CFSA) and the Reserve Force Pension Plan Regulations made under the CFSA, as well as the Financial Administration Act and its regulations.
The financial statements of the pension plan for the year ended 31 March 2024, have been prepared in accordance with the stated accounting policies set out in Note 2 of the financial statements, which are based on Canadian accounting standards for pension plans, and on a basis consistent with that of the preceding year. The information included in the financial statements is based on management’s best estimates and judgement, with due consideration given to materiality.
Additional information is obtained as required, from the Public Sector Pension Investment Board (PSPIB) to meet accounting and reporting requirements. PSPIB maintains its own systems of financial management and internal controls to account for the funds managed on behalf of the pension plan in accordance with the Public Sector Pension Investment Board Act, regulations and by-laws.
These financial statements have been audited by the Auditor General of Canada, the independent auditor for the Government of Canada.
Approved by:
Original signed by
Stefanie Beck
Deputy Minister
Major General Erick Simoneau
Deputy Commander MILPERSCOM
Ottawa, Canada
Date: 26 February 2025
Independent Auditor’s Report
To the Minister of National Defence
Report on the Audit of the Financial Statements
Opinion
We have audited the financial statements of the Reserve Force Pension Plan (the pension plan), which comprise the statement of financial position as at 31 March 2024, and the statement of changes in net assets available for benefits and statement of changes in pension obligations for the year then ended, and notes to the financial statements, including a summary of significant accounting policies.
In our opinion, the accompanying financial statements present fairly, in all material respects, the financial position of the pension plan as at 31 March 2024, and the changes in its net assets available for benefits and changes in its pension obligations for the year then ended in accordance with Canadian accounting standards for pension plans.
Basis for Opinion
We conducted our audit in accordance with Canadian generally accepted auditing standards. Our responsibilities under those standards are further described in the Auditor’s Responsibilities for the Audit of the Financial Statements section of our report. We are independent of the pension plan in accordance with the ethical requirements that are relevant to our audit of the financial statements in Canada, and we have fulfilled our other ethical responsibilities in accordance with these requirements. We believe that the audit evidence we have obtained is sufficient and appropriate to provide a basis for our opinion.
Other Information
Management is responsible for the other information. The other information comprises the information included in the annual report, but does not include the financial statements and our auditor’s report thereon.
Our opinion on the financial statements does not cover the other information and we do not express any form of assurance conclusion thereon.
In connection with our audit of the financial statements, our responsibility is to read the other information and, in doing so, consider whether the other information is materially inconsistent with the financial statements or our knowledge obtained in the audit, or otherwise appears to be materially misstated. If, based on the work we have performed, we conclude that there is a material misstatement of this other information, we are required to report that fact. We have nothing to report in this regard.
Responsibilities of Management and Those Charged with Governance for the Financial Statements
Management is responsible for the preparation and fair presentation of the financial statements in accordance with the stated accounting policies set out in Note 2 of the financial statements, which are based on Canadian accounting standards for pension plans, and for such internal control as management determines is necessary to enable the preparation of financial statements that are free from material misstatement, whether due to fraud or error.
In preparing the financial statements, management is responsible for assessing the pension plan’s ability to continue as a going concern, disclosing, as applicable, matters related to going concern and using the going concern basis of accounting unless management either intends to liquidate the pension plan or to cease operations, or has no realistic alternative but to do so.
Those charged with governance are responsible for overseeing the pension plan’s financial reporting process.
Auditor’s Responsibilities for the Audit of the Financial Statements
Our objectives are to obtain reasonable assurance about whether the financial statements as a whole are free from material misstatement, whether due to fraud or error, and to issue an auditor’s report that includes our opinion. Reasonable assurance is a high level of assurance, but is not a guarantee that an audit conducted in accordance with Canadian generally accepted auditing standards will always detect a material misstatement when it exists. Misstatements can arise from fraud or error and are considered material if, individually or in the aggregate, they could reasonably be expected to influence the economic decisions of users taken on the basis of these financial statements.
As part of an audit in accordance with Canadian generally accepted auditing standards, we exercise professional judgment and maintain professional skepticism throughout the audit. We also:
- Identify and assess the risks of material misstatement of the financial statements, whether due to fraud or error, design and perform audit procedures responsive to those risks, and obtain audit evidence that is sufficient and appropriate to provide a basis for our opinion. The risk of not detecting a material misstatement resulting from fraud is higher than for one resulting from error, as fraud may involve collusion, forgery, intentional omissions, misrepresentations, or the override of internal control
- Obtain an understanding of internal control relevant to the audit in order to design audit procedures that are appropriate in the circumstances, but not for the purpose of expressing an opinion on the effectiveness of the pension plan’s internal control
- Evaluate the appropriateness of accounting policies used and the reasonableness of accounting estimates and related disclosures made by management
- Conclude on the appropriateness of management’s use of the going concern basis of accounting and, based on the audit evidence obtained, whether a material uncertainty exists related to events or conditions that may cast significant doubt on the pension plan’s ability to continue as a going concern. If we conclude that a material uncertainty exists, we are required to draw attention in our auditor’s report to the related disclosures in the financial statements or, if such disclosures are inadequate, to modify our opinion. Our conclusions are based on the audit evidence obtained up to the date of our auditor’s report. However, future events or conditions may cause the pension plan to cease to continue as a going concern
- Evaluate the overall presentation, structure and content of the financial statements, including the disclosures, and whether the financial statements represent the underlying transactions and events in a manner that achieves fair presentation
- Obtain sufficient appropriate audit evidence regarding the financial information of the entities or business activities within the pension plan to express an opinion on the financial statements. We are responsible for the direction, supervision, and performance of the group audit. We remain solely responsible for our audit opinion
We communicate with those charged with governance regarding, among other matters, the planned scope and timing of the audit and significant audit findings, including any significant deficiencies in internal control that we identify during our audit.
Report on Compliance with Specified Authorities
Opinion
In conjunction with the audit of the financial statements, we have audited transactions of the Reserve Force Pension Plan coming to our notice for compliance with specified authorities. The specified authorities against which compliance was audited are the Canadian Forces Superannuation Act, the Reserve Force Pension Plan Regulations, the Public Sector Pension Investment Board Act and regulations, and the by-laws of the Public Sector Pension Investment Board.
In our opinion, the transactions of the Reserve Force Pension Plan that came to our notice during the audit of the financial statements have complied, in all material respects, with the specified authorities referred to above.
Responsibilities of Management for Compliance with Specified Authorities
Management is responsible for the Reserve Force Pension Plan’s compliance with the specified authorities named above, and for such internal control as management determines is necessary to enable the Reserve Force Pension Plan to comply with the specified authorities.
Auditor’s Responsibilities for the Audit of Compliance with Specified Authorities
Our audit responsibilities include planning and performing procedures to provide an audit opinion and reporting on whether the transactions coming to our notice during the audit of the financial statements are in compliance with the specified authorities referred to above.
Original signed by
Original signed by
Mimma Venema, CPA, CA, CGA
Principal
for the Auditor General of Canada
Ottawa, Canada
26 February 2025
RFPP Financial Statements
| As at 31 March 2024 | As at 31 March 2023 | |
|---|---|---|
| Assets | ||
| Investments (Note 5) | $1,233,276 | $1,170,828 |
| Contributions receivable | ||
| From plan members (Note 8) | 9,644 | 12,684 |
| From employer (Note 8) | 9,644 | 12,684 |
| Other assets | 792 | 762 |
| Total assets | $1,253,356 | $1,196,958 |
| Liabilities | ||
| Reserve Force Pension Fund (Note 4) | $109,371 | $124,905 |
| Investment-related liabilities (Note 5) | 44,036 | 64,921 |
| Borrowings (Note 5 and Note 9) | 110,053 | 99,322 |
| Due to Canadian Forces Pension Plan (Note 4) | 59,000 | 61,000 |
| Accounts payable and other liabilities | 2,041 | 2,160 |
| Total Liabilities | $324,501 | $352,308 |
| Net assets available for benefits | $928,855 | $844,650 |
| Pension obligations (Note 12) | $755,595 | $963,617 |
| Surplus/(Deficit) to be financed by the Government of Canada (Note 13) | $173,260 | $(118,967) |
|
Commitments (Note 21) The accompanying notes are an integral part of these financial statements |
||
| 2024 | 2023 | |
|---|---|---|
| Net assets available for benefits, beginning of year | $844,650 | $806,836 |
| Increase in net assets available for benefits | ||
| Investment income, excluding changes in fair values of investment assets and investment liabilities (Note 14) | 32,674 | 27,212 |
| Changes in fair values of investment assets and investment liabilities, realized and unrealized gains (Note 14) | 50,874 | 23,123 |
| Contributions | ||
| From plan members (Note 15) | 25,396 | 22,143 |
| From employer (Note 15) | 60,113 | 54,074 |
| Special employer contribution for actuarial deficit (Note 16) | 4,100 | 17,400 |
| Change (decrease) in amount due to Canadian Forces Pension Plan | 2,000 | 12,400 |
| Total increase in net assets available for benefits | $175,157 | $156,352 |
| Decrease in net assets available for benefits | ||
| Benefits paid (Note 17) | 15,064 | 13,290 |
| Refunds and transfers (Note 17) | 58,288 | 90,764 |
| Investment-related expenses (Note 18) | 7,904 | 5,074 |
| Administrative expenses (Note 19) | 9,696 | 9,410 |
| Total decrease in net assets available for benefits | $90,952 | $118,538 |
| Net increase in net assets available for benefits | $84,205 | $37,814 |
| Net assets available for benefits, end of year | $928,855 | $844,650 |
|
Commitments (Note 21) The accompanying notes are an integral part of these financial statements |
||
| 2024 | 2023 | |
|---|---|---|
| Pension obligations, beginning of year | $963,617 | $906,199 |
| Increase in pension obligations | ||
| Interest on pension obligations | 61,148 | 49,493 |
| Benefits earned | 85,000 | 87,000 |
| Experience losses (Note 12) | 0 | 71,038 |
| Cost of new elections | 1,288 | 757 |
| Total increase in pension obligations | $147,436 | $208,288 |
| Decrease in pension obligations | ||
| Benefits paid (Note 17) | $15,064 | $13,290 |
| Experience gains (Note 12) | 191,515 | 0 |
| Change in actuarial assumptions: gains (Note 12) | 83,788 | 40,508 |
| Refunds and transfers (Note 17) | 58,288 | 90,764 |
| Administrative expenses included in the service cost (Note 19) | 6,803 | 6,308 |
| Total decrease in pension obligations | $355,458 | $150,870 |
| Net increase (decrease) in pension obligations | $(208,022) | $57,418 |
| Pension obligations, end of year | $755,595 | $963,617 |
|
The accompanying notes are an integral part of these financial statements. |
||
1. Description of the Reserve Force Pension Plan
The Reserve Force Pension Plan (the pension plan), governed by Part I.1 of the Canadian Forces Superannuation Act (CFSA) and Reserve Force Pension Plan Regulations (RFPP Regulations) made under the CFSA, provides pension benefits for all eligible members of the Reserve Force component of the Canadian Armed Forces. The pension plan was created on 1 March 2007.
The main provisions of the pension plan are summarized below.
(A) General
The pension plan is a contributory defined benefit plan covering eligible members of the Reserve Force as defined in the National Defence Act. Membership in the pension plan is compulsory for all eligible members, excluding those members who have sufficient full-time service to become eligible for membership in the Canadian Forces Pension Plan under Part I of the CFSA. Reserve Force members join the Reserve Force Pension Plan automatically after earning 10% of the Year’s Maximum Pensionable Earnings (YMPE) in two consecutive 12-month periods.
The Government of Canada (the government) is the sole sponsor of the pension plan. The Minister of National Defence is the Minister responsible for the CFSA and its RFPP Regulations. The Department of National Defence is responsible for the management of the pension plan and maintains the books of accounts, while Public Services and Procurement Canada (PSPC) provides the day-to-day administration. The Office of the Chief Actuary (OCA), an independent unit within the Office of the Superintendent of Financial Institutions (OSFI), performs periodic actuarial valuations of the pension plan. Pursuant to the CFSA and the RFPP Regulations, transactions are recorded in the Reserve Force Pension Fund (pension fund). Members were provided with an option to buy back service earned prior to the creation of the pension plan.
While the pension plan matures, an amount equal to contributions in excess of benefit payments and administrative costs is transferred to the Public Sector Pension Investment Board (PSPIB) and invested in capital markets. PSPIB is a Crown corporation whose statutory objectives are to manage the funds transferred to it for investment and to maximize investment returns without undue risk of loss, having regard to the funding, policies and requirements of the public sector pension plans (i.e., public service, Royal Canadian Mounted Police, Canadian Forces and Reserve Force). When the pension plan is mature to a state where benefit payments are greater than incoming contributions, which is the normal state for any mature pension plan, PSPIB will transfer amounts to the Consolidated Revenue Fund (CRF) for benefit payments and administrative costs, or as required under the circumstance of a non-permitted surplus (refer to RFPP Regulations section 86 (3) for definition of non-permitted surplus).
(B) Funding policy
The pension plan is funded from plan member and employer contributions, and from investment earnings. For the fiscal year, plan members of the pension plan with less than 35 years of pensionable service contributed 5.2% (5.2% in 2023) of pensionable earnings up to the maximum of 66 2/3 times the defined benefit limit specified by the Income Tax Act. Plan members with more than 35 years of pensionable service contributed 1% (1% in 2023).
The RFPP Regulations provide that all pension obligations arising from the pension plan be met by the government. The RFPP Regulations require that any actuarial deficit in the pension fund be dealt with by transferring equal instalments to the pension fund over a period of up to 15 years, commencing in the year in which the actuarial report is tabled in Parliament. CFSA also allows any surplus to be lowered by reducing government and plan member contributions. In addition, if there is an amount considered to be a non-permitted surplus related to the pension fund, no further government pension contributions are permitted, while plan member contributions under the pension fund may be reduced and amounts from PSPIB may be transferred to the government’s CRF.
(C) Benefits
The pension plan provides pension benefits to members based on the total pensionable service and total pensionable earnings during the service period. The benefits are determined by a formula set out in the legislation; they are not based on the financial status of the pension plan. The basic benefit formula is 1.5% multiplied by indexed pensionable earnings.
Pension benefits are coordinated with the CPP and QPP and are reduced when the plan member reaches age 65 or earlier if the member receives a disability benefit from the CPP or QPP. The pension reduction factor is 0.7% for members born before 1943, declining gradually for members born from 1943 to 1946 until it reaches 0.625% for members born after 1946. Benefits are fully indexed to the annual increase in the Consumer Price Index. Other benefits include survivor pensions, deferred annuities, annual allowances, transfer values, cash termination allowances or minimum benefits in the event of death, early unreduced retirement pensions, and disability pensions.
2. Significant accounting policies
The significant accounting policies that have been applied in the preparation of these financial statements are summarized below.
(A) Basis of presentation
These financial statements present information on the pension plan on a going-concern basis. They are prepared to assist plan members and others in reviewing the activities of the pension plan for the year, not to portray the funding requirements of the pension plan.
These financial statements are prepared in Canadian dollars, the pension plan’s functional currency, in accordance with the accounting policies stated below, which are based on Canadian accounting standards for pension plans in Part IV of the Chartered Professional Accountants (CPA) Canada Handbook (Section 4600). Section 4600 provides specific accounting guidance on investments and pension obligations. For accounting policies that do not relate to either investments or pension obligations, the pension plan complies with International Financial Reporting Standards (IFRS) in Part I of the CPA Canada Handbook. To the extent that IFRS in Part I are inconsistent with Section 4600, Section 4600 takes precedence. The presentation and results using the stated accounting policies do not result in any significant differences from Canadian accounting standards for pension plans.
PSPIB is a Crown corporation whose statutory objectives are to manage the funds transferred to it for investment and to maximize investment returns without undue risk of loss. PSPIB qualifies as an investment entity as defined under IFRS 10 Consolidated Financial Statements and forms part of the pension plan reporting entity. Pursuant to Section 4600, PSPIB’s subsidiaries that are formed to hold investments or those that provide PSPIB with services that relate to its investment activities are consolidated, since these entities are not considered investment assets. PSPIB’s investment in subsidiaries, associates, and joint ventures that are considered investment assets are measured at fair value in accordance with Section 4600. Financial liabilities are also measured at fair value in accordance with Section 4600.
The financial statements for the year ended 31 March 2024 were authorized for issue by the signatories on 26 February 2025.
(B) Interests in other entities
Management, through the activities of PSPIB, assesses control, joint control and significant influence with respect to the investees disclosed in Note 6 as follows:
(I) Control and significant influence
A subsidiary is an entity which is controlled by PSPIB. PSPIB determines that it controls an investee when it has power over the investee, is exposed, or has rights, to variable returns from its investment in the investee and has the ability to affect those returns through its power over the investee.
An associate is an entity over which PSPIB has significant influence, as in certain cases, PSPIB does not have control over an investee but has the power to participate in the financial and operating policy decisions of the investee. In such cases, PSPIB determines that it has significant influence over the investee.
In the context of control or significant influence, power over an investee is obtained through voting rights conveyed by PSPIB ownership interest, other contractual arrangements, or a combination thereof.
(II) Joint control
PSPIB determines that it is party to a joint venture arrangement when it has joint control over an investee and has rights to the net assets of the investee. Such investees are reported as jointly controlled. Joint control is established through a contractual arrangement which requires the unanimous consent of the parties sharing control for the activities that significantly affect the returns of the arrangement.
Generally, decision-making regarding such activities is governed through voting rights conveyed by the ownership interest of each party. In certain cases, it is governed solely through contractual arrangements or in conjunction with the ownership interest of each party.
(C) Financial instruments
(I) Classification
Financial assets representing investments are managed, together with related financial liabilities, according to the entity’s business model to maximize the rate of return. The performance of such financial instruments is evaluated on a fair value basis and they are classified at fair value through profit or loss (FVTPL). They are described in detail in Note 5(A).
Borrowings, as described under Note 9, are financial liabilities that are designated to be measured at FVTPL since they are part of the portfolios of investments that are managed together and whose performance is evaluated on a fair value basis.
(II) Recognition
Financial assets and financial liabilities are recorded at the date upon which PSPIB becomes a party to the associated contractual provisions. In the case of traded financial assets, they are recorded as of the trade date.
(III) Initial and subsequent measurement
All financial assets and financial liabilities are recorded in the statement of financial position at fair value and continue to be measured as such on a recurring basis. After initial measurement, subsequent changes in the fair value of financial assets and financial liabilities classified at FVTPL are recorded in the statement of changes in net assets available for benefits.
(IV) Derecognition
A financial asset (or, where applicable, a part thereof) is derecognized when the following conditions are met:
- The rights to receive cash flows from the asset have expired, or
- PSPIB has transferred its rights to receive cash flows from the asset or has assumed an obligation to pay the received cash flows to a third party, and
- PSPIB has transferred substantially all the risks and rewards of the asset, or
- In cases where PSPIB has neither transferred nor retained substantially all the risks and rewards of the asset, it has transferred control of the asset
A financial liability is derecognized when the obligation under the liability is discharged, cancelled or expired.
(D) Determination of fair value
Fair value is the price that would be received to sell an asset or paid to transfer a liability in an orderly transaction between market participants at the measurement date.
At initial recognition, PSPIB evaluates the facts and circumstances related to a transaction to confirm that the transaction price represents the fair value of an asset or a liability. At each subsequent reporting date, market prices are used to determine fair value where an active market exists (such as a recognized securities exchange), as they reflect actual and regularly occurring market transactions on an arm’s length basis. If quoted market prices are not available, then fair value is estimated using valuation techniques based on inputs existing at the end of the reporting period that are derived from observable market data.
Valuation techniques are generally applied to investments in private markets, alternative investments, over-the-counter (OTC) derivatives and certain fixed income securities. The values derived from applying these techniques are impacted by the choice of valuation model and the underlying assumptions made concerning factors such as the amounts and timing of future cash flows, discount rates, volatility and credit risk. In certain cases, such assumptions are not supported by market observable data.
The determination of fair value of all financial assets and financial liabilities is described in Note 5.
(E) Foreign currency translation
Foreign currency transactions during the period, including purchases and sales of securities, income and expenses are translated at the rate of exchange prevailing on the date of the transaction.
Monetary assets and liabilities that are denominated in foreign currencies are translated at the functional currency rate of exchange prevailing at the end of the reporting period.
Foreign currency transaction gains and losses on all monetary assets and liabilities are included in investment income.
(F) Securities lending and securities borrowing and related collateral
PSPIB participates in securities lending and borrowing programs whereby it lends and borrows securities in order to enhance portfolio returns. Lending and borrowing transactions including related collateral under such programs do not transfer the risks or rewards of ownership of the securities to the counterparty. Consequently, PSPIB does not derecognize securities lent or pledged as collateral, or recognize securities borrowed or received as collateral. Cash amounts received are recognized as described in Note 5(A) (IX).
The securities lending and borrowing programs require collateral in cash, high-quality debt instruments or securities. Collateral transactions are conducted under terms that are usual and customary in standard securities lending and borrowing programs. PSPIB and its counterparties are authorized to sell, repledge or otherwise use collateral held. The same securities or equivalent securities must be returned to the counterparty at the end of the contract, unless an event of default occurs.
(G) Securities sold under repurchase agreements and purchased under reverse repurchase agreements and related collateral
PSPIB is party to repurchase and reverse repurchase agreements. Such agreements involve the sale of securities by one counterparty with a simultaneous agreement to repurchase such securities at a specified price and at a specified future date.
Securities sold or purchased under the repurchase and reverse repurchase agreements respectively, including related collateral, are not derecognized or recognized as all risks and rewards of ownership related to such securities are not transferred. As such, in the case where PSPIB is the counterparty selling securities under such agreements, all income (loss) related to such securities continues to be reported in investment income, and obligations to repurchase the securities sold are accounted for as investment-related liabilities.
The difference between the fair value of the securities sold and the repurchase price is recorded as interest expense within investment-related expenses. In the case where PSPIB is the counterparty purchasing securities under such agreements, no income (loss) related to such securities is recognized, and obligations to resell the securities are accounted for as investment-related receivables. The difference between the fair value of the securities purchased and resale price is recorded in investment income.
Transactions under repurchase and reverse repurchase agreements involve pledging collateral consisting of cash or securities deemed acceptable by the counterparties. Collateral transactions are conducted under terms that are usual and customary in standard repurchase arrangements. Such terms require the relevant counterparty to pledge additional collateral based on the changes in the fair value of the existing collateral pledged, as well as the related securities sold or purchased. The counterparties are authorized to sell, repledge or otherwise use collateral held. The securities pledged as collateral must be returned to the relevant counterparty at the end of the contract, unless an event of default occurs.
(H) Offsetting of financial instruments
Financial assets and financial liabilities are offset with the net amount reported in the statement of financial position only if PSPIB has a current legally enforceable right to offset the recognized amounts and the intent to settle on a net basis, or to realize the assets and settle the liabilities simultaneously.
(I) Pension obligations
The present value of accrued pension benefits is calculated by OCA on behalf of the plan sponsor, the government, by using the projected benefit method up to termination or retirement, based on management’s best estimate assumptions including streamed expected rates of return on invested funds.
(J)Investment income
Investment income is made up of interest, dividends, gains (losses) on the disposal of financial assets and financial liabilities as well as gains (losses) which reflect the change in unrealized appreciation (depreciation) of financial assets held and financial liabilities outstanding at the end of the reporting period. Interest is recognized, on a consistent basis, using the prescribed rates until maturity. Dividends are recognized when the right to receive them has been obtained, generally on the ex-dividend date.
(K) Contributions
Contributions for current service are recorded in the year in which the related payroll costs are incurred. Contributions for past service that are receivable over a period in excess of one year are recorded at the estimated net present value of the contributions to be received.
(L) Benefits earned, benefits paid, and refunds and transfers
Benefits earned are accrued as employees render pensionable services.
The benefits paid are recognized as a reduction of pension obligations when the payments are made. The benefits paid are recognized as a reduction of net assets available for benefits when the payments are made.
Benefit payments, refunds to former members and transfer payments to other plans are recorded in the period in which they are paid.
(M) Investment-related expenses
Investment-related expenses are made up of interest expense, transaction costs, external investment management fees and other (net).
Transaction costs are incremental costs directly attributable to the acquisition, due diligence, issue, or disposal of a financial asset or financial liability, and they are expensed as incurred.
External investment management fees are directly attributable to the external management of assets on behalf of PSPIB. These fees are paid directly by PSPIB and comprise base fees accrued as a percentage of the fair value of the assets managed externally and performance fees accrued as a function of various performance indicators. This excludes amounts not paid directly by PSPIB for certain pooled fund investments classified under alternative investments and for investments in private markets as outlined in Note 18.
(N) Significant accounting judgments, estimates and assumptions
In preparing the financial statements, management makes certain judgments, estimates and assumptions that can affect the amounts reported therein. Significant judgments include those related to the determination of the investment entity status of PSPIB as described in Note 2(A).
Management also makes estimates and assumptions in the measurement, risk assessment and related disclosures surrounding investments in private markets, certain fixed income securities and the pension obligations.
The main assumptions made by management regarding measurement of financial instruments are outlined in Note 5(C) (III), and those regarding the assessment of risk are outlined in Note 7.
The pension obligations are actuarially determined, and the actual experience may differ significantly from the assumptions used in the calculation of the pension obligations. The significant actuarial assumptions used in measuring the pension obligations are found in Note 12.
The economic environment continues to be subject to global uncertainty and heightened geopolitical tensions, which could impact the actuarial assumptions used to measure the present value of the pension obligations and the market value of PSPIB’s portfolio. The pension obligations and the investments held by PSPIB, as at 31 March 2024, as well as the return on investments for the year, reflect the impacts resulting from these events to the extent known and estimable at the reporting date.
Although assumptions reflect management’s best estimates actual results may differ from such estimates due to the uncertainties involved in using them.
(3) Current and future changes in accounting standards
Management has determined that there is no anticipated material impact on the financial statements arising from new standards, amendments and interpretations that have been issued by the IASB but that are not yet effective.
(4) Reserve Force Pension Fund
The government has a statutory obligation to pay benefits relating to the pension plan. This pension obligation is to plan members and their beneficiaries.
In 1999, the pension legislation was amended to allow the government to invest funds in order to provide for the pension obligation. This legislation created the PSPIB to manage and invest amounts that are transferred regularly to it from the CRF. The transactions are recorded in the Reserve Force Pension Fund. The Reserve Force Pension Fund is a flow-through account. PSPIB investment assets and investment-related liabilities are reflected directly in the pension plan’s financial statements. At year end, the balance in the Reserve Force Pension Fund represents net contributions transferable to the PSPIB, and would also reflect any incoming transfers amounts transferred from the PSPIB. PSPIB investment assets and investment related liabilities are reflected directly in the pension plan’s financial statements.
Related Party—Canadian Forces Pension Plan
The Reserve Force Pension Plan (RFPP) is related, through common legislation (the CFSA), to the Canadian Forces Pension Plan (CFPP). Transactions with the CFPP related to member service and contributions are considered to be in the normal course of operations, in accordance with section 83 of the RFPP Regulations, and are recorded at the exchange amount as required by that section.
Members of the RFPP are automatically eligible for inclusion in the CFPP when an eligibility threshold of 55 months of full-time service in a 60-month period is reached. Once qualified, the present value of service accumulated under the RFPP is calculated and transferred to the CFPP; however a timing difference exists between when the amounts become eligible for a transfer and when the transfer occurs. The value of these assets will continue to be reassessed every year by OCA to factor in any changes to the actuarial assumptions.
For the year ended 31 March 2024, $45,208 thousand (2023—$75,002 thousand) was transferred between the fund accounts. The value of the pensionable service due between the two pension plans has been estimated at 31 March 2024 to be $59,000 thousand (2023—$61,000 thousand).
(5) Financial assets and financial liabilities
(A)Classes of financial assets and financial liabilities
Financial assets and financial liabilities are aggregated in the following table, in classes that reflect their respective exposure as well as in investment sectors.
| 2024 | 2023 | |
|---|---|---|
| Investments | ||
| Public markets | ||
| Canadian equity | $11,416 | $18,520 |
| Foreign equity | 171,189 | 145,785 |
| Private markets | ||
| Real estate | 151,627 | 169,971 |
| Private equity | 161,419 | 148,336 |
| Infrastructure | 166,314 | 148,525 |
| Natural resources | 88,629 | 77,095 |
| Fixed income | ||
| Cash and cash equivalentstable 54 note 1 | 14,451 | 28,911 |
| Money market securitiestable 54 note 1 | 34,505 | 34,442 |
| Government and corporate bonds | 109,882 | 95,915 |
| Inflation-linked bonds | 73,216 | 47,251 |
| Private debt securities | 121,498 | 125,433 |
| Alternative investments | 105,413 | 102,847 |
| Total investments | $1,209,559 | $1,143,031 |
| Investment-related assets | ||
| Amounts receivable from pending trades | $5,189 | $10,497 |
| Interest receivable | 2,571 | 2,073 |
| Dividends receivable | 1,101 | 860 |
| Securities purchased under reverse repurchase agreements | 9,333 | 5,282 |
| Derivative-related assets | 5,523 | 9,085 |
| Total investment-related assets | $23,717 | $27,797 |
| Investments representing financial assets at FVTPLtable 54 note 2 | $1,233,276 | $1,170,828 |
| Investment-related liabilities | ||
| Amounts payable from pending trades | $(2,203) | $(4,455) |
| Interest payable | (673) | (481) |
| Securities sold short | (13,087) | (10,308) |
| Collateral payable | (2,725) | (3,954) |
| Securities sold under repurchase agreements | (21,361) | (38,970) |
| Derivative-related liabilities | (3,987) | (6,753) |
| Investment-related liabilities representing financial liabilities at FVTPL | $(44,036) | $(64,921) |
| Borrowings | ||
| Capital market debt financing | $(110,053) | $(99,322) |
| Borrowings representing financial liabilities designated at FVTPL | $(110,053) | $(99,322) |
| Net investments | $1,079,187 | $ 1,006,585 |
Table 54 Notes
|
||
(I) Public markets
Public markets consist of Canadian and foreign investments in the following securities: common shares, American depository receipts, global depository receipts, participation notes, preferred shares, income trust units, exchange traded funds units, pooled funds units, and securities convertible into common shares of publicly listed issuers.
Valuation techniques
Direct investments in Canadian and foreign equities are measured at fair value using quoted prices in active markets and are based on the most representative price within the bid-ask spread.
In the case of investments in pooled funds, fair value is measured using unit values obtained from each of the funds’ administrators, which are derived from the fair value of the underlying investments in each pooled fund. PSPIB reviews the fair value received, and where necessary, the impact of restrictions on the sale or redemption of such investments is taken into consideration.
(II) Private markets
Private markets consist of investments in real estate, private equity, infrastructure, and natural resources.
Real estate investments are comprised of direct equity positions in various private entities, fund investments, as well as properties in the real estate sector. Real estate investments focus on partnerships, companies, and properties operating mainly in the retirement and residential, office, retail and industrial sectors, as well as private funds invested in real estate assets. Real estate investments are presented net of all third-party financing.
Private equity investments are comprised of fund investments with similar objectives, co-investments in private entities, as well as direct equity positions.
Infrastructure investments are comprised of direct equity positions, fund investments and co-investments in various private entities. Infrastructure investments focus on entities engaged in the management, ownership or operation of assets in energy, transportation and other regulated businesses. Infrastructure investments are presented net of all third-party financing.
Natural resources investments are comprised of direct equity positions, fund investments and co-investments in various private entities. Natural resources investments focus on entities engaged in the management, ownership or operation of assets in timberlands, agriculture and upstream oil and gas. Natural resources investments are presented net of all third-party financing.
Valuation techniques
The process for fair value measurement of private markets investments is described in Note 5(C) (II) and the valuation techniques, together with the significant inputs used, are described in Note 5(C) (III).
(III) Fixed income
(i) Cash and cash equivalents
Cash includes demand deposits with financial institutions.
Cash equivalents include treasury bills, certificates of deposit, bankers’ acceptances and other fixed-income securities with maturities of 90 days or less that are held to meet short-term financial commitments. Such instruments are readily convertible into known amounts of cash and have an insignificant risk of change in value
(i) Money market securities, bonds and private debt securities
Fixed income consists of money market securities, government and corporate bonds, inflation-linked bonds and private debt securities. Money market securities include instruments having a maximum term to maturity of one year, such as treasury bills, certificates of deposit and bankers’ acceptances.
Government and corporate bonds include Canadian and foreign, federal, provincial, territorial and municipal bonds, floating rate notes, asset-backed term notes and mortgage-backed securities. Inflation-linked bonds are fixed income securities that earn inflation-adjusted returns.
Private debt securities are fixed income securities of private companies held directly or through private funds. Such debt securities take the form of senior debt, mezzanine and distressed debt and primary and secondary investments in leveraged loans. Private debt securities also include third-party loans such as junior and senior debts, construction loans, bridge loans, income-participating loans, as well as other structured finance products in the real estate sector.
Valuation techniques
Treasury bills are valued based on prices obtained from third-party pricing sources. Such prices are determined using the most representative price within a spread of dealer quotations. Certificates of deposit and bankers’ acceptances are recorded at cost plus accrued interest, which approximates their fair value given their short-term nature.
Fair values of government and most corporate bonds, inflation-linked bonds and mortgage-backed securities are based on prices obtained from third-party pricing sources. Such prices are determined using either an appropriate interest rate curve with a spread associated with the credit quality of the issuer or other generally accepted pricing methodologies.
The fair values of certain corporate bonds, private debt securities and asset-backed term notes are determined using valuation techniques. Such techniques, together with the significant inputs used, are described in Note 5(C) (III).
The fair value measurement of fund investments included as part of private debt securities is described in Note 5(C) (II).
(IV) Alternative investments
Alternative investments consist mainly of units of funds that hold a mix of equity, fixed income and derivative instruments, as well as hedge funds.
Valuation techniques
The fair value of these investments is determined based on the fair values reported by the funds’ administrators or general partners and reflects the fair value of the underlying equity, fixed income or derivative instruments, as applicable. PSPIB reviews the fair value received and, where necessary, the impact of restrictions on the sale or redemption of such investments is taken into consideration.
(V) Amounts receivable and payable from pending trades
Amounts receivable from pending trades consist of proceeds on sales of investments, excluding derivative financial instruments, which have been traded but remain unsettled at the end of the reporting period.
Amounts payable from pending trades consist of the cost of purchases of investments, excluding derivative financial instruments, which have been traded but remain unsettled at the end of the reporting period.
Valuation techniques
The fair value of amounts receivable and payable from pending trades reflects the value at which their underlying original sale or purchase transactions were undertaken.
(VI) Interest and dividends receivable
Interest and dividends are recorded at the amounts expected to be received at the end of the reporting period, which due to their short-term maturity, approximates fair value.
(VII) Interest payable
With respect to the borrowings described in Note 5(A) (XI), interest is accrued at the amount expected to be paid at the end of the reporting period, which approximates fair value.
(VIII) Securities sold short
Securities sold short reflect PSPIB’s obligation to purchase securities pursuant to short selling transactions. In such transactions, PSPIB sells securities it does not own with an obligation to purchase similar securities on the market to cover its position.
Valuation techniques
Using quoted market prices that are based on the most representative price within the bid-ask spread, the fair value of securities sold short is measured using the same method as the similar long positions presented within public markets and fixed income.
(IX) Collateral payable
As part of securities lending and certain OTC derivative transactions, when cash is received, it is recognized as collateral payable. The payable balance reflects the obligation of the transferee to return the amount to the transferor at the end of the transaction in the absence of an event of default by the transferor.
(X) Securities sold under repurchase agreements and purchased under reverse repurchase agreements
As described in Note 2(G), PSPIB is party to repurchase and reverse repurchase agreements.
Valuation techniques
Obligations to repurchase or resell the securities sold or purchased under such agreements are recorded at cost plus accrued interest, which due to their short-term maturity approximates fair value.
(XI) Borrowings under the capital market debt program
PSPIB’s capital market debt program is described in Note 9(B).
Valuation techniques
Short-term promissory notes are recorded at cost plus accrued interest, which due to their short-term maturity approximates fair value. The fair value of PSPIB’s medium-term notes is based on prices that are obtained from third-party pricing sources. Such prices are determined using an interest rate curve with a spread consistent with PSPIB’s credit quality.
(B) Derivative-related assets and liabilities
Derivative financial instruments are financial contracts that are settled at a future date. The value of such instruments is derived from changes in the value of the underlying assets, interest or exchange rates. Derivative financial instruments do not, typically, require an initial net investment. In certain cases, they require an initial net investment that is less than what would be required to hold the underlying position directly. Derivative financial instruments can be listed or traded OTC. OTC instruments consist of those that are bilaterally negotiated and settled, and those that are cleared (OTC-cleared) by a central clearing party (CCP).
PSPIB uses derivative financial instruments to enhance returns or to replicate investments synthetically. Derivatives are also used to reduce the risk associated with existing investments.
PSPIB uses the following types of derivative financial instruments:
(I) Swaps
Swaps are transactions whereby two counterparties exchange cash flow streams with each other based on predetermined conditions that include a notional amount and a term. Swaps are used to increase returns or to adjust exposures of certain assets without directly purchasing or selling the underlying assets.
(II) Futures
Futures are standardized contracts to take or make delivery of an asset (buy or sell) at a predefined price and predefined future date. Futures are used to adjust exposures to specified assets without directly purchasing or selling the underlying assets.
(III) Forwards
Forwards are contracts involving the sale by one party and the purchase by another party of a predefined amount of an underlying instrument, at a predefined price and at a predefined date in the future. Forwards are used to adjust exposures to specified assets without directly purchasing or selling the underlying assets.
(IV) Options
Options are contracts where the seller gives the purchaser the right, but not the obligation, to buy or sell a given amount of an underlying security, index, commodity, currency, interest rate, credit or other financial instrument, at an agreed-upon price stipulated in advance, either at a determined date or at any time before the predefined maturity date.
(V) Warrants and rights
Warrants are options to purchase an underlying asset which is in the form of a transferable security and which can be listed on an exchange or traded OTC.
Rights are securities giving shareholders entitlement to purchase new shares issued by a corporation at a predetermined price (normally less than the current market price) in proportion to the number of shares already owned. Rights are issued only for a short period of time, after which they expire.
Valuation techniques
(i) Determination of fair value of derivative financial instruments
Listed derivative financial instruments are recorded at fair value using quoted market prices that are based on the most representative price within the bid-ask spread. OTC-cleared derivatives are recorded at fair value using prices obtained from the CCP. OTC derivatives are valued using appropriate valuation techniques such as discounted cash flows. These techniques use significant inputs that are observable in the market such as current market yields.
(ii)Notional values and fair values of derivative-related assets and liabilities
Notional values of derivative financial instruments are not recorded as assets or liabilities as they represent the face amount of the contract. Except for credit derivatives, notional values do not represent the potential gain or loss associated with the market or credit risk of such transactions disclosed below. Rather, they serve as the basis upon which the cash flows and the fair value of the contracts are determined.
| 2024 | 2023 | |||||
|---|---|---|---|---|---|---|
| Notional Value | Fair Value | Notional Value | Fair Value | |||
| Assets | Liabilities | Assets | Liabilities | |||
| Equity and commodity derivatives | ||||||
| Listed | ||||||
| Futures | $22,860 | $0 | $0 | $15,242 | $0 | $0 |
| Warrants and rights | 0 | 4 | 0 | 4 | 9 | 0 |
| Options: Purchased | 648 | 0 | 0 | 3,762 | 120 | 0 |
| Written | 0 | 0 | 0 | 4,933 | 0 | (49) |
| OTC | ||||||
| Swaps | 90,816 | 2,013 | (865) | 85,461 | 2,720 | (941) |
| Options: Purchased | 0 | 0 | 0 | 349 | 0 | 0 |
| Currency derivatives | ||||||
| Listed | ||||||
| Futures | 1,542 | 0 | 0 | 948 | 0 | 0 |
| OTC | ||||||
| Forwards | 238,805 | 888 | (1,398) | 443,932 | 2,906 | (3,465) |
| Swaps | 5,032 | 0 | (138) | 14,724 | 366 | (136) |
| Options: Purchased | 3,721 | 22 | 0 | 8,512 | 38 | 0 |
| Written | 4,315 | 0 | (17) | 11,001 | 0 | (34) |
| Interest rate derivatives | ||||||
| Listed | ||||||
| Futures | 44,384 | 0 | 0 | 9,089 | 0 | 0 |
| Options: Purchased | 169,516 | 73 | 0 | 200,451 | 31 | 0 |
| Written | 176,129 | 0 | (67) | 183,600 | 0 | (29) |
| OTC | ||||||
| Forwards | 3,264 | 0 | (15) | 5,851 | 51 | (17) |
| Swaps | 9,966 | 22 | (88) | 14,379 | 135 | (55) |
| Options: Purchased | 218,645 | 2,435 | 0 | 271,117 | 2,649 | 0 |
| Written | 284,094 | 0 | (1,330) | 316,470 | 0 | (1,983) |
| OTC-cleared | ||||||
| Swaps | 268,651 | 0 | 0 | 334,165 | 0 | 0 |
| Credit derivatives | ||||||
| OTC | ||||||
| Credit default swaps: | ||||||
| Purchased | 2,539 | 0 | (69) | 2,320 | 0 | (44) |
| Writtentable 55 note 1 | 8,154 | 66 | 0 | 4,982 | 60 | 0 |
| OTC-cleared | ||||||
| Credit default swaps: | ||||||
| Purchased | 12,063 | 0 | 0 | 8,349 | 0 | 0 |
| Total | - | $5,523 | $(3,987) | - | $9,085 | $(6,753) |
Table 55 Note
|
||||||
| 2024 | 2023 | |||||
|---|---|---|---|---|---|---|
| Notional Value | Fair Value | Notional Value | Fair Value | |||
| Assets | Liabilities | Assets | Liabilities | |||
| Listed derivatives | $415,079 | $77 | $(67) | $418,029 | $160 | $(78) |
| OTC derivatives | 869,351 | 5,446 | (3,920) | 1,179,098 | 8,925 | (6,675) |
| OTC-cleared derivatives | 280,714 | 0 | 0 | 342,514 | 0 | 0 |
| Total | $5,523 | $(3,987) | $9,085 | $(6,753) | ||
| 2024 | 2023 | |
|---|---|---|
| Less than 3 months | $702,791 | $948,859 |
| 3 to 12 months | 460,007 | 615,459 |
| Over 1 year | 402,346 | 375,323 |
(C) Fair value hierarchy
(I) Classification
Financial assets and financial liabilities described under Note 5(A) are classified within the fair value hierarchy, described as follows, based on the lowest level of input that is significant to the fair value measurement as a whole.
- Level 1 inputs are quoted prices (unadjusted) in active markets for identical assets or liabilities that PSPIB can access at the end of the reporting period
- Level 2 inputs are inputs other than quoted prices included within Level 1 that are observable for the asset or the liability, either directly or indirectly. Level 2 inputs include:
- quoted prices for similar assets or liabilities in active markets
- quoted prices for identical or similar assets or liabilities in markets that are not active
- inputs other than quoted prices that are observable for the asset or liability
- market-corroborated inputs
- Level 3 inputs are unobservable inputs for the asset or liability that are used within model-based techniques. They reflect PSPIB’s assessment of the assumptions that market participants would use in pricing the assets or liabilities
The classification within the levels of the hierarchy is established at the time of the initial determination of fair value of the asset or liability and reviewed at the end of each reporting period. PSPIB determines whether a transfer between levels has occurred and recognizes such transfers at the beginning of the reporting period.
| Level 1 | Level 2 | Level 3 | Total Fair Value | |
|---|---|---|---|---|
| Investments | ||||
| Public markets | ||||
| Canadian equity | $3,941 | $7,475 | $0 | $11,416 |
| Foreign equity | 159,567 | 2,084 | 9,538 | 171,189 |
| Private markets | ||||
| Real estate | 0 | 0 | 151,627 | 151,627 |
| Private equity | 0 | 0 | 161,419 | 161,419 |
| Infrastructure | 0 | 0 | 166,314 | 166,314 |
| Natural resources | 0 | 0 | 88,629 | 88,629 |
| Fixed income | ||||
| Cash and cash equivalents | 5,471 | 8,980 | 0 | 14,451 |
| Money market securities | 31,729 | 2,776 | 0 | 34,505 |
| Government and corporate bonds | 28,354 | 81,517 | 11 | 109,882 |
| Inflation-linked bonds | 72,771 | 445 | 0 | 73,216 |
| Private debt securities | 0 | 0 | 121,498 | 121,498 |
| Alternative investments | 0 | 64,660 | 40,753 | 105,413 |
| Total investments | $301,833 | $167,937 | $739,789 | $1,209,559 |
| Investment-related assets | ||||
| Amounts receivable from pending trades | $0 | $5,189 | $0 | $5,189 |
| Interest receivable | 0 | 2,571 | 0 | 2,571 |
| Dividends receivable | 0 | 1,101 | 0 | 1,101 |
| Securities purchased under reverse repurchase agreements | 0 | 9,333 | 0 | 9,333 |
| Derivative-related assets | 77 | 5,446 | 0 | 5,523 |
| Total investment-related assets | $77 | $23,640 | $0 | $23,717 |
| Investments representing financial assets at FVTPL | $301,910 | $191,577 | $739,789 | $1,233,276 |
| Investment-related liabilities | ||||
| Amounts payable from pending trades | $0 | $(2,203) | $0 | $(2,203) |
| Interest payable | 0 | (673) | 0 | (673) |
| Securities sold short | (13,087) | 0 | 0 | (13,087) |
| Collateral payable | 0 | (2,725) | 0 | (2,725) |
| Securities sold under repurchase agreements | 0 | (21,361) | 0 | (21,361) |
| Derivative-related liabilities | (67) | (3,920) | 0 | (3,987) |
| Investment-related liabilities representing financial liabilities at FVTPL | $(13,154) | $(30,882) | $0 | $(44,036) |
| Borrowings | ||||
| Capital market debt financing | $0 | $(110,053) | $0 | $(110,053) |
| Borrowings representing financial liabilities designated at FVTPL | $0 | $(110,053) | $0 | $(110,053) |
| Net investments | $288,756 | $50,642 | $739,789 | $1,079,187 |
| Level 1 | Level 2 | Level 3 | Total Fair Value | |
|---|---|---|---|---|
| Investments | ||||
| Public markets | ||||
| Canadian equity | $11,375 | $7,145 | $0 | $18,520 |
| Foreign equity | 137,468 | 4,265 | 4,052 | 145,785 |
| Private markets | ||||
| Real estate | 0 | 0 | 169,971 | 169,971 |
| Private equity | 0 | 0 | 148,336 | 148,336 |
| Infrastructure | 0 | 0 | 148,525 | 148,525 |
| Natural resources | 0 | 0 | 77,095 | 77,095 |
| Fixed income | ||||
| Cash and cash equivalentstable 59 note 1 | 13,638 | 15,273 | 0 | 28,911 |
| Money market securitiestable 59 note 1 | 31,325 | 3,117 | 0 | 34,442 |
| Government and corporate bonds | 33,573 | 62,331 | 11 | 95,915 |
| Inflation-linked bonds | 47,250 | 1 | 0 | 47,251 |
| Private debt securities | 0 | 0 | 125,433 | 125,433 |
| Alternative investments | 0 | 63,630 | 39,217 | 102,847 |
| Total investments | $274,629 | $155,762 | $712,640 | $1,143,031 |
| Investment-related assets | ||||
| Amounts receivable from pending trades | $0 | $10,497 | $0 | $10,497 |
| Interest receivable | 0 | 2,073 | 0 | 2,073 |
| Dividends receivable | 0 | 860 | 0 | 860 |
| Securities purchased under reverse repurchase agreements | 0 | 5,282 | 0 | 5,282 |
| Derivative-related assets | 160 | 8,925 | 0 | 9,085 |
| Total investment-related assets | $160 | $27,637 | $0 | $27,797 |
| Investments representing financial assets at FVTPL | $274,789 | $183,399 | $712,640 | $1,170,828 |
| Investment-related liabilities | ||||
| Amounts payable from pending trades | $0 | $(4,455) | $0 | $(4,455) |
| Interest payable | 0 | (481) | 0 | (481) |
| Securities sold short | (9,638) | (670) | 0 | (10,308) |
| Collateral payable | 0 | (3,954) | 0 | (3,954) |
| Securities sold under repurchase agreements | 0 | (38,970) | 0 | (38,970) |
| Derivative-related liabilities | (78) | (6,675) | 0 | (6,753) |
| Investment-related liabilities representing financial liabilities at FVTPL | $(9,716) | $(55,205) | $0 | $(64,921) |
| Borrowings | ||||
| Capital market debt financing | $0 | $(99,322) | $0 | $(99,322) |
| Borrowings representing financial liabilities designated at FVTPL | $0 | $(99,322) | $0 | $(99,322) |
| Net investments | $265,073 | $28,872 | $712,640 | $1,006,585 |
Table 59 Note
|
||||
As at 31 March 2023, foreign equity securities with a fair value of $138 thousand were indirectly held and classified as Level 2. During the year ended 31 March 2024, these securities were transferred to Level 1 as they became directly held by PSPIB.
There were no significant transfers between Level 1 and Level 2 during the year ended 31 March 2023.
(II) Process for Level 3 fair value determination
The valuation process is monitored and governed by an internal valuation committee (VC). This committee is responsible for overseeing all aspects of fair value determination. This includes valuation methodologies and procedures for each type of investment and ensuring they are complied with. Valuation methodologies established are based on widely recognized practices that are consistent with professional appraisal standards. Such standards include, among others, the International Private Equity and Venture Capital Valuation Guidelines, the Canadian Uniform Standards of Professional Appraisal Practice and the Uniform Standards of Professional Appraisal Practice in the United States of America.
For the year ended 31 March 2024, the fair value of investments classified as Level 3 in private markets was determined quarterly and adjusted to reflect the impact of any significant market or investment specific events or circumstances. For the year ended 31 March 2023, such fair value was determined at least semi-annually. For each investment, the relevant valuation methodology is applied consistently over time as appropriate in the prevailing circumstances. The appropriateness of significant changes in valuation methodologies is reviewed by the VC.
In cases where the services of third-party appraisers are used, PSPIB ensures their independence and that the valuation methods used are consistent with professional appraisal standards outlined above. In validating the work performed by appraisers, PSPIB ensures that the assumptions used correspond to financial information and forecasts of the underlying investment.
With respect to fund investments classified as Level 3, the annual fair value is generally determined based on the most recent audited financial statements received from the fund’s general partner. For interim reporting periods, fair value is obtained from information provided by the fund’s administrators and is reviewed by PSPIB to ensure reasonableness and adherence to acceptable industry valuation methods. Where necessary, the impact of restrictions on the sale or redemption of such investments is taken into consideration in determining fair value.
To reflect the impact, where applicable, of significant market movements or other events occurring up to the end of the reporting period, adjustments to private markets and fund investments are made, as appropriate. Such adjustments are based on a number of factors including public market trading comparables, investment-specific characteristics as well as market conditions and uncertainties at that time.
(III) Level 3 significant inputs
| Financial assets | Type of Investment | Fair Value ($thousands) | Significant Valuation Techniques | Significant Unobservable Inputs | Range (Weighted Average) |
|---|---|---|---|---|---|
| Public markets | |||||
| Foreign equity | Direct investments | $9,538 | NAVtable 60 note 1 | n/a | n/a |
| Private markets | |||||
| Real estate | Direct and co-investments | $137,404 | Discounted cash flow (DCF) | Discount ratetable 60 note 2table 60 note 3 | 2.90%-18.00% (7.80%) |
| Terminal capitalization ratetable 60 note 2table 60 note 3 | 3.20%-12.25% (6.08%) | ||||
| Direct capitalization | Capitalization ratetable 60 note 2table 60 note 4 | 2.51% – 10.00% (4.85%) | |||
| Stabilized occupancy ratetable 60 note 4table 60 note 5 | 98.00% – 100.00% (99.57%) | ||||
| Sales comparison approach | Price per square foottable 60 note 4table 60 note 5 | $4.28 – $1,827.48 ($165.83) | |||
| NAVtable 60 note 1 | n/a | n/a | |||
| Transaction price | n/a | n/a | |||
| Fund investments | $14,223 | NAVtable 60 note 1 | n/a | n/a | |
| Other private markets | Direct and co-investments | $305,654 | DCF | Discount ratetable 60 note 2 | 5.19% – 18.50% (9.58%) |
| Market comparables | n/a | n/a | |||
| NAVtable 60 note 1 | n/a | n/a | |||
| Transaction price | n/a | n/a | |||
| Fund Investments | $110,708 | NAVtable 60 note 1 | n/a | n/a | |
| Fixed income | |||||
| Corporate bonds | Asset-backed term notes | $11 | Third-party pricingtable 60 note 1 | n/a | n/a |
| Private debt securities | Direct and co-investments | $91,976 | DCF | Discount ratetable 60 note 2 | 7.02% – 30.09% (12.24%) |
| NAVtable 60 note 1 | n/a | n/a | |||
| Transaction price | n/a | n/a | |||
| Fund investments | $29,522 | NAVtable 60 note 1 | n/a | n/a | |
| Alternative investments | Fund investments | $40,753 | NAVtable 60 note 1 | n/a | n/a |
| Total | $739,789 | ||||
Table 60 Notes
|
|||||
| Financial assets | Type of Investment | Fair Value ($thousands) | Significant Valuation Techniques | Significant Unobservable Inputs | Range (Weighted Average) |
|---|---|---|---|---|---|
| Public markets | |||||
| Foreign equity | Direct investments | $4,052 | NAVtable 60 note 1 | n/a | n/a |
| Private markets | |||||
| Real estate | Direct and co-investments | $155,644 | Discounted cash flow (DCF) | Discount ratetable 60 note 2table 60 note 3 | 3.30% - 19.00% (7.40%) |
| Terminal capitalization ratetable 60 note 2table 60 note 3 | 3.56% - 12.00% (5.60%) | ||||
| Direct capitalization | Capitalization ratetable 60 note 2table 60 note 4 | 2.35% - 10.00% (4.62%) | |||
| Stabilized occupancy ratetable 60 note 4table 60 note 5 | 98.00% to 100.00% (99.55%) | ||||
| Sales comparison approach | Price per square foottable 60 note 4table 60 note 5 | $3.42 - $1,750.44 ($256.48) | |||
| NAVtable 60 note 1 | n/a | n/a | |||
| Transaction price | n/a | n/a | |||
| Fund investments | $14,327 | NAVtable 60 note 1 | n/a | n/a | |
| Other private markets | Direct and co-investments | $269,062 | DCF | Discount ratetable 60 note 2 | 5.50% - 20.00% (9.68%) |
| Market comparables | n/a | n/a | |||
| NAVtable 60 note 1 | n/a | n/a | |||
| Transaction price | n/a | n/a | |||
| Fund Investments | $104,894 | NAVtable 60 note 1 | n/a | n/a | |
| Fixed income | |||||
| Corporate bonds | Asset-backed term notes | $11 | Third-party pricingtable 60 note 1 | n/a | n/a |
| Private debt securities | Direct and co-investments | $94,843 | DCF | Discount ratetable 60 note 2 | 4.25% - 23.48% (12.56%) |
| NAVtable 60 note 1 | n/a | n/a | |||
| Transaction price | n/a | n/a | |||
| Fund investments | $30,590 | NAVtable 60 note 1 | n/a | n/a | |
| Alternative investments | Fund investments | $39,217 | NAVtable 60 note 1 | n/a | n/a |
| Total | $712,640 | ||||
Table 61 Notes
|
|||||
(IV) Level 3 reconciliation
| Opening balance | Purchases | Sales | Settle-ments | Realized gains | Unrealized gains (losses)table 62 note 1 | Transfer into Level 3 | Closing balance | |
|---|---|---|---|---|---|---|---|---|
| Public markets | $4,052 | $1,862 | $(550) | $0 | $326 | $3,848 | $0 | $9,538 |
| Private markets | 543,927 | 57,763 | (38,021) | 0 | 9,039 | (4,977) | 258 | 567,989 |
| Fixed income | 125,444 | 24,918 | (30,048) | 0 | 1,186 | 9 | 0 | 121,509 |
| Alternative investments | 39,217 | 2,288 | (4,491) | 0 | 1,043 | 2,696 | 0 | 40,753 |
| Total | $712,640 | $86,831 | $(73,110) | $0 | $11,594 | $1,576 | $258 | $739,789 |
Table 62 Note
|
||||||||
As at 31 March 2023, listed foreign equity securities with a fair value of $258 thousand were classified under Level 1. During the year ended 31 March 2024, those securities were transferred to Level 3 as the investment became privately held and its fair value was determined based on significant unobservable inputs.
| Opening balance | Purchases | Sales | Settle-ments | Realized gains | Unrealized gains (losses)table 63 note 1 | Transfer out of Level 3 | Closing balance | |
|---|---|---|---|---|---|---|---|---|
| Public markets | $5,649 | $153 | $(529) | $0 | $112 | $(1,139) | $(194) | $4,052 |
| Private markets | 493,270 | 75,805 | (41,994) | 0 | 14,328 | 3,417 | (899) | 543,927 |
| Fixed income | 107,140 | 32,960 | (18,026) | 0 | 1,494 | 1,876 | 0 | 125,444 |
| Alternative investments | 35,362 | 2,870 | (2,416) | 0 | 445 | 2,956 | 0 | 39,217 |
| Total | $641,421 | $111,788 | $(62,965) | $0 | $16,379 | $7,110 | $(1,093) | $712,640 |
Table 63 Note
|
||||||||
As at 31 March 2022, a public market investment of $194 thousand in a non-listed fund that held listed securities was classified under Level 3 due to the nature of the contractual restrictions on the redemption of fund units. During the year ended 31 March 2023, the listed securities held by the fund were transferred to PSPIB and were classified as Level 1. Additionally, as at 31 March 2022, a private market investment of $899 thousand was classified under Level 3 as its fair value was determined based on significant unobservable inputs. During the year ended 31 March 2023, this investment was transferred to Level 2 as the related securities became publicly traded. These securities held by PSPIB are unregistered and can only be sold upon their registration.
(V) Level 3 sensitivity analysis
In the course of measuring fair value of financial instruments classified as Level 3, valuation techniques used incorporate assumptions that are based on non-observable data. Significant assumptions used for each asset class are described in Note 5(C) (III). Although such assumptions reflect PSPIB’s best judgment, with all other variables held constant, the use of reasonably possible alternative assumptions could yield different fair value measures representing, at a minimum, a 3% increase and 3% decrease as at 31 March 2024 (4% increase and 4% decrease as at 31 March 2023) in the fair value of financial instruments categorized as Level 3. This excludes fund investments, where a sensitivity analysis is not possible given the underlying assumptions used are not available to PSPIB. In the case of fund investments, the fair value is determined as indicated in Note 5(C) (II).
(D) Collateral pledged and received
PSPIB is party to agreements that involve pledging and holding collateral, as outlined in Notes 2(F), 2(G) and 7(B) (I). The following table illustrates the fair values of the pension plan’s allocated collateral, as well as the securities under the lending and borrowing programs and the securities under the repurchase and reverse repurchase agreements.
| 2024 | 2023 | |
|---|---|---|
| Securities lending and borrowing | ||
| Securities lent | $16,775 | $18,087 |
| Collateral heldtable 64 note 1 | 17,391 | 18,935 |
| Securities borrowed | 10,697 | 7,969 |
| Collateral pledgedtable 64 note 2table 64 note 3 | 11,002 | 8,466 |
| Securities repurchase and reverse repurchase agreements | ||
| Securities sold under repurchase agreements | 21,392 | 39,435 |
| Collateral pledgedtable 64 note 3 | 21,404 | 39,189 |
| Securities purchased under reverse repurchase agreements | 9,355 | 5,354 |
| Collateral heldtable 64 note 4 | 9,337 | 5,337 |
| Derivative contracts | ||
| Collateral pledgedtable 64 note 3 | 8,970 | 8,954 |
| Collateral heldtable 64 note 5 | 8,192 | 7,701 |
Table 64 Notes
|
||
6. Interest in other entities
(A) Subsidiaries, joint ventures and associates
In the normal course of business, investments in private markets are commonly held through investment entity subsidiaries formed by PSPIB. As at 31 March 2024, 145 investment entity subsidiaries were incorporated in North America, 28 in Europe, 19 in Oceania, 8 in Central and South America, 2 in Asia and 1 in Africa (31 March 2023—128 in North America, 28 in Europe, 19 in Oceania, 8 in Central and South America, 2 in Asia and 1 in Africa).
In addition, PSPIB controlled 92 investees directly or through its investment entity subsidiaries as at 31 March 2024 (31 March 2023—84 investees).
The following tables present, in descending order, the most significant investees held directly or indirectly by PSPIB where it has control, joint control or significant influence.
| Entity’s name | Financial asset class | Principal place of business | Ownership interest held by PSPIB (%) | Relationship to PSPIB |
|---|---|---|---|---|
| AviAlliance GmbH | Infrastructure | Europe | 100 | Controlled |
| Roadis Transportation Holding, S.L.U. | Infrastructure | Global | 100 | Controlled |
| American Wholesale Insurance Holding Company, LLC | Private equity | North America | 17 | Associate |
| SEGRO European Logistics Partnership S.a.r.l. | Real estate | Europe | 50 | Jointly controlled |
| Kaingaroa Timberlands Limited | Natural resources | Oceania | 56 | Jointly controlled |
| Andante InvesteeCo Inc. | Infrastructure | Oceania | 30 | Jointly controlled |
| Willow Topco Limited | Infrastructure | Europe | 63 | Jointly controlled |
| TDF S.A.S. | Infrastructure | Europe | 22 | Associate |
| Forth Ports Limited | Infrastructure | Europe | 51 | Jointly controlled |
| Cubico Sustainable Investments Limited | Infrastructure | Global | 50 | Jointly controlled |
| Entity’s name | Financial asset class | Principal place of business | Ownership interest held by PSPIB (%) | Relationship to PSPIB |
|---|---|---|---|---|
| AviAlliance GmbH | Infrastructure | Europe | 100 | Controlled |
| American Wholesale Insurance Holding Company, LLC | Private equity | North America | 22 | Associate |
| SEGRO European Logistics Partnership S.a.r.l. | Real estate | Europe | 50 | Jointly controlled |
| Kaingaroa Timberlands Limited | Natural resources | Oceania | 56 | Jointly controlled |
| Roadis Transportation Holding, S.L.U. | Infrastructure | Global | 100 | Controlled |
| Willow Topco Limited | Infrastructure | Europe | 74 | Jointly controlled |
| TDF S.A.S. | Infrastructure | Europe | 22 | Associate |
| Revera inc. | Real estate | North America | 100 | Controlled |
| Forth Ports Limited | Infrastructure | Europe | 51 | Jointly controlled |
| Alliant | Private equity | North America | 12 | Associate |
In addition to the above, PSPIB consolidates wholly owned subsidiaries that solely provide it with services that relate to its investment activities. Such services consist of investment management and financing of private market investments within the context of PSPIB’s capital market debt program described in Note 9(B).
(B) Structured entities
PSPIB holds interests in partnerships and funds mainly in the context of its investments in private markets. Given their nature, such entities commonly have the characteristics of a structured entity, that is, an entity where contractual arrangement matter more than voting rights in determining control and directing relevant activities. These entities are held as investments and do not expose PSPIB to additional risks or returns compared to interests held in non-structured entities.
Information regarding structured entities is included, as applicable, within disclosures of investment risk management under Note 7, guarantees and indemnities under Note 20 and commitments under Note 21.
7. Investment risk management
PSPIB is required to act in the best interests of the contributors and beneficiaries under the pension plan and for maximizing returns without undue risk of loss. In pursuit of this objective, PSPIB established an Enterprise Risk Management Policy (ERM Policy). The ERM Policy provides a framework for identifying, evaluating, managing, mitigating, monitoring and reporting the investment and non-investment risks to which PSPIB is exposed.
As part of the overall ERM policy, the objective of the Investment Risk Management Policy (IRM Policy) is to support the management of risk inherent to the investment decision-making process. The IRM Policy outlines a framework detailing how investment activities should comply with PSPIB’s risk philosophy and align with the tolerance and limits of its risk appetite. The IRM Policy also supplements the Statement of Investment Policies, Standards and Procedures (SIP&P), whose objective is to effectively manage investment risks related to the implementation of PSPIB’s various investment strategies. Investment risks include market, credit and liquidity risks.
(A) Market risk
Market risk is the risk that the value of an investment will fluctuate as a result of an adverse financial outcome due to changes in the factors that drive that value, such as changes in market prices, changes caused by factors specific to the individual investment, volatility in share and commodity prices, interest rate, foreign exchange or other factors affecting similar securities traded in the market.
(I) Measurement of market risk
As at 31 March 2024, the active annualized Value at Risk (“Active VaR”) was used as a primary measure of total portfolio market risk, to supplement the absolute annualized VaR (“Absolute VaR”) and monitor more closely the market risk directly attributable to PSPIB’s active investment management decisions. Active and Absolute VaR are used as key measures of total portfolio market risk.
The Absolute VaR quantifies, with a given confidence level, the loss in value of the total portfolio that one can expect, due to fluctuations in market prices, not to be exceeded over a given period. The VaR is also evaluated on an active basis by measuring the Active VaR. This measurement helps determine if the total portfolio deviates significantly from the Policy Portfolio, established with the SIP&P in mind.
For both Active VaR and Absolute VaR, PSPIB uses a historical VaR incorporating ten years’ worth of market returns scaled to a twelve-month holding period at a 95% confidence level. That is, statistically PSPIB would expect to see its total portfolio underperformance relative to the Policy Portfolio exceed the Active VaR and its total portfolio losses exceed the Absolute VaR only 5% of the time over a one-year period. For investments that are not actively traded, the calculation of the VaR uses securities with similar risk attributes as a proxy.
The VaR is statistically valid under normal market conditions. Although it includes potential losses derived from observed historical returns, it also assumes that the future will behave in a pattern similar to the past. Consequently, if future market conditions differ significantly from those of the past, potential losses may differ from those originally estimated.
| 31 March 2024 | 31 March 2023 | |
|---|---|---|
| Active VaR | 5.0% | 4.8% |
| Absolute VaR | 19.2% | 19.6% |
Stress testing
Although the VaR is a widely accepted risk measure, it is complemented by other risk measurement methodologies that provide greater insight on market risk. PSPIB uses stress testing and scenario analysis to examine the impact on financial results of abnormally large movements in risk factors. Such techniques are used to test a portfolio’s sensitivity to various risk factors and key model assumptions. These methods also use historically stressed periods to evaluate how a current portfolio reacts under such circumstances. Stress testing and scenario analysis are also deployed to assess new product performance.
(II) Interest rate risk
Interest rate risk refers to the risk that fluctuations in interest rates will directly affect the fair value of the pension plan’s net asset values.
The terms to maturity of the classes of financial instruments, outlined in Note 5(A), with the most significant exposure to interest rate risk were as follows
| Less than 1 year | 1 to 5 years | 5 to 10 years | Over 10 years | Other | Total | |
|---|---|---|---|---|---|---|
| Cash and cash equivalents | $0 | $0 | $0 | $0 | $14,451table 68 note 1 | $14,451 |
| Money market securities | 0 | 0 | 0 | 0 | $34,505table 68 note 1 | $34,505 |
| Government and corporate bonds | 1,873 | 41,288 | 38,968 | 26,671 | 992table 68 note 2 | 109,882 |
| Inflation-linked bonds | 0 | 37,340 | 20,891 | 14,985 | 0 | 73,216 |
| Private debt securities | 153 | 45,444 | 29,566 | 15,927 | 30,408table 68 note 3 | 121,498 |
| Total fixed income | $2,026 | $124,072 | $89,425 | $57,673 | $80,356 | $353,552 |
Table 68 Notes
|
||||||
| Less than 1 year | 1 to 5 years | 5 to 10 years | Over 10 years | Other | Total | |
|---|---|---|---|---|---|---|
| Cash and cash equivalents | $0 | $0 | $0 | $0 | $28,911table 69 note 1table 69 note 4 | $28,911 |
| Money market securities | 0 | 0 | 0 | 0 | 34,442table 69 note 1table 69 note 4 | 34,442 |
| Government and corporate bonds | 2,805 | 42,147 | 27,491 | 22,097 | 1,375table 69 note 2 | 95,915 |
| Inflation-linked bonds | 0 | 20,129 | 16,386 | 10,736 | 0 | 47,251 |
| Private debt securities | 4,289 | 27,665 | 47,036 | 17,138 | 29,305table 69 note 3 | 125,433 |
| Total fixed income | $7,094 | $89,941 | $90,913 | $49,971 | $94,033 | $331,952 |
Table 69 Notes
|
||||||
All equity investments within Canadian equity, foreign equity, real estate, private equity, infrastructure and natural resources amounting to $750,594 thousand as at 31 March 2024 ($708,232 thousand as at 31 March 2023) do not have specified terms to maturity nor are they significantly exposed to interest rate risk.
Alternative investments described in Note 5(A) (IV), which amounted to $105,413 thousand as at 31 March 2024 ($102,847 thousand as at 31 March 2023), also have no specified terms to maturity. Certain of these investments, as well as reverse repurchase agreements and derivative contracts described in Notes 5(A) (X) and 5(B), respectively, are subject to interest rate risk exposures. These exposures are reflected in the VaR calculation described in Note 7(A) (I).
The terms to maturity of PSPIB’s capital market debt financing are disclosed in Note 9(B).
Interest Rate Benchmark Reform
PSPIB holds a number of financial instruments that will mature after the date the Interbank Offered Rate (IBOR) to which they refer is anticipated to be discontinued as a result of the reform. A steering committee oversees the transition from IBORs to alternative reference rates (ARRs) to mitigate the risks related to the discontinuation or unavailability of such rates, which are primarily operational. With respect to non-derivative financial instruments, PSPIB has been identifying agreements referring to IBORs and engaging in a timely contract remediation process with the related counterparties. For derivative contracts, PSPIB has adhered to the International Swaps and Derivatives Association (ISDA) Fallbacks Protocol that took effect on 25 January 2021, which provides an efficient mechanism to switch to ARRs as IBORs become unavailable.
The following table shows the fair value of non-derivative financial instruments and the notional value of derivative financial instruments that have yet to transition to ARRs.
| CDOR | |
|---|---|
| Non-derivative financial assets fair value | $1,497 |
| Derivatives notional | $3,058 |
(III) Foreign currency risk
PSPIB is exposed to currency risk through holding of investments (i.e. direct and indirect holdings of securities, units in pooled funds and units in limited partnerships) or investment-related liabilities in various currencies. Fluctuations in the relative value of the Canadian dollar against these foreign currencies can result in a positive or a negative effect on the fair value of the investments. To mitigate this risk, PSPIB may take, through foreign forward contracts or cross currency swaps, positions in foreign currencies.
| 2024 | ||
|---|---|---|
| Currency | Fair Value | % of Total |
| U.S. dollar | $696,488 | 67.2 |
| Euro | 109,593 | 10.6 |
| Japanese yen | 40,403 | 3.9 |
| British pound | 38,568 | 3.7 |
| Indian rupee | 23,399 | 2.3 |
| Australian dollar | 17,753 | 1.7 |
| Mexican peso | 16,906 | 1.6 |
| Brazilian real | 12,772 | 1.2 |
| Swiss franc | 9,877 | 1.0 |
| Singapore dollar | 7,148 | 0.7 |
| Hong Kong dollar | 6,833 | 0.7 |
| New Taiwan dollar | 6,386 | 0.6 |
| Others | 49,918 | 4.8 |
| Total | $1,036,044 | 100.0 |
As at 31 March 2024, PSPIB and its investment entity subsidiaries also had commitments, denominated in foreign currencies of $118,805 thousand for the pension plan (U.S. $71,312 thousand, €12,569 thousand, £1,693 thousand, 4,525 thousand Mexican pesos, 553 thousand Australian dollars, 4,190 thousand Indian rupees, 12,820 thousand Japanese yen), which were not included in the foreign currency exposure table above.
| 2023 | ||
|---|---|---|
| Currency | Fair Value | % of Total |
| U.S. dollar | $637,667 | 66.0 |
| Euro | 116,572 | 12.1 |
| Hong Kong dollar | 43,571 | 4.5 |
| British pound | 35,653 | 3.7 |
| Japanese yen | 23,421 | 2.4 |
| Indian rupee | 15,563 | 1.6 |
| Mexican peso | 15,199 | 1.6 |
| New Taiwan dollar | 8,630 | 0.9 |
| Singapore dollar | 8,366 | 0.9 |
| Swiss franc | 7,763 | 0.8 |
| South African rand | 6,995 | 0.7 |
| Others | 46,273 | 4.8 |
| Total | $965,673 | 100.0 |
As at 31 March 2023, PSPIB and its investment entity subsidiaries also had commitments, denominated in foreign currencies of $134,938 thousand for the pension plan (U.S. $84,828 thousand, €10,532 thousand, £1,717 thousand, 91 thousand South African rands, 7,466 thousand Mexican pesos, 974 thousand Australian dollars, 9,101 thousand Indian rupees, 17,572 thousand Japanese yen), which were not included in the foreign currency exposure table above.
(B) Credit Risk
PSPIB is exposed to credit risk, which is the risk of non-performance of a debtor on whom PSPIB relies to fulfill contractual or financial obligations. That is, the risk that the issuer of a debt security or that the counterparty to a derivative contract, to a securities lending and borrowing transaction or to securities purchased under reverse repurchase agreements, is unable to meet its financial obligations.
Credit risk encompasses the risk of a deterioration of creditworthiness and the relevant concentration risk. Credit risk monitoring entails an evaluation of the credit quality of each issuer and counterparty that transacts with PSPIB. To perform this evaluation for public issuers and counterparties, PSPIB relies on four recognized credit rating agencies. A minimum of two credit ratings are used to classify each security. If the agencies disagree as to a security’s credit quality, PSPIB uses the lowest of the available ratings. For private issuers, PSPIB assigns internal credit ratings to issuers and measures the combined risk profile against set targets. To assign risk ratings to issuers, PSPIB uses methodologies comparable to those used by recognized rating agencies.
As at 31 March 2024, the pension plan’s maximum exposure to credit risk amounted to $367 million ($344 million as at 31 March 2023). This amount is presented before collateral held and netting arrangements that do not qualify for offsetting under IFRS. The maximum credit exposure excludes guarantees disclosed in Note 20 as well as investments in funds classified as alternative investments in Note 5(A) (IV). Such funds hold fixed income securities among other types of instruments.
To monitor the evolution of credit risk, PSPIB periodically produces a concentration report by credit rating of credit-sensitive securities.
| Government and corporate bondstable 73 note 1 | Inflation-linked bondstable 73 note 1 | Cash equivalentstable 73 note 1 | Money market securitiestable 73 note 1 | Reverse repurchase agreements | OTC derivativestable 73 note 2 | Private debt securitiestable 73 note 1 | Totaltable 73 note 1 | |
|---|---|---|---|---|---|---|---|---|
| AAA-AA | $70,769 | $72,973 | $10,317 | $31,729 | $4,243 | $154 | $0 | $190,195 |
| A | 31,669 | 0 | 1,987 | 551 | 4,260 | 5,292 | 0 | 43,759 |
| BBB | 5,136 | 448 | 0 | 0 | 820 | 0 | 309 | 6,713 |
| BB or below | 2,965 | 0 | 0 | 0 | 0 | 0 | 122,298 | 125,263 |
| No ratingtable 73 note 3 | 331 | 0 | 0 | 0 | 0 | 0 | 270 | 601 |
| Total | $110,870 | $73,421 | $12,304 | $32,280 | $9,333 | $5,446 | $122,877 | $366,531 |
Table 73 Notes
|
||||||||
| Government and corporate bondstable 74 note 1 | Inflation-linked bondstable 74 note 1 | Cash equivalentstable 74 note 1table 74 note 4 | Money market securitiestable 74 note 1table 74 note 4 | Reverse repurchase agreements | OTC derivativestable 74 note 2 | Private debt securitiestable 74 note 1 | Totaltable 74 note 1 | |
|---|---|---|---|---|---|---|---|---|
| AAA-AA | $62,550 | $47,355 | $20,936 | $32,118 | $660 | $308 | $0 | $163,927 |
| A | 27,840 | 0 | 5,710 | 162 | 4,387 | 8,617 | 0 | 46,716 |
| BBB | 2,739 | 0 | 0 | 0 | 235 | 0 | 1,441 | 4,415 |
| BB or below | 3,111 | 0 | 0 | 0 | 0 | 0 | 124,039 | 127,150 |
| No ratingtable 74 note 3 | 429 | 0 | 0 | 0 | 0 | 0 | 1,138 | 1,567 |
| Total | $96,669 | $47,355 | $26,646 | $32,280 | $5,282 | $8,925 | $126,618 | $343,775 |
Table 74 Notes
|
||||||||
(I) Counterparty risk
Counterparty risk represents the credit risk from current and potential exposure related to transactions involving derivative contracts, securities lending and borrowing as well as securities repurchase and reverse repurchase agreements. In order to minimize counterparty risk, PSPIB requires that counterparties provide adequate collateral and meet its credit rating requirements. PSPIB frequently monitors the credit rating of its counterparties as determined by recognized credit rating agencies. With respect to derivative contracts, PSPIB has the ability to terminate all trades with most counterparties whose credit rating is downgraded below its requirements.
For OTC derivatives, PSPIB’s policy also requires the use of the International Swaps and Derivative Association (ISDA) Master Agreement with all counterparties to derivative contracts. The ISDA Master Agreement provides the contractual framework within which dealing activities across a full range of OTC products are conducted. In the case of OTC-cleared derivatives, trading activities are regulated between parties under terms that are customary to such transactions.
As a credit mitigation technique, the ISDA Master Agreement contractually binds counterparties to close-out netting provisions in the case of default by one of the counterparties. Additionally, the Credit Support Annex (CSA) to the ISDA Master Agreement enables PSPIB to realize any collateral placed with it in the case of default of the counterparty. The CSA also requires PSPIB to contribute further collateral when requested. All collateral transactions under the CSA are in cash, high-quality debt instruments or securities. The CSA also regulates the exchange of collateral when the credit exposure to a counterparty exceeds a predetermined threshold. Counterparties are generally authorized to sell, repledge or otherwise use collateral held. Similarly, in the case of OTC-cleared derivatives, collateral is required in cash, high quality debt instruments or securities and can be sold, repledged or otherwise used. PSPIB does not sell, repledge or otherwise use any collateral held in the form of securities but does reinvest all cash collateral, with respect to derivative contracts.
With respect to transactions involving securities lending and borrowing agreements as well as securities repurchase and reverse repurchase agreements, collateral requirements are in place to mitigate counterparty risk. Notes 2(F) and 2(G) describe collateral requirements in securities lending and borrowing programs as well as securities repurchase and reverse repurchase agreements.
Information in connection with collateral pledged by PSPIB and its counterparties is disclosed in Note 5(D).
In the case of the securities lending program, PSPIB’s exposure to counterparty risk is further mitigated as the custodian of the securities lent assumes the risk that a counterparty will be unable to meet its obligations associated with the collateral requirements.
PSPIB is responsible for counterparty risk monitoring and mitigation as well as maintaining a comprehensive, disciplined, and enterprise-wide process for tracking and managing counterparty risk. As such, PSPIB measures counterparty risk on an ongoing basis, evaluates and tracks the creditworthiness of current counterparties and mitigates counterparty risk through collateral management.
(II) Offsetting
PSPIB is subject to ISDA Master Agreements in relation to its OTC derivative financial instruments as described. Such agreements contain close-out netting provisions applicable only in the case of default. In certain cases, such agreements also allow for offsetting. In cases where the conditions for offsetting were met, financial instruments have been presented net in the statement of financial position. Securities repurchase and reverse repurchase agreements, described in Notes 2(G) and 5(D) are subject to similar arrangements; however, they are not offset as the conditions for offsetting are not met.
The following tables present the financial assets and liabilities described above ($ thousands):
| Gross amount of recognized financial assets | Less: gross amount of recognized financial liabilities set off | Net amount of financial assets presented in the statement of financial position | Less: related amounts not set off in the statement of financial position | |||
|---|---|---|---|---|---|---|
| Recognized financial liabilities | Collateral held and not recognized | Net | ||||
| As at 31 March 2024 | ||||||
| Reverse repurchase agreements | $9,333 | $0 | $9,333table 75 note 1 | $3,184 | $6,147 | $2 |
| OTC- derivatives | 5,446 | 0 | 5,446table 75 note 2 | 3,579 | 1,789 | 78 |
| Total | $14,779 | $0 | $14,779 | $6,763 | $7,936 | $80 |
| As at 31 March 2023 | ||||||
| Reverse repurchase agreements | $5,282 | $0 | $5,282table 75 note 1 | $5,045 | $237 | $0 |
| OTC- derivatives | 8,925 | 0 | 8,925table 75 note 2 | 6,366 | 1,898 | 661 |
| Total | $14,207 | $0 | $14,207 | $11,411 | $2,135 | $661 |
Table 75 Notes
|
||||||
| Gross amount of recognized financial liabilities | Less: gross amounts of recognized financial assets set off | Net amount of financial liabilities presented in the statement of financial position | Less: related amounts not set off in the statement of financial position | |||
|---|---|---|---|---|---|---|
| Recognized financial assets | Collateral pledged and not derecognized | Net | ||||
| As at 31 March 2024 | ||||||
| Repurchase agreements | $21,361 | $0 | $21,361table 76 note 1 | $3,184 | $18,177 | $0 |
| OTC- derivatives | 3,920 | 0 | 3,920table 76 note 2 | 3,133 | 685 | 102 |
| Collateral payable | 495 | 0 | 495table 76 note 3 | 446 | 0 | 49 |
| Total | $25,776 | $0 | $25,776 | $6,763 | $18,862 | $151 |
| As at 31 March 2023 | ||||||
| Repurchase agreements | $38,970 | $0 | $38,970table 76 note 1 | $5,045 | $33,925 | $0 |
| OTC- derivatives | 6,675 | 0 | 6,675table 76 note 2 | 5,937 | 713 | 25 |
| Collateral payable | 468 | 0 | 468table 76 note 3 | 429 | 0 | 39 |
| Total | $46,113 | $0 | $46,113 | $11,411 | $34,638 | $64 |
Table 76 Notes
|
||||||
(C) Liquidity risk
Liquidity risk corresponds to the risk that PSPIB will not be able to meet its financial obligations on a timely basis, with sufficient and readily available cash resources. PSPIB’s cash position is monitored on a daily basis. In general, investments in cash, money market securities, floating rate notes, bonds and public equities are expected to be highly liquid as they will be invested in securities that are actively traded. PSPIB utilizes appropriate measures and controls to monitor liquidity risk in order to ensure that there is sufficient liquidity to meet financial obligations as they come due. A liquidity report taking into consideration future forecasted cash flows is prepared and presented to PSPIB’s senior management on a weekly basis. This ensures that sufficient cash reserves are available to meet forecasted cash outflows. Additionally, sufficient sources of liquidity are maintained for deployment in case of market disruption.
PSPIB has the ability to raise additional capital through the use of its capital market debt program. This program allows PSPIB to issue short-term promissory notes and medium-term notes. Note 9(B) provides additional information on the usage of the capital market debt program. Furthermore, PSPIB maintains credit facilities for general corporate purposes. Note 9(A) provides additional information with respect to such credit facilities.
The terms to maturity of the notional amount of derivatives are disclosed in Note 5(B).
Financial liabilities
The following tables present the fair value of non-derivative-related financial liabilities as well as derivative-related financial instruments, aggregated according to their maturities as at 31 March 2024 ($ thousands) and excluding the impact of guarantees and indemnities disclosed in Note 20:
| Less than 3 months | 3 to 12 months | Over 1 year | Total | |
|---|---|---|---|---|
| Non-derivative-related financial liabilitiestable 77 note 1 | ||||
| Amounts payable from pending trades | $(2,203) | $0 | $0 | $(2,203) |
| Interest payable | (577) | (96) | 0 | (673) |
| Securities sold short | (13,087) | 0 | 0 | (13,087) |
| Collateral payable | (2,725) | 0 | 0 | (2,725) |
| Securities sold under repurchase agreements | (19,982) | (1,379) | 0 | (21,361) |
| Capital market debt financingtable 77 note 2 | (25,647) | (19,114) | (65,292) | (110,053) |
| Trade payable and other liabilities | (1,440) | (22) | (579) | (2,041) |
| Total | $(65,661) | $(20,611) | $(65,871) | $(152,143) |
| Derivative-related financial instruments | ||||
| Derivative-related assets | $2,450 | $1,187 | $1,886 | $5,523 |
| Derivative-related liabilitiestable 77 note 1 | (2,079) | (964) | (944) | (3,987) |
| Total | $371 | $223 | $942 | $1,536 |
Table 77 Note
|
||||
The following tables present the fair value of non-derivative-related financial liabilities as well as derivative-related financial instruments, aggregated according to their maturities as at 31 March 2023 ($ thousands) and excluding the impact of guarantees and indemnities disclosed in Note 20:
| Less than 3 months | 3 to 12 months | Over 1 year | Total | |
|---|---|---|---|---|
| Non-derivative-related financial liabilitiestable 78 note 1 | ||||
| Amounts payable from pending trades | $(4,455) | $0 | $0 | $(4,455) |
| Interest payable | (433) | (48) | 0 | (481) |
| Securities sold short | (10,308) | 0 | 0 | (10,308) |
| Collateral payable | (3,954) | 0 | 0 | (3,954) |
| Securities sold under repurchase agreements | (36,239) | (2,731) | 0 | (38,970) |
| Capital market debt financingtable 79 note 2 | (15,450) | (20,049) | (63,823) | (99,322) |
| Trade payable and other liabilities | (1,540) | (18) | (602) | (2,160) |
| Total | $(72,379) | $(22,846) | $(64,425) | $(159,650) |
| Derivative-related financial instruments | ||||
| Derivative-related assets | $4,987 | $2,570 | $1,528 | $9,085 |
| Derivative-related liabilitiestable 78 note 1 | (3,803) | (2,115) | (835) | (6,753) |
| Total | $1,184 | $455 | $693 | $2,332 |
Table 78 Note
|
||||
(8) Contributions Receivable
| 2024 | 2023 | |
|---|---|---|
| Contributions receivable from plan members for past service | $9,644 | $12,684 |
| Contributions receivable from employer for past service | 9,644 | 12,684 |
| Total contributions receivable | $19,288 | $25,368 |
9. Borrowings
(A) Credit facilities
PSPIB maintains a revolving credit facility in the amount of $2 billion and a demand line of credit in the amount of $1 billion (together “the credit facilities”).
The credit facilities are for general corporate purposes and are available in either Canadian or U.S. currencies. Subject to customary terms and conditions, these credit facilities are available at variable interest rates such as the prime rate and the U.S. base rate.
These credit facilities were not drawn upon as at 31 March 2024, and 31 March 2023.
(B) Capital market debt financing
PSPIB’s capital market debt program consists of the private placement of short-term promissory notes as well as medium-term notes issued by PSP Capital Inc., a wholly-owned subsidiary of PSPIB. The capital raised is primarily used to finance private market investments. It is unconditionally and irrevocably guaranteed by PSPIB in accordance with its corporate leverage policy.
The maximum amount authorized by PSPIB’s Board of Directors for the capital market debt program is limited to $12 billion for all aggregate short-term note programs, 6 billion Australian dollars for the Australian dollar-denominated medium-term note program and $20 billion for the medium-term note program.
PSPIB’s capital market debt financing was in compliance with the limits authorized by PSPIB’s Board of Directors during the years ended 31 March 2024, and 31 March 2023.
| 2024 | 2023 | ||||||
|---|---|---|---|---|---|---|---|
| Currency | Term at issuance | Interest Rate (%) | Capital amounts payable at maturity | Fair value | Interest rate (%) | Capital amounts payable at maturity | Fair value |
| CAD | 180 days or less | 0 | $0 | $0 | 4.41—4.44 | $165 | $165 |
| USD | 365 days or less | 4.73—5.49 | 22,421 | 22,117 | 2.40—5.56 | 29,895 | 29,571 |
| EUR | 215 days or less | 3.85—3.93 | 2,917 | 2,893 | 0 | 0 | 0 |
| GBP | 245 days or less | 5.18—5.24 | 2,138 | 2,123 | 0 | 0 | 0 |
| AUD | 79 days or less | 4.28 | 540 | 537 | 0 | 0 | 0 |
| Total short-term notes | $28,016 | $27,670 | $30,060 | $29,736 | |||
| 2024 | 2023 | ||||||||||||
|---|---|---|---|---|---|---|---|---|---|---|---|---|---|
| Maturity | Series | Currency | Interest Rate | Capital Amounts Payable at Maturity | Fair Value | Capital Amounts Payable at Maturity | Fair Value | ||||||
| November 2023 | 9 | CAD | 2.09% | $0 | $0 | $5,850 | $5,763 | ||||||
| April 2024 | 7 | CAD | 3.29% | 4,835 | 4,835 | 5,430 | 5,374 | ||||||
| September 2024 | G2 | USD | 0.50% | 6,892 | 6,742 | 6,989 | 6,595 | ||||||
| March 2025 | G5 | USD | SOFRtable 83 note 1+24 bps | 5,514 | 5,514 | 5,591 | 5,571 | ||||||
| November 2025 | 11 | CAD | 3.00% | 4,727 | 4,623 | 5,164 | 5,063 | ||||||
| June 2026 | 13 | CAD | 0.90% | 5,798 | 5,395 | 5,970 | 5,484 | ||||||
| June 2026 | G1 | USD | 1.00% | 5,514 | 5,076 | 5,591 | 5,061 | ||||||
| June 2027 | G6 | USD | 3.50% | 5,514 | 5,332 | 5,591 | 5,461 | ||||||
| March 2028 | 14 | CAD | 1.50% | 3,973 | 3,625 | 4,131 | 3,764 | ||||||
| October 2028 | G3 | USD | 1.63% | 5,514 | 4,866 | 5,591 | 4,925 | ||||||
| February 2029 | A1 | AUD | 4.63% | 5,396 | 5,441 | 0 | 0 | ||||||
| June 2029 | G8 | CAD | 3.75% | 5,704 | 5,669 | 5,742 | 5,824 | ||||||
| January 2030 | 12 | CAD | 2.05% | 5,093 | 4,605 | 5,106 | 4,657 | ||||||
| December 2030 | G13table 83 note 2 | CAD | 4.40% | 4,075 | 4,178 | 0 | 0 | ||||||
| March 2032 | G4table 83 note 2 | CAD | 2.60% | 4,075 | 3,660 | 4,131 | 3,802 | ||||||
| August 2032 | G7 | AUD | 4.57% | 827 | 815 | 861 | 859 | ||||||
| January 2033 | G9 | AUD | 4.82% | 719 | 719 | 749 | 759 | ||||||
| June 2033 | G11 | CAD | 4.15% | 10,186 | 10,187 | 0 | 0 | ||||||
| March 2038 | G10 | EUR | 3.68% | 596 | 626 | 607 | 624 | ||||||
| July 2043 | G12 | EUR | 3.68% | $447 | $475 | $0 | $0 | ||||||
| Total medium-term notes | $85,399 | $82,383 | $73,094 | $69,586 | |||||||||
| Total capital market debt financing | $113,415 | $110,053 | $103,154 | $99,322 | |||||||||
Table 81 Notes
|
|||||||||||||
Unrealized losses in connection with borrowings amounted to $166 thousand for the year ended 31 March 2024 (unrealized losses of $1,075 thousand for the year ended 31 March 2023).
| 2024 | 2023 | |
|---|---|---|
| Short-term promissory notes | $1,484 | $919 |
| Medium-term notes | 2,097 | 1,375 |
| Total | $3,581 | $2,294 |
(C) Reconciliation of liabilities arising from financing activities
The following provides a reconciliation of liabilities arising from financing activities, including both changes arising from cash and non-cash changes.
| Opening balance | Proceeds from borrowings | Repayment of borrowings | Non-cash changes | Closing balance | ||
|---|---|---|---|---|---|---|
| Foreign exchange gains | Fair valuetable 83 note 1 losses | |||||
| Capital market debt financing | $99,322 | $129,047 | $(118,442) | $(403) | $529 | $110,053 |
| Borrowings | $99,322 | $129,047 | $(118,442) | $(403) | $529 | $110,053 |
Table 83 Note
|
||||||
| Opening balance | Proceeds from borrowings | Repayment of borrowings | Non-cash changes | Closing balance | ||
|---|---|---|---|---|---|---|
| Foreign exchange losses | Fair value table 84 note 1 gains | |||||
| Capital market debt financing | $94,976 | $117,211 | $(114,274) | $2,482 | $(1,073) | $99,322 |
| Borrowings | $94,976 | $117,211 | $(114,274) | $2,482 | $(1,073) | $99,322 |
Table 84 Note
|
||||||
10. Related Party Transactions
(A) Certain investees
Transactions between PSPIB and its unconsolidated subsidiaries, jointly controlled investees and associates or subsidiaries of such entities are related party transactions. PSPIB enters into investment transactions with such related parties in the normal course of its business, more specifically, as part of private markets and certain fixed income investments described under Note 5(A) as well as guarantees, indemnities and commitments described under Notes 20 and 21, respectively. Since balances in connection with all investment transactions are measured at FVTPL, those transactions undertaken with related parties have the same impact on net assets available for benefits as those with unrelated parties.
Transactions between PSPIB and its consolidated subsidiaries, as well as related balances, are eliminated upon consolidation and, therefore, are not disclosed in this note.
(B) Government-related entities
Since PSPIB is a Crown corporation, it is considered to be a government-related entity. Other entities that are controlled, jointly controlled or significantly influenced by the government are also considered government-related entities.
PSPIB may enter into investment transactions with government-related entities in the normal course of its business, more specifically, as part of private markets and certain fixed income investments described under Note 5(A). Such investment transactions are carried out on terms that are equivalent to those that may prevail in transactions with unrelated parties and are subject to the same internal processes. In this respect, transactions with such related parties have the same impact on the net assets available for benefits as those with unrelated parties. Consequently, PSPIB is availing itself of the exemption under IAS 24 Related Parties from making specific disclosures on transactions and balances with such government-related entities.
Transactions between the Canadian Forces Pension Plan and the Reserve Force Pension Plan are disclosed in Note 4.
11. Capital management
PSPIB manages the pension plan’s investments. PSPIB’s investment objectives are:
- To invest fund transfers in the best interests of the beneficiaries and contributors under the CFSA. The funds received are invested with a view of achieving a maximum rate of return, without undue risk of loss, having regard to the funding, policies and requirements of the pension plan established under the CFSA and the ability of the pension plan to meet its financial obligations. The funds are also invested in accordance with PSPIB’s Investment Risk Management policies outlined in Note 7
- To maintain an appropriate credit rating to achieve access to the capital markets at the lowest cost of capital. Through PSP Capital Inc. and its leverage policies, PSPIB has the ability to raise capital by issuing short-term promissory notes and medium-term notes. Note 9(B) provides information on the capital market debt financing, and Note 7(C) provides information on PSPIB’s liquidity
The pension plan’s capital consists of the actuarial funding surplus or deficit determined regularly by the actuarial funding valuation prepared by the OCA. The purpose of this actuarial valuation is to determine the financial position of the pension plan by testing its ability to meet obligations to current plan members and their survivors. Using various assumptions, the OCA projects the future pension benefits to estimate the current value of the pension obligations on a funding basis, which is compared with the sum of: the investment assets held by PSPIB (net of investment-related liabilities and borrowings), including their projected earnings; and the discounted value of future plan member and government contributions, including future earnings on contributions. The result of this comparison is either an actuarial surplus or an actuarial deficit.
The objective of managing the capital position of the pension plan is to ensure that the investments held by PSPIB are sufficient to meet the related future pension obligations.
12. Pension obligations
The OCA performs an actuarial valuation for accounting purposes as at 31 March of each fiscal year to measure and report the pension obligations, and to attribute the costs of the benefits to the period using the projected benefit method prorated on service.
The assumptions used in the actuarial valuation are based on management’s best estimates of expected long-term experience and short-term forecasts, as well as the majority of the demographic assumptions underlying the triennial actuarial valuation for funding purposes of the pension plan, as at 31 March 2022. The assumptions include estimates of discount rates, future inflation, returns on investments, general wage increases, workforce composition, retirement rates and mortality rates.
The discount rate used to measure the present value of the accrued pension benefit is the streamed expected rates of return on invested funds.
| 2024 (%) |
2023 (%) |
|
|---|---|---|
| Discount rates | 6.1 | 6.0 |
| Long-term rate of inflation | 2.0 | 2.0 |
| Long-term general wage increase | 2.5 | 2.6 |
|
1. In regard to pension benefits, the streamed discount rate used to measure the pension obligations is equivalent to the flat discount presented in the table. The ultimate discount rate is expected to reach 6.1% by 2032 (6.0% by 2033 in 2023). |
||
For the year ended 31 March 2024, the pension plan recorded total net gains of $275,303 thousand (total net loss of $30,530 thousand in 2023) consisting of gains of $83,788 thousand due to changes in actuarial assumptions (gains of $40,508 thousand in 2023), gains due to experience of $191,515 thousand (nil in 2023) and no losses (net losses of $71,038 thousand in 2023) due to experience.
13. Surplus / Deficit
The financial statement surplus or deficit does not impact the benefit payments to plan members because the government has a statutory obligation to pay the pension benefits it sponsors. Pursuant to pension legislation, the pension benefit transactions are tracked in the pension accounts within the accounts of Canada.
The pension plan is financed from employee and employer contributions, as well as from investment earnings. Pension benefits relate to service that falls within the Income Tax Act limits. An amount equal to contributions less benefit payments and other charges is invested by PSPIB.
14. Investment income
The investment income of the pension plan is presented for each major class of financial assets and liabilities and is comprised of two categories: interest and dividends, and net unrealized and realized gains (losses). This presentation reflects the substance of the investment income generated by the underlying investments, whether directly held by PSPIB or by its investment entity subsidiaries.
| 2024 | 2023 | |||||
|---|---|---|---|---|---|---|
| Interest and dividends | Change in fair valuetable 86 note 1 | Total investment Income | Interest and dividends | Change in fair valuetable 86 note 1 | Total investment income | |
| Public markets | $4,421 | $26,052table 86 note 2 | $30,473 | $4,799 | $(7,075)table 86 note 2 | $(2,276) |
| Private markets | ||||||
| Real estate | 2,359 | (20,768)table 86 note 2 | (18,409) | 2,142 | (1,168)table 86 note 2 | 974 |
| Private equity | 1,934 | 16,232table 86 note 2 | 18,166 | 656 | 4,757table 86 note 2 | 5,413 |
| Infrastructure | 3,709 | 15,978table 86 note 2 | 19,687 | 3,458 | 16,473table 86 note 2 | 19,931 |
| Natural resources | 1,209 | 1,530table 86 note 2 | 2,739 | 1,782 | 3,795table 86 note 2 | 5,577 |
| Fixed income | 18,755 | 1,203table 86 note 2 | 19,958 | 14,096 | 2,229table 86 note 2 | 16,325 |
| Alternative investments | 57 | 9,652 | 9,709 | 61 | 8,217 | 8,278 |
| Total before giving effect to investment-related assets and liabilities | $32,444 | $49,879 | $82,323 | $26,994 | $27,228 | $54,222 |
| Investment-related assets and liabilities | $230 | $1,171 | $1,401 | $218 | $(931) | $(713) |
| Capital market debt financing | $0 | $(176) | $(176) | $0 | $(3,174) | $(3,174) |
| Investment income | $32,674 | $50,874 | $83,548 | $27,212 | $23,123 | $50,335 |
Table 86 Notes
|
||||||
15. Contributions
| 2024 | 2023 | |
|---|---|---|
| From plan members | ||
| Current service contributions | $25,801 | $21,276 |
| Past service contributions | 2,635 | 2,584 |
| Change in contributions receivable | (3,040) | (1,717) |
| Total plan member contributions | $25,396 | $22,143 |
| From employer | ||
| Current service contributions | $60,518 | $53,207 |
| Past service contributions | 2,635 | 2,584 |
| Change in contributions receivable | (3,040) | (1,717) |
| Total employer contributions | $60,113 | $54,074 |
16. Special employer contribution for actuarial deficit
An annual adjustment payment of $4,100 thousand was made in the fiscal year ended 31 March 2024 ($17,400 thousand at 31 March 2023), based on the actuarial valuation of the pension plan tabled in Parliament on 24 November 2023. The next triennial actuarial valuation of the pension plan as at 31 March 2025, is expected to be tabled in Parliament in 2026.
17. Benefit payments and refunds and transfers
(A) Benefit payments
| 2024 | 2023 | |
|---|---|---|
| Retirement benefit payments | $14,857 | $13,204 |
| Minimum benefit payments | 207 | 86 |
| Total benefit payments | $15,064 | $13,290 |
(B) Refunds and transfers
| 2024 | 2023 | |
|---|---|---|
| Returns of contributions and transfer value payments | $13,048 | $15,762 |
| Transfers to the Public Service Pension Plan | 32 | 0 |
| Transfers to the Canadian Forces Pension Plan | 45,208 | 75,002 |
| Total refunds and transfers | $58,288 | $90,764 |
18. Investment—related expenses
| 2024 | 2023 | |
|---|---|---|
| Interest expense | $5,527 | $3,338 |
| Transaction costs | 646 | 577 |
| External investment management feestable 90 note 1 | 223 | 272 |
| Other (net)table 90 note 2 | 1,508 | 887 |
| Total | $7,904 | $5,074 |
Table 90 Notes
|
||
19. Administrative expenses
The legislation provides for administrative expenses to be charged to the pension plan. The Treasury Board approves the administrative expenses chargeable to the pension plan.
PSPC, as the day-to-day administrator, recovers from the pension plan administrative expenses for the activities directly attributable to its administration. These costs include salaries and benefits, systems maintenance and development, accommodation, and other operating costs of administering the pension plan within the department.
DND, as the program manager of the pension plan, provides policy interpretation support, information to plan members, financing and funding services and support to the Pension Advisory Committee, and charges its administrative costs to the pension plan.
The OCA provides actuarial valuation services. The costs related to these services are charged to the pension plan.
PSPIB’s costs of operation are charged to the four plans for which PSPIB provides investment services, namely, the public service pension plan, the Canadian Forces Pension Plan, the Reserve Force Pension Plan and the Royal Canadian Mounted Police pension plan. PSPIB allocates the direct costs of investment activities, such as external investment management fees and custodial fees that are included in each pension plan’s administrative expenses, based upon the net investments of each pension plan at the time the expense was incurred.
In 2024, 0.4% of PSPIB’s costs of operation were allocated to the Reserve Force Pension Plan (0.4% in 2023) as plan-related administrative expenses, such as salaries and employee benefits, operations and maintenance, professional and consulting fees, and other operating fees.
| 2024 | 2023 | |
|---|---|---|
| PSPC | ||
| Salaries and employee benefits | $4,263 | $3,692table 91 note 1 |
| Operation and maintenance | 1,771 | 1,805table 91 note 1 |
| PSPC Total | $6,034 | $5,496 |
| DND | ||
| Salaries and employee benefits | $460 | $434 |
| Operation and maintenance | 166 | 156 |
| DND Total | $626 | $590 |
| OCA—Actuarial fees | $143 | $222 |
| Total for government departments (included in the service cost) | $6,803 | $6,308 |
| PSPIB | ||
| Salaries and employee benefits | $1,850 | $1,917 |
| Operation and maintenance | 572 | 611 |
| Professional and consulting fees | 471 | 574 |
| PSPIB Total | $2,893 | $3,102 |
| Total administrative expenses | $9,696 | $9,410 |
Table 91 Note
|
||
20. Guarantees and indemnities
PSPIB provides indemnification to its directors, its officers, its employees and to certain PSPIB representatives asked to serve as directors or officers of entities in which PSPIB or its investment entity subsidiaries have made an investment or have a financial interest. As a result, but subject to the Public Sector Pension Investment Board Act, PSPIB may be required to indemnify these representatives for costs incurred, such as claims, actions or litigation in connection with the exercise of their duties, unless the liability of such a representative relates to a failure to act honestly and in good faith. To date, PSPIB has not received any claims or made any payment for such indemnities.
In certain cases, PSPIB also provides indemnification to third parties in the normal course of business. As a result, PSPIB may be required to indemnify such third parties in connection with the performance of their contractual obligations. To date, PSPIB has not received any claims nor made any payments for such indemnities.
PSPIB unconditionally and irrevocably guarantees all credit facilities, as well as short-term promissory notes and medium-term notes issued by PSP Capital Inc., as described in Note 9.
In certain investment transactions, PSPIB and its investment entity subsidiaries provided guarantees, indemnifications or issued letters of credit to third parties, the most significant of which are as follows:
- As at 31 March 2024 and 2023, PSPIB and its investment entity subsidiaries agreed to guarantee and, in some cases, provide indemnification for the performance of certain investees under contractual agreements. The majority of these agreements are borrowing arrangements. In the event a default occurs under such agreements, which is of limited recourse in certain cases, PSPIB or its investment entity subsidiaries could assume obligations of up to $2,717 million as at 31 March 2024 ($2,643 million as at 31 March 2023), of which $11,069 thousand has been allocated to the pension plan ($10,920 thousand as at 31 March 2023) plus applicable interest and other related costs. The arrangements mature between May 2024 and June 2042 as of 31 March 2024 (between June 2023 and June 2042 as of 31 March 2023)
- Additionally, PSPIB and its investment entity subsidiaries issued letters of credit totaling $1 million as at 31 March 2024 ($1 million as at 31 March 2023), of which $4 thousand has been allocated to the pension plan ($3 thousand as at 31 March 2023) in relation to investment transactions
21. Commitments
PSPIB and its investment entity subsidiaries have committed to enter into investment transactions, which will be funded over the next several years in accordance with agreed terms and conditions.
| 2024 | 2023 | |
|---|---|---|
| Foreign equity | $12 | $12 |
| Real estate | 15,716 | 18,936 |
| Private equity | 46,344 | 54,323 |
| Infrastructure | 16,256 | 24,389 |
| Natural resources | 1,957 | 2,781 |
| Private debt securities | 35,221 | 28,764 |
| Alternative investments | 6,345 | 8,456 |
| Total | $121,851 | $137,661 |
Funding in connection with the above commitments can be called upon at various dates extending until 2041 as at 31 March 2024 (until 2041 as at 31 March 2023).
Account Transaction Statements
Canadian Forces Superannuation Account
(Unaudited)
The Canadian Forces Superannuation Account records contributions received, benefits paid, and other transactions for members under Part I of the Canadian Forces Superannuation Act for service prior to April 1, 2000. The balance of the account is credited with interest as if the balance were invested in long-term government bonds. This account is no longer presented as an asset for pension plan reporting purposes.
| 2024 | 2023 | |
|---|---|---|
| Opening Balance | $44,157,882,558 | $45,302,621,656 |
| Receipts and other credits | ||
| Member contributions | 1,778,734 | 1,943,694 |
| Employer contributions | 1,778,734 | 1,943,694 |
| Actuarial Adjustment | 3,298,000,000 | 0 |
| Transfers from other pension funds | 0 | (27,041) |
| Interest | 1,330,681,026 | 1,404,822,448 |
| Repayment of annuity | 260,865 | 416,243 |
| Total receipts and other credits | $4,632,499,359 | $1,409,099,038 |
| Payments and other charges | ||
| Annuities | $2,603,553,563 | $2,524,569,574 |
| Minimum benefit payments | 387,470 | 381,733 |
| Pension benefit division payments | 10,297,279 | 12,291,166 |
| Return of contributions | 0 | 5,855 |
| Interest on return of contributions | 0 | 133 |
| Transfer value | 5,135 | 387,588 |
| Administrative expenses | 6,426,209 | 16,262,087 |
| Total payments and other charges | $2,620,669,656 | $2,553,898,136 |
| Closing balance | $46,169,652,261 | $44,157,822,558 |
Canadian Forces Pension Fund Account
(unaudited)
The Canadian Forces Pension Fund Account records contributions received, benefits paid, and other transactions for members under Part I of the Canadian Forces Superannuation Act for service after 31 March 2000. The net contributions are transferred to the Public Sector Pension Investment Board for investment on a monthly basis.
| 2024 | 2023 | |
|---|---|---|
| Opening Balance | $25,027,599 | $(44,282,772) |
| Receipts and other credits | ||
| Member contributions | $662,964,198 | $556,570,765 |
| Employer contributions | 1,060,048,956 | 911,477,803 |
| Transfers from other pension funds | 363,355 | 229,224 |
| Rollovers from RFPF | 6,163,431 | 73,433,781 |
| Repayment of annuity | 504,495 | 487,013 |
| Total receipts and other credits | $1,730,044,435 | $1,542,198,586 |
| Payments and other charges | ||
| Annuities | $1,202,323,444 | $1,070,377,219 |
| Minimum benefit payments | 2,177,371 | 1,898,253 |
| Pension division payments | 32,420,462 | 37,227,798 |
| Pension transfer value | 123,833,368 | 201,579,270 |
| Return of contributions | 1,804,192 | 1,873,549 |
| Transfers to other pension funds | 1,113,376 | 981,337 |
| Administrative expenses | 38,231,256 | 23,950,789 |
| Total payments and other charges | $1,401,903,469 | $1,337,888,215 |
| Transfers to PSPIB | 313,027,599 | 135,000,000 |
| Closing balance | $40,140,966 | $25,027,599 |
Reserve Forces Pension Plan account
(unaudited)
The Reserve Force Pension Fund Account records contributions received, benefits paid, and other transactions for members under Part I.1 of the Canadian Forces Superannuation Act. The net contributions are transferred to the Public Sector Pension Investment Board for investment on a monthly basis.
| 2024 | 2023 | |
|---|---|---|
| Opening Balance | $(110,498,465) | $(98,754,921) |
| Receipts and other credits | ||
| Member contributions | $28,435,887 | $23,859,917 |
| Employer contributions | 63,153,293 | 55,791,151 |
| Actuarial Adjustments | 4,100,000 | 17,400,000 |
| Total receipts and other credits | $95,689,180 | $97,051,068 |
| Payments and other charges | ||
| Annuities | $14,856,756 | $13,203,923 |
| Minimum benefit payments | 207,080 | 86,482 |
| Pension transfer value payment | 12,857,464 | 15,499,113 |
| Return of contributions | 190,391 | 263,045 |
| Transfers to CFPF | 6,163,431 | 73,433,782 |
| Transfers to other pension funds | 32,089 | 0 |
| Administrative expenses | 6,803,085 | 6,308,267 |
| Total payments and other charges | $41,110,296 | $108,794,612 |
| Closing balance | $(55,919,581) | $(110,498,465) |
Retirement Compensation Arrangement Account
(unaudited)
The Retirement Compensation Arrangement (RCA) Account has been established under the authority of the Special Retirement Arrangements Act to provide supplementary benefits to certain pension plan members. The RCA account provides for benefits in excess of those permitted under the Income Tax Act restrictions for registered pension plans. In order to contribute to the RCA, a member must earn in excess of $202,000 during the calendar year 2024 ($196,200 in 2023). This account is discussed in Note 21 of the Financial Statements of the Canadian Forces Pension Plan.
| 2024 | 2023 | |
|---|---|---|
| Opening Balance | $514,800,276 | $498,611,344 |
| Receipts and other credits | ||
| Member contributions | $6,146,852 | $4,520,201 |
| Employer contributions | 38,005,999 | 28,091,137 |
| Interest | 16,188,227 | 16,036,171 |
| Total receipts and other credits | $60,341,078 | $48,647,509 |
| Payments and other charges | ||
| Annuities | $15,303,664 | $13,967,341 |
| Pension division payments | 1,182,762 | $435,173 |
| Return of contributions | 35 | 0 |
| Pension transfer value payments | 1,682,224 | 809,238 |
| Refundable tax | 20,208,142 | 17,246,825 |
| Total payments and other charges | $38,376,827 | $32,458,577 |
| Closing balance | $536,764,527 | $514,800,276 |
Supplemental Death Benefit account
(unaudited)
Decreasing term life insurance benefit equal to twice the annual salary is provided to pension plan members. Coverage decreases by 10 per cent per year starting at age 61, and a minimum amount of coverage of $5,000 is provided at no cost to the pension plan member at age 65 for pension plan members entitled to an immediate annuity, and is maintained for life.
| 2024 | 2023 | |
|---|---|---|
| Opening Balance | $166,641,508 | $169,611,141 |
| Receipts and other credits | ||
| Member contributions | $21,318,424 | $19,925,899 |
| Employer contributionstable 97 note 1 | 3,115,647 | 2,950,202 |
| Interest | 5,012,542 | 5,308,916 |
| Total receipts and other credits | $29,446,613 | $28,185,017 |
| Payments and other charges | ||
| Benefits payments | $34,421,156 | $31,154,650 |
| Total payments and other charges | $34,421,156 | $31,154,650 |
| Closing balance | $161,666,965 | $166,641,508 |
Table 97 Note
|
||
Glossary
- Actuarial assumptions:
- estimates used by actuaries of rates of return on pension plan assets, retirement age, mortality rates, future salary levels, and other factors when carrying out an actuarial valuation.
- Actuarial valuation:
- an actuarial report that provides information on the financial condition of a pension plan such that the future contribution of the pension scheme and its funding level can be clearly understood.
- Annual allowance:
- an annuity that is reduced because it is taken before eligibility for an immediate annuity. In the Canadian Forces Pension Plan, a plan member is eligible for a reduced pension when they are age 50 or older, with at least two years of pensionable service. This type of benefit is only an option when the member is not eligible for an immediate annuity.
Annuities
- Immediate annuity:
- benefit payable to pension plan members who retire at any time after reaching sufficient number of years of pensionable service or CAF service; it is calculated according to the following basic pension formula:
- Canadian Forces Pension Plan:
-
- 2 % times
- Number of years of pensionable service (maximum 35 years) times
- Average salary for the 5 consecutive years of highest-paid service
- Reserve Force Pension Plan:
-
- 1.5 % times
- Total pensionable service
- Deferred annuity:
- benefit available to certain pension plan members who retire before they qualify for an immediate annuity; this benefit is calculated using the same formula as an immediate annuity, but payment of an unreduced annuity is deferred until age 60 (a reduced annuity, or annual allowance, may be taken after age 50).
- Asset backed term note (ABTN):
- long-term notes that are secured by a pool of assets such as real estate, auto loans, or other commercial assets.
- Asset backed commercial paper (ABCP):
- short-term corporate securities, typically with a maturity of less than one year, issued by a bank or other conduit, which are backed by assets such as real estate, auto loans, or other commercial assets.
- Benefits earned:
- the cost of benefits for service provided by members during the fiscal year.
- Benchmark:
- a standard against which rates of return can be measured, such as stock and bond market indexes developed by stock exchanges and investment dealers.
- Canada Pension Plan (CPP):
- a mandatory earnings-related pension plan implemented 1 January 1966, to provide basic retirement income to Canadians between the ages of 18 and 70 who work in all the provinces and territories, except in the province of Québec, where the QPP is operated for persons who work in that province.
- Canadian Forces Pension Fund Account:
- an account established to record transactions relating to service provided by members on or after 31 March 2000.
- Canadian Forces Superannuation Account:
- an account established by the Canadian Forces Superannuation Act to record transactions relating to service prior to 1 April 2000.
- Canadian Forces Superannuation Act:
- the legislation that provides pensions for members of the Canadian Forces.
- Cash equivalents:
- short-term, highly liquid securities (e.g. commercial papers, treasury bills, demand notes) with a term to maturity of less than one year from the date of issue; these investments are relatively easy to convert into cash.
- Children’s annual allowance:
- dependent children who are under age 18 or children between 18 and 25 may receive allowances if they are enrolled in school or other educational institution full-time (s. 18 of the Canadian Forces Superannuation Regulations, s. 25 of the Canadian Forces Superannuation Act and s. 68 of the Reserve Force Pension Regulations). The allowance is equal to a fraction of the pension plan member's pension for each eligible dependent child, to a specified maximum. The fractions and limits are set out, by pension plan, in the Canadian Forces Superannuation Regulations and the Reserve Force Pension Regulations.
- Collateralized debt obligations (CDOs):
- a type of asset backed security that is constructed from a portfolio of fixed-income assets. CDOs are usually divided into several risk levels and corresponding interest payments. Any losses are applied first to the lowest risk ratings, before moving up in seniority.
- Coming into Force (CIF):
- a term for 1 March 2007, when amendments to the Canadian Forces Superannuation Act and new regulations under Pension Modernization became effective. The term is also often used to describe the system, process, and organizational changes that were made at that time to support the new legislation.
- Consumer Price Index (CPI):
- a measure of price changes produced by Statistics Canada on a monthly basis. The CPI measures the retail prices of a "shopping basket" of about 300 goods and services including food, housing, transportation, clothing, and recreation. The index is "weighted," meaning that it gives greater importance to price changes for some products than others—more to housing, for example, than to entertainment—in an effort to reflect typical spending patterns. Increases in the CPI are also referred to as increases in the cost of living.
- Contributions:
- a sum paid by the employer (Government of Canada) and Canadian Armed Forces members to fund future retirement benefits; each year, the government, as the employer, contributes amounts sufficient to fund the future benefits earned by members in respect of that year, as determined by the President of the Treasury Board.
- Contributions receivable:
- amount owing to the pension plan in respect of service provided by members up to the date of the financial statements.
- Currency risk:
- the risk that the value of investments purchased in foreign currency will fluctuate due to changes in exchange rates.
- Defined benefit pension plan:
- a type of registered pension plan that promises a certain level of pension, usually based on the pension plan member's salary and years of service; the Canadian Forces Pension Plan and the Reserve Force Pension Plan are defined benefit pension plans.
- Derivatives:
- financial contracts that derive their value from an underlying asset or index, such as an interest rate or foreign currency exchange rate. Derivatives can be less expensive and easier to acquire than the underlying assets. They can be used to manage risk, reduce cost, and enhance returns.
- Elective service:
- any period of qualifying employment, either in the Canadian Forces Reserve Forces, Public Service, or Royal Canadian Mounted Police that occurred before the employee became a contributor to either the Canadian Forces Pension Plan or Reserve Force Pension Plan; under certain conditions, the pension plan member may be able to count these periods of prior service as pensionable service.
- Excess (shortfall):
- the financial status of the pension plan; a positive amount indicates that the pension plan’s assets available for benefits exceed pension obligations, while a negative amount means that pension obligations exceed net assets available for benefits.
- Experience gains and losses:
- the difference between what has occurred and what was anticipated in the actuarial valuations.
- Foreign currency risk:
- the risk that an investment’s value will be affected by changes in exchange rates. International investments cause investors to face the risk of currency fluctuations.
- Indexation:
- automatic adjustment of pensions in accordance with changes in the Consumer Price Index in order to maintain their purchasing power.
- Minimum benefit:
- a benefit equal to the payment of the Canadian Forces Pension Plan member's pension for a period of five years; if the Canadian Forces Pension Plan member or his or her eligible survivors have not received, in total, pension payments equal to five times the amount of the Canadian Forces Pension Plan member's annual basic pension, the balance in the form of a lump sum becomes payable to his or her designated beneficiary or, if none, to his or her estate. Minimum benefits under the Reserve Force pension plan are subject to the provisions of the Reserve Force Pension Regulations.
- Net assets available for benefits:
- the cash, receivables, investments, and other accounts net of liabilities available for benefits expected to be paid in the future; for the purposes of this definition, the pension plan's liabilities do not include accrued pension benefits.
- Past service:
- service provided by members prior to the start of the current fiscal year.
- Pensionable service:
- periods upon which the plan member’s lifetime retirement benefits are based, including any periods of elective service, regardless of whether he or she has paid fully for those service periods.
- Pension obligations:
- the present value of benefits earned by members under the pension plan for pensionable service to date.
- Public Sector Pension Investment Board:
- a crown corporation established on 1 April 2000, under the Public Sector Pension Investment Board Act whose mandate is to invest the employer's and employees' pension contributions for the four major public sector pension plans in the financial markets.
- Québec Pension Plan (QPP):
- a pension plan, similar to the Canada Pension Plan, that covers persons working in the province of Québec, which is administered by the Régie des rentes du Québec.
- Return of contributions:
- benefit available to certain pension plan members who retire before reaching sufficient number of years of pensionable service to qualify for an immediate or deferred annuity under the Canadian Forces Pension Plan; it comprises employee contributions, plus interest if applicable.
- Standard and Poor’s (S&P)/Toronto Stock Exchange (TSX) Equity Index:
- the most diversified Canadian market index representing almost 90 per cent of the capitalization of Canadian-based companies listed on the TSX, excluding income trusts. A committee of the TSX and S&P selects companies for inclusion in the S&P/TSX Equity Index.
- S&P 500 Composite Index:
- a U.S. index consisting of 500 stocks chosen for market size, liquidity, and industry group representation. It is a market-value-weighted index (stock price times number of shares outstanding), with each stock's weight in the index proportionate to its market value; the Standard and Poor's Company selects stocks for inclusion in the index.
- Statement of Investment Policies, Standards and Procedures (“Policy” or SIP&P):
- a written investment policy approved by the Public Service Pension Investment Board’s Board of Directors, and reviewed at least annually, relating to each pension plan fund. It addresses matters such as categories of investments; use of derivative products; asset diversification and expected investment returns; management of credit, market, and other financial risks; liquidity of investments; lending of cash and securities; evaluation of investments that are not regularly traded on a public exchange; and the exercise of any voting rights that PSPIB has on behalf of the pension plans through its investments.
- Supplementary death benefit:
- decreasing term life insurance benefit equal to twice the annual salary of the pension plan member; coverage decreases by 10 per cent per year starting at age 61; a minimum amount of coverage ($5,000) is provided at no cost to the pension plan member at age 65 for pension plan members entitled to an immediate annuity, and is maintained for life.
- Survivor:
- the person of the same or opposite sex who, at the time of the contributor's death and before his or her retirement:
- was married to the contributor (pension plan member) when the contributor reach age 60; or
- was cohabitating in a relationship of a conjugal nature with the contributor for at least one year and, if the contributor was over age 60, had cohabited continuously with the contributor since before the contributor reached age 60
- Survivor allowance:
- a pension benefit that is paid to the spouse of a pension plan member who dies. Under the Canadian Forces Pension Plan, the benefit is payable when the pension plan member has two or more years of service.
- Transfer value:
- the present value of a pension plan member’s earned pension in today’s dollars, payable as a lump-sum if the member is under age 50 with two or more years of service. The calculation is based on a set of actuarial assumptions which include economic and demographic assumptions. The value represents the amount of money that will need to be invested today in order to receive payment equivalent to their deferred annuity at age 60.
- Value-at-Risk (VaR):
- a method used to measure market risk. VaR is the maximum loss not exceeded within a given probability (defined as the “confidence level”), over a given period of time.
- Year's Maximum Pensionable Earnings (YMPE):
- the maximum amount of earnings that the Government sets each year and uses to calculate contributions and pensions under the Canada Pension Plan/Québec Pension Plan. Annual changes to this amount are based on increases in the average Canadian wages.
Contact Information
Canadian Armed Forces Pension Centre
- Telephone
-
Monday to Friday
7 am to 5 pm (Eastern time)
Outside Canada and the United States
613-946-1093 (collect calls accepted)
Monday to Friday 8:00 am to 4:00 pm (Eastern time)
- In writing
Public Services and Procurement Canada
Government of Canada Pension Centre—Mail Facility
PO Box 9500
Matane QC G4W 0H3
Note: Always include your pension number or service number when writing to us.
Directorate of Pensions and Social Programs (Department of National Defence) (DND Internal only)
Public Service Pension Investment Board
Office of the Superintendent of Financial Institutions Canada