
Canada Revenue Agency Quarterly Financial Report
For the quarter ended September 30, 2021
Statement outlining results, risks and significant changes in operations, personnel and program
Introduction
This quarterly financial report has been prepared by management as required by section 65.1 of the Financial Administration Act in the form and manner prescribed by the Treasury Board. This report should be read in conjunction with the Main Estimates (external link).
Further details on the Canada Revenue Agency’s (CRA) program activities can be found in the Departmental Plan.
Basis of presentation
This quarterly report has been prepared using an expenditure basis of accounting. The accompanying Statement of Authorities includes the CRA's spending authorities granted by Parliament and those used by the CRA consistent with the Main Estimates for the 2021-2022 fiscal year. This quarterly report has been prepared using a special purpose financial reporting framework designed to meet financial information needs with respect to the use of spending authorities.
The authority of Parliament is required before moneys can be spent by the government. Approvals are given in the form of annually approved limits through appropriation acts or through legislation of statutory spending authority for specific purposes.
The CRA uses the full accrual method of accounting to prepare and present its annual departmental financial statements that are part of the departmental performance reporting process. However, the spending authorities voted by Parliament remain on an expenditure basis.
This quarterly report has not been subject to an external audit or review.
Highlights of fiscal quarter and fiscal year to date (YTD) results
Impact of the pandemic on authorities available for use
Full supply of the CRA’s 2021-2022 Main Estimates was approved on June 21, 2021 and 100% of the annual authorities are available for use. However, full supply of 2020-2021 Main Estimates was approved on December 14, 2020. Therefore, at Q2 2020-2021, only interim supply of Main Estimates was available for use, which included 9/12 (approximately 75%) of Vote 1 and Vote 5, 100% of authorities from the prior fiscal year, and 100% of statutory authorities.
To compare authorities on the same basis, the variances in authorities that are identified and explained in this report are based on full supply received in 2021-2022 compared to what full supply would have been had it been received in Q2 2020-2021. In addition, only the material variances, based on professional judgement, between authorities and expenditures when compared to the prior fiscal year, are identified and explained.
1. Analysis of authorities
This report reflects the results for the current fiscal year in relation to the Main Estimates, authorities available for use from the prior fiscal year, and Supplementary Estimates A.
As shown in the restated table below, the CRA’s total Budgetary Authorities would have increased by $3,337 million if full supply had been released in Q2 2020-2021, from $8,228 million in 2020-2021, to $11,565 million in 2021-2022.
| (in thousands of dollars) | Total available for use for the year ending March 31, 2022table 1 note 1 | Total available for use for the year ending March 31, 2021 if full supply had been released | Variance in budgetary authorities |
|---|---|---|---|
| Gross Vote 1 – Operating Expenditures | 4,831,784 | 4,142,432 | 689,352 |
| Revenue Credited to the Vote | (429,530) | (390,697) | (38,833) |
| Vote 5 – Capital Expenditures | 89,892 | 83,900 | 5,992 |
| Budgetary Statutory Authorities | 7,072,913 | 4,392,186 | 2,680,727 |
| Total Budgetary Authorities | 11,565,058 | 8,227,821 | 3,337,237 |
Table 1 Notes
|
|||
The Vote 1 Gross Operating Expenditures Authority would have increased by $689 million if full supply had been released in 2020-2021, from $4,142 million that year to $4,832 million in 2021-2022.
The items that have a material impact on Vote 1 Gross Operating Expenditure Authority include:
- $226 million increase in authorities related to the settlement of the Public Service Alliance of Canada Union of Taxation Employees (PSAC-UTE) and the Professional Institute of the Public Service of Canada (PIPSC) collective agreements;
- $197 million increase in authorities available for use from the prior fiscal year;
- $137 million increase in authorities to fulfill the CRA’s administrative responsibilities in support of the Canada Pension Plan (CPP) and Employment Insurance (EI) program; and
- $115 million increase in authorities for subsidies administered by the CRA as part of Canada’s COVID-19 Economic Response Plan for the Canada Emergency Wage Subsidy (CEWS), the Canada Emergency Rent Subsidy (CERS), and the 10% Temporary Wage Subsidy.
The Revenue Credited to the Vote is what the CRA expects to spend to fulfill its administrative responsibilities in support of the CPP and EI program. In 2021-2022, the CRA expects to spend $430 million compared to $391 million in 2020-2021 (full supply), an increase of $39 million. This increase pertains to adjustments related to the PSAC-UTE collective agreement and the annual volume adjustment. The increase in Vote 1 Gross Operating Expenditure Authority is offset by an equivalent increase in revenues recovered from the CPP and EI Accounts.
The Vote 5 Capital Expenditures Authority would have increased by $6 million if full supply had been released in 2020-2021, from $84 million that year to $90 million in 2021-2022. The majority of the $6 million increase is due to an increase in authorities for the administration of Canada’s COVID-19 Economic Response Plan, specifically CEWS.
Total Budgetary Statutory Authorities increased by $2,681 million, from $4,392 million in 2020-2021 to $7,073 million in 2021-2022. The CRA received full supply of its Budgetary Statutory Authorities in 2020-2021 as of Q2. $2,451 million of the increase are new Climate Action Incentive (CAI) payments, due to an increased forecast provided by the Department of Finance which reflects the increases in the prices on carbon pollution under the federal carbon pollution pricing system.
2. Analysis of Expenditures
A two-year comparison of the CRA's annual net authorities available for use against the CRA’s second quarter expenditures and year-to-date expenditures as at September 30 is presented in Figure 1.
Certain components of the quarterly year-over-year expenditure variances are attributable to timing differences in invoices and payments, which will be resolved by the end of the fiscal year.
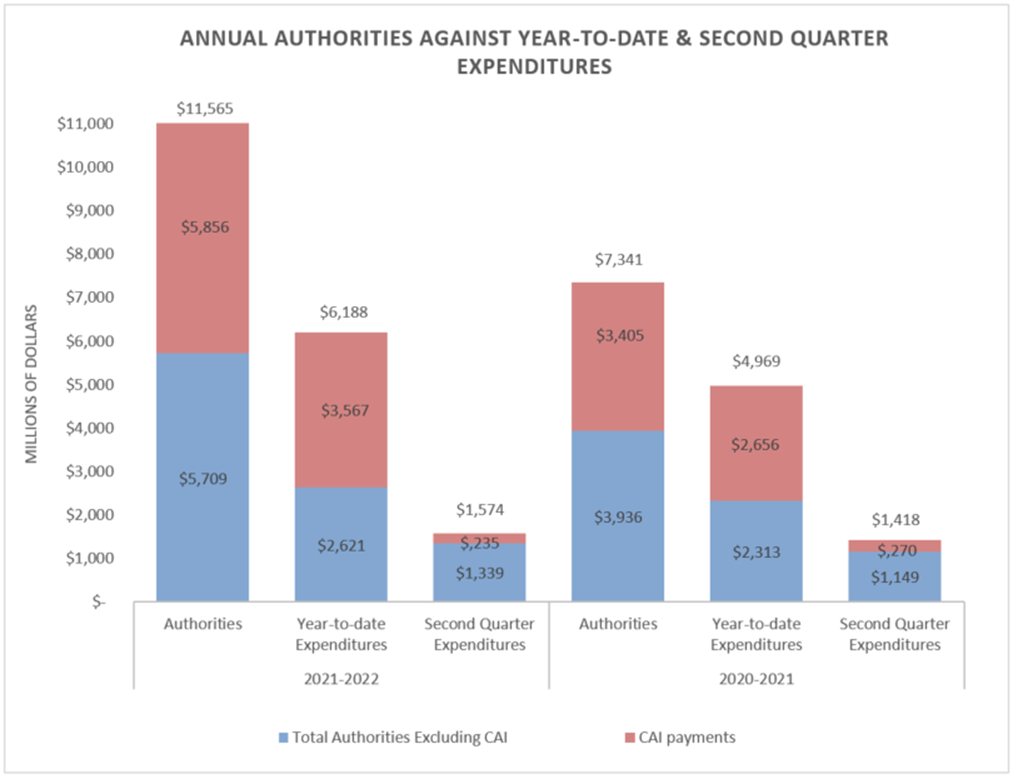
This graphic provides a two-year comparison of the Agency’s annual authorities available for use as of September 30 against year-to-date and second quarter expenditures for 2021-2022 and 2020-2021. In 2021-2022, the Agency’s annual authorities available for use were $11,565M, while year-to-date and second quarter expenditures were $6,188M and $1,574. In comparison, 2020-2021 annual authorities available for use were $7,341M, while year-to-date and second quarter expenditures were $4,969M and $1,418M. This graphic also shows the portion of authorities and expenditures related to Climate Action Incentive (CAI) payments. In 2021-22, $5,856M of the annual authorities, $3,567M of year-to-date expenditures, and $235M of second quarter expenditures were related to CAI payments. Comparatively, in 2020-21, $3,405M of the annual authorities, $2,656M of year-to-date expenditures, and $270M of second quarter expenditures were related to CAI payments.
-
Figure 1 – details
Figure 1: Annual authorities against year-to-date and second quarter expenditures - 2021-2022 2020-2021 Authorities - Excluding CAI $5,709,060 $3,935,868 Authorities - CAI Payments $5,856,000 $3,405,000 Year-to-date Expenditures - Excluding CAI $2,621,424 $2,313,182 Year-to-date Expenditures - CAI Payments $3,566,830 $2,656,000 Second Quarter Expenditures - Excluding CAI $1,338,851 $1,148,568 Second Quarter Expenditures - CAI Payments $234,897 $269,688 Note 1: The 2020-2021 authorities represent interim supply, which includes 9/12 of Vote 1 (including CPP/EI) and Vote 5, 100% of authorities available for use from the prior fiscal year and 100% of statutory authorities.
2.1 Expenditures by Authority
As displayed in the Statement of Authorities, the year-over-year second quarter expenditures have increased by $155 million, and year-to-date expenditures have increased by $1,219 million. The material components of these year-over-year changes are presented below.
As the explanations for the year-over-year second quarter variances are often similar to the variances, only the year-to-date variances are explained in detail.
| (in thousands of dollars) | Year to date used at September 30, 2021 table 2 note 1 | Year to date used at September 30, 2020 | Variance in year to date expenditures |
|---|---|---|---|
| Net Vote 1 – Operating Expenditures | 2,035,718 | 1,721,666 | 314,052 |
| Vote 5 – Capital Expenditures | 29,077 | 27,206 | 1,871 |
| Budgetary Statutory Authorities | 4,123,459 | 3,220,310 | 903,149 |
| Total Budgetary Authorities | 6,188,254 | 4,969,182 | 1,219,072 |
Table 2 Notes
|
|||
The CRA’s year-over-year net Vote 1 Operating Expenditures have increased by $233 million, or 29%, when compared to the second quarter, and by $314 million, or 18%, on a year-to-date basis. The year-to-date increase is composed of a $296 million increase in salary expenditures and an $18 million increase in operations and maintenance expenditures (O&M). The items that have a material impact on the year-to-date increase in salary and O&M expenditures include:
Salary expenditures
- $113 million increase related to the settlement of the PSAC-UTE collective agreement in 2020-2021;
- $66 million increase related to spending on Budget 2021 initiatives;
- $33 million increase is due to timing differences in billing for spending of revenues received; therefore, fewer expenditures have been transferred out of the Operating Vote to the Statutory Vote; and
- The majority of the remaining $84 million increase is primarily related to the implementation and administration of the measures in Canada’s COVID-19 Economic Response Plan, including the CEWS, the CERS, and the 10% Temporary Wage Subsidy; as well as an increase in expenditures related to previous federal budget measures.
O&M expenditures
- $11 million of the $18 million year-to-date increase in O&M expenditures is primarily related to an increase in the legal services forecast from the Department of Justice for 2021-2022; the increase is a direct result of the measures funded in the Fall Economic Statement 2020.
- The remainder of the year-to-date increase in O&M expenditures is related to an increase in training and real property services.
The CRA’s year-over-year Budgetary Statutory Authorities have decreased by $78 million when compared to the second quarter, and increased by $903 million on a year-to-date basis.
- $35 million of the year-over-year second quarter decrease relates to the timing of CAI payments; and
- $911 million of the year-to-date increase relates to changes in the amount of CAI payments, which is offset by $8 million of net decreases in other statutory items.
2.2 Expenditures by Standard Object
The Departmental Budgetary Expenditures by Standard Object table illustrates the increase in the CRA’s second quarter expenditures by standard object. As the explanations for the year-over-year second quarter variances are often similar to the year-to-date variances, only the year-to-date variances are explained in detail.
The material components of the year-to-date changes are presented below.
The year-over-year personnel expenditures have increased by $184 million, or 20%, when compared to the second quarter, and by $335 million, or 18%, on a year-to-date basis. The items that have a material impact on the year-to-date increase in personnel expenditures include:
- $113 million increase related to the settlement of the PSAC-UTE collective agreement in 2020-2021;
- $66 million increase related to spending on Budget 2021 initiatives;
- $33 million increase is due to timing differences in billing for spending of revenues received; therefore, fewer expenditures have been transferred out of the Operating Vote to the Statutory Vote; and
- The majority of the remaining $84 million increase is primarily related to the implementation and administration of the measures in Canada’s COVID-19 Economic Response Plan, including the CEWS, the CERS, and the 10% Temporary Wage Subsidy; as well as an increase in expenditures related to previous federal budget measures.
The year-over-year transportation and communication expenditures have decreased by $3 million, or 13%, when compared to the second quarter, and by $16 million, or 29%, on a year-to-date basis. The items that have a material impact on the year to date increase in transportation and communications expenditures are a result of COVID-19 on the CRA’s operations and include:
- $12 million decrease relates to postal services expenditures, which is due to the enhanced Canada Child Benefit and GST/HST credit payments that were mailed out in 2020-2021; and
- $3 million decrease relates to travel expenditures.
The year-over-year professional and special services expenditures have increased by $23 million, or 19%, when compared to the second quarter, and by $23 million, or 12%, on a year-to-date basis. The items that have a material impact on the year-to-date increase in professional and special services expenditures include:
- $11 million increase in the legal services forecast from the Department of Justice for 2021-2022;
- $6 million increase relates to IT and other consulting services; and
- $3 million increase relates to training and course fees.
The year-over-year rentals expenditures have decreased by $4 million, or 5%, when compared to the second quarter, and by $15 million, or 9%, on a year-to-date basis. The majority of the year-to-date decrease relates to the timing of expenditures posted for accommodation and real property services, and most of the variance will be resolved by year end.
The year-over-year purchased repair and maintenance expenditures have increased by $12 million when compared to the second quarter, and by $23 million on a year-to-date basis. The majority of the year-to-date increase is as a result of the timing of expenditures posted for accommodation and real property services and most of the variance will be resolved by year end. The remainder of the increase is related to costs for a list of planned real property projects.
The year-over-year acquisition of machinery and equipment expenditures have increased by $5 million, or 53%, when compared to the second quarter, and decreased by $8 million, or 28%, on a year-to-date basis. The year-to-date decrease is a result of the large amount of personal office equipment, primarily computer equipment, that the CRA purchased in the first quarter of 2020-2021 in order to expand remote working capabilities.
The year-over-year transfer payments have decreased by $40 million, or 11%, when compared to the second quarter, and increased by $909 million, or 32%, on a year-to-date basis. The year-to-date increase is primarily attributable to changes in the amount of CAI payments.
The year-over-year other subsidies and payments have increased by $1 million when compared to the second quarter, and by $10 million on a year-to-date basis. Almost the entire year-to-date increase is attributable to an increase in court awards paid in the first quarter of 2021-2022.
Risks and uncertainties
The CRA dedicates significant effort to managing risk at the enterprise level by conducting regular environmental scans and maintaining a Corporate Risk Profile (CRP). The Board of Management monitors and senior management receives regular updates on the CRA’s CRP, which has now been re-designed to be more flexible, relevant, and timely through quarterly risk reporting, and includes assessing the internal and external environment. The key risks to be monitored as we continue to deal with the pandemic are employee health, well-being, and safety; service experience; reputation management; and external and internal cybersecurity. These top tier risks are explained in greater detail, as follows.
Employee health, well-being, and safety
As a result of the COVID-19 pandemic, the increased risk associated with employee health, well being and safety has been at the centre of all decisions. The CRA is mitigating this risk by having the majority of CRA employees continue to work remotely while also actively planning for post-pandemic work arrangements. In addition, over the past 18 months, the CRA focused on initiatives that supported employees, such as the Employee Assistance Program, fitness challenges, and virtual wellness fairs. The CRA also enhanced communication with employees with respect to its transition towards a hybrid model of working and the sharing of mental health resources.
Service experience
There is a risk that the CRA's services and client interactions will not meet the expectations of those it serves, both externally and internally. As the Government of Canada’s response to the COVID-19 pandemic continues, existing federal relief measures were extended. Some of the key federal relief measures that the CRA is responsible for are the Canada Recovery Benefit (CRB), the Canada Recovery Sickness Benefit (CRSB), the CERS, the CEWS and the Canadian Recovery Hiring Program (CRHP). The CRA has been charged with the responsibility of promptly delivering these benefits to millions of Canadians. As such, the risk of service experience is being closely monitored to ensure the CRA continues to improve the client experience through people-centric design and delivery of programs and services while successfully delivering its broader mandate of tax and benefits administration.
Reputation management
It is important that public trust and the CRA’s reputation for fairness be upheld, and that efforts be deployed to ensure communications and interactions with all stakeholders are effective, coordinated, and responsive, particularly in the administration of COVID-19 emergency measures.
Cybersecurity
There is a risk that external cyber threats or internal vulnerabilities will compromise CRA IT systems, services, and/or taxpayer information. Cybersecurity and the protection of personal information have shown a consistent upward trend in risk exposure for the past five years in most organizations. This is due to the increased prevalence and sophistication of cyber threats, as well as the emergence of new threats. In addition, there are increasing global cybersecurity issues, such as fraud, identity theft, and ransomware attacks, to which the CRA is not immune. The CRA continues to take action to ensure that its cybersecurity and data protection posture keeps pace with the changing environment.
COVID-19
The CRA continues to administer the following emergency measures and recovery benefits to help Canadians and businesses facing hardship as a result of COVID-19:
- Canada Recovery Benefit (CRB)
- Canada Recovery Caregiving Benefit (CRCB)
- Canada Recovery Sickness Benefit (CRSB)
- Canada Emergency Rent Subsidy (CERS)
- Canada Emergency Wage Subsidy (CEWS)
- Canadian Recovery Hiring Program (CRHP)
To continue to deliver on these and other emergency measures, the CRA is seeking funding through Supplementary Estimates “C” for the extension of the CERS, the CEWS, the CRB, the CRCB, and the CRSB, as well as for the CRHP, and for the other changes to the COVID-19 measures announced in October 2021.
The COVID-19 pandemic and resulting emergency measures to combat the spread of the virus have had significant impacts on the CRA's operations. The COVID-19 travel restrictions continue to keep the CRA’s operational travel low in Q2 of 2021-2022.
Significant changes in relation to operations, personnel, and programs
As of January 2021, all CRA core programs and activities have largely resumed. The CRA also continues to administer COVID-19 federal relief measures. A number of employees have been hired or reassigned to administer COVID-19 benefits and respond to public enquiries related to Canada’s COVID-19 Economic Response Plan. Since the beginning of the pandemic up to September 30, 2021, the CRA has processed 4.5 million CEWS, 1.7 million CERS, 27 million CRB, 7 million CRCB, 1.4 million CRSB, and 13,000 CRHP applications to provide support to millions of Canadians.
Approval by Senior Officials
Approved by:
[original signed by]
________________________
Bob Hamilton, Commissioner
[original signed by]
_____________________________
Janique Caron, Chief Financial Officer
Ottawa, Canada
Date:
| Total available for use for the year ending March 31, 2022table 3 note 1 | Used during the quarter ended September 30, 2021 |
Year-to-date used at quarter-end | |
|---|---|---|---|
| Vote 1 - Operating expenditures | |||
| Gross Operating expenditures | 4,831,784 | 1,140,308 | 2,272,812 |
| Revenues netted against expenditures | (429,530) | (118,547) | (237,094) |
| Net Vote 1 - Operating expenditures | 4,402,254 | 1,021,761 | 2,035,718 |
| Vote 5 - Capital expenditures | 89,892 | 18,065 | 29,077 |
| Budgetary Statutory Authorities | |||
| Contributions to employee benefit plans | 539,500 | 121,202 | 242,404 |
| Children's Special Allowance payments (Children's Special Allowances Act) | 373,000 | 94,892 | 192,191 |
| Climate Action Incentive payments | 5,856,000 | 234,897 | 3,566,830 |
| Spending of revenues received through the conduct of its operations pursuant to section 60 of the Canada Revenue Agency Act | 279,323 | 91,800 | 108,533 |
| Distribution of Fuel and Excess Emission Charges | 25,000 | (8,943) | 3,105 |
| Minister's salary and motor car allowance | 91 | 23 | 45 |
| Collection Agency Fees under section 17.1 of the Financial Administration Act | - | - | 0 |
| Court awards - Supreme Court | - | - | - |
| Court awards - Tax Court of Canada | - | 38 | 10,315 |
| Spending proceeds from the disposal of surplus Crown Assets | - | 14 | 36 |
| Energy Cost Benefit | - | (1) | (2) |
| Total Budgetary Statutory Authorities | 7,072,914 | 533,922 | 4,123,459 |
| Total Budgetary Authorities | 11,565,060 | 1,573,748 | 6,188,254 |
Table 3 Notes
|
|||
| Total available for use for the year ending March 31, 2021Table 4 note 1 Table 4 note 2 | Used during the quarter ended September 30, 2020 |
Year-to-date used at quarter-end | |
|---|---|---|---|
| Vote 1 - Operating expenditures | |||
| Gross Operating expenditures | 3,176,336 | 886,941 | 1,917,145 |
| Revenues netted against expenditures | (293,024) | (97,739) | (195,479) |
| Net Vote 1 - Operating expenditures | 2,883,312 | 789,202 | 1,721,666 |
| Vote 5 - Capital expenditures | 65,370 | 17,058 | 27,206 |
| Budgetary Statutory Authorities | |||
| Contributions to employee benefit plans | 451,936 | 112,984 | 225,968 |
| Children's Special Allowance payments (Children's Special Allowances Act) | 361,000 | 91,474 | 196,636 |
| Climate Action Incentive payments | 3,405,000 | 269,688 | 2,656,000 |
| Spending of revenues received through the conduct of its operations pursuant to section 60 of the Canada Revenue Agency Act | 174,160 | 137,767 | 141,230 |
| Minister's salary and motor car allowance | 89 | 22 | 45 |
| Collection Agency Fees under section 17.1 of the Financial Administration Act | - | - | - |
| Court awards - Supreme Court | - | - | 3 |
| Court awards - Tax Court of Canada | - | 39 | 408 |
| Spending proceeds from the disposal of surplus Crown Assets | - | 21 | 21 |
| Energy Cost Benefit | - | 1 | (1) |
| Refunds of previous years revenue | - | - | - |
| Total Budgetary Statutory Authorities | 4,392,186 | 611,996 | 3,220,310 |
| Total Budgetary Authorities | 7,340,868 | 1,418,256 | 4,969,182 |
Table 4 Notes
|
|||
| Planned expenditures for the year ending March 31, 2022 | Expended during the quarter ended September 30, 2021 | Year-to-date used at quarter-end | |
|---|---|---|---|
| Expenditures: | |||
| Personnel | 4,288,574 | 1,105,600 | 2,196,978 |
| Transportation and communications | 242,277 | 18,527 | 38,304 |
| Information | 35,374 | 2,288 | 4,812 |
| Professional and special services | 681,237 | 142,185 | 218,448 |
| Rentals | 303,960 | 72,424 | 141,878 |
| Purchased repair and maintenance | 61,906 | 14,014 | 26,239 |
| Utilities, materials and supplies | 37,417 | 1,380 | 3,810 |
| Acquisition of machinery and equipment | 86,951 | 13,482 | 19,134 |
| Transfer payments | 6,256,693 | 320,844 | 3,762,124 |
| Other subsidies and payments | 200 | 1,550 | 13,619 |
| Total Gross Budgetary Expenditures | 11,994,590 | 1,692,295 | 6,425,348 |
| Less: Revenues netted against expenditures | 429,530 | 118,547 | 237,094 |
| Total Net Budgetary Expenditures | 11,565,060 | 1,573,748 | 6,188,254 |
| Planned expenditures for the year ending March 31, 2021 | Expended during the quarter ended September 30, 2020 | Year-to-date used at quarter-end | |
|---|---|---|---|
| Expenditures: | |||
| Personnel | 2,900,732 | 921,835 | 1,862,162 |
| Transportation and communications | 176,090 | 21,293 | 53,935 |
| Information | 5,010 | 3,147 | 4,936 |
| Professional and special services | 452,739 | 119,016 | 195,734 |
| Rentals | 211,649 | 76,160 | 156,769 |
| Purchased repair and maintenance | 50,243 | 2,479 | 2,890 |
| Utilities, materials and supplies | 26,566 | 1,986 | 5,203 |
| Acquisition of machinery and equipment | 44,624 | 8,830 | 26,754 |
| Transfer payments | 3,766,000 | 361,163 | 2,852,635 |
| Other subsidies and payments | 240 | 86 | 3,643 |
| Total Gross Budgetary Expenditures | 7,633,892 | 1,515,995 | 5,164,661 |
| Less: Revenues netted against expenditures | 293,024 | 97,739 | 195,479 |
| Total Net Budgetary Expenditures | 7,340,868 | 1,418,256 | 4,969,182 |