
Canada Revenue Agency Quarterly Financial Report For the quarter ended December 31, 2024
Statement outlining results, risks and significant changes in operations, personnel and program
Introduction
This quarterly financial report has been prepared by management as required by section 65.1 of the Financial Administration Act in the form and manner prescribed by the Treasury Board. This report should be read in conjunction with the Main Estimates.
Further details on the program activities of the Canada Revenue Agency (CRA) can be found in the Departmental Plan.
Basis of Presentation
This quarterly report has been prepared by management using an expenditure basis of accounting. The accompanying Statement of Authorities includes the CRA's spending authorities granted by Parliament and those used by the CRA consistent with the Main Estimates for the 2024-2025 fiscal year. This quarterly report has been prepared using a special purpose financial reporting framework designed to meet financial information needs with respect to the use of spending authorities.
The authority of Parliament is required before moneys can be spent by the government. Approvals are given in the form of annually approved limits through appropriation acts or through legislation of statutory spending authority for specific purposes.
The CRA uses the full accrual method of accounting to prepare and present its annual departmental financial statements that are part of the departmental performance reporting process. However, the spending authorities voted by Parliament remain on an expenditure basis.
This quarterly report has not been subject to an external audit or review.
Highlights of the fiscal year-to-date (YTD) results
Figure 1 below reflects the CRA's annual net authorities available for use, as well as the CRA’s YTD expenditures as at December 31, 2024.
The CRA’s annual net authorities and YTD expenditures have increased primarily due to the new Distribution of Fuel Charges to Small Businesses initiative and the Canada Carbon Rebate (CCR). Further analysis of authorities and expenditures is presented below.
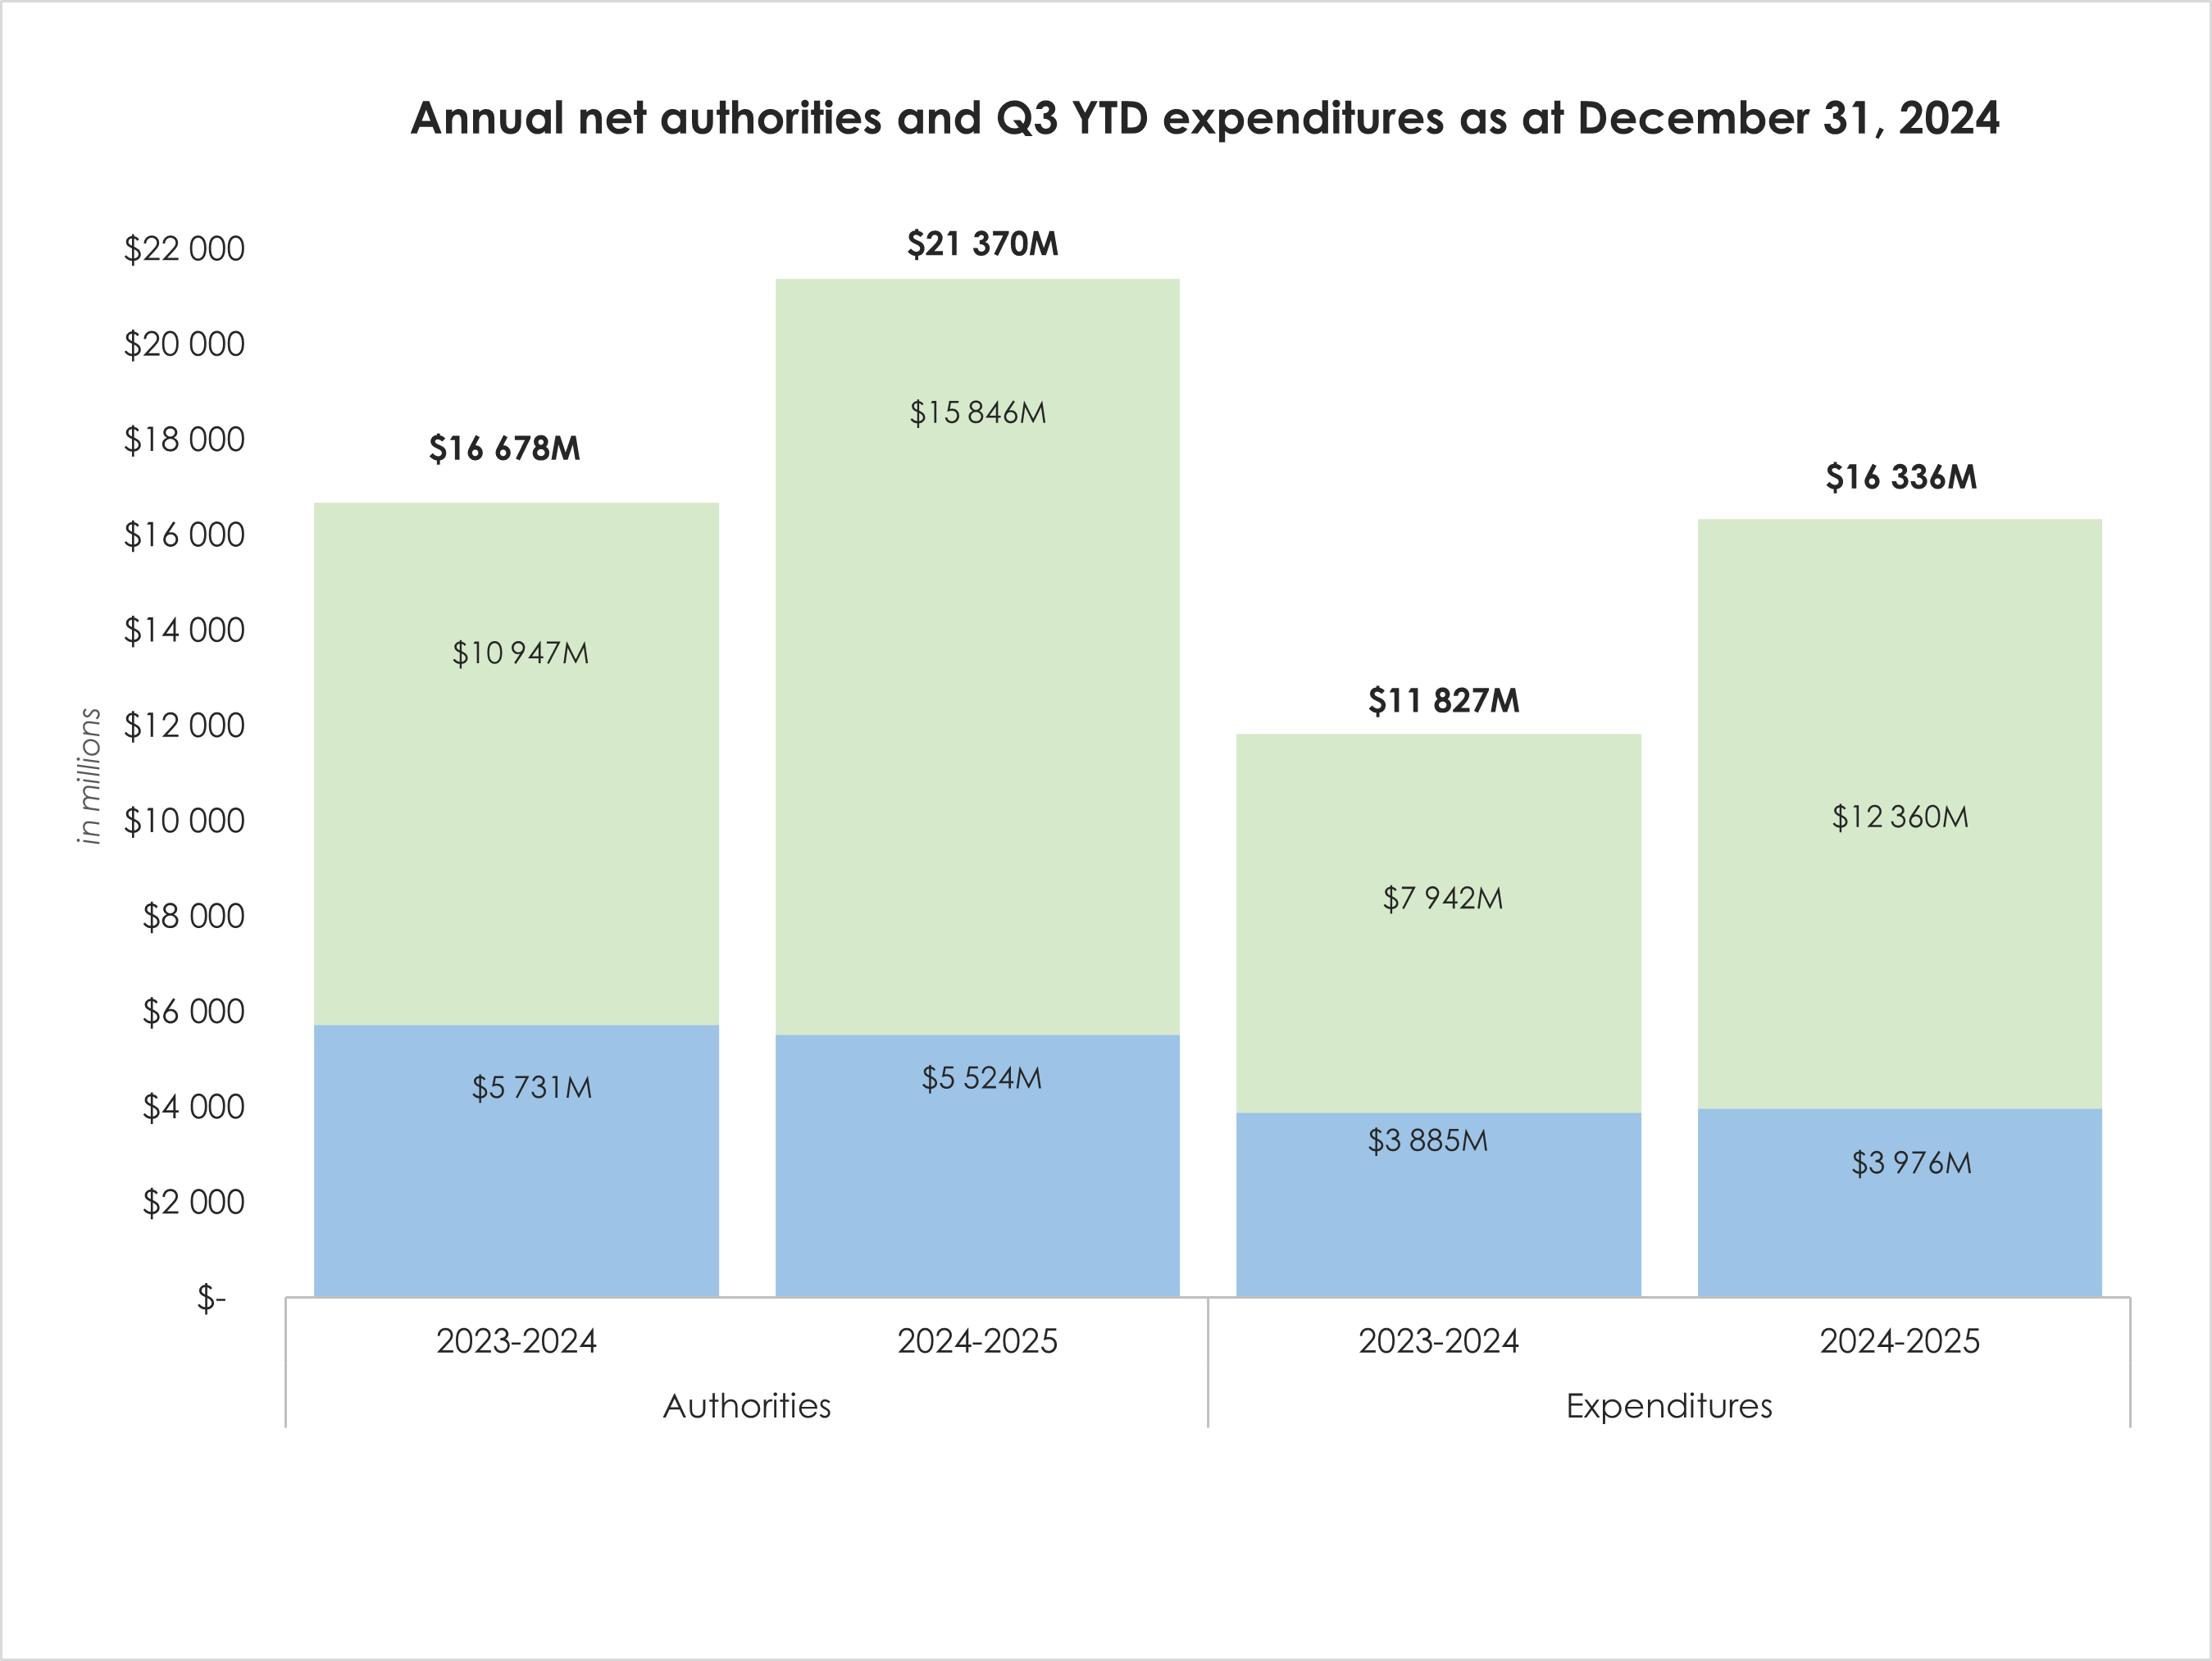
Title - Figure 1: Annual net authorities and YTD expenditures as at December 31, 2024.
Description: The Agency’s annual authorities available for use as of December 31 and cumulative expenditures for 2023-2024 and 2024‑2025
Figure 1 – details
| Authority/Expenditure | Year | Total Excluding Statutory Authorities | Statutory Authorities | Total |
|---|---|---|---|---|
Authorities |
2023-2024 |
$ 5 730 637 |
$ 10 947 757 |
$ 16 678 394 |
Authorities |
2024-2025 |
$ 5 524 135 |
$ 15 846 227 |
$ 21 370 362 |
Expenditures |
2023-2024 |
$ 3 885 388 |
$ 7 942 204 |
$ 11 827 592 |
Expenditures |
2024-2025 |
$ 3 976 031 |
$ 12 360 096 |
$ 16 336 127 |
Note 1: Amounts in Figure 1 may not correspond exactly to amounts listed in the report due to rounding.
Note 2: Statutory authorities include the CCR, Distribution of Fuel Charges – Provinces and Territories, Distribution of Fuel Charges – Farming Businesses, Distribution of Fuel Charges – Small Businesses, Contributions to employee benefit programs, Children’s Special Allowance payments, spending of revenues received, and the Minister’s salary and motor car allowance.
YOY analysis of authorities
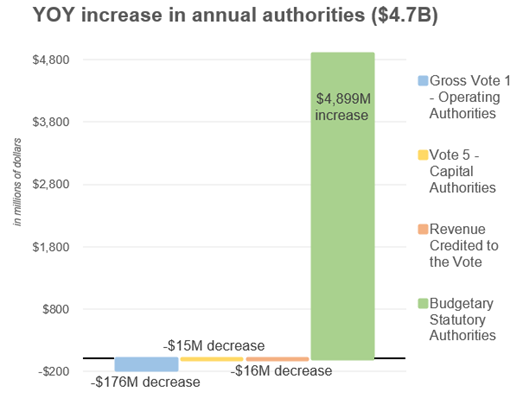
This report reflects the results for the current fiscal year in relation to the Main Estimates, authorities available for use from the prior fiscal year and Supplementary Estimates (B). As shown in the summarized table below, the CRA’s total Budgetary Authorities have increased by $4,692M ($4.7B) since the third quarter of 2023-2024, from $16,678M ($16.7B) in 2023-2024, to $21,370M ($21.4B) in 2024-2025.
| (in millions of dollars) | Total available for use for the year ending March 31, 2025 | Total available for use for the year ending March 31, 2024 | Variance in budgetary authorities |
|---|---|---|---|
Budgetary Statutory Authorities |
$15,846M |
$10,947M |
$4,899M |
The increase in Budgetary Statutory Authorities is primarily due to the following:
|
|||
Gross Vote 1 – Operating Authorities |
$5,866M |
$6,042M |
($176M) |
The decrease in Gross Vote 1 Operating Authorities is primarily related to the following:
|
|||
Vote 5 – Capital Authorities |
$143M |
$158M |
($15M) |
The decrease in Vote 5 Capital Authorities is primarily related to the following:
|
|||
Revenue Credited to the Vote (RCV) |
($485M) |
($469M) |
($16M) |
The increase in RCV is primarily related to the increased pay rates in the new collective agreements |
|||
Total Budgetary Authorities |
$21,370M ($21.4B) |
$16,678M ($16.7B) |
$4,692M ($4.7B) |
YOY analysis of expenditures
Expenditures by vote
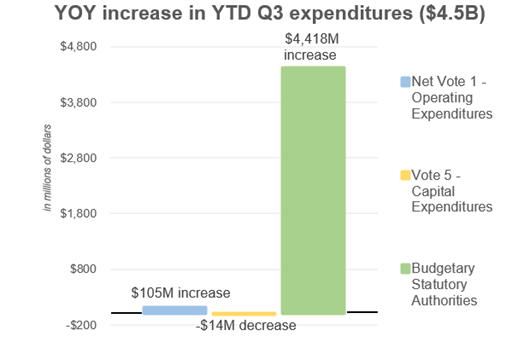
The YTD third quarter expenditures as at December 31, 2024 have increased by $4,509M ($4.5B) from $11,827M ($11.8B) in 2023-2024, to $16,336M ($16.3B) in 2024-2025, as displayed in the Statement of Authorities. The material components of this YOY change are explained below.
| (in millions of dollars) | YTD expenditures at December 31, 2024 | YTD expenditures at December 31, 2023 | Variance in YTD expenditures |
|---|---|---|---|
Budgetary Statutory Authorities |
$12,360M |
$7,942M |
$4,418M |
The increase in Budgetary Statutory Authorities is primarily due to the following:
|
|||
Net Vote 1 – Operating Expenditures |
$3,918M |
$3,813M |
$105M |
The increase in Net Vote 1 Operating Expenditures is primarily related to the following: Salary The increase in salary expenditures is primarily related to:
Operating and maintenance
|
|||
Vote 5 – Capital Expenditures |
$58M |
$72M |
($14M) |
The decrease in Vote 5 Capital Expenditures is primarily related to major project investments |
|||
Total Budgetary Authorities |
$16,336M ($16.3B) |
$11,827M ($11.8B) |
$4,509M ($4.5B) |
Expenditures by standard object
The material variances will be explained in the table below. The transfer payments standard object makes up the majority of the YOY variance in YTD expenditures with the other standard objects making up only a small portion.

| (in millions of dollars) | YTD expenditures at December 31, 2024 | YTD expenditures at December 31, 2023 | Variance in YTD expenditures |
|---|---|---|---|
Transfer Payments1 |
$11,732M |
$7,236M |
$4,496M |
The increase in Transfer Payments is primarily related to the following:
|
|||
Personnel |
$4,148M |
$4,114M |
$34M |
The variance explanation noted in the Net Vote 1 salary section is also applicable to the Personnel standard object, in addition to variances in other items, including the Employee Benefit Plan. |
|||
Other Standard Objects |
$825M |
$807M |
$18M |
$25M increase is related to the professional services standard object:
$6M increase in the rentals standard object is primarily related to:
$14M decrease in the other subsidies and payments standard object is primarily related to:
|
|||
Revenue Credited to the Vote |
($369M) |
($330M) |
($39M) |
Total Budgetary Authorities |
$16,336M ($16.3B) |
$11,827M ($11.8B) |
$4,509M ($4.5B) |
Note 1. The transfer payments standard object includes the Children’s Special Allowance payments, CCR payments, Distribution of Fuel Charges – Provinces and Territories, Distribution of Fuel Charges – Farming Businesses, Distribution of Fuel Charges – Small Businesses, Energy Cost Benefit payments and payments to non-profit organizations
Risks and uncertainties
The CRA strives to be a world-class tax and benefits administration that is trusted, fair, and helpful by putting people first. As such, the CRA continually monitors its internal and external environments for events that could affect whether it achieves its strategic priorities and objectives. The Board of Management monitors, and senior management receives, quarterly updates on the CRA’s Corporate Risk Profile, which involves regular monitoring of the entire risk portfolio. The CRA’s key risks and mitigation strategies are outlined in the 2024-2025 Departmental Plan.
The CRA recognizes that all of the key risks identified in the Departmental Plan could have financial impacts should they materialize. The key risks and associated mitigation strategies outlined in the Departmental Plan relate to the CRA’s 2024-2025 strategic priorities, which include the following:
- Deliver seamless client experiences and tailored interactions that are digital first
- Combat aggressive tax planning and tax evasion
- Strengthen security and safeguard privacy
- Nurture a high-performing, diverse, and inclusive workforce in a modern, flexible, and accessible workplace
Significant changes in relation to operations, personnel, and programs
As part of Budget 2024, funding was announced related to certain priorities, which the CRA expected to receive later in the fiscal year. However, given the announcement made by the government on January 6, 2025 to prorogue Parliament until March 24, 2025, the funding for these initiatives may not be approved by year-end, which would constrain the CRA’s financial position. Mitigation measures are being implemented to reduce this financial risk.
The CRA’s 2024-2025 contribution to RGS, $58M, includes reductions for travel, professional services, and operating expenditures. In the upcoming years, the CRA is further advancing the assessment and plans for the second phase of RGS, announced in Budget 2024.
Approval by Senior Officials
Approved by:
[original signed by]
________________________
Bob Hamilton, Commissioner
[original signed by]
_____________________________
Hugo Pagé, Chief Financial Officer
Ottawa, Canada
Date:
| Category | Total available for use for the year ending March 31, 2025table 4 note 1 | Used during the quarter ended December 31, 2024 |
Year-to-date used at quarter-end |
|---|---|---|---|
Vote 1 - Operating expenditures |
|||
Gross Operating expenditures |
5,866,412 |
1,380,531 |
4,287,382 |
Revenues netted against expenditures |
(485,700) |
(122,990) |
(368,972) |
Net Vote 1 - Operating expenditures |
5,380,712 |
1,257,541 |
3,918,410 |
Vote 5 - Capital expenditures |
143,423 |
21,326 |
57,621 |
Budgetary Statutory Authorities |
|||
Contributions to employee benefit plans |
615,855 |
142,136 |
426,409 |
Children's Special Allowance payments (Children's Special Allowances Act) |
396,000 |
109,741 |
321,965 |
Canada Carbon Rebate payments |
11,665,000 |
3,034,298 |
8,834,251 |
Spending of revenues received through the conduct of its operations pursuant to section 60 of the Canada Revenue Agency Act |
338,773 |
99,640 |
206,831 |
Distribution of Fuel Charges - Provinces and Territories |
58,000 |
18,906 |
36,980 |
Distribution of Fuel Charges - Farming Businesses |
203,500 |
26,094 |
141,837 |
Distribution of Fuel Charges - Small Businesses |
2,569,000 |
2,391,149 |
2,391,149 |
Minister's salary and motor car allowance |
99 |
22 |
71 |
Court awards - Tax Court of Canada |
- |
280 |
549 |
Spending proceeds from the disposal of surplus Crown Assets |
- |
(32) |
55 |
Energy Cost Benefit |
- |
- |
(1) |
Refunds of previous years revenue |
- |
- |
- |
Total Budgetary Statutory Authorities |
15,846,227 |
5,822,234 |
12,360,096 |
Total Budgetary Authorities |
21,370,362 |
7,101,101 |
16,336,127 |
This financial table compares the Agency’s total available authorities available as of December 31, expenditures used during the quarter and year-to-date expenditures for fiscal years 2024-2025 and 2023-2024 by voted authority. This table uses parentheses to show negative numbers.
| Category | Total available for use for the year ended March 31, 2024table 5 note 1 | Used during the quarter ended December 31, 2023 |
Year-to-date used at quarter-end |
|---|---|---|---|
Vote 1 - Operating expenditures |
|
|
|
Gross Operating expenditures |
6,042,076 |
1,446,587 |
4,143,696 |
Revenues netted against expenditures |
(469,122) |
(110,142) |
(330,426) |
Net Vote 1 - Operating expenditures |
5,572,954 |
1,336,445 |
3,813,270 |
Vote 5 - Capital expenditures |
157,683 |
30,014 |
72,118 |
Budgetary Statutory Authorities |
|||
Contributions to employee benefit plans |
584,983 |
146,453 |
439,360 |
Children's Special Allowance payments (Children's Special Allowances Act) |
368,000 |
100,606 |
291,417 |
Canada Carbon Rebate payments |
9,424,000 |
2,525,170 |
6,788,019 |
Spending of revenues received through the conduct of its operations pursuant to section 60 of the Canada Revenue Agency Act |
357,679 |
91,659 |
258,010 |
Distribution of Fuel and Excess Emission Charges |
48,000 |
19,951 |
41,761 |
Return of Fuel Charge Proceeds to Farming Businesses |
165,000 |
12,414 |
111,129 |
Minister's salary and motor car allowance |
95 |
24 |
71 |
Court awards - Tax Court of Canada |
- |
502 |
12,282 |
Spending proceeds from the disposal of surplus Crown Assets |
- |
21 |
77 |
Energy Cost Benefit |
- |
- |
(1) |
Refunds of previous years revenue |
- |
- |
79 |
Total Budgetary Statutory Authorities |
10,947,757 |
2,896,800 |
7,942,204 |
Total Budgetary Authorities |
16,678,394 |
4,263,259 |
11,827,592 |
This financial table compares the Agency’s total available authorities available as of December 31, expenditures used during the quarter and year-to-date expenditures for fiscal years 2023-2024 and 2022-2023 by voted authority. This table uses parentheses to show negative numbers.
| Category | Planned expenditures for the year ending March 31, 2025 | Expended during the quarter ended December 31, 2024 | Year-to-date used at quarter-end |
|---|---|---|---|
Expenditures: |
|||
Personnel |
5,207,899 |
1,369,864 |
4,148,285 |
Transportation and communications |
246,904 |
19,956 |
79,090 |
Information |
48,864 |
5,128 |
13,998 |
Professional and special services |
967,294 |
145,512 |
431,838 |
Rentals |
310,937 |
80,502 |
224,409 |
Purchased repair and maintenance |
71,957 |
16,976 |
41,187 |
Utilities, materials, and supplies |
44,006 |
6,884 |
12,954 |
Acquisition of machinery and equipment |
60,299 |
(6,804) |
16,809 |
Transfer payments |
14,897,544 |
5,584,856 |
11,731,654 |
Other subsidies and payments |
358 |
1,217 |
4,875 |
Total Gross Budgetary Expenditures |
21,856,062 |
7,224,091 |
16,705,099 |
Less: Revenues netted against expenditures |
485,700 |
122,990 |
368,972 |
Total Net Budgetary Expenditures |
21,370,362 |
7,101,101 |
16,336,127 |
This financial table compares the Agency’s planned expenditures available as of December 31, expenditures used during the quarter and year-to-date expenditures for fiscal years 2024-2025 and 2023-2024 by standard object. This table uses parentheses to show negative numbers.
| Category | Planned expenditures for the year ended March 31, 2024 | Expended during the quarter ended December 31, 2023 | Year-to-date used at quarter-end |
|---|---|---|---|
Expenditures: |
|||
Personnel |
5,085,205 |
1,447,886 |
4,114,477 |
Transportation and communications |
305,909 |
20,360 |
76,706 |
Information |
58,489 |
9,402 |
17,485 |
Professional and special services |
1,136,647 |
135,716 |
406,343 |
Rentals |
340,398 |
67,962 |
218,309 |
Purchased repair and maintenance |
81,328 |
12,738 |
38,509 |
Utilities, materials, and supplies |
52,159 |
3,097 |
9,224 |
Acquisition of machinery and equipment |
76,588 |
13,332 |
22,679 |
Transfer payments |
10,010,379 |
2,661,434 |
7,235,762 |
Other subsidies and payments |
415 |
1,473 |
18,525 |
Total Gross Budgetary Expenditures |
17,147,516 |
4,373,401 |
12,158,018 |
Less: Revenues netted against expenditures |
469,122 |
110,142 |
330,426 |
Total Net Budgetary Expenditures |
16,678,394 |
4,263,259 |
11,827,592 |
This financial table compares the Agency’s planned expenditures available as of December 31, expenditures used during the quarter and year-to-date expenditures for fiscal years 2023-2024 and 2022-2023 by standard object. This table uses parentheses to show negative numbers.