
Canada’s 2030 Emissions Reduction Plan - Annex 5
Modelling and Analysis of Canada's Emissions Reduction Plan for 2030
The GHG emissions projections in the Emissions Reduction Plan reflect the most up-to-date assumptions of the key drivers that influence Canada's overall GHG emissions (e.g. economic growth, oil and gas prices and production, and updated historical GHG data) as well as the policies and actions that are included in the plan where there is sufficient information to include them in the projections.
As was done in A Healthy Environment and a Healthy Economy, the analysis was undertaken using two ECCC models:
- E3MC – a modelling framework that combines Energy 2020 and a macroeconomic model working in tandem. Energy 2020 is a 10 province and 3-territory bottom-up energy technology simulation model. Bottom-up energy technology simulation models contain a detailed representation of technologies and seek to minimize costs while achieving specific goals. The granularity of Energy2020 allows for the analysis of a wide range of sectoral measures and targeted performance standards and regulations.
- EC-Pro – a 10 province and 3-territory multi-sector, multi-region, computable general equilibrium (CGE) model. A CGE model combines economic theory with real economic data in order to derive the impacts of policies or shocks on the economy. As a CGE model takes into account the inter-dependencies between different sectors, agents and markets in the economy, it can help shed light on the wider economic impact of policies and sometimes reveal their indirect or unintended effects. Moreover, modelling the adjustment path with the CGE model provides a rich understanding of the evolution of the economy in response to a given shock or policy. ECCC's CGE model is aligned to Statistic Canada's provincial/territorial Supply and Use Tables and includes more than 25 sectors with a focus on energy and energy-intensive industries.
Modelling and the Emissions Reductions Plan Progress Reports
The Net Zero Emissions Accountability Act requires that progress reports be made on Canada's Emissions Reductions Plan in 2023, 2025, and 2027. These progress reports will include updates to the projections of GHG emissions towards 2030. This is essential to ensuring that, as factors continue to evolve, (e.g. updates to historical emissions data, changes to Federal, Provincial and/or Territorial policies and programs, socio-economic factors such as GDP and population, etc.) Canadians have a clear picture of how Canada intends to meet the 2030 target and whether or not the measures and policy signals outlined in the 2030 ERP will keep the trajectory on-track. To both maximize transparency and address the inherent uncertainties in all modelling processes, ECCC will convene an expert-led process to provide independent advice in time for the 2023 Progress Report, ensuring a robust and reliable modelling regime to inform the basis of future ERPs. This undertaking aligns with advice from the Net-Zero Advisory Body regarding increased transparency in models and analytical approaches. ECCC modelling capacity is robust, has been peer reviewed both domestically and internationally, and supports evidence-based analysis and policy decisions.
Emissions Reduction Plan Modelling
The modelling process for the Emissions Reduction Plan involved three steps. The first was to establish an updated reference case that is the foundation on which the measures included in the Emissions Reductions Plan were layered. Measures with sufficient detail were modelled in a 'bottom-up' modelling exercise that is described in this Annex. Finally, a 'back casting' exercise was run to identify the most economically efficient reductions by sector to achieve the 40% objective by 2030. The details of this exercise are shown in Chapter 3.
2021 Reference Case
The starting point for the projections is the updated 2021 Reference Case that includes updated data and assumptions as well as all policies and measures funded, legislated and implemented by federal, provincial, and territorial governments as of November 2021. The 2021 Reference Case establishes a baseline for the ERP and therefore does not take into account the impact of broader strategies or announced measures that are currently not implemented or funded. For example, the Clean Fuel Standard and the post-2025 light duty vehicle regulations are not included. The carbon pricing trajectory increasing to $170/t by 2030, including the fuel charge and modifications to the federal Output-Based Pricing System (OBPS) and provincial carbon pricing systems post-2022 are also excluded from the Reference Case as the federal OBPS is currently under review to ensure it is aligned with the strengthened tests under the updated federal benchmark. Provincial and territorial carbon pricing systems are considering changes that may be required to meet the strengthened federal benchmark for the 2023 to 2030 period. Policies still under development will be included in subsequent reference cases as their details become finalized and implemented.
The Reference Case projections are developed in consultation with provinces and territories as well as with other federal departments and agencies. During the consultations officials provide views on forecast assumptions, such as population or industrial growth, major projects and electricity generation plants that are expected to come online or retire, as well as provide details about provincial and federal policies and review and comment on the preliminary projections. This feedback on data and methodologies is then reflected in the final projections.
The 2021 Reference Case projections are based on the most recent available baseline data and assumptions. Historical data on Gross Domestic Product (GDP), disposable personal income, consumer price index, population demographics and employment come from Statistics Canada while historical emissions data are provided by the 2021 National Inventory Report (2021 NIR) which includes emissions up to and including 2019. GDP projections out to 2026 are calibrated to Finance Canada's Economic and Fiscal Update 2021 and the GDP projections from 2027 and 2030 are based on Finance Canada's long-term projections.
| 2005 to 2019 (Historical) | 2020 (Historical) | 2021 to 2030 (Projected) | |
|---|---|---|---|
| Gross Domestic Product | 1.9% | -5.2% | 2.5% |
| Consumer Price Index | 1.8% | 0.7% | 2.3% |
| Population | 1.1% | 1.1% | 1.1% |
| Population of driving age (18–75) | 1.2% | 1.0% | 0.8% |
| Labour Force | 1.1% | -1.2% | 1.4% |
Forecasts of oil and natural gas prices and production are taken from the Canada Energy Regulator's (CER) Canada's Energy Future 2021 report that was published in December 2021.Footnote 1 The CER is an
independent federal agency that regulates international and interprovincial aspects of the oil, gas and electric utility industries and is the only organization that provides an integrated Canadian oil and gas price and production forecast with details at the provincial and territorial level. The U.S. Energy Information Administration's outlook on key parameters is also taken into account in the development of energy and emissions trends.
Canada Energy Regulator and a Net Zero Scenario
A key objective of the 2015 Paris Agreement is to hold the increase in the global average temperature to well below 2 degrees Celsius while pursuing efforts to limit the temperature increase to 1.5 degrees above pre-industrial levels. Scientific assessments have shown that limiting the temperature increase to those levels requires deep GHG emission reductions, with a key milestone of achieving net-zero emissions or, carbon neutrality by 2050. As of March 2022, 132 countries, including Canada, have set or are considering net-zero by 2050 emissions targets.
The Canada Energy Regulator's Energy Future Report provides a framework for businesses to make investment decisions in the energy sector. Its projections are important for ensuring Canadian businesses are making investments consistent with a transition to cleaner energy sources.
On December 16, 2021 Natural Resources Minister Jonathan Wilkinson, wrote to the Chairperson of the CER's Board of Directors Cassie Doyle, to request that the CER produce fully modelled net-zero scenarios consistent with 1.5°C of warming under the Paris Agreement. The 1.5°C -aligned Scenario Analyses from the CER will include fully modelled scenarios of supply and demand of all energy commodities in Canada, including clean fuels, electricity, and oil and gas. This modelling will also include the future trends in low-carbon technology and energy markets, to provide Canadians with information they need to better understand the future energy transition.
| 2005 (Historical) | 2010 (Historical) | 2015 (Historical) | 2019 (Historical) | 2020 (Projected) | 2030 (Projected) | |
|---|---|---|---|---|---|---|
| Conventional Crude Oil Production (000s barrel per day) | 1360 | 1227 | 1265 | 1313 | 1201 | 1514 |
| Oil sands Crude Oil Production (000s barrel per day) | 1065 | 1614 | 2530 | 3098 | 2984 | 4053 |
| Crude Oil - Total Crude Oil Production (000s barrel per day) | 2425 | 2841 | 3795 | 4411 | 4185 | 5567 |
| Oil Price (2019 US$/bbl) | 64.49 | 86.10 | 51.40 | 56.32 | 38.53 | 65.21 |
| Natural Gas Production (1000 bbl of oil eq./day) | 3611 | 3124 | 3160 | 3294 | 3238 | 3347 |
| Natural Gas Price (2019 US $/mmbtu) | 9.92 | 4.67 | 2.77 | 2.53 | 1.98 | 3.36 |
| CPI (1992 = 100) | 127.3 | 138.7 | 150.7 | 161.9 | 163.0 | 204.3 |
As mentioned above, the 2021 Reference Case projections reflect a number of revisions in the historical data, macroeconomic assumptions and policy changes, namely:
- The 2021 NIR included significant methodological changes in the Waste sector, including a disaggregation of waste into more types of material and updated decay rates (by material and climate zones). These changes lead to an increase in historical, and therefore, projected emissions from this sector.
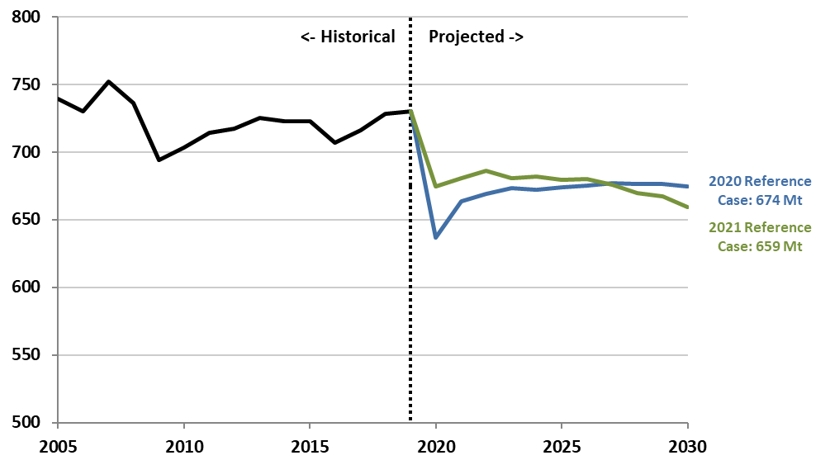
- Changes to the key drivers of emissions influence the emissions trajectory to 2030. The decline in emissions due to COVID-19-driven economic activity (e.g. GDP, sector-based output, vehicle kilometers driven, etc.) was not as pronounced as expected in the 2020 Reference Case. As a result, the expectations for the economic rebound are less pronounced in the 2021 Reference Case (see Figure 6.1). Under the 2021 Reference Case, emissions in 2020 are projected to be 675 Mt compared to 637 Mt in the 2020 Reference Case, and 659 Mt compared to 674 Mt for 2030. Actual 2020 Emissions will be published in the 2022 NIR.
Figure 6.1: Comparison between the 2021 and 2020 Reference Case Projections (2005 to 2030) (Excluding Land Use, Land Use Change and Forestry)
Long description
| Year | 2021 National Inventory Report (NIR) historical data | 2020 Reference Case: 674 Mt CO2 eq | 2021 Reference Case: 659 Mt CO2 eq |
| 2005 | 739 | - | - |
| 2006 | 730 | - | - |
| 2007 | 752 | - | - |
| 2008 | 736 | - | - |
| 2009 | 694 | - | - |
| 2010 | 703 | - | - |
| 2011 | 714 | - | - |
| 2012 | 717 | - | - |
| 2013 | 725 | - | - |
| 2014 | 723 | - | - |
| 2015 | 723 | - | - |
| 2016 | 707 | - | - |
| 2017 | 716 | - | - |
| 2018 | 728 | - | - |
| 2019 | 730 | 730 | 730 |
| 2020 | - | 637 | 675 |
| 2021 | - | 663 | 681 |
| 2022 | - | 669 | 686 |
| 2023 | - | 673 | 681 |
| 2024 | - | 672 | 682 |
| 2025 | - | 674 | 679 |
| 2026 | - | 675 | 680 |
| 2027 | - | 677 | 676 |
| 2028 | - | 676 | 670 |
| 2029 | - | 677 | 667 |
| 2030 | - | 674 | 659 |
Note: Historical emissions data comes from NIR 2021.
Total Canadian greenhouse gas emissions in the 2021 Reference Case, in the absence of additional actions, are projected to be 675 Mt CO2 eq. in 2020 and 659 Mt in 2030; or 665 and 648 respectively when taking into account the accounting contribution from Land Use, Land-Use Change and Forestry sector (LULUCF). Table 6.3 provides a sector-by-sector tabulation of projected emissions.
| 2005 (Historical) | 2010 (Historical) | 2015 (Historical) | 2019 (Historical) | 2020 (Projected) | 2030 (Projected) | Change 2005 to 2030 | |
|---|---|---|---|---|---|---|---|
| Oil and Gas | 160 | 166 | 190 | 191 | 179 | 187 | 27 |
| Electricity | 118 | 95 | 79 | 61 | 52 | 28 | -90 |
| Transportation | 160 | 167 | 172 | 186 | 165 | 170 | 10 |
| Heavy Industry | 87 | 75 | 77 | 77 | 69 | 75 | -13 |
| Buildings | 84 | 80 | 83 | 91 | 85 | 76 | -9 |
| Agriculture | 72 | 68 | 71 | 73 | 72 | 74 | 2 |
| Waste & Others | 57 | 52 | 50 | 51 | 51 | 50 | -7 |
| LULUCFFootnote 2 | n.a. | 10 | -4 | -8 | -10 | -11 | n.a. |
| Total (excluding LULUCF) | 739 | 703 | 723 | 730 | 675 | 659 | -79 |
| Total (including LULUCF) | 739 | 713 | 719 | 723 | 665 | 648 | -90 |
Note: Numbers may not sum to the total due to rounding. Historical emissions data comes from Canada's National Inventory Report (NIR) 2021.
| LULUCF Sub-sectors | 2020 | 2030 |
|---|---|---|
| Forest Land Remaining Forest Land + associated Harvested Wood Products | -18 | -19 |
| Afforestation | -0.3 | -0.5 |
| Cropland Remaining Cropland | 8.3 | 12 |
| Forest Conversion + associated Harvested Wood Products | 0.7 | -3.5 |
| Others | 0.0 | 0.0 |
| Total | - 10 | - 11 |
Note: Totals may not add up due to rounding.
Land Use, Land-Use Change and Forestry Sector (LULUCF)
The LULUCF sector focuses on emissions and removals associated with managed lands (Forest Land, Cropland, Wetlands, Settlements and Other Lands), including those associated with land-use change and emissions from Harvested Wood Products derived from these lands. Canada's LULUCF accounting contribution, as reported in Table 6.4 above, is calculated in accordance with UNFCCC guidelines and Canada's Nationally Determined Contribution submitted to UNFCCC in July 2021, where a reference level approach is used for managed forest and associated Harvested Wood Products, and a net-net approach is used for all the other LULUCF sub-sectors.
Given the uncertainty regarding the key drivers of GHG emissions, these emissions projections should be seen as one estimate within a set of possible emissions outcomes over the projection period, as events that will shape emissions and energy markets cannot be fully anticipated. In addition, future developments, for example, technologies, demographics and resources, will evolve. The variation in these complex economic and energy variables implies that modelling results are most appropriately viewed as one plausible outcome, amongst many. ECCC addresses some of this uncertainty through modelling and analysis of alternative cases. The sensitivity analysis has been developed to consider uncertainty related to future economic growth and the evolution of world fossil fuel prices. As illustrated in Table 6.5, GHG emissions could be as low as 615 Mt or as high as 702 Mt, representing a range of 87 Mt. A more comprehensive discussion on this sensitivity analysis is presented in the 2021 Reference Case Document.
| Scenarios | GHG Emissions in 2030 (Mt) | Difference Between Reference Case (Mt) | Difference Between Reference Case (%) |
|---|---|---|---|
| Fast GDP, High Prices | 702 | 43 | 6.5 |
| Fast GDP | 689 | 30 | 4.5 |
| High Prices | 667 | 7 | 1.1 |
| Reference Case | 659 | 0 | 0.0 |
| Low Prices | 651 | -8 | -1.2 |
| Slow GDP | 630 | -29 | -4.5 |
| Slow GDP, Low Prices | 615 | -44 | -6.7 |
| Range | 615 to 702 | -44 to 43 | - 6.7 to 6.5 |
Key Elements of the Emissions Reduction Plan – Bottom-up Analysis
Modelling of the Emissions Reduction Plan builds on the Reference Case projections presented above by including policies and measures that are at different stages of the implementation, legislative and budgetary processes (see Appendix B for more details on the modelling assumptions). This step is called the 'bottom-up' analysis and includes:
- Carbon pricing:
- Since 2019, carbon pricing applies to fossil fuels and large industrial emitters across Canada through a mix of provincial and territorial systems and a federal backstop.
- In 2019, the benchmark carbon price was $20 per tonne and increased by $10 per tonne per year until 2022 when it reached $50 per tonne. Post-2022, the price increases each year by $15 per tonne, reaching $170 per tonne by 2030.
- As the federal and most provincial carbon pricing systems are in the process of being strengthened to align with the 2023-2030 minimum national stringency requirements (federal benchmark), for illustrative purposes the modelling assumes consistent carbon pricing systems for all provinces and territories apart from Quebec, which is modeled based on its current cap-and-trade carbon pricing system.
- This involves assuming the application of a fuel charge at the annual carbon price to fossil fuels and the application of an Output-Based Pricing System (OBPS), an emissions trading system for industrial emitters, with an assumed 2% tightening in stringency in each year post-2022.
- Revenue Recycling: 90% of the fuel charge is returned to consumers and 10% is used to fund "green and innovative" initiatives and 100% of the OBPS revenues are invested in "green or innovative" initiatives.
- The Clean Fuel Regulation (CFR):
- Covers liquid fossil fuels, specifically gasoline and diesel, which are mainly used in the transportation sector. For illustrative purposes, the modelling reflects a requirement that liquid fossil fuel suppliers reduce the carbon intensity of their fuels used in Canada from 2016 carbon intensity levels by 14 grams of CO2 eq./MJ in 2030.
- Complementary Sectoral Measures:
- Complementary policies and investments work in concert with carbon pollution pricing to reduce emissions in specific sectors. Some of the specific sectoral measures in the plan modelled include (see Appendix for more details):
- Emissions regulations for light-duty vehicles (LDV), heavy-duty vehicles (HDVs) and electrification of residential off-road equipment; Canada meeting its zero-emission vehicle (ZEV) targets of at least 20% by 2026 and at least 60% by 2030, and incentives for the acquisition and use of passenger ZEVs.
- Net-Zero Ready Building Codes, home energy retrofits.
- Measures to enhance the clean electrification of Canada, Clean Electricity Standard, investments in interties, smart grids, renewables and power storage.
- Energy efficiency improvements and decarbonisation by industry as a result of Net Zero Accelerator funding, (e.g. Algoma and Dofasco steel projects) and the financial support for the industry.
- Achieving 75% reduction in methane emissions from the oil and gas sector and new methane capture regulations for solid waste facilities.
- Complementary policies and investments work in concert with carbon pollution pricing to reduce emissions in specific sectors. Some of the specific sectoral measures in the plan modelled include (see Appendix for more details):
The modelling also reflects economy-wide measures where specific details are still under development but that are sufficiently elaborated for modelling purposes. These include:
- Investment Tax Credit for Carbon Capture, Utilization and Storage (CCUS). Budget 2021 committed to introduce such an investment tax credit and initial consultation on its design. Budget 2021 noted that the Investment Tax Credit would be designed to reduce emissions by at least 15 Mt of CO2 eq. per year. Further details regarding the investment tax credit will be announced in Budget 2022.
- Hydrogen Strategy: Natural Resources Canada's Hydrogen Strategy and Roadmap was announced in 2021. The Strategy lays out an ambitious framework for actions that will cement hydrogen as a tool to achieve our goal of net-zero emissions by 2050 and position Canada as a global leader of clean renewable fuels. While the Strategy provides a roadmap, the policies and mechanisms to ensure a successful deployment of hydrogen are still under development. To reflect hydrogen's potential contribution to achieving Canada's target, the modelling assumes a 7.3% natural gas blending mandate as a proxy for the measures to be developed under the Strategy.
There are also a number of measures that are calculated outside of the ECCC integrated energy, emissions and economic models. These are LULUCF, Nature-Based Climate Solutions (NBCS) and Agriculture measures.
Nature-Based Climate Solutions
Nature-based climate solutions in forests, grasslands, wetlands, and agricultural lands help mitigate climate change while providing important benefits to biodiversity and to communities. Canada supports activities including planting 2 billion trees, restoring degraded ecosystems, improving land management practices (including on agricultural lands), and conserving land at risk of conversion to other uses.
According to the 2021 Reference Case projections, LULUCF accounting will contribute 11 Mt towards the 2030 target. Sequestration of greenhouse gases from NBCS (e.g. carbon sequestration from wetlands, grasslands, beneficial management practices in the agriculture sector) and a target to reduce emissions from the use of fertilizers in the agriculture sector will reduce emissions by approximately a further 19 Mt for a total of 30 Mt of reductions. These are calculated outside of the ECCC models and are based on the Natural Resources Canada's Carbon Budget Model of the Canadian Forest Sector, Agriculture and Agri-Food Canada's Canadian Regional Agricultural Model and the Canadian Agricultural GHG Monitoring Accounting and Report System models and other models for the LULUCF accounting, as well as based on scientific literature for the nature based climate solutions.
Assessing the Impact of the Bottom-up Analysis
With the full implementation of sector-based economy wide measures included in the Emissions Reduction Plan, Canada's emissions are projected to be 500 Mt (excluding LULUCF, NBCS and agriculture) by 2030. Taking into consideration the LULUCF accounting contribution, the expected impact of the proposed nature-based solutions and the 30% fertilizer reduction in agriculture, these combined measures are projected to reduce emissions by a further 30 Mt. The implementation of the measures identified in the Emissions Reductions Plan are projected to result in emissions of approximately 470 Mt in 2030, or about 36.4% below Canada's emissions in 2005. It is important to reiterate that some policies committed to and under development are not included in the model, and some measures, like public transit and clean technology, are not easily modelled. As such, when these efforts are combined with the backcasting results, Canada is on track to achieve a 40% emissions reduction.
Table 6.6 shows emission reduction projections by sector from 2005 levels. As highlighted in the table, all sectors contribute to Canada's emissions reduction effort. While the Agriculture sector shows little change in emissions, this is related to the model-determined emissions, as there are further reductions in agriculture from reducing the use of fertilizers and nature-based climate solutions that are expected to contribute about 13 Mt. The Electricity sector is projected to generate the most significant level of reductions relative to their 2005 levels (from 118 Mt in 2005 to 15 Mt in 2030). This is primarily the result of the coal-fired phase-out regulations and policies and measures related to carbon pricing, increased renewable electricity and interties. This is followed by the Oil and Gas sector (from 160 Mt to 118 Mt). These reductions are driven by carbon pricing and by policies aimed at incentivizing CCUS, greater use of solvents to extract oil sandsFootnote 3, stringent methane regulations and overall fuel switching, including electrification of processes where possible. Heavy Industry and Buildings, likewise, are projected to generate significant reductions relative to their 2005 levels, 33 Mt and 24 Mt respectively. Similarly, the Waste sector (i.e., Solid Waste, Wastewater and Waste Incineration) and the Others sectors (i.e., Light Manufacturing, Construction and Forest Resources) are projected to have lower GHG emissions at 15 Mt and 12 Mt below their respective 2005 levels. Finally, LULUCF accounting contribution, nature based climate solutions and agriculture measures will reduce emissions by a further 30 Mt, including the 13Mt in agriculture.
| 2005 (Historical) | 2010 (Historical) | 2015 (Historical) | 2019 (Historical) | 2020 (Projected Emissions with the Plan) | 2030 (Projected Emissions with the Plan) | Change 2005 to 2030 | |
|---|---|---|---|---|---|---|---|
| Agriculture | 72 | 68 | 71 | 73 | 72 | 73 | 1 |
| Buildings | 84 | 80 | 83 | 91 | 85 | 60 | -24 |
| Electricity | 118 | 95 | 79 | 61 | 52 | 15 | -103 |
| Heavy Industry | 87 | 75 | 77 | 77 | 69 | 54 | -33 |
| Oil and Gas | 160 | 166 | 190 | 191 | 179 | 118 | -42 |
| Transportation | 160 | 167 | 172 | 186 | 165 | 150 | -10 |
| Waste | 31 | 28 | 27 | 28 | 28 | 16 | -15 |
| Others | 26 | 25 | 23 | 24 | 23 | 14 | -12 |
| Total (Excluding LULUCF) | 739 | 703 | 723 | 731 | 674 | 500 | -239 |
| LULUCF, NBCS and agriculture measures | n.a. | 10 | -4 | -8 | -10 | -30 | -30 |
| Total (Including LULUCF) | 739 | 713 | 719 | 723 | 665 | 470 | -269 |
| % Below 2005 | -36.4% |
Note: Numbers may not sum to the total due to rounding. Historical emissions data comes from NIR 2021.
Table 6.7 illustrates the emissions by sector and sub-sector. As depicted in the table, all sectors (except Agriculture) and most sub-sectors are projected to reduce emissions below their respective 2005 levels.
| 2005 | 2019 | 2030 | Change 2005 to 2030 (Mt) | Change 2005 to 2030 (%) | |
|---|---|---|---|---|---|
| 1. Oil and Gas | 160 | 192 | 118 | -42 | -26% |
| 1.1. Upstream Oil and Gas | 137 | 173 | 106 | -30 | -22% |
| 1.1.1. Natural Gas Production and Processing | 61 | 53 | 29 | -32 | -53% |
| 1.1.2. Conventional Oil Production | 29 | 25 | 18 | -10 | -36% |
| 1.1.1.1. Conventional Light Oil | 13 | 17 | 11 | -1 | -11% |
| 1.1.1.2. Conventional Heavy Oil | 14 | 8 | 5 | -8 | -61% |
| 1.1.1.3. Frontier Oil | 2 | 1 | 1 | 0 | -25% |
| 1.1.3. Oil Sands (Mining, In-situ, Upgrading) | 35 | 84 | 55 | 20 | 56% |
| 1.1.3.1. Mining and Extraction | 6 | 16 | 15 | 10 | 170% |
| 1.1.3.2. In-situ | 12 | 43 | 28 | 16 | 132% |
| 1.1.3.3. Upgrading | 17 | 25 | 11 | -6 | -35% |
| 1.1.4. Oil, Natural Gas and CO2 Transmission | 12 | 11 | 5 | -7 | -60% |
| 1.2. Downstream Oil and Gas | 23 | 20 | 11 | -12 | -52% |
| 1.2.1. Petroleum Refining | 22 | 19 | 10 | -11 | -53% |
| 1.2.2. Natural Gas Distribution | 1 | 1 | 1 | 0 | -34% |
| 2. Electricity | 118 | 61 | 15 | -103 | -87% |
| 3. Transport | 160 | 186 | 150 | -10 | -7% |
| 3.1. Passenger Transport | 92 | 98 | 76 | -16 | -18% |
| 3.2. Freight Transport | 61 | 80 | 64 | 4 | 6% |
| 3.3. Air Passenger | 7 | 8 | 8 | 2 | 29% |
| 3.4. Air Freight | 1 | 1 | 1 | 0 | -6% |
| 4. Heavy Industry | 87 | 78 | 54 | -33 | -38% |
| 4.1. Mining | 7 | 9 | 7 | 0 | 2% |
| 4.2. Smelting and Refining (Non-Ferrous Metals) | 14 | 10 | 10 | -4 | -30% |
| 4.3. Pulp and Paper | 9 | 8 | 4 | -5 | -60% |
| 4.4. Iron and Steel | 16 | 15 | 10 | -6 | -35% |
| 4.5. Cement and Lime and Gypsum | 17 | 14 | 8 | -8 | -49% |
| 4.6. Chemicals and Fertilizers | 25 | 21 | 15 | -10 | -40% |
| 5. Buildings | 84 | 91 | 60 | -25 | -29% |
| 5.1. Service Industry | 40 | 47 | 32 | -8 | -20% |
| 5.2. Residential | 44 | 44 | 27 | -17 | -38% |
| 6. Agriculture | 72 | 73 | 73 | 1 | 1% |
| 7. Waste | 31 | 28 | 16 | -14 | -47% |
| 7.1. Solid Waste | 30 | 26 | 16 | -14 | -47% |
| 7.2. Wastewater | 1 | 1 | 1 | 0 | -34% |
| 7.3. Waste Incineration | 0 | 0 | 0 | 0 | -66% |
| 8. Others | 26 | 23 | 14 | -12 | -46% |
| 8.1. Coal Production | 2 | 2 | 1 | -1 | -46% |
| 8.2. Light Manufacturing, Construction and Forest Resources | 24 | 21 | 13 | -11 | -46% |
| 8.2.1. Light Manufacturing | 17 | 14 | 6 | -11 | -66% |
| 8.2.2. Construction | 6 | 6 | 6 | 0 | 0% |
| 8.2.3. Forest Resources | 1 | 1 | 1 | 0 | -9% |
| National GHG Total - Excluding LULUCF | 739 | 732 | 500 | -239 | -32% |
| LULUCF, NBCS and Agriculture measures | n.a. | -8 | -30 | -30 | |
| National GHG Total - Including LULUCF | 739 | 724 | 470 | -269 | -36% |
Table 6.8 depicts the emissions reduction contribution of modelled selected technologies incentivized in the Emissions Reduction Plan. Policies and measures incentivizing fuel switching, primarily to electricity, greater use of biofuels and hydrogen and adoption of Zero Emissions Vehicles account for 50.6% of the total reductions. The deployment of CCUS and solvents account for 12.9% and 7.8% of the total reductions respectively. Measures and policies aimed at greener or more innovative production processes and techniques account for 14.2% of the total reductions.
| % Contribution to Emissions Reduction | |
|---|---|
| Fuel Switching | 35.2% |
| Methane Emissions and Non-Combustion Emissions | 14.1% |
| Net Carbon Capture Utilisation and Storage (excluding Hydrogen production) | 12.9% |
| Direct Air Capture | 0.3% |
| Biofuels | 3.3% |
| Hydrogen | 10.1% |
| Zero Emissions Vehicles | 2.1% |
| Solvents | 7.8% |
| Green Production | 14.2% |
| Total | 100.0% |
Table 6.9 illustrates crude oil production levels for 2020 and 2030 and compared the 2030 production levels under the Bottom-Up scenario to the 2021 Reference Case. Under the Bottom-up scenario crude oil production in 2030 is 8.4% lower than in the Reference Case. Total oil sands production is 10.6% lower, with Steam Assisted Gravity Drainage (SAGD) production being 14.6% lower. Natural Gas production is projected to decline by about 15.9% relative to the 2021 Reference case.
| Crude Oil Production (1000 bbl/Day) | 2020 | Reference Case (2030) | Bottom-up Scenario (2030) | Difference (2030) |
|---|---|---|---|---|
| Conventional Oil Production | ||||
| Light Oil Mining | 574 | 771 | 743 | -3.4% |
| Heavy Oil Mining | 479 | 615 | 605 | -1.8% |
| Frontier Oil Mining | 148 | 128 | 127 | -0.7% |
| Conventional Oil Production – Total | 1201 | 1514 | 1475 | -2.5% |
| Oil Sands Production | ||||
| Primary Oil Sands | 167 | 246 | 230 | -6.4% |
| Steam Assisted Gravity Drainage (SAGD) Oil Sands | 1115 | 1713 | 1462 | -14.6% |
| Cyclic Steam Stimulation Oil Sands | 215 | 320 | 237 | -25.7% |
| Oil Sands Mining | 1487 | 1775 | 1693 | -4.6% |
| Oil Sands Production – Total | 2984 | 4053 | 3623 | -10.6% |
| Total Crude Oil Production | 4188 | 5566 | 5098 | -8.4% |
| Natural Gas Production (1000 bbl of oil eq./day) | 3238 | 3347 | 2816 | -15.9% |
All provinces and sectors contribute to achieving the emissions reductions underlying the Emissions Reduction Plan. Table 6.10 illustrates the emissions by provinces and territories. As depicted in the table, most provinces and territories are projected to reduce emissions below their respective 2005 levels.
| 2005 (Mt) | 2019 (Mt) | 2030 (Mt) | Change 2005 to 2030 (Mt) | Change 2005 to 2030 (%) | |
|---|---|---|---|---|---|
| British Columbia | 63.0 | 65.7 | 53.0 | -10.0 | -16% |
| Alberta | 235.5 | 276.7 | 164.8 | -70.7 | -30% |
| Saskatchewan | 67.8 | 74.8 | 45.2 | -22.7 | -33% |
| Manitoba | 20.6 | 22.6 | 19.2 | -1.4 | -7% |
| Ontario | 205.6 | 163.2 | 132.2 | -73.4 | -36% |
| Quebec | 87.5 | 83.4 | 60.6 | -27.0 | -31% |
| New Brunswick | 20.0 | 12.4 | 7.2 | -12.9 | -64% |
| Nova Scotia | 23.2 | 16.2 | 6.8 | -16.4 | -71% |
| Prince Edward Island | 2.1 | 1.8 | 1.3 | -0.7 | -35% |
| Newfoundland and Labrador | 10.5 | 11.1 | 7.5 | -3.0 | -29% |
| Northwest Territories | 1.7 | 1.7 | 0.7 | -0.9 | -55% |
| Nunavut | 0.6 | 1.2 | 1.1 | 0.5 | 80% |
| Yukon | 0.6 | 0.8 | 0.4 | -0.2 | -28% |
| National GHG Total - Excluding LULUCF | 738.7 | 731.7 | 499.9 | -238.8 | -32% |
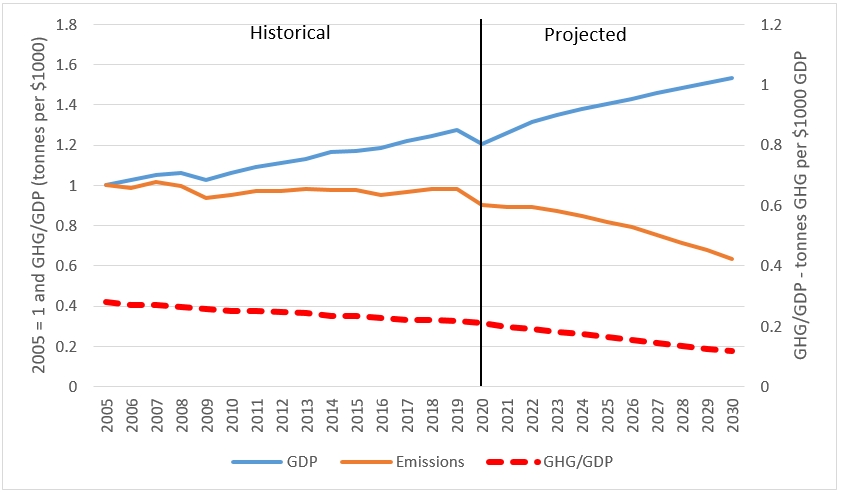
The policies and measures underlying the Emissions Reductions Plan will continue to foster and accelerate the decoupling of economic and population growth from GHG emissions. Over the 2005 to 2030 period, Canada's real GDP is projected to increase by 54% and population by 31%. Over the same period, GHG emissions are projected to fall by 36.4%. As a result of the decoupling, emission intensity in terms of GHG/GDP is projected to steadily decline. Based on the bottom-up analysis, between 2005 and 2030, GHG/GDP is projected to decline from 0.42 tonnes per $1000 GDP to 0.17 tonnes per $1000 GDP. Between 2005 and 2030, this represents an average annual decline of 3.5%. Focusing on the 2022 to 2030 period, the actions included in the Emissions Reduction Plan are forecast to accelerate the average annual decline to 6.0%.
Figure 6.3: GDP, GHG and Emission Intensity
Projected
Long description
| Year | GDP | Greenhouse gas (GHG) emissions | GHG/GDP |
| 2005 | 1 | 1 | 0.4 |
| 2006 | 1 | 0.9 | 0.4 |
| 2007 | 1.1 | 1 | 0.4 |
| 2008 | 1.1 | 0.9 | 0.4 |
| 2009 | 1 | 0.9 | 0.4 |
| 2010 | 1.1 | 0.9 | 0.4 |
| 2011 | 1.1 | 0.9 | 0.4 |
| 2012 | 1.1 | 0.9 | 0.4 |
| 2013 | 1.1 | 0.9 | 0.4 |
| 2014 | 1.2 | 0.9 | 0.4 |
| 2015 | 1.2 | 0.9 | 0.4 |
| 2016 | 1.2 | 0.9 | 0.3 |
| 2017 | 1.2 | 0.9 | 0.3 |
| 2018 | 1.3 | 0.9 | 0.3 |
| 2019 | 1.3 | 0.9 | 0.3 |
| 2020 | 1.2 | 0.9 | 0.3 |
| 2021 | 1.3 | 0.9 | 0.3 |
| 2022 | 1.3 | 0.9 | 0.3 |
| 2023 | 1.4 | 0.9 | 0.3 |
| 2024 | 1.4 | 0.8 | 0.3 |
| 2025 | 1.4 | 0.8 | 0.2 |
| 2026 | 1.4 | 0.8 | 0.2 |
| 2027 | 1.5 | 0.8 | 0.2 |
| 2028 | 1.5 | 0.7 | 0.2 |
| 2029 | 1.5 | 0.7 | 0.2 |
| 2030 | 1.5 | 0.6 | 0.2 |
The modelling projects that the measures in the Emissions Reductions Plan will continue to foster strong economic growth. Canada's GDP is projected to grow from $2.1 trillion (in 2017$) in 2020 to $2.7 trillion in 2030. Relative to the growth in real GDP in the baseline, the Emissions Reduction Plan is projected to lead to a minor reduction in real GDP growth of about 0.02% in annual GDP growth, an amount that is considerably less than the average annual revision to GDP year over year.
The projected impact on GDP is potentially overestimated since taking early action to reduce the cost of climate change will also reduce GDP loss due to climate impacts. The projected impact on GDP is also likely overestimated since it does not account for the impact that clean innovation spurred by these measures will have in helping Canadian companies create jobs and compete successfully in the global shift to cleaner growth.
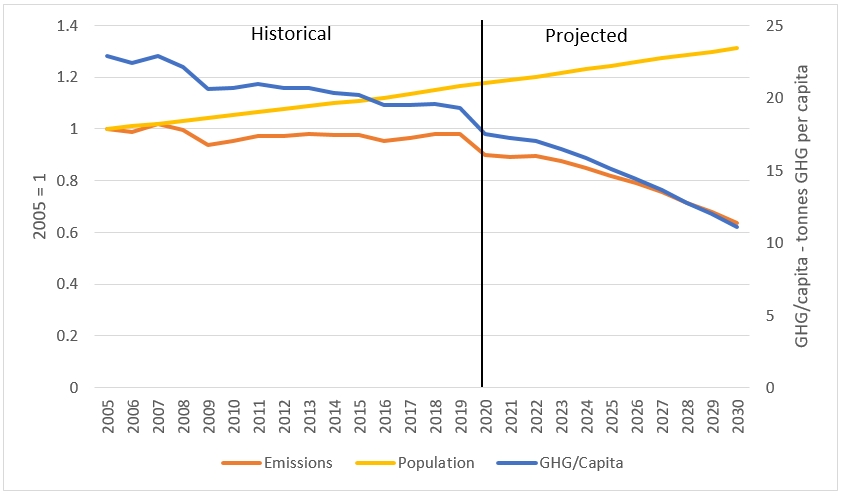
Over the 2005 to 2030 period, Canada's population is projected to be about 31% larger, while over the same period, GHG emissions are projected to fall by 36.4%. These trends imply that emission intensity in terms of GHG/capita is projected to steadily decline over the period. Between 2005 and 2030, GHG/GDP is projected to decline from 22.9 tonnes per capita to 11.1 tonnes per capita. Between 2005 and 2030, this represents an average annual decline of 2.9%. Focusing on the 2022 to 2030 period, the actions included in the Emissions Reduction Plan are projected to accelerate the average annual decline to 5.2%.
Figure 6.4: Population, GHG and Emission Intensity
Projected
Long description
| Year | Population | Greenhouse gas (GHG) emissions | GHG emissions per capita |
| 2005 | 1 | 1 | 23 |
| 2006 | 1 | 0.9 | 22 |
| 2007 | 1 | 1 | 23 |
| 2008 | 1 | 0.9 | 22 |
| 2009 | 1 | 0.9 | 21 |
| 2010 | 1.1 | 0.9 | 21 |
| 2011 | 1.1 | 0.9 | 21 |
| 2012 | 1.1 | 0.9 | 21 |
| 2013 | 1.1 | 0.9 | 21 |
| 2014 | 1.1 | 0.9 | 20 |
| 2015 | 1.1 | 0.9 | 20 |
| 2016 | 1.1 | 0.9 | 19 |
| 2017 | 1.1 | 0.9 | 20 |
| 2018 | 1.1 | 0.9 | 20 |
| 2019 | 1.2 | 0.9 | 19 |
| 2020 | 1.2 | 0.9 | 17 |
| 2021 | 1.2 | 0.9 | 17 |
| 2022 | 1.2 | 0.9 | 17 |
| 2023 | 1.2 | 0.9 | 16 |
| 2024 | 1.2 | 0.8 | 16 |
| 2025 | 1.2 | 0.8 | 15 |
| 2026 | 1.3 | 0.8 | 14 |
| 2027 | 1.3 | 0.8 | 14 |
| 2028 | 1.3 | 0.7 | 13 |
| 2029 | 1.3 | 0.7 | 12 |
| 2030 | 1.3 | 0.6 | 11 |
Appendix – Key Assumptions
This document provides a detailed list of some of assumptions underlying the modelling of the Emissions Reductions Plan under the Canadian Net-Zero Emissions Accountability Act. This list is not intended to be comprehensive of all of the measures included in the plan.
6.A.1. Key Assumptions
Carbon Pricing
Fuel Charge
The federal government announced that the federal fuel charge rates will reflect an annual increase of $15/tonne CO2 eq. after 2022 until the fuel charge rates reflect a carbon price of $170/t CO2 eq. in 2030. The federal fuel charge is a backstop policy that applies a regulatory charge on fossil fuels in provinces/territories that do not have a carbon pricing system that meets minimum stringency criteria (the benchmark).
As carbon pricing systems are in the process of being adjusted to align with the 2023-2030 minimum national stringency requirements (federal benchmark), for illustrative purposes the modelling assumes the fuel charge applies in all provinces and territories apart from Quebec, which is modeled based on its current cap-and-trade carbon pricing system.
Federal Output-Based Pricing System
The Output-Based Pricing System (OBPS) is a performance-based emissions trading system for industry that puts a price incentive on all industrial emissions. For every tonne of excess emissions above a specified annual limit (based on emissions intensity output-based standards), facilities have to pay the carbon price or submit eligible credits. Facilities with emissions below the limit receive credits to sell or use for compliance. The federal government announced that the charge for excess emissions under the OBPS will increase annually by $15/tonne CO2e starting in 2023 until it reaches $170/tonne CO2 eq. in 2030.
As carbon pricing systems are in the process of being adjusted to align with the 2023-2030 minimum national stringency requirements (federal benchmark), for illustrative purposes the modelling assumes large emitters are covered under an OBPS-type system in all provinces and territories apart from Quebec, which is modeled based on its current cap-and-trade carbon pricing system. The modelling of the OBPS assumes a 2% tightening in stringency every year post-2022 and the modelling assumes that any excess credits in the OBPS market post-2027 are cleared at the benchmark carbon price. As the new decarbonization measures outlined in this plan are further defined and implemented, carbon pricing systems targeting industrial emissions may need to be further strengthened post-2027 to maintain their effectiveness and continue to drive emissions reductions at the benchmark price. An interim assessment of carbon pricing systems by 2026 will create an opportunity to adjust systems if necessary.
Investment tax credit for CCUS
Budget 2021 proposed an investment tax credit for carbon capture utilization and storage capital investments, starting in 2022. The target of this measure is to reduce emissions by at least 15 Mt of CO2 eq./ per year.
Canada Infrastructure Bank Spending
The Canada Infrastructure Bank (CIB) has a long-term investment target of $5 billion for clean power projects. CIB has committed $1.5 billion for zero emission buses, $2.5 billion for low-carbon power projects, including storage, transmission and renewables, over 3 years, and $2 billion for commercial building retrofit upfront costs.
Net Zero Accelerator
A Healthy Environment and a Healthy Economy announced an investment of $3 billion over 5 years for the Net Zero Accelerator, which provides funding for development and adoption of low-carbon technologies in all industrial sectors. Budget 2021 provided an additional $5 billion over seven years for the Net Zero Accelerator. For modelling purposes, the Net Zero Accelerator is simulated as an $8 billion subsidy over seven years for industrial low-carbon technologies.
Budget 2021 Measures
Agricultural funding
Budget 2021 provided $165.5 million to the Clean Technology Program, which consists of an adoption stream, subsidizing low-carbon technology, precision agriculture, and bioeconomic solutions adoption, and a research and innovation stream. Over the next two years, $10 million from this fund will be provided for low-carbon energy use on farms and $50 million for purchasing more efficient grain dryers.
Residential efficiency retrofits
Greener Homes program provides up to 700,000 grants of up to $5,000 to help homeowners make energy efficient retrofits to their homes, such as better insulation
To help homeowners and build on these measures, the 2021 Federal Budget proposed $4.4 billion over 5 years, starting in 2021-2022 to help up to 175,000 homeowners complete major home retrofits through interest-free loans of up to $40,000.
Energy efficiency for space heating and cooling – commercial
Between 2022 and 2030, building shell energy efficiency of all building stock increases such that energy demand per floor space declines by 3.5% for space heating and by 3.6% for space cooling (compounded year-over-year).
Energy efficiency for auxiliary equipment – commercial
Between 2022 and 2030, energy efficiency of all equipment stock (excl. refrigeration) increases by an average additive increment of 0.9% per year, and refrigeration stock efficiency increases by an average of 1.3% per year.
Energy efficiency for auxiliary motors – commercial
Between 2022 and 2030, energy efficiency of all equipment stock increases by an average additive increment of 1.3% per year.
Energy efficiency of lighting – commercial
Between 2022 and 2030, energy efficiency of all equipment stock increases by an average additive increment of 1.1% per year.
Buildings
Net-zero ready building codes
Residential: Increase energy efficiency such that new buildings use 61% less energy by 2025 and 65% less energy by 2030 in comparison to 2019.
Commercial: Increase energy efficiency such that new buildings use 47% less energy by 2025 and 59% less energy by 2030 in comparison to 2019.
Light duty vehicles (LDV)
Annual improvements in new vehicle fuel efficiency of 1.5% for 2021-2022, 10% for 2023, 5% for 2024-2026; with no ZEV carve out (i.e. cannot be met through ZEV sales).
Electrify passenger LDV and Light duty trucks (LDT)
Increase sales shares of LDV Electric, LDT Electric, LDV Hybrid, and LDT Hybrid to 60% in 2030 and 100% in 2035.
Post-2026 LDV standards aligned to upcoming California regulations
For the years 2027-2030, annual fuel efficiency improvements of 1.5% per year in gasoline and diesel LDVs. Modelled consistently with the ZEV carve out (i.e. cannot be met through ZEV sales).
Electrify freight heavy duty vehicles (HDV)
Increase sales shares to reflect 100% sales of HDVs "where feasible": reaching approximately 35% by 2030.
Sustainable Aviation Fuel
Switches out 1.2% of jet fuel for Ethanol in Air Freight and Air Passenger in 2030.
National Active Transportation Strategy
Reduces energy demand in Passenger by 0.33% in 2030.
Electrifying Public Transit System
100% of new buses are electric by 2040.
Transportation
Invest $200M to retrofit large trucks
Retrofit spread evenly over four years, starting in the second half of 2024.
Electrification in key industrial sectors
Starting in 2022, electricity share (%) of all equipment stock increases linearly to attain an incremental 2% increase in 2030.
Electrify Cement
Starting in 2022, electricity share (%) of all equipment stock increases linearly from 0% to 1% in 2030.
Electrify Iron and Steel
Starting in 2022, electricity share (%) of all equipment stock increases linearly to attain an incremental 1% increase in 2030.
Electrify Mining
Starting in 2022, minimum electricity share (%) of off-road equipment stock increases linearly from 0% to 4% in 2030.
Energy efficiency for all sectors of Heavy Industry
Starting in 2022, energy efficiency of all GHG-emitting facility installations for all end-uses increases by a target of 2% each year until 2030.
Energy Efficiency for Light Manufacturing
Starting in 2022, energy efficiency of all GHG-emitting facility installations for all end-uses increases by a target of 2% each year until 2030.
Heavy Industry
(Proxy for Net Zero Accelerator/Strategic Innovation Fund)
Inert aluminum anodes
20% adoption by 2030.
Extended Methane Regulation
75% reduction relative to 2012 by 2030.
Oil and Gas
Steam Assisted Gravity Drainage solvents
For all new facilities as of 2025.
Implement a Clean Electricity Standard (CES) for electricity-generating units
Net-zero emitting electricity system by 2035.
Deployment of new types of electricity-generating units: Small Modular Nuclear Reactors as well as Coal and Natural Gas with Carbon Capture and Storage
Project economics determines deployment.
Construction of new interties: BC-AB
In 2030: restoration of existing line from 800 to 1200 MW.
Construction of new interties: SK-MB
In 2030: new 500 MW line.
Construction of new interties: QC-NB
Online in 2030, new 600 MW line, contract of 2 TWh/year.
Electricity
Construction of new interties: QC-NS
Online in 2030, new 550 MW line, contract of 2 TWh/year.
Waste
Increasing landfill methane recovery
Starting in 2022, landfill gas capture at municipal solid waste facilities increase linearly to attain collection efficiency in 2030 between 31% to 75% at the provincial level.
Hydrogen
Given that specific measures to implement the Hydrogen Strategy have not yet been developed, the modelling assumes as a proxy a 7.3% hydrogen blending into the natural gas stream in term of purchased natural gas. This means that the 7.3% blending applied only to purchased natural gas and not all natural gas consumed. For example, natural gas used in the production and processing/refinement of crude oil and natural gas is not subject to the blending.