
President of the Treasury Board’s Fees Report for the 2019-20 Fiscal Year
On this page
President’s message

President of the Treasury Board
On behalf of the Government of Canada, I am pleased to present the third annual Fees Report for fiscal year 2019-2020. The purpose of this report is to increase openness, transparency and accountability, by providing Parliament and Canadians with a consolidated, government-wide view of fees charged by departments and agencies during the 2019-2020 fiscal year.
Through its introduction of the Service Fees Act and the Directive on Charging and Special Financial Authorities, the Government has modernized the way fees are charged to businesses and individuals. The new reporting system includes greater departmental accountability and information for fee payers on service standards, thus further demonstrating the Government’s commitment to open and transparent fee management. Adopting this system has enabled departments to improve service efficiency while strengthening oversight through better reporting to Parliament.
This report includes new information on the Low-Materiality Fees Regulations, which came into effect on May 1, 2019. These regulations enabled departments to administer low-materiality fees in a more cost-effective way. This reduces administrative burden and ensures greater efficiency in service delivery and fee administration, leading to better departmental results.
I invite you to read the report to see the Government’s progress in modernizing fee management.
Original signed by
The Honourable Jean‑Yves Duclos, P.C., M.P.
President of the Treasury Board
About this report
The Service Fees Act (SFA) came into force on June 22, 2017, replacing the User Fees Act. The SFA modernized the Government of Canada’s fee regime and established a solid foundation for departments,Footnote 1 while providing fee payers with information on the level of service that they can expect.
The information in this report has been extracted from Departmental Fees Reports that were tabled under section 20 of the SFA and subsections 4.2.8 and 6.3 of the Treasury Board Directive on Charging and Special Financial Authorities. Departmental Fees Reports contain information about all fees that are under departmental authority, even if some or all of the fees were collected by another department. This report also outlines the various types of fee adjustments and authorities that allow departments to issue remissions.
Fees charged by departments under the Access to Information Act (ATIA) are subject to the SFA, but they are not included in Departmental Fees Reports. Information about each department’s fees for access to information for the 2019-20 fiscal year is reported and tabled in their department’s annual access to information report and posted on each department’s website. In order to carry out the duties related to the ATIA, departments listed in Schedules I, I.1 and II of the Financial Administration Act (FAA) collected $741,020 in revenue, incurred $71,642,765 in costs and waived $28,304 in fees. The Access to Information and Privacy Statistical Report for the 2019 to 2020 Fiscal Year can be found at Statistics on the Access to Information and Privacy Acts.
This consolidated report provides an overview of the government’s fee regime and has been broken down into the following sections:
- The Fees section provides information on the types of fees that are charged and the number of fees that were reported and tabled in Parliament
- The Revenue section provides total revenue from fees, along with highlights for the three revenue streams
- The Fee adjustments section summarizes the different mechanisms to adjust fees, including the SFA requirement for an automatic annual adjustment
- The Service standards and remissions section:
- describes the purpose of a service standard
- explains remissions and summarizes the types of authorities that exist, and the total amount of remissions issued in relation to fees
On May 1, 2019, the Low-Materiality Fees Regulations came into force. The regulations were created to provide a more cost-effective way for departments to administer low-materiality fees under $51 by exempting them from establishing service standards and issuing remissions. Such fees are also not adjusted annually based on the Consumer Price Index. The regulations require departments to adhere to the established criteria for applicable fees and, in turn, the annual Departmental Fees Reports have been modified to ensure compliance with the new regulations.
Fees
Under the Directive on Charging and Special Financial Authorities, all departments that charge fees must produce a fees report, regardless of whether they are exempt from the SFA.
The Government of Canada has three mechanisms for departments to set fees for the provision of a service, the provision of the use of a facility, the conferral by the means of a licence, permit or other authorization of a right or privilege, or for a provision of a product, and for recovery, in whole or in part, of costs that are incurred in relation to a regulatory scheme:
- Fees set by contract: Ministers have the authority to enter into contracts, which are usually negotiated between the Minister and an individual or an organization, and which cover fees and other terms and conditions. In some cases, that authority may also be provided by an act of Parliament.
Example: services provided to a foreign government to implement a Canadian regulatory model. - Fees set by market rate, auction or both: The authority to set these fees is pursuant to an act of Parliament or regulation, and the Minister, department or Governor in Council has no control over the fee amount.
Example: auction of a licence to the highest bidder that meets the pre-established regulatory requirements. - Fees set by act, regulation or fees notice: An act of Parliament delegates the fee-setting authority to a department, Minister or Governor in Council.
Example: a fixed fee for the review of an application for a licence to operate in Canada.
In the 2019-20 fiscal year, departments were provided with additional guidance on how to determine the number of fees within their control under each of the three mechanisms set out above and how those fees meet the new criteria of the Low-Materiality Fees Regulations. The additional guidance and the implementation of the regulations mean that departments are required to review their fee structures more closely, which has resulted in more accurateFootnote 2 reporting across government.
A total of 38,792 fees set by act, regulation or fees notice were reported and tabled in Parliament by departments in the 2019-20 fiscal year (compared to 9,112 such fees in the 2018-19 fiscal year). During the 2019-20 fiscal year, 263 new fees were introduced, 403 fees were eliminated and 32,364 fees were under review. Table 1 highlights the 10 departments that charge the most fees set by act, regulation or fees notice, and provides a total of such fees for all other departments. The fees below reflect the individual fees that departments have the authority to charge.
| Rank | Department | Number of fees (#) | Percentage of total revenue generated by fees set by act, regulation or fees notice (%)table 1 note * |
|---|---|---|---|
| 1 | National Film Board | 29,580 | >0.01 |
| 2 | Parks Canada | 3,622 | 3.80 |
| 3 | Transport Canada | 2,274 | 0.94 |
| 4 | Canada Food Inspection Agency | 852 | 1.74 |
| 5 | Innovation, Science and Economic Development Canada | 519 | 17.71 |
| 6 | Fisheries and Oceans Canada | 483 | 2.72 |
| 7 | Health Canada | 251 | 5.39 |
| 8 | National Research Council Canada | 242 | 0.09 |
| 9 | Natural Resources Canada | 230 | 0.16 |
| 10 | Canadian Nuclear Safety Commission | 165 | 3.58 |
| N/A | All other departments (23) | 574 | 63.86 |
| Total | 38,792 | 100.00 | |
Table 1 Notes
|
|||
Revenue
When fees are collected from fee payers, they are treated as revenue by the Government of Canada. As mentioned in the Fees section, there are three types of fees that generate revenue.
In the spirit of open and transparent fee management, departments must disclose lump-sum amounts for fees set by contract and fees set by market rate, auction or both, and provide greater detail for fees set by act, regulation or fees notice.
In the 2019-20 fiscal year, the Government of Canada collected approximately $9.9 billion in fees:
- fees set by contract made up 31% of the fees collected
- fees set by market rate, auction or both made up 36% of the fees collected
- fees set by act, regulation or fees notice made up 33% of the fees collected
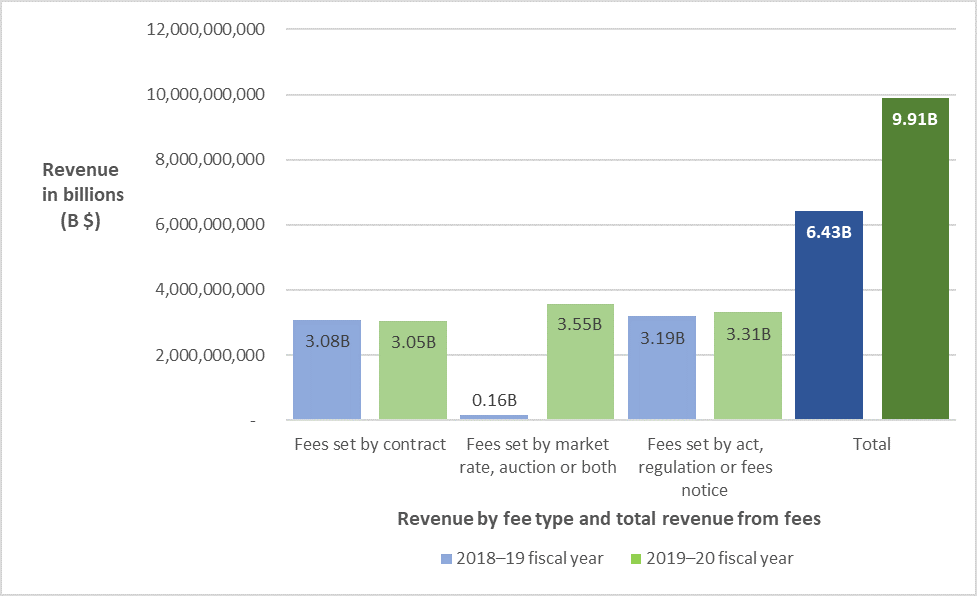
Figure 1 - Text version
| 2018–19 fiscal year | 2019–20 fiscal year | |
|---|---|---|
| Fees set by contract | 3,085,856,572 | 3,046,354,160 |
| Fees set by market rate, auction or both | 160,676,132 | 3,553,637,911 |
| Fees set by act, regulation or fees notice | 3,187,311,745 | 3,308,130,020 |
| Total | 6,433,844,449 | 9,908,122,091 |
Figure 1 Notes
|
||
Fees set by contract
Table 2 highlights the top 10 departments by revenue generated by fees set by contract during the 2019-20 fiscal year.
| Rank | Department | 2019-20 revenue ($) | Percentage of total revenue (%)table 2 note * |
|---|---|---|---|
| 1 | Royal Canadian Mounted Police | 2,357,680,111 | 77.39 |
| 2 | Public Services and Procurement Canada | 167,943,728 | 5.51 |
| 3 | National Research Council Canada | 160,985,849 | 5.28 |
| 4 | Canada Revenue Agency | 139,286,800 | 4.57 |
| 5 | Environment and Climate Change Canada | 80,102,199 | 2.63 |
| 6 | Parks Canada | 37,369,273 | 1.23 |
| 7 | Global Affairs Canada | 35,217,371 | 1.16 |
| 8 | Statistics Canada | 18,921,362 | 0.62 |
| 9 | National Defence | 18,112,303 | 0.59 |
| 10 | Natural Resources Canada | 15,619,692 | 0.51 |
| N/A | All other departments (29 departments) | 15,115,471 | 0.50 |
| Total | 3,046,354,160 | 100.00 | |
Table 2 Notes
|
|||
During the 2018-19 fiscal year, $3,085,856,572 in fees set by contract were collected by the Government of Canada, whereas in the 2019-20 fiscal year, $3,046,354,160 in such fees were collected, which represents a decrease of $39,502,412 (1.28%).
Fees set by market rate, auction or both
Table 3 lists the three departments that reported revenue generated by fees set by market rate, auction or both during the 2019-20 fiscal year.
| Rank | Department | 2019-20 revenue ($) | Percentage of total revenue (%)table 3 note * |
|---|---|---|---|
| 1 | Innovation, Science and Economic Development Canada | 3,507,488,677 | 98.70 |
| 2 | Public Services and Procurement Canada | 38,938,984 | 1.10 |
| 3 | National Research Council Canada | 7,210,250 | 0.20 |
| Total | 3,553,637,911 | 100.00 | |
Table 3 Notes
|
|||
In the 2019-20 fiscal year, these three departments reported a total revenue of $3,553,637,911 in fees set by market rate, auction or both, which is $3,392,961,779 (95.4%) more than the $160,676,132 that was reported in the 2018-19 fiscal year.
Fees set by act, regulation or fees notice
In the 2019-20 fiscal year, the Government of Canada collected $3,308,130,020 in revenue from fees set by act, regulation or fees notice. This represents an increase of $120,818,275 (3.65%) compared to the 2018-19 fiscal year.
Table 4 highlights:
- the top 10 departments by revenue generated by fees set by act, regulation or fees notice during the 2019-20 fiscal year, which accounted for 90% of all revenue collected
- the variances from the 2018-19 fiscal year to the 2019-20 fiscal year
| Rank | Department | 2018-19 revenue ($) | 2019-20 revenue ($)table 4 note * | Variance in revenue from 2018-19 to 2019-20 ($) | Percentage variance from 2018-19 to 2019-20 (%) | Percentage of total 2019-20 revenue (%)table 4 note * |
|---|---|---|---|---|---|---|
| 1 | Immigration, Refugees and Citizenship Canada | 1,329,827,543 | 1,347,919,501 | 18,091,958 | 1.36 | 40.75 |
| 2 | Innovation, Science and Economic Development Canada | 583,941,009 | 585,900,964 | 1,959,955 | 0.34 | 17.71 |
| 3 | Canadian Radio-television and Telecommunications Commission | 176,946,890 | 188,871,192 | 11,924,302 | 6.74 | 5.71 |
| 4 | Health Canada | 120,090,045 | 178,300,057 | 58,210,012 | 48.47 | 5.39 |
| 5 | Office of the Superintendent of Financial Institutions | 158,764,099 | 178,078,609 | 19,314,510 | 12.17 | 5.38 |
| 6 | Parks Canada | 125,642,686 | 125,804,252 | 161,566 | 0.13 | 3.80 |
| 7 | Canadian Nuclear Safety Commission | 116,872,326 | 118,472,534 | 1,600,208 | 1.37 | 3.58 |
| 8 | Canada Energy Regulator | 108,210,000 | 107,301,775 | -908,225 | -0.84 | 3.24 |
| 9 | Fisheries and Oceans Canada | 82,248,851 | 90,048,967 | 7,800,116 | 9.48 | 2.72 |
| 10 | Canadian Grain Commission | 61,101,807 | 60,384,688 | -717,119 | -1.17 | 1.83 |
| Subtotal | 2,863,645,256 | 2,981,082,539 | 117,437,283 | 4.10 | 90.11 | |
| N/A | All other departments (23) | 323,666,489 | 327,047,481 | 3,380,992 | 1.04 | 9.89 |
| Total | 3,187,311,745 | 3,308,130,020 | 120,818,275 | 3.65 | 100.00 | |
Table 4 Notes
|
||||||
The following are variance explanations provided by the top 10 revenue-generating departments:
1. Immigration, Refugees and Citizenship Canada
The decrease in revenue is mainly attributed to the decrease in Passport applications, which was anticipated, in the second half of the 10-year business cycle (the 2018-19 fiscal year to the 2023-24 fiscal year). The decrease in Passport revenue is offset by increases in Citizenship and Biometric-related applications and revenue.
2. Innovation, Science and Economic Development Canada
The Canada Small Business Financing Program is market-driven, and the 4.4% variance in revenues received is driven by new loans registered and outstanding loan balances.
The Canadian Intellectual Property Office’s $5.5 million year-over-year decrease in revenue was driven by reductions in trademark revenue and in other revenue due to the coming into force of the new legislation. These reductions were partially offset by a higher volume of renewals before the coming into force of the treaties in June 2019. The decrease is also due to patent examination revenues, which is mainly due to a reduction in production hours due to the training of new recruits and a revision of production objectives to take into account breaks.
The Competition Bureau’s 15.4% variance is due to an increase in the number of merger filings combined with increased fees.
Corporations Canada’s increased revenue of $1 million between the 2018-19 fiscal year and the 2019-20 fiscal year is mainly due to an increase of 9% in new incorporation and an increase of 13% in the other applications.
Measurement Canada’s 15.4% revenue variance is demand-driven; it is based on requests for mandatory services, and the number of authorized service providers renewing their recognition to certify electricity and natural gas meters and scales, gas pumps and other measuring devices. Revenues are also impacted by delays in recovering fees from clients.
The Office of the Superintendent of Bankruptcy Canada’s total revenue increased in the 2019-20 fiscal year due, in large part, to an 8.5% increase in the number of insolvencies filed and an increase of over 6% in revenue collected for the Superintendent’s levy compared to the previous fiscal year.
The Spectrum and Telecommunications Sector’s 0.2% decrease in revenue is due to regular fluctuations in radio licensing.
3. Canadian Radio-television and Telecommunications Commission
The increase in the Canadian Radio-television and Telecommunications Commission’s revenue was due to a combination of factors. In the 2019-20 fiscal year, several collective agreements were ratified, including retroactive payments. The Broadband Fund’s project management capacity was built, which contributed to an increase in broadcasting and telecommunications-related regulatory costs that are recoverable from industries. Also, the Consumer Price Index rate of 2.3%, compared to the 2018-19 fiscal year, was used for the annual adjustment to the Part II Broadcasting Licence Fee.
4. Health Canada
The 2019-20 fiscal year was the first year for full-year collections related to cannabis, which resulted in an increase of $46.3 million. The variance is also explained by the National Dosimetry Services, Drug Master Files and Certificate of Pharmaceutical Products, which were reported under “fees set by contract” in the 2018-19 fiscal year. However, as a result of additional guidance, these are now to be reported as “fees set by act, regulation or fees notice.”
5. Office of the Superintendent of Financial Institutions
Variance mainly driven by increased assessments due to increase in costs as fee revenue is adjusted each year to fully recover actual costs.
6. Parks Canada
Variance originates from changes in visitation and consumed services in Parks Canada’s places from year to year.
7. Canadian Nuclear Safety Commission
The increase in revenue was attributable to an increase in fees for nuclear substances used for commercial and industrial activities. The Canadian Nuclear Safety Commission continues to phase in increases to recover the costs for these activities. An additional revenue increase came from special projects due to increased demand for vendor design reviews for small modular reactors.
8. Canada Energy Regulator
The Canada Energy Regulator is funded through parliamentary appropriations. The Government of Canada recovers approximately 99% of the appropriation from regulated industry. The process is regulated by the National Energy Board Cost Recovery Regulations. Revenues reflected are based on the actual costs incurred in that year. The decrease is mainly due to decreased costs associated with the Trans Mountain Expansion Project and is offset by increased employee benefit plans.
9. Fisheries and Oceans Canada
The variance is attributable to a combination of increased volume during the fiscal year and the Consumer Price Index in the following fee categories: Fishery Management, Icebreaking, Maintenance Dredging and Marine Services. The variance also reflects the inclusion of revenues collected under Fisheries and Oceans Canada’s regulations, where authority has been delegated to the Yukon, the Northwest Territories and Nunavut.
10. Canadian Grain Commission
The Canadian Grain Commission’s revenue is largely determined by two specific fees (Official Inspection of Ships and Official Weighing of Ships). The fees charged are driven by overall tonnage inspected and weighed by the organization. Overall tonnage of grain is variable from year to year. In the 2019-20 fiscal year, the Canadian Grain Commission provided official inspection and weighing of 38.6 million tonnes of grain. In the 2018-19 fiscal year, the Canadian Grain Commission provided official inspection and weighing of 39.5 million tonnes of grain. This was a reduction of 900,000 tonnes of grain, which is the primary reason for the decrease in revenue from the 2018-19 fiscal year to the 2019-20 fiscal year.
Fee adjustments
-
In this section
Prior to the coming into force of the SFA in 2017, certain fees set by act, regulation or fees notice had periodic adjustments to keep up with inflationary increases; however, a considerable number of fees did not have any mechanism to keep pace with the impact of inflation on the cumulative cost of delivering the service or product.
In order to ensure that departments are able to remain cost effective when delivering services, the SFA introduced an automatic annual adjustment. All fees set by act, regulation or fees notice are subject to this annual adjustment by default.
In certain circumstances, some fees are not subject to the annual adjustment set out in the SFA, as another act of Parliament prescribes a periodic adjustment, or they are exempt from the SFA. Furthermore, if a fee is considered to be a low-materiality fee, according to the Low-Materiality Fees Regulations, it is also exempt from the SFA’s annual adjustment.
Service Fees Act annual adjustment
Subsection 17(1) of the SFA requires responsible authorities to adjust their applicable fees each fiscal year by the percentage change over 12 months in the April All-items Consumer Price Index (CPI) for Canada, as published by Statistics Canada.
The 2019-20 Departmental Fees Reports include a CPI adjustment, based on the CPI for April 2018, of 2.2% for applicable fees.
Periodic adjustment
A periodic fee adjustment is made pursuant to an act of Parliament or regulation and is applied according to an established frequency, based on a specific rate, formula or other factor, other than the adjustment rate set out in subsection 17(1) of the SFA.
Service standards and remissions
-
In this section
In order to improve services to fee payers, the SFA requires that applicable fees have an established service standard. A service standard is a public commitment to provide a service in a way that is measurable and relevant to the fee payers under normal circumstances.
Additionally, to ensure accountability, the SFA introduced the requirement to remit. A remission is a partial or full return of a fee to a fee payer when a department deems that the relevant service standard was not met.
The requirement to remit under the SFA takes effect on April 1, 2021. Departments will be reporting on remissions issued pursuant to the SFA for the first time in their 2021-22 Departmental Fees Reports, which will be published during the 2022-23 fiscal year.
Service standards
The Low-Materiality Fees Regulations established criteria that define what low-materiality fees are, and which fees are not required by the SFA to establish service standards in order to provide a more cost-effective way for departments to administer low-materiality fees.
The following table provides a breakdown of the 38,792 fees and their requirements with respect to service standards, outlining which ones are subject to sections 4 to 7 of the SFA and which ones are exempt.
| Fee type and applicable exemption type | Number of feestable 5 note * |
|---|---|
| Fees subject to the SFA that require a service standard | 4,605 |
| Fees subject to the SFA that are exempt from having a service standard (because the fee is for the provision of a product or the recovery, in whole or in part, of costs that are incurred in relation to a regulatory scheme; refer to subsection 3(1) of the SFA) | 1,497 |
| Fees subject to the SFA that have obtained an exemption based on section 22 of the SFA and the Low-Materiality Fees Regulations | 32,604 |
| Fees not subject to the SFA according to other enabling legislation | 86 |
| Total | 38,792 |
Table 5 Notes
|
|
Of the 4,605 fees that require service standards according to the SFA, departments reported that, as of March 31, 2020, 2,704 fees had existing service standards. Departments continue to work toward establishing service standards for their remaining fees to comply with the SFA. For departments that charge fees set by act, regulation or fees notice, information about service standards and corresponding performance results can be found in the “Details on each fee set by act, regulation or fees notice” section of their Departmental Fees Reports.
Remissions
The SFA requires departments to remit the portion of a fee that they consider appropriate to an affected fee payer when a service standard has been deemed not met. Furthermore, departments must issue the remission before July 1 of the following fiscal year.
Departments must develop policies to determine whether a service standard has been met and how much of a fee will be remitted to a fee payer, according to the Directive on Charging and Special Financial Authorities. The departmental remission policy and procedures are to be available to the public on April 1, 2021.
Other Treasury Board policies and directives may require fees to have an established service standard; however, those fees may not be subject to remissions under the SFA because they have been granted exemptions from certain sections of the SFA.
The 2019-20 Departmental Fees Reports include remissions issued under departments’ enabling legislation or the FAA. They do not include remissions issued under the authority of the SFA. Departments will be reporting on remissions issued under the SFA for the first time in their 2021-22 Departmental Fees Reports, which will be published during the 2022-23 fiscal year.
Authorities to remit
With regard to fees, there are different authorities that allow departments to remit fees under different circumstances. The following are the various authorities that exist.
Authority to remit pursuant to the Service Fees Act
Subsection 7(2) of the SFA provides the authority to remit the appropriate portion of a fee only when a service standard in relation to that fee has been deemed not met. The remission is to be made in accordance with the Treasury Board Directive on Charging and Special Financial Authorities and the departmental remission policy.
Authority to remit pursuant to the Financial Administration Act
Departments may submit a Treasury Board submission to the Governor in Council, in order to obtain an authority to remit via the FAA. If granted, the authority may be provided for a specific fee or for a designated period. This type of authority is sought to remit on a matter that may be other than the authority provided by the SFA (that is, for service standards that were deemed not met).
Authority to remit pursuant to other acts of Parliament
Certain departments have received an authority to remit fees via their enabling act or acts and may remit depending on the context and the wording in the act and related regulations, which may be for reasons other than a service standard that was deemed not met.
Appendix: links to departmental fees reports for the 2019-20 fiscal year
Listed below are links to the Departmental Fees Reports for the 2019-20 fiscal year. Each report contains information on specific departmental fee regimes, including:
- financial information regarding the total costs of, total revenues generated by and any remissions of:
- fees set by contract
- fees set by market rate, auction or both
- fees set by act, regulation or fees notice
- for each fee, detailed information about:
- the date that the fee was introduced and last amended, if applicable
- the dollar amount of the fee in the 2019-20 fiscal year
- the adjusted dollar amount of fees for the 2021-22 fiscal year, if applicable
- service standards, if applicable
- performance results against these standards
Links to Departmental Fees Reports for the 2019-20 fiscal year:
Institutions - A to Z Menu:
A B C D E F G H I J K L M N O P Q R S T U V W X Y ZInstitutions starting with the letter A
Institutions starting with the letter C
- Canada Border Services Agency
- Canada Energy Regulator (formerly known as the National Energy Board)
- Canada School of Public Service
- Canada Revenue Agency
- Canadian Food Inspection Agency
- Canadian Grain Commission
- Canadian Heritage
- Canadian Nuclear Safety Commission
- Canadian Radio-television and Telecommunications Commission
- Canadian Space Agency
- Crown-Indigenous Relations and Northern Affairs Canada
Institutions starting with the letter D
Institutions starting with the letter E
Institutions starting with the letter F
Institutions starting with the letter G
Institutions starting with the letter H
Institutions starting with the letter I
- Immigration, Refugees and Citizenship Canada
- Impact Assessment Agency of Canada (formerly known as the Canadian Environmental Assessment Agency)
- Indigenous Services Canada
- Innovation, Science and Economic Development Canada
Institutions starting with the letter L
Institutions starting with the letter N
Institutions starting with the letter O
Institutions starting with the letter P
Institutions starting with the letter R
Institutions starting with the letter S
Institutions starting with the letter T
© Her Majesty the Queen in Right of Canada, represented by the President of the Treasury Board, 2021,
ISSN 2562 413X