Expenditure and human resources overview - 2015–16 Departmental Performance Report - Treasury Board of Canada Secretariat
Section III: Expenditure and human resources overview
Actual expenditures
| Main Estimates | Planned spending | Total authorities available for use | Actual spending (authorities used) | Difference (actual minus planned) |
|---|---|---|---|---|
| 6,892,444,333 | 6,892,444,333 | 6,270,667,911 | 4,127,888,742 | -2,764,555,591 |
| Planned | Actual | Difference (actual minus planned) |
|---|---|---|
| 1,844 | 1,807 | -37 |
Budgetary performance summary
| Strategic Outcome, Program(s) and Internal Services | 2015–16 Main Estimates | 2015–16 Planned spending | 2016–17 Planned spendingBudgetary performance summary note * | 2017–18 Planned spendingBudgetary performance summary note * | 2015–16 Total authorities available for use | 2015–16 Actual spending (authorities used) | 2014–15 Actual spending (authorities used) | 2013–14 Actual spending (authorities used) |
|---|---|---|---|---|---|---|---|---|
| Note: Any minor numerical differences are due to rounding. |
||||||||
| Strategic Outcome: Government is well managed and accountable, and resources are allocated to achieve results | ||||||||
| Management frameworks | N/A | N/A | N/A | N/A | N/A | N/A | 54,481,225 | 57,875,343 |
| People management | N/A | N/A | N/A | N/A | N/A | N/A | 128,785,777 | 57,834,089 |
| Expenditure management | N/A | N/A | N/A | N/A | N/A | N/A | 30,431,157 | 35,573,464 |
| Financial management | N/A | N/A | N/A | N/A | N/A | N/A | 31,231,325 | 31,291,934 |
| Strategic Outcome: Good governance and sound stewardship to enable efficient and effective service to Canadians | ||||||||
| Decision-making support and oversight | 47,506,141 | 47,506,141 | 50,579,535 | 49,568,557 | 44,582,570 | 41,781,563 | N/A | N/A |
| Management policies development and monitoring | 73,826,361 | 73,826,361 | 68,090,606 | 68,236,105 | 67,999,885 | 65,041,366 | N/A | N/A |
| Government-wide program design and delivery | 50,671,220 | 50,671,220 | 53,256,595 | 52,997,096 | 134,545,152 | 90,757,746 | N/A | N/A |
| Government-wide funds and public service employer payments | 6,645,161,074 | 6,645,161,074 | 6,230,254,397 | 6,230,254,397 | 5,941,211,076 | 3,852,630,170 | 2,898,360,909 | 2,629,221,633 |
| Sub-total | 6,817,164,796 | 6,817,164,796 | 6,402,181,133 | 6,401,056,155 | 6,188,338,683 | 4,050,210,845 | 3,143,290,393 | 2,811,796,463 |
| Internal Services sub-total | 75,279,537 | 75,279,537 | 65,624,896 | 69,130,661 | 82,329,228 | 77,677,897 | 78,399,289 | 80,724,486 |
| Total | 6,892,444,333 | 6,892,444,333 | 6,467,806,029 | 6,470,186,816 | 6,270,667,911 | 4,127,888,742 | 3,221,689,682 | 2,892,520,949 |
In 2015–16, the Secretariat revised its Program Alignment Architecture to better reflect core business activities and support the achievement of expected results. Due to significant differences between the Secretariat’s previous Program Alignment Architecture and current structure, historical spending for fiscal year 2013–14 and 2014–15 has not been restated.
The budgetary performance summary table on the previous page provides the following:
- Main Estimates for 2015–16
- Planned spending for 2015–16, as reported in the Secretariat’s 2015–16 Report on Plans and Priorities (RPP)
- Planned spending for 2016–17 and 2017–18 for government commitments set out in ministerial mandate letters and as reported in the Secretariat’s 2016–17 RPP
- Total authorities available for use in 2015–16, which reflects the authorities received to date, including in-year contributions from other government departments for the government-wide back office transformation initiative, which the Secretariat is leading
- Actual spending for 2015–16, 2014-15 and 2013–14, as reported in the Public Accounts
Additional details on planned spending are provided as supplementary information.
The Government-Wide Funds and Public Service Employer Payments program is the largest portion of the Secretariat’s planned spending. On average, 58 per cent of this program’s funding is transferred to other federal organizations for items such as government contingencies, government-wide initiatives, compensation requirements, operating and capital budget carry forward, and paylist expenditures (Central Votes 5, 10, 15, 25, 30 and 33). The Secretariat’s total funding available for use is reduced accordingly. The remaining 42 per cent of this program’s funding is used to pay the employer’s share of the contributions to employee pension, insurance and benefits plans.
Overall, planned spending is projected to decrease by $422 million from 2015–16 to 2017–18. The decrease can be largely attributed to a reduction in Central Vote 30, Paylist Requirements. Payments for the elimination of accumulated severance are nearing completion and are expected to return to historical reference levels by 2016–17.
Actual spending increased by $906 million from 2014–15 to 2015–16. Most of that increase, $718 million, can be attributed to statutory items, largely due to an actuarial adjustment made in relation to the Public Service Superannuation Act. The rest of the increase, $236 million, related to public service employer payments to incrementally restore the financial health of the Service Income Security Insurance Plan (SISIP). This plan is providing benefits to an increased number of medically released Canadian Armed Forces members who served in the Afghanistan mission. These increases were offset by a $48‑million decrease in the Secretariat’s operating expenditures, mostly related to the sunset of funding received in 2014–15 for the payout of an out-of-court settlement under the White class action lawsuit launched against the Crown in 2014.
Actual spending increased by $329 million from 2013–14 to 2014–15. This was primarily attributed to funding received in 2014–15 to top up the SISIP reserves to a sustainable level and to implement approved benefit changes to the Public Service Health Care Plan (PSHCP) totalling $269 million. The remaining increase of $60 million is mainly the result of new funding received for the payout of the out-of-court settlement mentioned above.
Departmental spending breakdown

Figure 6 - Text version
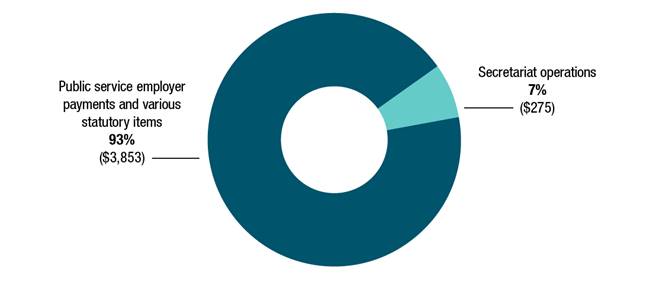
This pie chart shows the breakdown of the Treasury Board of Canada Secretariat’s actual spending for 2015–16 in two categories: public service employer payments and various statutory items, which accounted for 93 per cent of actual spending, or $3,853 million; and Secretariat operations, which accounted for 7 per cent of actual spending, or $275 million).
The Secretariat spent a total of $4.1 billion toward achieving its Strategic Outcome. Departmental operations accounted for 7 per cent of total spending. The balance, 93 per cent, relates to the Secretariat’s role in supporting the Treasury Board as employer of the core public administration.

Figure 7 - Text version
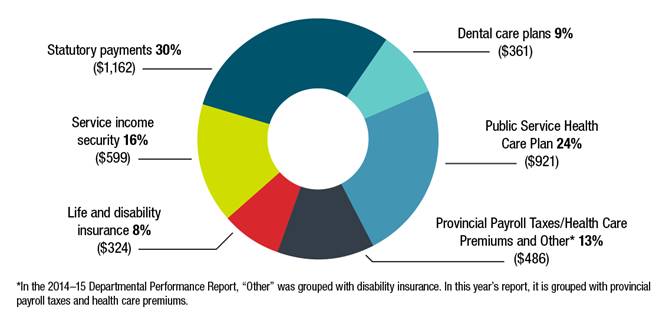
This pie chart shows the breakdown of the Treasury Board of Canada Secretariat’s actual spending on public service employer payments and various statutory items for 2015–16. The pie chart is divided into six spending categories, broken down as follows:
| Category | Amount | Percentage of total |
|---|---|---|
| Statutory payments | $1,162 million | 30% |
| Public Service Health Care Plan | $921 million | 24% |
| Service income security | $599 million | 16% |
| Provincial Payroll Taxes / Health Care Premiums and Other Note: In the 2014–15 Departmental Performance Report, “Other” was grouped with disability insurance. In this year’s report, it is grouped with provincial payroll taxes / health care premiums. | $486 million | 13% |
| Dental care plans | $361 million | 9% |
| Life and disability insurance | $324 million | 8% |
Total spending for public service employer payments was $2.7 billion in 2015–16. The amount includes payments made under public service benefit plans, legislated amounts payable to provinces and associated administrative expenditures. Statutory payments, which relate to the employer contributions made under the Public Service Superannuation Act and other retirement acts and the Employer Insurance Act totalled $1.2 billion.
Departmental spending trends

Figure 8 - Text version
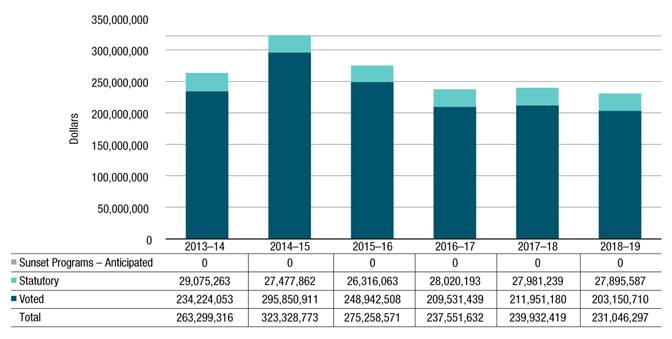
This bar graph illustrates the Secretariat’s actual spending (Vote 1) for fiscal years 2013-14, 2014-15 and 2015-16 and planned spending for fiscal years 2016-17, 2017-18 and 2018-19. Financial figures are presented in dollars along the y axis, increasing by $50 million and ending at $350 million. These are graphed against fiscal years 2013-14 to 2018-19 on the x axis
For each fiscal year, amounts for the Secretariat’s program expenditures (Vote 1), statutory vote (largely comprised of contributions to employee benefit plans), and anticipated sunset programs are identified.
No amount is reported in 2013-14 to 2018-19 as sunset programs - anticipated.
In 2013-14, actual spending was $29,075,263 for statutory items, $234,224,053 for program expenditures for a total of 263,299,316.
In 2014-15, actual spending was $27,477,862 for statutory items and $295,850,911 for program expenditures for a total of 323,328,773.
In 2015-16, actual spending was $26,316,063 for statutory items and $248,942,508 for program expenditures for a total of 275,258,571.
Planned spending for statutory items goes from $28,020,193 in 2016-17, to $27,981,239 in 2017-18 and to $27,895,587 in 2018-19.
Planned spending for program expenditures goes from $209,531,439 in 2016-17, to $211,951,180 in 2017-18, and to $203,150,710 in 2018-19.
Total planned spending goes from $237,551,632 in 2016-17, to $239,932,419 in 2017-18, and to $231,046,297 in 2018-19.
The Secretariat’s operating expenditures include salaries, non-salary costs to deliver programs and statutory items related to the employer’s contributions to the Secretariat’s employee benefit plans.
Total program expenditures increased by $60 million between 2013–14 and 2014–15, mostly because new funding was received for the payout of an out-of-court settlement to eligible claimants under the White class action lawsuit.
The decrease of $48 million between 2014–15 and 2015–16 actual spending resulted mostly from reduced expenditures in 2015–16 related to the settlement in the White case and a decrease in spending related to the Workspace Renewal Initiative (phase I). Those decreases were partially offset by expenditures incurred to support the Government-Wide Back Office Transformation Initiative.
A further decrease of $37.7 million between 2015–16 and 2016–17 is attributed to the sunset of funding received for the same out-of-court settlement and for the Government-Wide Back Office Transformation Initiative.
Program expenditures are anticipated to decrease by $6.5 million from 2016–17 to 2018–19, mostly due to the sunsetting of the Workspace Renewal Initiative (phase II) and the reprofiling of Workplace Wellness and Productivity Strategy funding to accommodate project timelines that have been impacted by ongoing collective bargaining.

Figure 9 - Text version
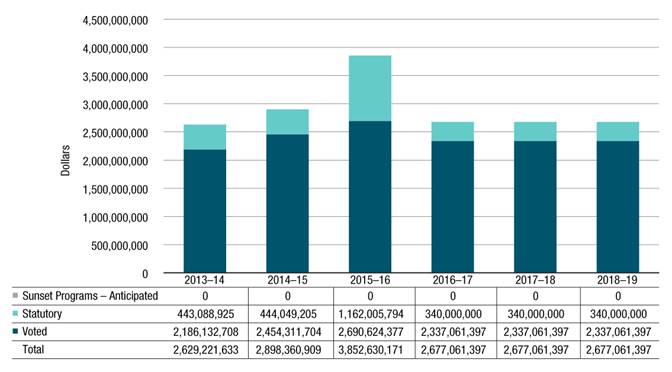
This bar graph illustrates the Secretariat’s actual spending for the public service employer payments (Vote 20) and various statutory items for fiscal years 2013-14, 2014-15 and 2015-16 and planned spending for fiscal years 2016-17, 2017-18 and 2018-19. Financial figures are presented in dollars along the y axis, increasing by $500 million and ending at $4.5 billion. These are graphed against fiscal years 2013-14 to 2018-19 on the x axis.
For each fiscal year, amounts for the Secretariat’s public service employer payments (Vote 20), statutory items (largely comprised of payments under the Public Service Pension Adjustment Act), and anticipated sunset programs are identified.
No amount is reported in 2013-14 to 2018-19 as sunset programs - anticipated.
In 2013-14, actual spending was $443,088,925 for statutory items and $2,186,132,708 for public service employer payments for a total of 2,629,221,633.
In 2014-15, actual spending was $444,049,205 for statutory items and $2,454,311,704 for public service employer payments for a total of 2,898,360,909.
In 2015-16, actual spending was $1,162,005,794 for statutory items and $2,690,624,377 for public service employer payments for a total of 3,852,630,171.
Planned spending for statutory items will remain the same for fiscal years 2016-17 to 2018-19 in the amount of $340,000,000.
Planned spending for public service employer payments will remain the same for fiscal years 2016-17 to 2018-19 in the amount of $2,337,061,397.
Total planned spending will remain the same for fiscal years 2016-17 to 2018-19 in the amount of $2,677,061,397.
Expenditures for public service employer payments and statutory items represent the employer’s share of contributions required by the insurance plans sponsored by the Government of Canada. These amounts also include statutory items for payments under the Public Service Pension Adjustment Act and employer contributions made under the Public Service Superannuation Act, the Employment Insurance Act and related acts.
The increase of $269 million from 2013–14 to 2014–15 is largely attributed to public service employer payments. This increase was mostly to address a funding shortfall in the SISIP to provide benefits to the increased number of medically released Canadian Armed Forces members who served in the Afghanistan mission. Also contributing to the increase was the implementation of approved changes to the PSHCP that were negotiated in 2014.
The increase of $954 million from 2014–15 to 2015–16 is attributed to statutory items of $718 million, which is largely due to an actuarial adjustment made in relation to the Public Service Superannuation Act, and an increase of $236 million related to public service employer payments to incrementally restore the financial health of the SISIP.
Planned expenditures for 2016–17 are anticipated to decrease by $1,176 million from 2015–16, largely because of the actuarial adjustment noted above and because of a further decrease in contributions, which is to start in 2016–17. To a lesser extent, the decrease is also attributable to a payment made in 2015–16 for the SISIP that returned the plan to a sustainable position, partially offset by higher plan unit costs, membership utilization rates and benefit enhancements under the PSHCP.
Planned spending for statutory items in 2016–17 to 2018–19 has been updated to reflect the change made in the actuarial adjustment amount for future years in relation to the Public Service Superannuation Act.
Expenditures by vote
For information on the Treasury Board of Canada Secretariat’s voted and statutory expenditures, consult the Public Accounts of Canada 2016, which is available on the Public Services and Procurement Canada website.
Page details
- Date modified: