
Treasury Board of Canada Secretariat's Quarterly Financial Report for the Quarter Ended December 31, 2011
Statement Outlining Results, Risks and Significant Changes in Operations, Personnel and Programs
Table of Contents
- Introduction
- Highlights of Fiscal Quarter and Fiscal Year-to-Date
- Risks and Uncertainties
- Significant Changes in Relation to Operations, Personnel and Programs
- Budget Constraint
- Approval by Senior Officials
- Appendix
1. Introduction
This quarterly report has been prepared by management as required by section 65.1 of the Financial Administration Act (FAA) and in the form and manner prescribed by the Treasury Board (TB). This quarterly report should be read in conjunction with the Main Estimates and Supplementary Estimates A and B for fiscal year 2011-12.
A summary description of the Treasury Board of Canada Secretariat (TBS) program activities can be found in Part II of the Main Estimates.
The quarterly report has not been subject to an independent audit or review.
1.1 Basis of Presentation
This quarterly report has been prepared by management using an expenditure basis of accounting. The accompanying Statement of Authorities includes TBS’s spending authorities and the Operating Budget Carry Forward granted by Parliament and those used by the department, consistent with the Main Estimates and Supplementary Estimates A and B for the 2011-12 fiscal year. This quarterly report has been prepared using a special purpose financial reporting framework designed to meet financial information needs with respect to the use of spending authorities.
The authority of Parliament is required before monies can be spent by the Government. Approvals are given in the form of annually approved limits through appropriation acts or through legislation in the form of statutory spending authority for specific purposes.
The Department uses the full accrual method of accounting to prepare and present its annual departmental financial statements that are part of the departmental performance reporting process. However, the spending authorities voted by Parliament remain on an expenditure basis.
1.2 TBS Financial Structure
TBS manages both departmental and government-wide expenditures. Its departmental operating revenues and expenditures are managed under Vote 1, Program Expenditures.
Government-wide expenditures are managed via seven different votes:
- Vote 5, Government Contingencies which serves to supplement other appropriations to provide the Government with sufficient flexibility to meet miscellaneous, urgent or unforeseen departmental expenditures between Parliamentary supply periods;
- Vote 10, Government-Wide Initiatives which supplements other appropriations in support of the implementation of strategic management initiatives in the Public Service of Canada;
- Vote 15, Compensation Adjustments which supplements the appropriations of other government departments and agencies that may need to be partially or fully augmented as a result of adjustments made to terms and conditions of service or employment of the federal public service, including members of the Royal Canadian Mounted Police and the Canadian Forces, Governor in Council appointees and Crown Corporations as defined in section 83 of the FAA;
- Vote 20, Public Service Insurance which covers revenues and expenses related to TB’s role as the employer of the core public administration. This includes revenues and expenses for the Public Service Health Care Plan, Public Service Dental Care Plan, Disability Insurance, Provincial Payroll Taxes (Manitoba, Newfoundland, Ontario and Quebec) and other programs;
- Vote 25, Operating Budget Carry Forward which supplements other appropriations for the carry forward of unused operating funds from the previous fiscal year;
- Vote 30, Paylist Requirements which covers paylist requirements for departments and agencies related to legal requirements for the government as employer for items such as parental benefits and severance payments; and
- Vote 33, Capital Budget Carry Forward which supplements other appropriations for the carry forward of unused capital funds from the previous fiscal year. This vote was created in 2011-12.
With the exception of Vote 20, these votes are approved by Parliament for the eventual transfer of funding to other government departments once specified criteria are met. TBS does not incur any revenue or expenses related to these votes and thus they are not reflected in the Statement of Authorities or Planned Spending tables.
TBS also incurs costs under Statutory Authorities, both for departmental and government-wide payments made under legislation approved previously by Parliament, which are not part of the Annual Appropriation Bills. These expenditures mainly reflect the employer’s share of Public Service Pension Plans, the Canada/Quebec Pension Plans, Employment Insurance Premiums and Public Service Death Benefits. These expenditures are initially charged to the accounts of TBS but are eventually attributed to the statutory vote Contributions to employee benefit plans of each department and agency, including TBS.
2. Highlights of Fiscal Quarter and Fiscal Year-to-Date
This section highlights the significant items that contributed to the net increase or decrease in resources available for the year and actual expenditures for the quarter ended December 31, 2011. The explanation of variances considers that changes under 5% have minimal impact on an interpretation of results.
Statement of Authorities - Vote 1, Program Expenditures
The Program Expenditure Authorities increased by $33.6 million, or by 13%. This is mainly explained by the following initiatives approved by Treasury Board for which incremental funding was received by TBS through the December 5, 2011 Appropriation Act No. 3 supported by Supplementary Estimates B, 2011-12:
- An increase of $15.5 million to obtain professional services from external experts to support the review exercise in the context of the deficit reduction action plan;
- An increase of $12.3 million for the one-time severance cash outs pursuant to collective agreements eliminating future severance pay accumulation for voluntary departure or retirement;
- An increase of $3.9 million in the funding for the Red Tape Reduction Commission to provide advice to the Government on reductions to the administrative burden on business of federal regulations;
- An increase of $3.9 million for the transition of the TBS information technology (IT) services and infrastructure from a shared services model to a dedicated departmental model; and
- These increases were offset by a decrease of $4.4 million for 2010 Strategic Review Savings reported in Budget 2011.
- Other minor changes in funding total $2.4 million.
The year-to-date Program Expenditures to December 31, 2011 increased by approximately $18.8 million or 11% when compared to year-to-date at quarter end of 2010-11. This is mainly explained by the following factors:
- An increase of $8.9 million or 47% of the total variance is related to one-time disbursement of severance cash outs by employees pursuant to collective agreements eliminating future severance pay accumulation for voluntary departures or retirement;
- An increase of $4.3 million to cover professional services with external experts to support the review exercise in the context of the deficit reduction action plan;
- An increase of $1.3 million in spending for the transition of the TBS information technology (IT) services and infrastructure from a shared services model to a dedicated departmental model.
- Other increases in expenditures totalling $4.3 million are mostly explained by increased activity of the Red Tape Reduction Commission for identification of the administrative burden on business of regulatory requirements; expenditures related to the Financial Interoperability and Stewardship Initiative to improve financial systems and to support financial decision-making in the Government of Canada; the relocation of the TBS data centre; and, expenditures related to government IT and Infrastructure Security.
Graph 1 outlines the net budgetary authorities for Vote 1, Program Expenditures, which represent the resources available for use for the year (blue bar) as well as the year-to-date expenditures (red bar).

Graph 1: Comparison of Net Budgetary Authorities and Expenditures for Vote 1 as of December 31, 2010-11 and 2011-12 - Text version
| 2010-11 | 2011-12 | |
|---|---|---|
| Net Budgetary Authorities | 253.7 | 287.4 |
| Year-to-date expenditures ending December 31 | 165.3 | 184.1 |
Statement of Authorities -Vote 20, Public Service Insurance
Public Service Insurance Payments include the employer share of the Public Service Health Care Plan (PSHCP), the largest such plan in Canada, as well as other benefit plans and provincial payroll taxes.
The annual Vote 20 net authorities increased by $157.6 million or 7% from the third quarter of 2010-11 to the third quarter of 2011-12 as a result of:
- Increases in authorities for the Public Service employer payments of $228.4 million. Public Service employer payments have increased steadily due to: growth in membership, aging population with greater needs, increases in the use of prescriptions drugs and salary increases.
- This increase is offset by the transfer of $70.8 million to the Departments of Foreign Affairs and International Trade (DFAIT) and National Defence (DND) to fund the provision of pensions, insurance and social security for Locally Engaged Staff (LES). The transfer of the program is the result of the 2008 Strategic Review of Public Service Employer Payments.
TBS Vote 20 net expenditures have increased by $102.8 million, or 7%, when compared to the same period of 2010-11, largely for two items:
- PSHCP expenditures have increased by $97 million. The implementation of the PSHCP Drug Card in November 2010 which enabled real-time electronic claims processing, has allowed drug claims to be processed at the point of sale effectively accelerating the claim reimbursement process when compared to the same period last year. The increase in the expenditures is offset by the increase in the PSHCP revenues by $25 million in 2011-2012 which is mostly attributable to the increase of the pensioner’s contribution rates effective April 2011.
- The increase in Disability Insurance plan expenses by $23 million is attributable to the timing of payments between quarters. In 2010-11 the December payment was processed in January 2011, which understated the Q3 expenses while this year the payment was made in December. Yearly expenditures are expected to stay relatively comparable.
- Other changes totalling $7.8 million are related to variances in other Vote 20 insurance plans expenditures.
Graph 2 outlines the net budgetary authorities as well as actual expenditures for Vote 20, Public Service Insurance. This represents revenues and expenses related to TB’s role as the employer of the core public administration.
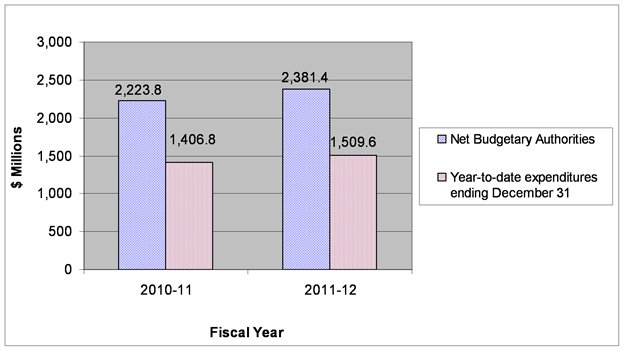
Graph 2: Comparison of Net Budgetary Authorities and Expenditures for Vote 20 as of December 31, 2010-11 and 2011-12 - Text version
| 2010-11 | 2011-12 | |
|---|---|---|
| Net Budgetary Authorities | 2,223.8 | 2,381.4 |
| Year-to-date expenditures ending December 31 | 1,406.8 | 1,509.6 |
Statement of Authorities – Statutory Authorities
Statutory Authorities of $31.9 million have increased slightly from last year and reflect the TBS share of pensions and related benefits. The increase is mostly the result of an increase in the EBP (employee benefit plan) rate from 17% in 2010-11 to 18% in 2011-12.
TBS Statutory Authorities expenditures show a negative balance at quarter end in both fiscal years due to the timing of flow-through payments to Public Works and Government Services Canada (PWGSC). This is primarily related to employer contributions made under the Public Service Superannuation Act (PSSA), and is not reflective of any forecasted annual decrease. TBS receives the employee contribution of the pension payments from all departments and agencies and then transfers them to PWGSC to fund the Public Service Superannuation account. The timing between amounts collected and amounts transferred largely explains the variance in year-to-date expenditures. The net effect on TBS’ financial statements will be zero at year-end.
Public service pay equity settlement results from a Tribunal Order under the Canadian Human Rights Act. Expenditures for pay equity have increased by $522 thousand since last fiscal year. In 2010-11 recoveries of equity payments from employees were required due to a reclassification of positions which ceased their entitlement.
Graph 3 outlines the net budgetary authorities as well as net actual expenditures for TBS’ Statutory Authorities.
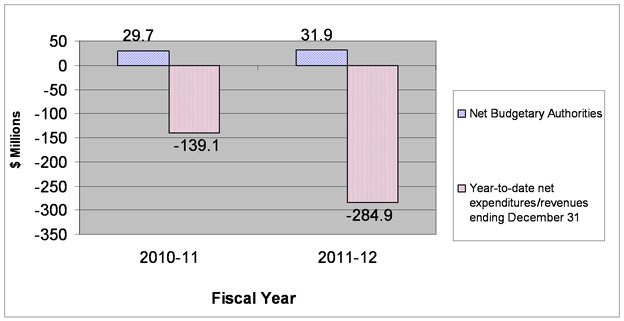
Graph 3: Comparison of Net Budgetary Authorities and Net Expenditures for Statutory Authorities as of December 31, 2010-11 and 2011-12 - Text version
| 2010-11 | 2011-12 | |
|---|---|---|
| Net Budgetary Authorities | 29.7 | 31.9 |
| Year-to-date net expenditures/revenues ending December 31 | (139.1) | (284.9) |
Statement of Departmental Budgetary Expenditures by Standard Object
This section elaborates on variances in expenditures for both Vote 1 and Vote 20 by standard object in order to explain changes in spending trends. The explanation of variances considers changes under 5% or $100,000 have minimal impact on an interpretation of the results.
As outlined in TBS’ second quarter report, year-to-date personnel expenditures had increased mostly because of increased expenditures under the PSHCP (refer to Statement of Authorities – Vote 20 Public Service Insurance). However, when comparing the third quarter expenditures of 2011-12 to the same period of the previous fiscal year, a decrease of $191 million is observed. This variance largely relates to a timing difference between the PSSA premiums collected from departments yet to be transferred to PWGSC.
Increases in professional and special services of $9.4 million were largely due to:
- An increase of $4.3 million in services to support the review exercise in the context of the deficit reduction action plan;
- An increase of $2.8 million in expenses related to the acceleration of the PSHCP claim reimbursement process following the implementation of the Drug Card; and,
- An increase of $1.3 million in spending for the transition of the TBS information technology (IT) services and infrastructure from a shared services model to a dedicated departmental model.
Increases in transportation and communications; repair and maintenance; and, utilities, materials and supplies totalling $814 thousand are mostly explained by increased tenant services expenditures related to the data centre relocation.
The source of the $1.3 million decrease in other subsidies and payments is mostly related to the timing of quarterly payments issued to the Joint Learning Program (JLP). In 2010-11, the 4th quarter payment was issued in December, while this year it was issued later. This program’s objective is to improve labour relations and increase the understanding of the roles of the union and management in the workplace by providing joint union-management learning opportunities to public service employees represented by PSAC.
3. Risks and Uncertainties
TBS maintains a corporate risk profile. Similar to most organizations, risks related to IT security, aging IT infrastructure and emergency situations (fire, natural disaster, etc.) could have financial impacts, should they materialize. Mitigation measures are in place to minimize the potential realization of these risks. For example, a large extent of the work completed for the data centre relocation related to mitigating risks of aging IT infrastructure.
TBS is addressing reduced flexibility to its operating budget as a result of the 2010 Strategic Review reported in Budget 2011 and the cost containment measures of $1.7 million due to the freeze on operating budgets set out in Budget 2010. TBS is managing the implementation of these measures through proportional reduced budget allocations to sectors, supported by rigorous monitoring of staffing and expenditures in line with business, financial and human resources planning.
As the PSHCP is driven by many variables, there could be significant shifts from the forecast in a given year caused by changes in: plan membership, the cost of drugs and medical treatments, use of plan entitlements and provincial tax regulations. TBS continues to closely monitor payment activity and trends.
4. Significant Changes in Relation to Operations, Personnel and Programs
This section highlights any significant changes which impact the expenditures or approved resources available for the year or have impacted actual expenditures for the quarter ended December 31, 2011.
There are four significant operational changes:
- A Pay Direct Drug Card for the PSHCP was successfully launched in November 2010. TBS is closely monitoring the implementation of this new initiative;
- In September 2011, the Treasury Board approved the transfer of the LES program and associated funds ($70.8 million) to DFAIT and DND. This decision represents one of the final steps in the implementation of the decisions stemming from the Human Resources Agencies Horizontal Strategic Review (HRHR) in July 2008 and the November 2008 Strategic Review of Public Service Employer Payments.
- The current TBS data centre infrastructure was at the end of its life span. The risk of imminent, severe and lengthy system outages was very high due to facilities issues with cooling, power, fire suppression systems and physical structure. Therefore, the data centre was relocated to a dedicated, centralized Government of Canada data centre that meets the current and planned requirements of TBS. In addition, as Finance was moving to a new building in 2014, the decision was taken to leverage the data centre relocation to split the TBS and Finance shared networks such that each department would have dedicated IT services and networks; and
- TBS is working closely with the new Shared Services Canada (SSC) organization to consolidate the existing resources and personnel relating to e-mail, data centres and networks, and associated internal services. Effective November 15, 2011, TBS is deemed to have transferred $4.0 million from the Vote 1 Program Expenditures to SSC, out of which $1.0 million in expenditures to date have been incurred on behalf of SSC by TBS. The transfer increases to $10.6 million next fiscal year and ongoing.
5. Budget Constraint
As a result of the TBS 2010 Strategic Review announced in Budget 2011, TBS has found savings totalling $11.5 million, leading to the elimination of 84 positions over three years (see page 230 of Budget 2011), starting in fiscal year 2011-12.
Through this review, opportunities were identified to better align activities with core roles and to achieve internal efficiencies. All of the 2011-12 fiscal year savings have been achieved and approximately 63% of the overall savings have been implemented. The remaining Strategic Review reduction initiatives are all underway.
More than half of the savings from the 2010 Strategic Review are as a result of changes made in the Service Sector. These changes came about as a result of the mandate given to the Privy Council Office to undertake the Administrative Services Review (ASR) announced in Budget 2010. The ASR was a continuation of efforts initiated through the Service Sector’s work.
Effective July 8, 2011, the Regional Communications Network, which provided regional communications information to the Privy Council Office, ceased operations. TBS has managed most of the reductions through attrition, and will continue to work closely with affected employees to support them through this transition using the tools provided through workforce adjustment.
6. Approval by Senior Officials
Approved by,
Originally signed by:
Michelle d’Auray, Secretary of Treasury Board Secretariat
Originally signed by:
Christine Walker, Chief Financial Officer
Ottawa, Canada
Date:
Appendix
For the quarter ended December 31, 2011
| Description | Fiscal year 2010-2011 | Fiscal year 2011-2012 | ||||
|---|---|---|---|---|---|---|
| Planned expenditures for the year ending March 31, 2011** | Expended during the quarter ended December 31, 2010 | Year to date used at quarter-end | Planned expenditures for the year ending March 31, 2012** | Expended during the quarter ended December 31, 2011 | Year to date used at quarter-end | |
| Note 1 |
||||||
| Government-Wide Expenses included above* | ||||||
|
1 Personnel
|
2,591,170,000 | 708,955,022 | 1,474,305,638 | 2,848,302,412 | 511,841,208 | 1,458,022,306 |
|
2 Transportation and communications
|
2,957 | 166,642 | 1,246 | 4,305 | ||
|
4 Professional and special services
|
6,599,228 | 13,852,872 | 9,680,919 | 17,450,156 | ||
|
10 Transfer payments
|
520,000 | 1,524 | 363,546 | 520,000 | 2,598 | 364,533 |
|
12 Other subsidies and payments
|
2,122,511 | 1,061,255 | 1,229,181 | 1,859,200 | 267,550 | 275,592 |
|
Total
|
2,593,812,511 | 716,619,985 | 1,489,917,879 | 2,850,681,612 | 521,793,521 | 1,476,116,892 |
| * Government-Wide Expenses include Vote 20 and $20,000 statutory for Public Service Pension Adjustment Act ** Includes only Authorities available for use and granted by Parliament at quarter-end |
||||||
| Expenditures: | ||||||
|
1 Personnel
|
2,798,967,695 | 760,396,317 | 1,629,216,145 | 3,070,879,003 | 569,518,412 | 1,627,514,367 |
|
2 Transportation and communications
|
7,471,615 | 1,321,228 | 3,502,407 | 7,175,145 | 1,562,160 | 3,750,880 |
|
3 Information
|
1,123,298 | 121,465 | 329,409 | 1,345,036 | 79,734 | 333,098 |
|
4 Professional and special services
|
62,486,593 | 15,998,721 | 37,657,898 | 80,817,758 | 25,114,541 | 47,072,839 |
|
5 Rentals
|
1,431,150 | 211,737 | 658,141 | 1,590,935 | 246,259 | 592,024 |
|
6 Repair and maintenance
|
505,641 | 88,664 | 315,862 | 1,626,274 | 168,751 | 1,039,644 |
|
7 Utilities, materials and supplies
|
2,465,976 | 471,905 | 995,515 | 2,491,785 | 388,630 | 837,406 |
|
9 Acquisition of machinery and equipment
|
4,786,847 | 881,246 | 2,384,859 | 7,427,852 | 591,920 | 2,347,221 |
|
10 Transfer payments
|
720,000 | 51,524 | 513,546 | 520,000 | 170,598 | 592,533 |
|
12 Other subsidies and payment
|
3,599,570 | 1,577,345 | 3,552,989 | 2,312,655 | 640,413 | 2,209,437 |
|
Total gross budgetary expenditures
|
2,883,558,385 | 781,120,152 | 1,679,126,771 | 3,176,186,444 | 598,481,417 | 1,686,289,449 |
| Less Revenues netted against expenditures: | ||||||
|
Vote Netted Revenues (VNR) - Centrally managed items
|
-369,999,000 | -91,657,417 | -244,519,672 | -469,252,000 | -98,884,151 | -275,293,085 |
|
Vote Netted Revenues (VNR) - Program expenditures
|
-6,335,410 | -881,959 | -1,698,009 | -6,243,112 | -2,162,084 | -2,162,084 |
|
Total Revenues netted against expenditures
|
-376,334,410 | -92,539,377 | -246,217,681 | -475,495,112 | -101,046,235 | -277,455,169 |
| Total net budgetary expenditures (Note 1) | 2,507,223,975 | 688,580,775 | 1,432,909,091 | 2,700,691,332 | 497,435,182 | 1,408,834,280 |
For the quarter ended December 31, 2011
| Description | Fiscal year 2010-2011 | Fiscal year 2011-2012 | ||||
|---|---|---|---|---|---|---|
| Total available for use for the year ending March 31, 2011*** | Used during the quarter ended December 31, 2010 | Year to date used at quarter-end | Total available for use for the year ending March 31, 2012*** |
Used during the quarter ended December 31, 2011 | Year to date used at quarter-end | |
| Pursuant to s. 31.1 of the Financial Administration Act and Order-in-Council P.C. 2011 -1297 effective November 15, 2011, $4,013,501 (excluding EBP) is deemed to have been appropriated to Shared Services Canada (Program Expenditures Vote) which results in a reduction for the same amount in the Treasury Board Secretariat's Vote 1, Appropriation Act No.1, 2011-12. To date, $1,017,569 expenditures (excluding EBP) have been incurred on behalf of Shared Services Canada by the Treasury Board Secretariat against the Shared Services Canada Program Expenditures Vote. *** Includes only Authorities available for use and granted by Parliament at quarter-end. |
||||||
| Vote 1 - Program Expenditures | 253,740,131 | 56,200,877 | 165,258,892 | 287,382,671 | 66,556,050 | 184,101,146 |
| Vote 20 - Public Service Insurance | 2,223,793,511 | 565,433,239 | 1,406,789,593 | 2,381,409,612 | 547,355,353 | 1,509,588,714 |
| Statutory Authorities | ||||||
|
A111 - President of the Treasury Board - Salary and motor car allowance
|
78,649 | 19,409 | 58,228 | 77,516 | 19,379 | 58,176 |
|
A140 - Contributions to employee benefit plans
|
29,591,684 | 7,397,921 | 22,193,763 | 31,801,533 | 7,874,933 | 23,775,700 |
|
A145 - Unallocated employer contributions made under the PSSA and other retirement acts and the
Employment Insurance Act
|
59,597,146 | -160,922,431 | -124,492,707 | -308,817,888 | ||
|
A149 - Contributions to employee benefit plans
|
75,450 | 75,450 | ||||
|
A681 - Payments under the
Public Service Pension Adjustment Act
|
20,000 | 445 | 1,388 | 20,000 | 367 | 1,187 |
|
A683 - Payments for the pay equity settlement pursuant to section 30 of the
Crown Liability and Proceedings Act
|
-68,262 | -470,342 | 46,356 | 51,795 | ||
| Total Statutory Authorities | 29,690,333 | 66,946,659 | -139,139,394 | 31,899,049 | -116,476,221 | -284,855,580 |
| Total authorities | 2,507,223,975 | 688,580,775 | 1,432,909,091 | 2,700,691,332 | 497,435,182 | 1,408,834,280 |