
Access to Information and Privacy Statistical Report for 2021–2022
On this page
Introduction
The Access to Information Act and the Privacy Act both came into effect on July 1, 1983.
Paragraph 70(1)(d) of the Access to Information Act assigns responsibility to the President of the Treasury Board of Canada, as the designated minister, to collect statistics on an annual basis. These statistics are used to assess the performance of the Government of Canada’s access to information and privacy programs.
This report presents statistical information about the Government of Canada’s access to information and privacy programs across all federal institutions subject to the two acts for the period of April 1, 2021, to March 31, 2022.
In addition, each institution subject to the Access to Information Act and the Privacy Act tables an individual annual report in Parliament on the administration of each act in their institution. These reports are available on the institutions’ websites.
The complete statistical dataset for 2021–22 will be available on the Government of Canada’s Open Data Portal.
About this report
This report summarizes data collected from 191 government institutions on behalf of approximately 265 institutions subject to the Access to Information Act and the Privacy Act. These include departments and agencies in the core public administration, as well as smaller bodies such as port authorities, land and water boards, Crown corporations, and wholly owned subsidiaries. There are approximately 70 wholly owned Crown corporations subject to the acts that do not operate independently. For this reason, any requests they receive are processed by the parent Crown corporation, which also reports on the requests.
Immigration, Refugees and Citizenship Canada
Immigration, Refugees and Citizenship Canada (IRCC) received 79.7% of all access to information requests received in 2021–22. IRCC also received a significant number of personal information requests in 2021–22. Because IRCC received the bulk of requests last year, its data is not included in the body of this report, so as not to skew the overall results. IRCC's data is presented in Appendix A.
Highlights
Access to information requests
Excluding requests received by IRCC, 45,334 access to information (ATI) requests were received in 2021–22, the most received in a single year in the last decade. The number of ATI requests closed during the reporting period was 40,889. The number of requests closed is increasing, but it is not keeping pace with the number of requests received. As a result, the number of requests carried over to the next year has been steadily increasing over the last decade. Requests carried over into 2022–23 totalled 28,585, up from 24,088 for the previous period.
Of the 40,889 requests closed, 70.7% were closed within legislated timelines, including extensions, a slight improvement over the previous year. Some 55.8% of institutions were able to meet the standard of closing 90% of ATI requests within legislated timelines, a little better than last year. The main reasons for closing requests beyond legislated timelines are “Workload” (60.7%), “Other” (32.7%), “External consultations” (4.6%) and “Internal consultations” (2.0%). “Other” includes requests for contents of databases, audio or video recordings or records in other countries, and public health restrictions. The volume of complex requests has been stable at about 10,000 a year over the last decade, despite variations in the number of requests closed.
Costs in actual dollars have largely been increasing over the last decade and are currently estimated at $84.5 million. After the reporting period, a study was conducted as part of the ATI legislative review. The study found that the direct cost of processing one page of an ATI request is just over $5. The same study estimated that when indirect costs (for example, the cost of subject matter‑ experts collecting, reviewing and making recommendations on records) is factored in, the current regime costs $195 million to operate.
Personal Information requests
Institutions received a total of 68,096 personal information requests in 2021–22. This is the highest number received in a year in the last decade. With just a few exceptions, personal information requests have increased every year for the last decade. A total of 66,696 requests were closed in 2021–22, also a 10-year record. As is the case for ATI requests, the number of personal information requests closed is not keeping pace with the number received, which contributes to an increase in the number of requests carried over to the next fiscal year. The number of personal requests carried over from 2021–22 was a 10–year high of 36,535.
The performance standard for institutions is to respond to 85% of personal information requests within the legislated timeline, including extensions. Some 70.8% of institutions met the standard. In all, institutions closed 70% of personal information requests within legislative timelines, including extensions. The main reasons for personal information requests being closed beyond legislated timelines are “Workload” (86.5%); “Other” (13%) and “External consultation” (0.3%) and “internal consultations” (0.2%). Except for 2020–21, workload has been the top reason for forwarded by institutions.
The cost to institutions to operate the personal information request regime in 2021–22 was about $68.1 million.
Key observations
IRCC impact on 2021–22 government-wide data
Most ATI requests processed by IRCC involve clients’ immigration, citizenship or refugee applications and are submitted by others, with the permission of the client. If the requesters were present in Canada, these requests could have been submitted as personal information requests.Footnote 1 Because the requests are largely for a person’s own information that is being released through an intermediary, there are differences in the nature of the request, the exemptions applied and the challenges to compliance.
Over the last decade, the volume of requests received by IRCC has been growing in real terms and as a percentage of all ATI requests received. In 2012–13, IRCC accounted for 45.4% of all ATI requests and by 2021–22, this figure had risen to 79.7%.
If IRCC’s data is included with that of all other institutions, the proportion of requests closed within legislated timelines is significantly lower (42%) than when IRCC’s data is excluded (70.7%). At the same time, if IRCC’s data is included, 89% of closed ATI requests were either all disclosed or disclosed in part. Without IRCC, this figure is 66.8%. Differences of this magnitude distort the understanding of the overall administration of the Access to Information Act.
The Access to Information Act establishes a 30‑day ‑limit for responding to ATI requests and permits extensions for limited and specific reasons. In terms of the extensions taken on ATI requests closed, IRCC cited paragraph 9(1)(b) (consultations) as the main reason for extensions, while other institutions cited paragraph 9(1)(a) (interference with government operations) as the main reason. Including IRCC would skew these figures so that the usage of 9(1)(a) would drop significantly, and the need to address institutional capacity would be less clear.
In 2021–22, over 109,000 requests were closed beyond legislated timelines. IRCC accounted for 89.1% of these and almost exclusively cited “Workload” as the reason for closing requests past legislated timelines. Other institutions also cited “Workload” as the main reason (60.7%), followed by “Other” (32.7%), “External consultations” (4.6%) and “Internal consultations” (2.0%). For all other institutions, “Workload,” “Internal consultations” and “External consultations” have all been decreasing over the last decade, while “Other” has more than doubled.
In terms of exemptions, the most frequently invoked exemption for ATI requests closed by IRCC in 2021–22 is one pursuant to paragraph 16(2)(c), which relates to the protection of any record containing information that could facilitate the commission of an offence, including any information on the vulnerability of particular buildings or other structures or systems. Comparatively, all other institutions were more likely to invoke subsection 19(1) (personal information). In comparing the five most frequently invoked exemptions, three of the five listed for IRCC do not even make the list for all other institutions. Notably absent from IRCC’s top five is the exemption under paragraph 21(1)(a) (record containing advice or recommendations developed for or by a government institution or a minister of the Crown). In terms of commonly invoked exclusions, IRCC rarely invokes exclusions, while other institutions invoke section 69, which relates to Cabinet confidences.
IRCC’s personal information requests had a smaller but still meaningful impact on the government-wide results. In 2021–22, IRCC received 28.2% of the 94,902 personal information requests received by all institutions. IRCC accounted for 25% of the 88,916 requests closed and 18.1% of the 44,635 requests carried over to 2021–22.
As with the administration of the ATI request system, IRCC’s data also influenced the overall performance standard of closing 85% of personal information requests within legislated timelines. Overall, 62% of personal information requests were closed within legislative timelines. If IRCC is excluded from the calculation, 70% of requests were closed within legislated timelines.
Over the last decade, IRCC experienced an earlier and steeper decline in the number of requests closed within legislated timelines than all other institutions. Starting in 2017–18, IRCC’s percentage of requests closed beyond legislated timelines was at least double that of all other institutions for every year except 2020–21. Except for in 2012–13, all other institutions invoked section 26, which relates to personal information about another person, more than five times more often than any other exemption while this exception in much less significant for IRCC.
Given IRCC’s overall impact, its data and performance are examined fully in Appendix A and excluded in the body of this report.
Backlog of access to information and personal information requests
Both the number of ATI requests received and the number of requests outstanding from the previous fiscal year increased in 2021–22, as did the number of requests carried over.
Of all ATI requests that were either received in 2021–22 or outstanding from the previous fiscal year, institutions closed 58.9%. Additionally, the number of ATI requests carried over to the next fiscal year increased to 28,585 requests.
Personal information requests have increased every year since 2017–18, except for 2020–21. In 2021–22, institutions other than IRCC, received 68,096 personal information requests. Personal information requests outstanding from the previous fiscal year also increased to 35,135 requests. Of all the personal information requests that were either received in 2021–22 or outstanding from the previous fiscal year, 64.6% of them were closed.
The number of personal information that were closed by institutions increased to 66,696, but another 36,535 requests were carried over to the next fiscal year.
To gain greater insight into the issue of requests being carried over from one fiscal year to the next, the Treasury Board of Canada Secretariat (TBS) established quarterly reporting in the fourth quarter of 2021–22 for the 25 institutionsFootnote 2 that carried forward more than 25% of the requests at the end of 2020–21. The key finding from the quarterly reports was that many of the requests that institutions are carrying forward from one period to the next are beyond legislated timelines, including extensions. Most institutions received more requests than they closed, signalling that institutions are not keeping pace with the requests they receive each year, let alone addressing requests that are carried forward from one period to the next. This was true for both ATI and personal information requests.
TBS undertook several key actions in 2021–22 to help institutions deal with their backlog. These actions included:
- co-sponsoring an online event that showcased innovative digital tools that facilitate the processing of ATI requests.
- sending correspondence to deputy heads to remind them of their legal obligations; under the Access to Information Act to help ensure that plans are put in place to address backlogs
- launching an external recruitment exercise to create a pool of qualified candidates.
More information is available on the Key actions on access to information page.
Ongoing impacts of COVID-19
COVID‑19 restrictions continued to affect institutions’ capacity to respond to ATI and personal information requests and to meet their legal obligations under the Access to Information Act and the Privacy Act.
Some institutions had limited capacity in 2021–22. Onsite capacity remained the primary factor limiting overall ability to respond to requests, which led to problems with processing and responding to paper requests and processing secret and top-secret documents. Capacity limitations were largely attributed to access to information and privacy (ATIP) office employees and subject–matter experts working remotely or in hybrid situations due to public health measures that restricted access to the worksite.Footnote 3 Since public health measures have been lessened, institutions’ capacity to respond to requests and consultations has increased greatly, and TBS has redoubled its efforts to support institutions in this process.
The Information Commissioner of Canada, in her 2021–22 annual report to Parliament, which was released after the reporting period, noted that the COVID-19 pandemic can no longer be used as an excuse for failing to meet statutory ATI obligations. TBS has also contacted institutions to remind them of their legal obligations. It continues to help institutions meet their obligations in all circumstances, including when access to worksites is limited.
Key activities to address limited capacity have included:
- institutions offering to provide electronic records to requesters, using Canada Post epost service as an option
- the ATIP online portal being available as for Canadians to submit requests to federal institutions and for institution to provide electronic responses
- former Treasury Board president, Jean-Yves Duclos, writing to his Cabinet colleagues to encourage them to proactively publish as much information as possible related to COVID-19 and to remind them of the importance of adopting best practices in information management
- TBS organizing workshops to share best practices with ATIP offices to help them adapt their procedures to the remote work environment
- the Chief Information Officer of Canada writing to deputy heads to remind them of their obligations under the Access to Information Act, as they plan for employees to return to the workplace, and to strongly encourage them to include ATI and Privacy services as critical services moving forward
Consultations
Issues relating to consultation in the ATI regime are twofold:
- consultation happens even when it might not be required
- consultation among institutions can take a long time.
TBS has reviewed the Information Commissioner’s special report to Parliament Access at Issue: The Challenge of Accessing Our Collective Memory and has developed guidance for institutions to help reduce the delays caused by inter–institutional consultations on ATI requests and to ensure that institutions are consulting each other as needed and not simply by default.
TBS reminded institutions on several occasions that consultations should be given the same importance as ATI requests (as set out in subsection 7.7.2 of the Interim Directive on the Administration of the Access to Information Act). Subsequent to the reporting period, Access to Information Implementation Notice 2022 – 01: Inter–institutional Consultations, was issued. It specifies that institutions should be selective when determining which documents require consultation. It also specifies how departments should engage each other to facilitate effective and timely consultations.
Work is also underway to enable secure electronic consultation between institutions through the ATIP online platform, which will further save time and improve this aspect of processing ATI requests.
Channels of requests
Some 87.3% of all ATI requests were submitted through a digital request service. The remaining requests were submitted by e-mail, mail, fax, phone or in person. By comparison, 52.4% of personal information requests, were submitted through a digital request service. The remaining 47.6% of personal information requests were submitted by e-mail, mail, fax, phone or in person.
Declining to act on ATI requests
In 2021–22, institutions reported seeking the Information Commissioner’s approval to decline to act on 35 requests, with one application outstanding from 2020–21. The Information Commissioner approved two requests during the reporting period and refused 27 requests. One application was withdrawn by an institution and five requests were carried over to the 2022–23 reporting period.
Access to Information Act statistics for 2021–22
Requests under Access to Information Act
When comparing the number of ATI requests closed to ATI requests received over the last decade, Figure 1 demonstrates that the number of ATI requests closed has not kept pace with the number of ATI requests received. The significant decrease for 2020–21 is primarily explained by public health restrictions due to COVID–19 which restricted access to physical worksites. In 2021–22, institutions increased their capacity to respond to requests largely due to the lessening of public health restrictions and closed 40,889 ATI requests.
Having a substantial number of outstanding ATI requests at the beginning of a fiscal year places institutions in a challenging situation even before new ATI requests are received. For example, in 2021–22, institutions started the reporting period with 24,140 ATI requests outstanding from the previous reporting periods – more than half as many requests than they would ultimately receive in 2021–22 – and carried over 28,585 ATI requests to 2022–23.
Factors affecting an institution’s ability to close requests, including the complexity of requests and staffing levels are covered later in the report.
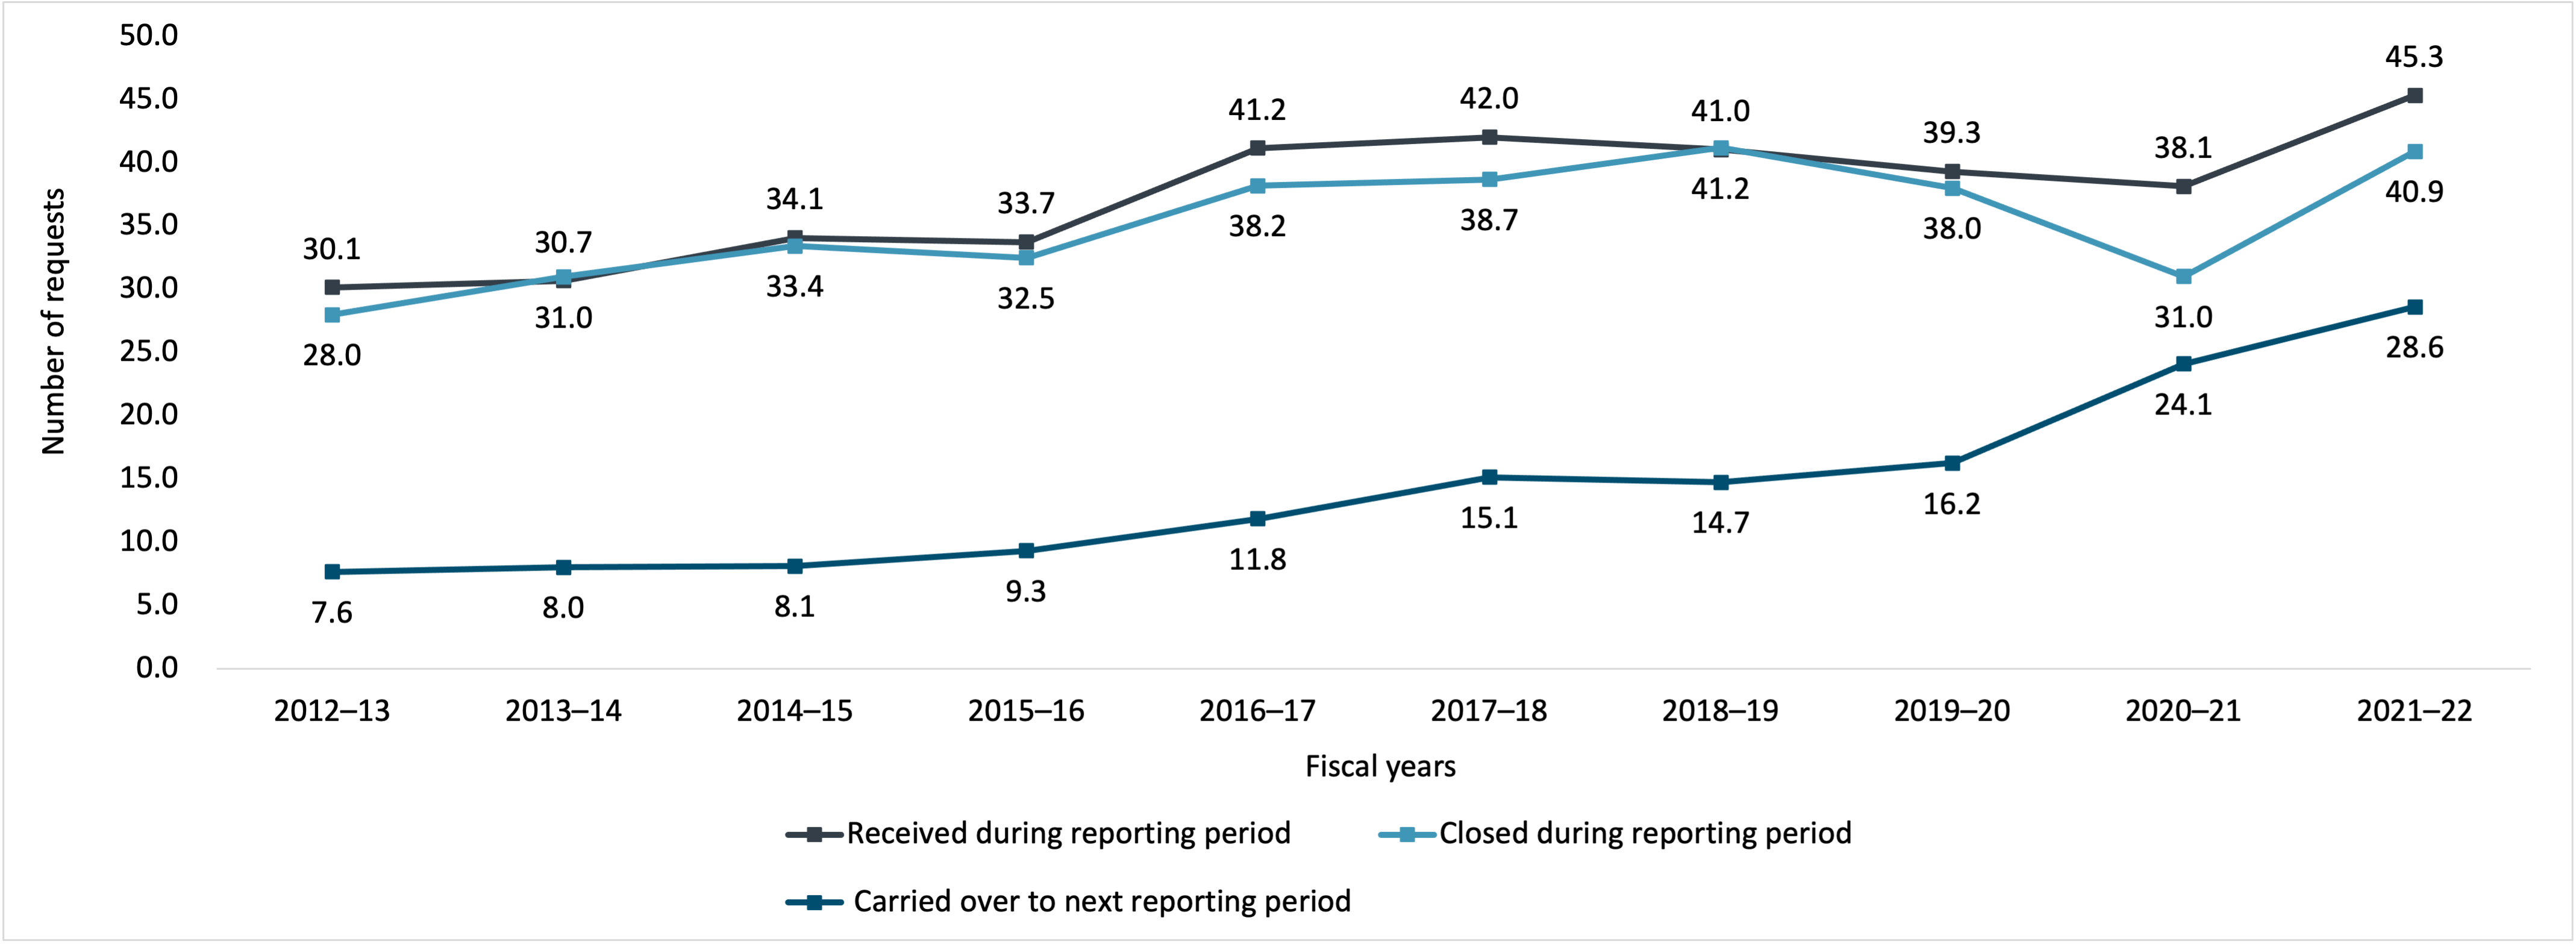
Figure 1 - Text version
| 2012–13 | 2013–14 | 2014–15 | 2015–16 | 2016–17 | 2017–18 | 2018–19 | 2019–20 | 2020–21 | 2021–22 | |
|---|---|---|---|---|---|---|---|---|---|---|
| Received during reporting period | 30,135 | 30,666 | 34,056 | 33,727 | 41,152 | 42,021 | 41,034 | 39,294 | 38,117 | 45,334 |
| Closed during reporting period | 27,972 | 30,967 | 33,412 | 32,474 | 38,175 | 38,684 | 41,165 | 37,977 | 30,989 | 40,889 |
| Carried over to next reporting period | 7,645 | 8,006 | 8,102 | 9,319 | 11,828 | 15,118 | 14,734 | 16,235 | 24,088 | 28,585 |
Figure 2 breaks down the number of ATI requests carried over to 2022–23 (28,585 requests) by fiscal year of receipt, and by whether the ATI request is within legislated timelines or beyond legislated timelines as of March 31, 2022. Note that the numbers in Figure 2 are not cumulative from one fiscal year to the next, and that ATI requests carried over to 2022–23 are referred to as open ATI requests in this figure.
Figure 2 indicates that 69.8% of open ATI requests were beyond legislated timelines as of March 31, 2022.
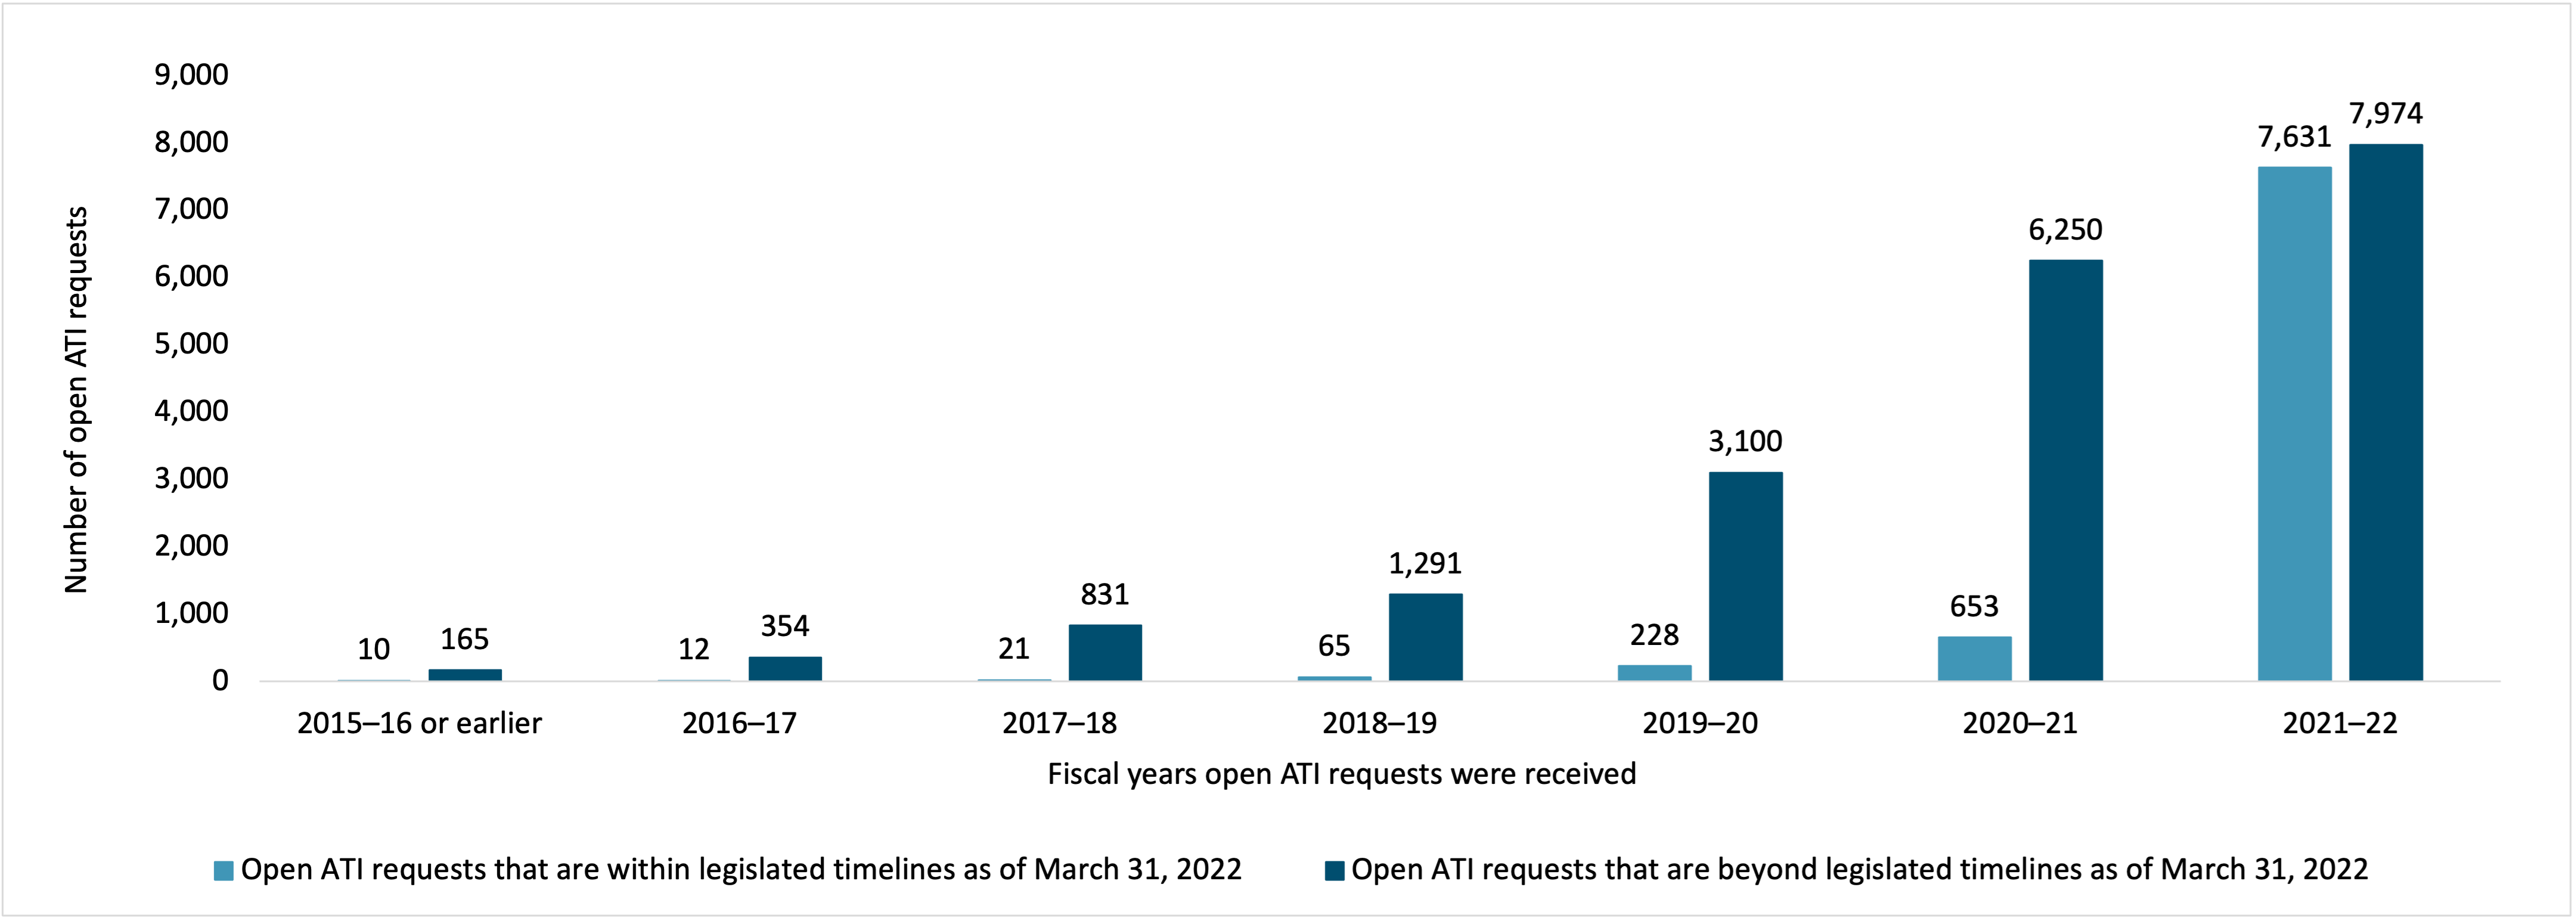
Figure 2 - Text version
| 2015–16 or earlier | 2016–17 | 2017–18 | 2018–19 | 2019–20 | 2020–21 | 2021–22 | |
|---|---|---|---|---|---|---|---|
| Open ATI requests that are within legislated timelines as of March 31, 2022 | 10 | 12 | 21 | 65 | 228 | 653 | 7,631 |
| Open ATI requests that are beyond legislated timelines as of March 31, 2022 | 165 | 354 | 831 | 1,291 | 3,100 | 6,250 | 7,974 |
Timeliness
Of the 40,889 ATI requests closed in 2021–22, 70.7% were closed within legislated timelines, including extensions. A decade ago, this percentage was stable at 86% and began to decline in 2015–16, reaching a low of 65% in 2020–21.
The open ATI requests beyond legislated timelines mean that requesters are being denied timely access and signify that the performance of the system, as measured by requests closed within legislated timelines, will be hindered until these open ATI requests are closed, even if all new ATI requests are closed within legislated timelines.
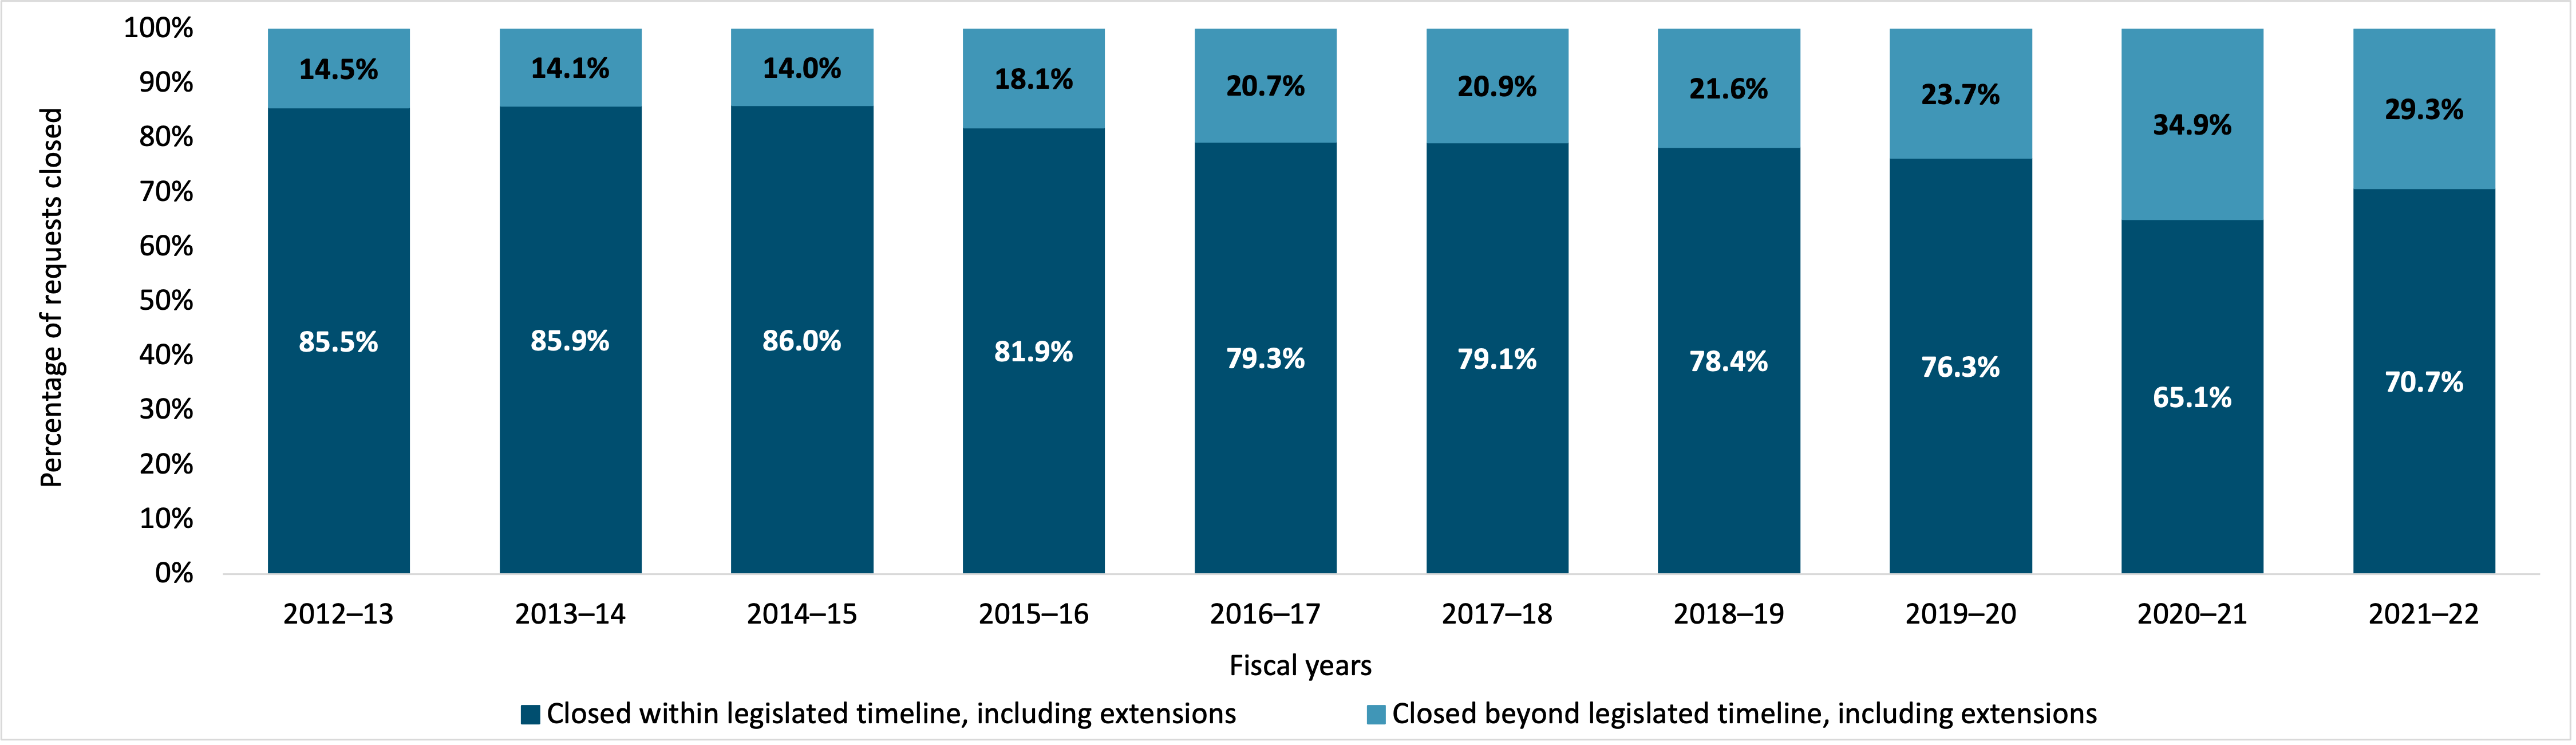
Figure 3 - Text version
| 2012–13 | 2013–14 | 2014–15 | 2015–16 | 2016–17 | 2017–18 | 2018–19 | 2019–20 | 2020–21 | 2021–22 | |
|---|---|---|---|---|---|---|---|---|---|---|
| Closed within legislated timeline, including extensions | 85.5% | 85.9% | 86.0% | 81.9% | 79.3% | 79.1% | 78.4% | 76.3% | 65.1% | 70.7% |
| Closed beyond legislated timeline, including extensions | 14.5% | 14.1% | 14.0% | 18.1% | 20.7% | 20.9% | 21.6% | 23.7% | 34.9% | 29.3% |
The performance standard for institutions is to respond to 90% of ATI requests within legislated timelines, including extensions. The 90% standard reflects the variability in ATI requests’ volumes in institutions year over year.
Figure 4 indicates that even a decade ago, the percentage of institutions meeting this standard was just over 60% and has fluctuated around this percentage in recent years. 2020–21 marked the biggest drop to below 50% because of public health restrictions due to COVID-19, with some recovery now to 55.8% this year.
This figure further demonstrates the longstanding delays that requesters have been experiencing and the future compliance challenges for ATI program performance.
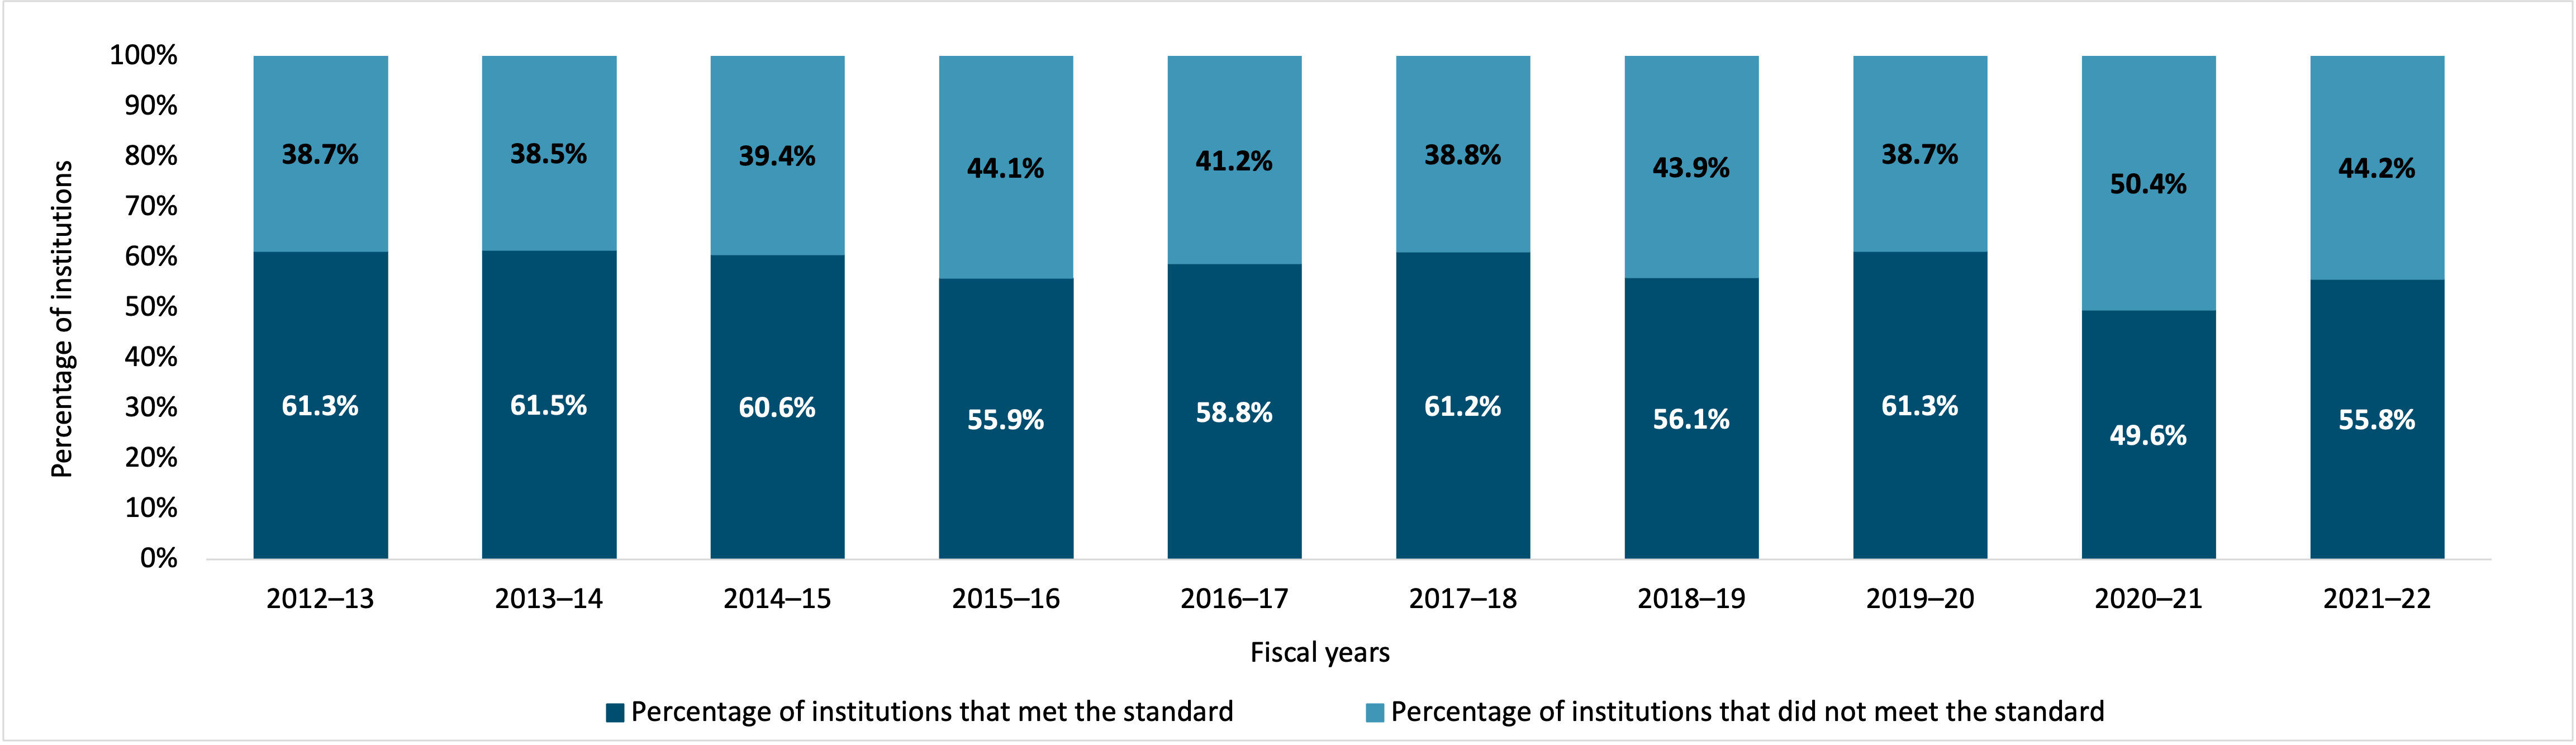
Figure 4 - Text version
| 2012–13 | 2013–14 | 2014–15 | 2015–16 | 2016–17 | 2017–18 | 2018–19 | 2019–20 | 2020–21 | 2021–22 | |
|---|---|---|---|---|---|---|---|---|---|---|
| Percentage of institutions that met the standard | 61.3% | 61.5% | 60.6% | 55.9% | 58.8% | 61.2% | 56.1% | 61.3% | 49.6% | 55.8% |
| Percentage of institutions that did not meet the standard | 38.7% | 38.5% | 39.4% | 44.1% | 41.2% | 38.8% | 43.9% | 38.7% | 50.4% | 44.2% |
The Access to Information Act establishes a 30-day limit for responses to ATI requests. While the Access to Information Act permits extensions for limited and specific reasons to the 30-day limit, the intent of the act is to provide timely access. The growing length of time to close requests undermines this intent.
Figure 5 indicates that for the first five years of the decade, the percentage of ATI requests closed within the first 30 days remained relatively stable around the 55% level. However, since then, this percentage has decreased while the proportion of requests closed beyond 121 days has steadily increased.
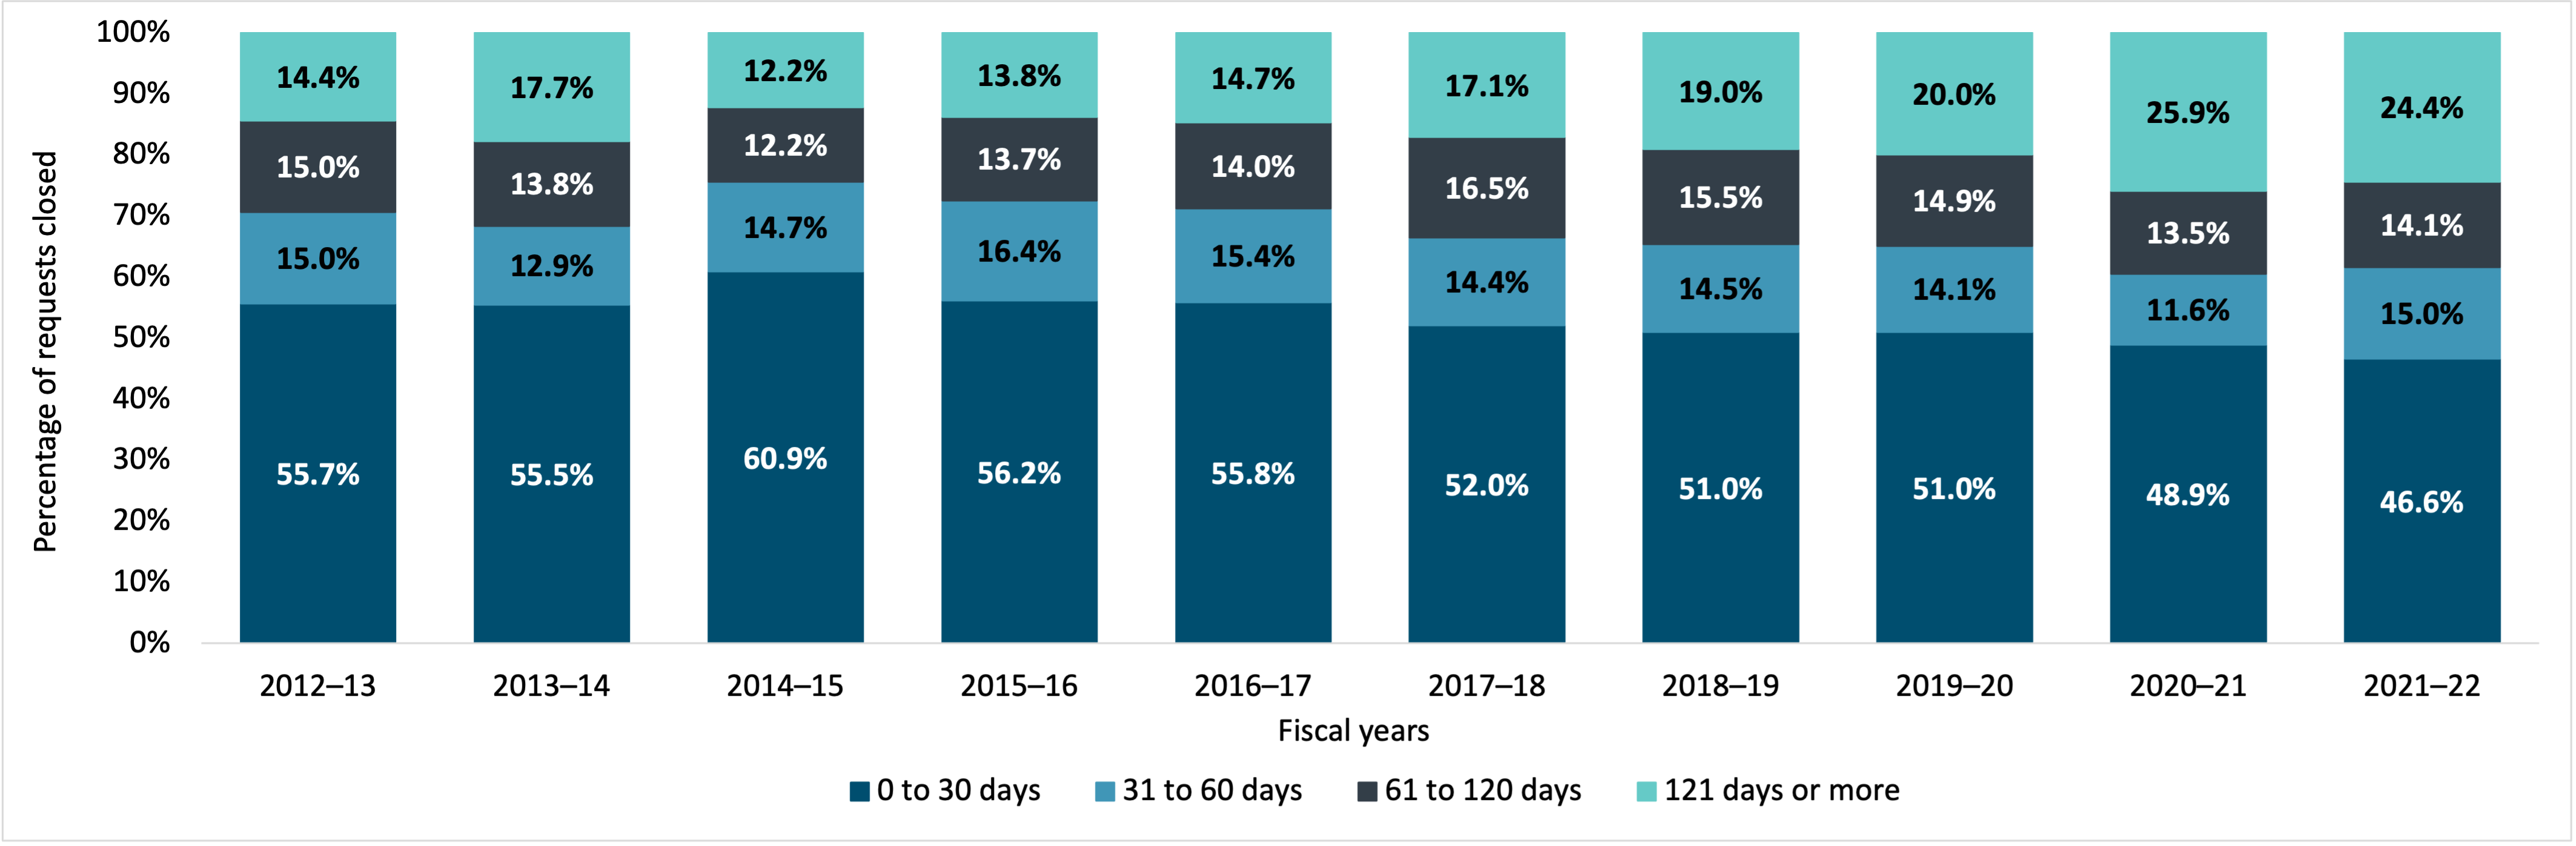
Figure 5 - Text version
| 2012–13 | 2013–14 | 2014–15 | 2015–16 | 2016–17 | 2017–18 | 2018–19 | 2019–20 | 2020–21 | 2021–22 | |
|---|---|---|---|---|---|---|---|---|---|---|
| 0 to 30 days | 55.7% | 55.5% | 60.9% | 56.2% | 55.8% | 52.0% | 51.0% | 51.0% | 48.9% | 46.6% |
| 31 to 60 days | 15.0% | 12.9% | 14.7% | 16.4% | 15.4% | 14.4% | 14.5% | 14.1% | 11.6% | 15.0% |
| 61 to 120 days | 15.0% | 13.8% | 12.2% | 13.7% | 14.0% | 16.5% | 15.5% | 14.9% | 13.5% | 14.1% |
| 121 days or more | 14.4% | 17.7% | 12.2% | 13.8% | 14.7% | 17.1% | 19.0% | 20.0% | 25.9% | 24.4% |
In terms of extensions taken on ATI requests closed in 2021–22, 60.9% of all extensions taken cited paragraph 9(1)(a) of the Access to Information Act as a reason for the extension, relating to interference with government operations. 89.3% of extensions were for 120 days or less.
Figure 6 indicates that over the last decade, the percentage of all extensions taken that cited paragraph 9(1)(b) (Consultation: Other) has decreased to 20% in 2021–22. Institutions have been more confident to disclose information regarding other government departments based on their own assessment of the material. Also, over the last two fiscal years, several institutions had limited capacity to process consultations requests. Therefore, the consulting institutions processed this information to the best of their ability and knowledge in applying the exemptions of the Access to Information Act on information that did not belong to their institution.
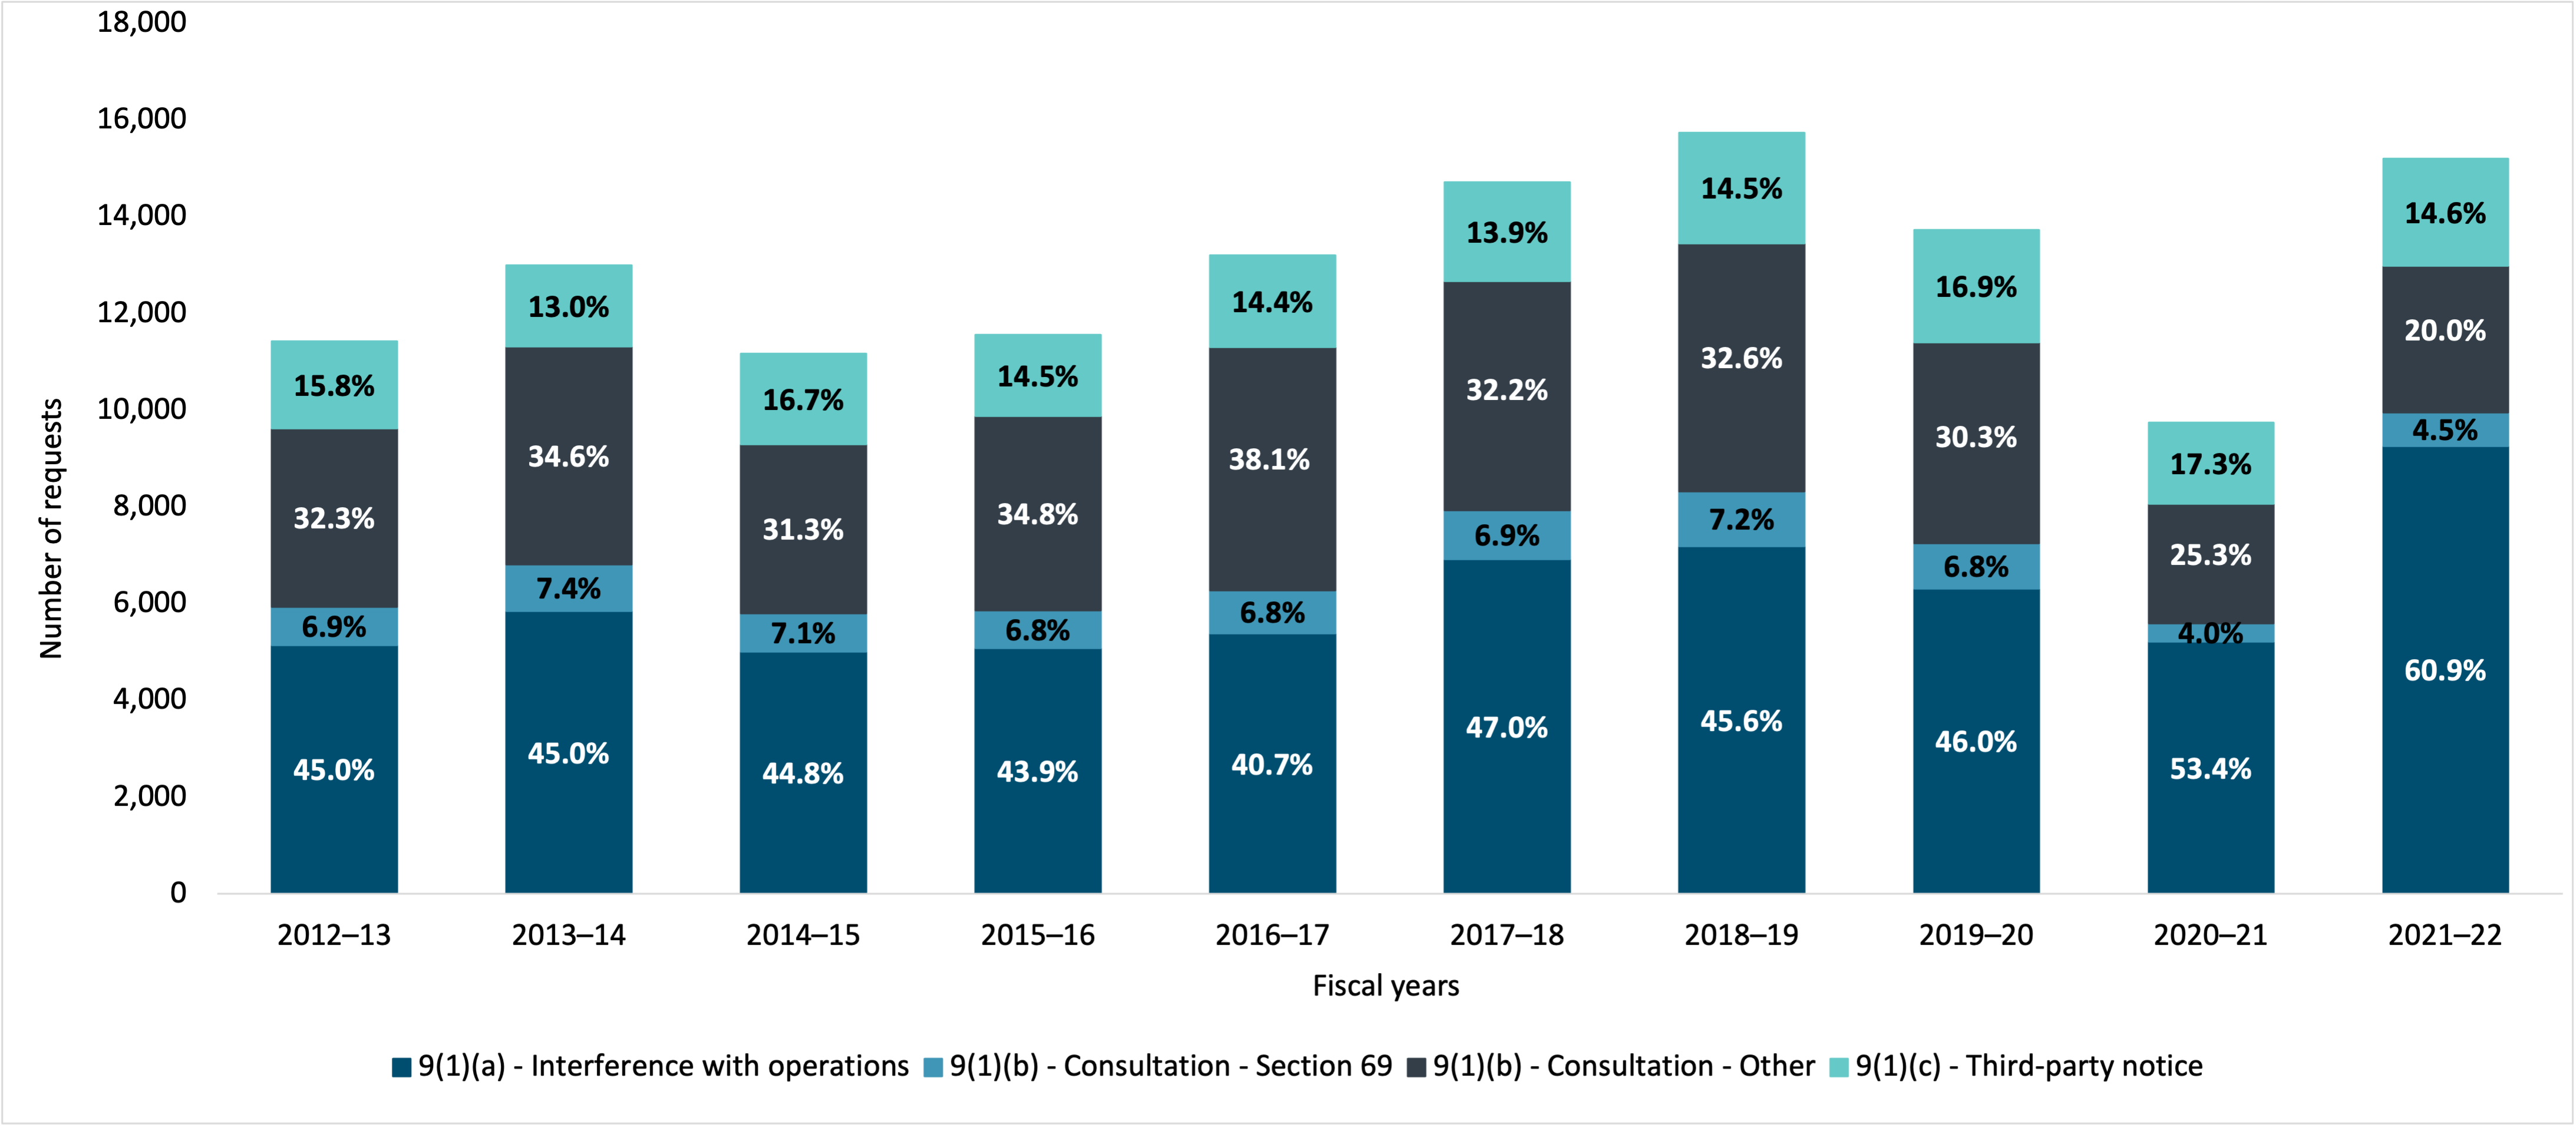
Figure 6 - Text version
| 2012–13 | 2013–14 | 2014–15 | 2015–16 | 2016–17 | 2017–18 | 2018–19 | 2019–20 | 2020–21 | 2021–22 | |
|---|---|---|---|---|---|---|---|---|---|---|
| 9(1)(a) - Interference with operations | 5,142 | 5,844 | 5,005 | 5,071 | 5,378 | 6,919 | 7,184 | 6,313 | 5,205 | 9,261 |
| 9(1)(b) - Consultation - Section 69 | 791 | 964 | 791 | 780 | 895 | 1,011 | 1,135 | 927 | 386 | 683 |
| 9(1)(b) - Consultation - Other | 3,687 | 4,500 | 3,499 | 4,024 | 5,026 | 4,741 | 5,132 | 4,164 | 2,467 | 3,041 |
| 9(1)(c) - Third-party notice | 1,802 | 1,686 | 1,867 | 1,677 | 1,907 | 2,038 | 2,288 | 2,319 | 1,688 | 2,213 |
Figure 7 indicates that for the first six years of the decade, institutions increasingly cited “Workload” as the reason for ATI requests being closed beyond legislated timelines, including extensions. However, since then, the reported reason “Other” has increased over the last decade. Requests for contents of databases, audio or video recordings, records in other countries and public health restrictions are among the “Other” reasons cited by institutions for closing requests beyond legislated timelines. More specifically, the complexity involved in applying to various media formats and the inability to access more sensitive information that could only be processed on site ultimately results in processing delays.
In addition, Figure 7 also indicates that over the last decade, the overall annual volume of ATI requests closed beyond legislated timelines, including extensions, increased year to year.
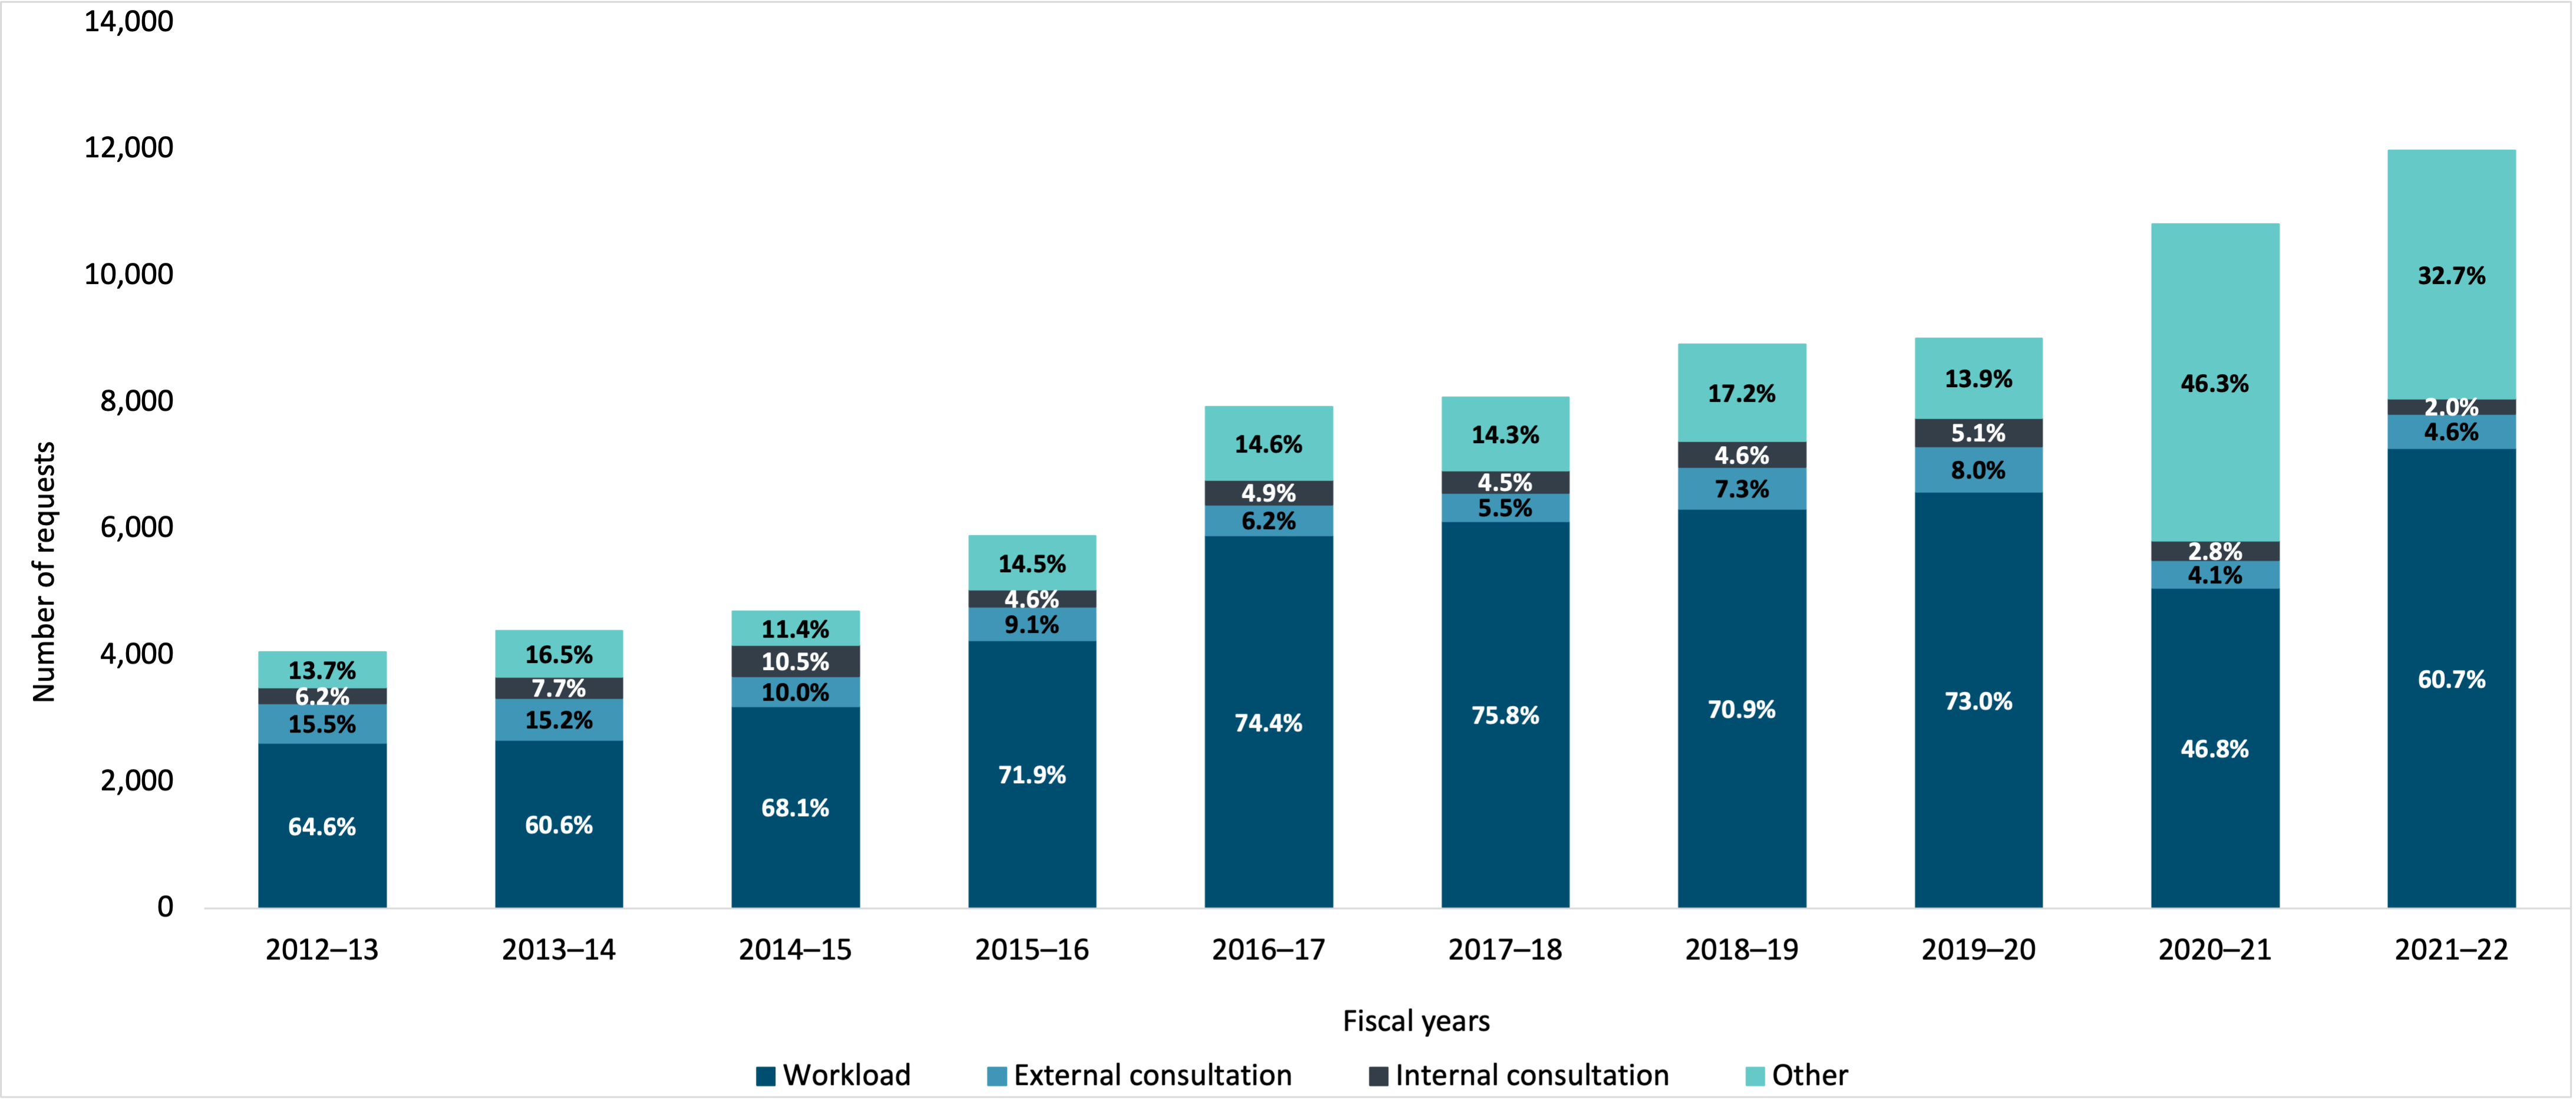
Figure 7 - Text version
| 2012–13 | 2013–14 | 2014–15 | 2015–16 | 2016–17 | 2017–18 | 2018–19 | 2019–20 | 2020–21 | 2021–22 | |
|---|---|---|---|---|---|---|---|---|---|---|
| Workload | 2,611 | 2,655 | 3,194 | 4,235 | 5,889 | 6,119 | 6,315 | 6,578 | 5,059 | 7,266 |
| External consultation | 628 | 665 | 470 | 533 | 489 | 440 | 653 | 717 | 445 | 548 |
| Internal consultation | 252 | 339 | 492 | 268 | 389 | 361 | 413 | 455 | 302 | 242 |
| Other | 552 | 721 | 536 | 851 | 1,153 | 1,150 | 1,528 | 1,256 | 5,008 | 3,920 |
Disposition
Records were all disclosed or disclosed in part in response to 66.8% of closed ATI requests in 2021–22.
Figure 8 indicates that the distribution of the disposition of closed ATI requests has remained relatively stable over the last decade. Note that the disposition “Treated Informally” was only reported in 2012–13 and 2013–14. Subsequently, informal requests have been counted separately (see Figure 15). Also, the disposition “Decline to act with the approval of the Information Commissioner” was added only in 2019–20 as it was introduced in amendments to the Access to Information Act in June 2019 and permits the Information Commission to provide approval for institutions to decline to act on an access request that is vexatious, made in bad faith or otherwise abuse the right to make a request for access to records.
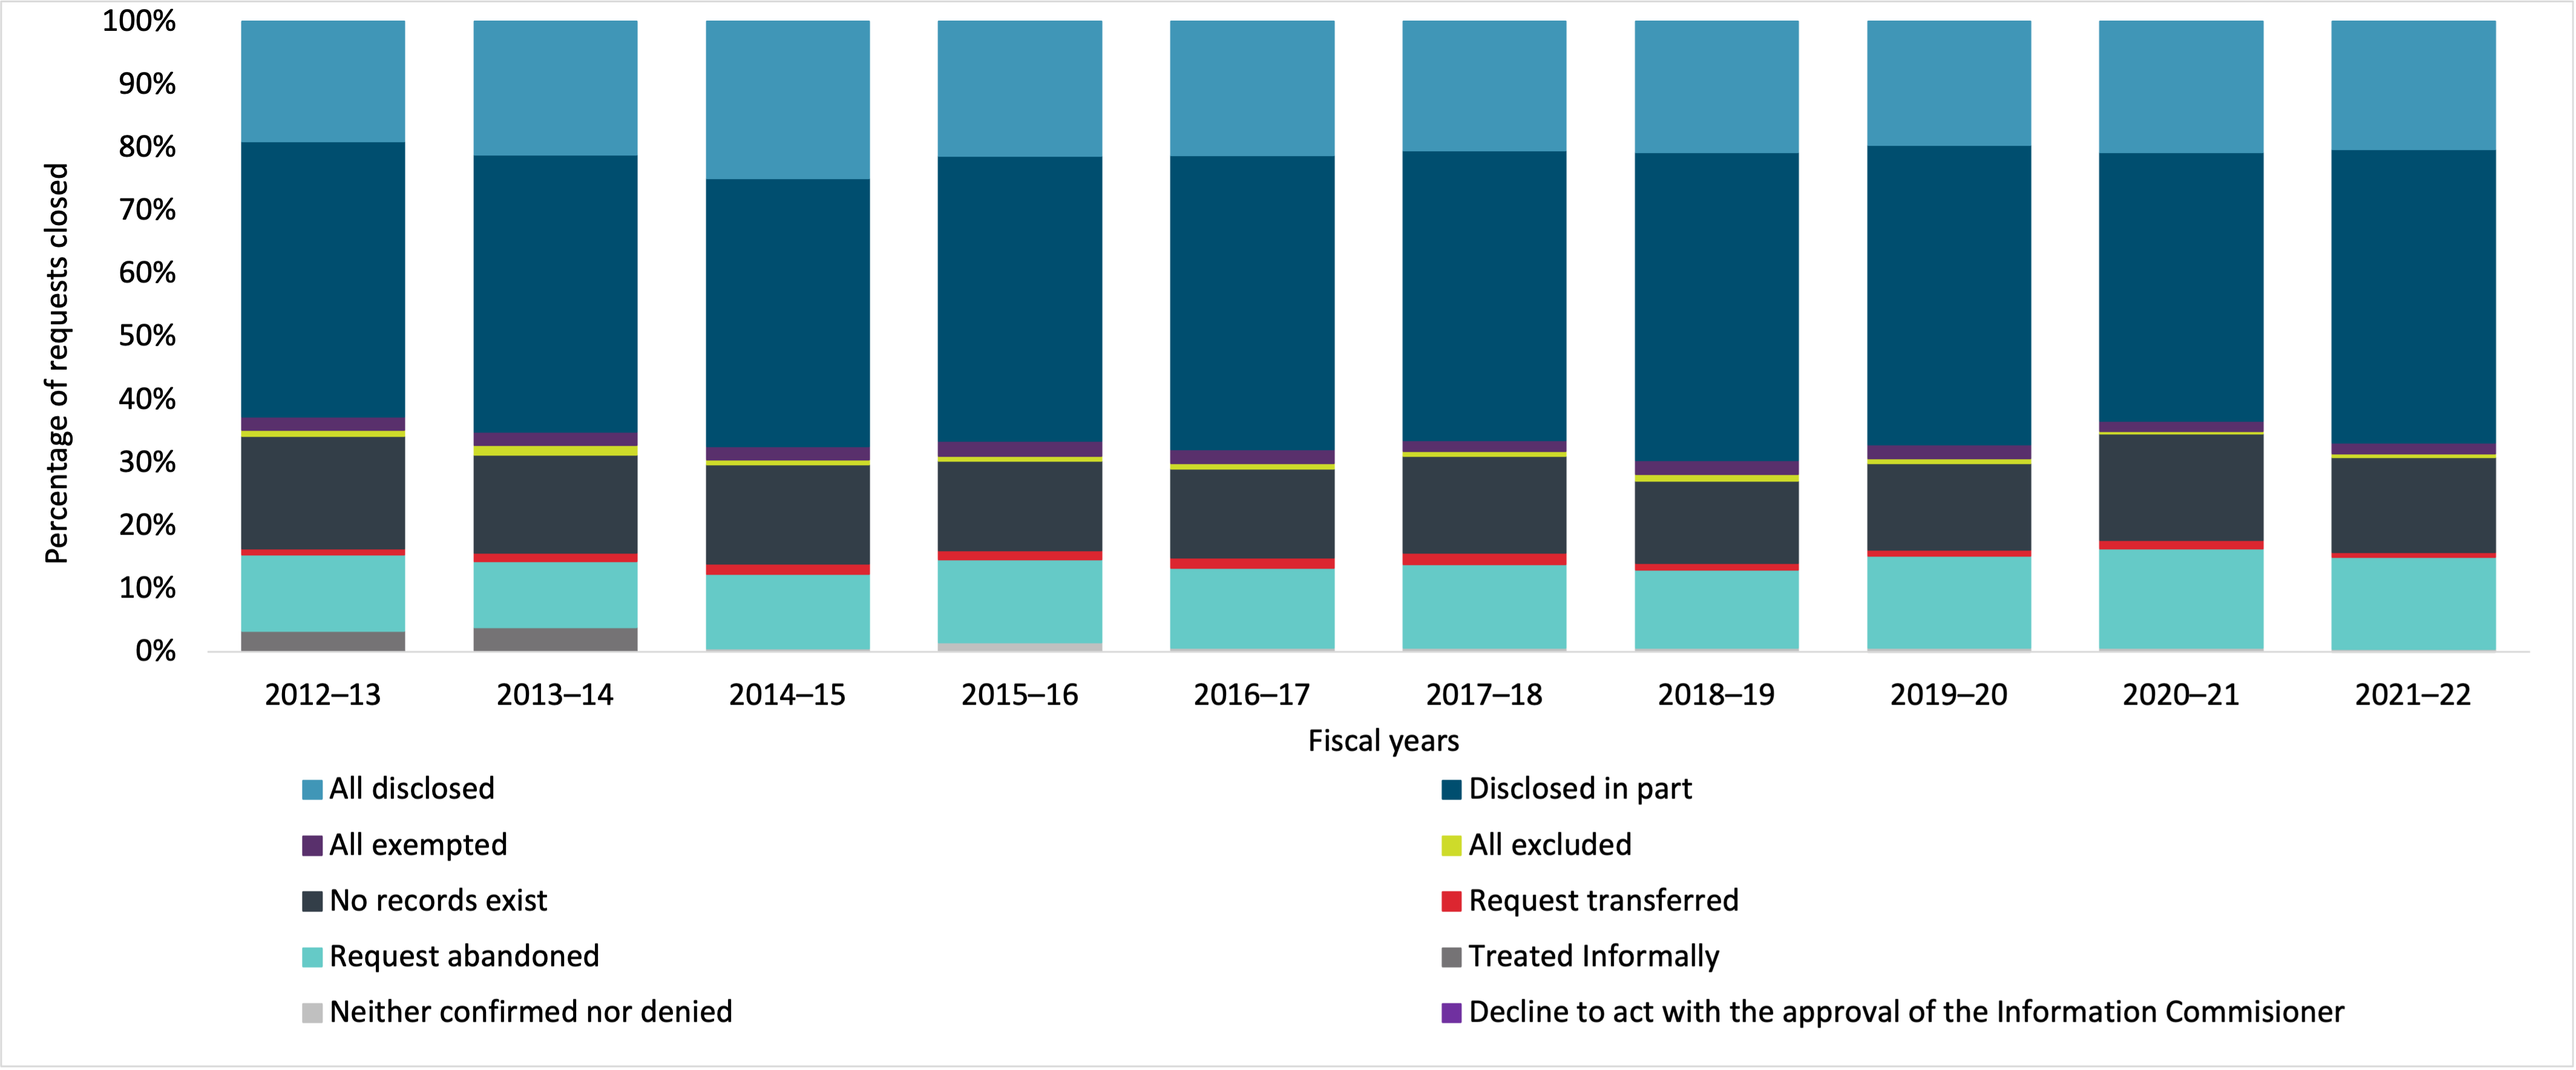
Figure 8 - Text version
| 2012–13 | 2013–14 | 2014–15 | 2015–16 | 2016–17 | 2017–18 | 2018–19 | 2019–20 | 2020–21 | 2021–22 | |
|---|---|---|---|---|---|---|---|---|---|---|
| All disclosed | 19.0% | 21.1% | 24.9% | 21.3% | 21.1% | 20.4% | 20.7% | 19.6% | 20.7% | 20.2% |
| Disclosed in part | 43.7% | 44.0% | 42.5% | 45.2% | 46.7% | 46.0% | 48.9% | 47.5% | 42.7% | 46.6% |
| All exempted | 2.1% | 2.1% | 2.1% | 2.4% | 2.2% | 1.7% | 2.2% | 2.2% | 1.6% | 1.8% |
| All excluded | 0.9% | 1.6% | 0.8% | 0.8% | 0.9% | 0.8% | 1.1% | 0.8% | 0.4% | 0.6% |
| No records exist | 17.8% | 15.6% | 15.7% | 14.3% | 14.1% | 15.3% | 13.0% | 13.7% | 16.9% | 15.0% |
| Request transferred | 1.0% | 1.3% | 1.6% | 1.4% | 1.7% | 1.8% | 1.1% | 1.0% | 1.4% | 0.8% |
| Request abandoned | 12.0% | 10.4% | 11.8% | 13.1% | 12.6% | 13.2% | 12.4% | 14.6% | 15.7% | 14.6% |
| Treated Informally | 3.4% | 3.9% | 0.0% | 0.0% | 0.0% | 0.0% | 0.0% | 0.0% | 0.0% | 0.0% |
| Neither confirmed nor denied | 0.0% | 0.0% | 0.6% | 1.6% | 0.7% | 0.7% | 0.7% | 0.7% | 0.7% | 0.5% |
| Decline to act with the approval of the Information Commisioner | 0.0% | 0.0% | 0.0% | 0.0% | 0.0% | 0.0% | 0.0% | 0.0% | 0.0% | 0.0% |
Complexity
The overall annual volume of complex ATI requests, that is, high numbers of pages processed, those requiring consultation, requests subject to fees assessment, etc. has fluctuated around the 10,000 requests level, with significant decreases in volume in 2019–20 and 2020–21.
Figure 9 shows that while the number of pages processed has remained relatively stable over the last decade, there can be unpredictable variability in demand which presents resourcing challenges for institutions.
The number of pages processed rose significantly in 2017–18 due to one request of approximately 14.8 million pages. The number of pages once again rose significantly in 2019–20 due to one institution closing three requests on the same subject involving nearly 15 million pages in total.
Importantly, Figure 9 captures pages processed but not the overall volume of pages collected while responding to a request, including large volumes of duplicate or non-relevant records that require staff time to review and scope in or out of the request. TBS is working to determine how best to capture this additional volume of indirect effort in the system.
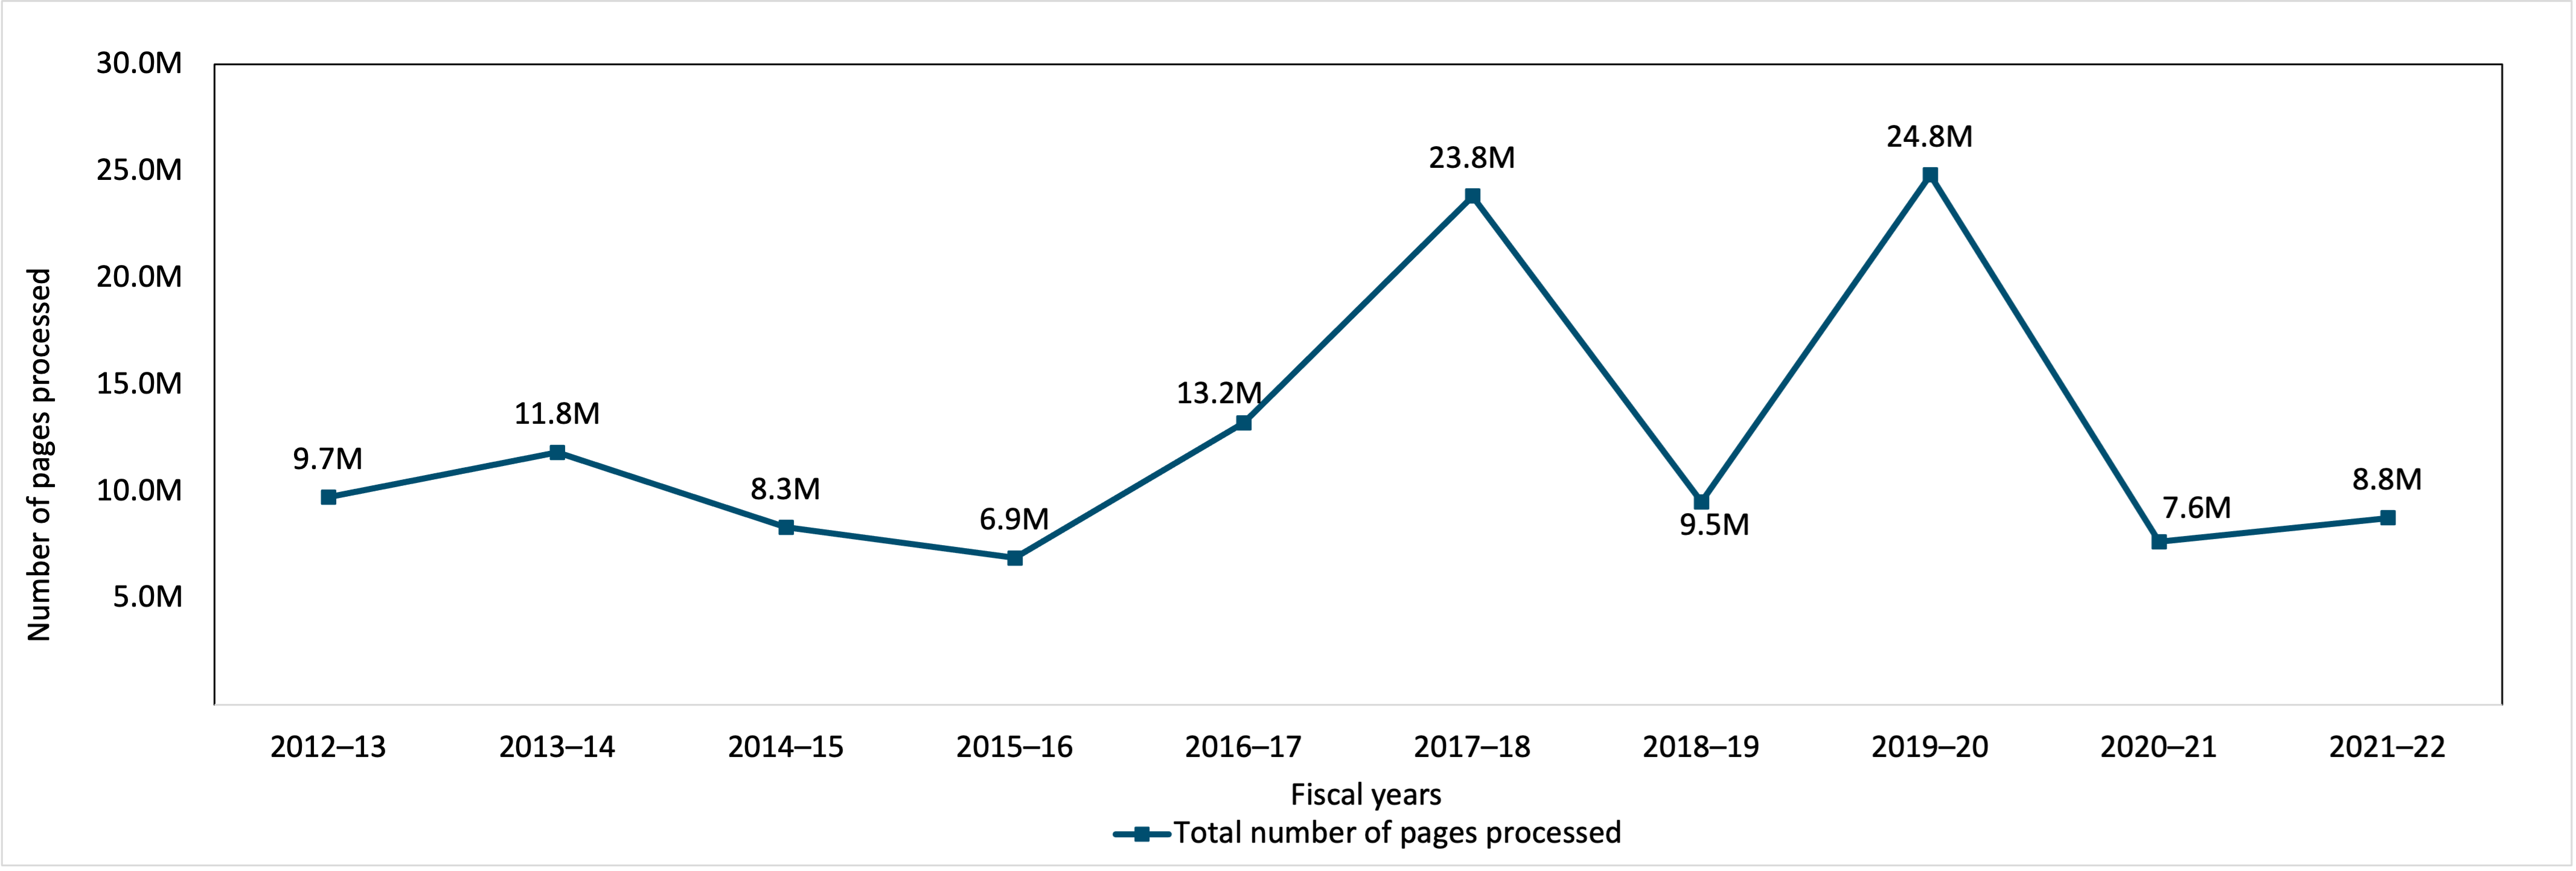
Figure 9 - Text version
| 2012–13 | 2013–14 | 2014–15 | 2015–16 | 2016–17 | 2017–18 | 2018–19 | 2019–20 | 2020–21 | 2021–22 | |
|---|---|---|---|---|---|---|---|---|---|---|
| Total number of pages processed | 9,720,530 | 11,817,160 | 8,305,188 | 6,880,556 | 13,212,719 | 23,822,962 | 9,494,607 | 24,812,554 | 7,628,868 | 8,752,652 |
Figure 10 indicates that over the last decade, the percentage of complex ATI requests due to “Assessment of fees” has gradually decreased to 0% in 2021–22 because of 2019 amendments to the Access to Information Act that eliminated fees other than the flat fee of $5 for new requests. Requests that were open prior to 2016 could still have had fees assessed, which accounts for the persistence of this category in the following years.
Figure 10 indicates the emerging impact of response format in processing requests. The “Other” category includes requests for the contents of a database, requests to process audio or video recordings, and records in another country or region.
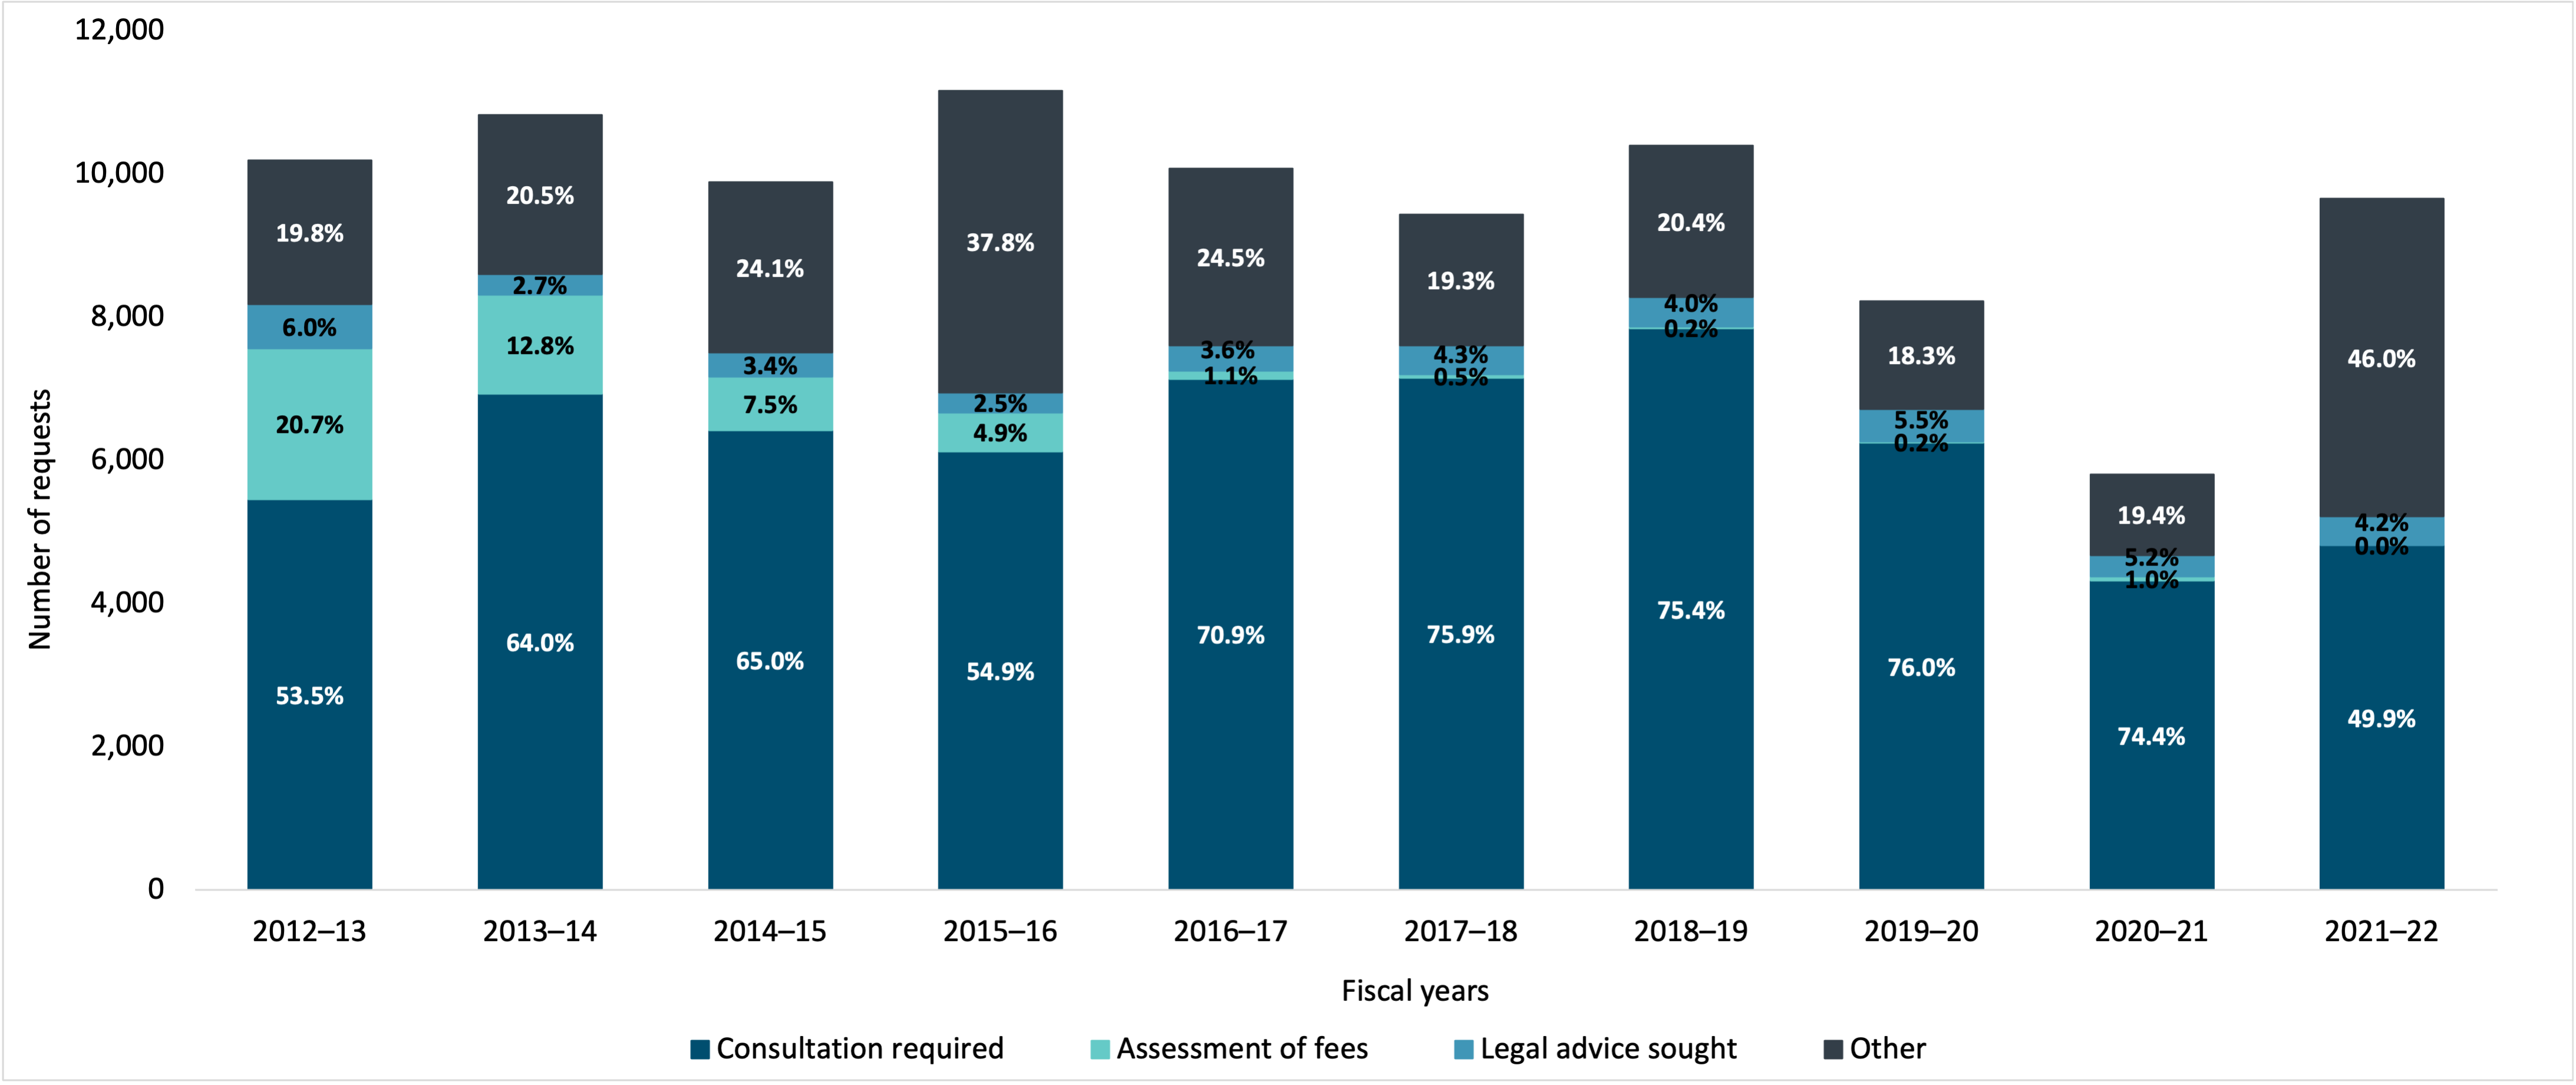
Figure 10 - Text version
| 2012–13 | 2013–14 | 2014–15 | 2015–16 | 2016–17 | 2017–18 | 2018–19 | 2019–20 | 2020–21 | 2021–22 | |
|---|---|---|---|---|---|---|---|---|---|---|
| Consultation required | 5,454 | 6,926 | 6,423 | 6,122 | 7,138 | 7,155 | 7,843 | 6,246 | 4,317 | 4,813 |
| Assessment of fees | 2,113 | 1,383 | 743 | 548 | 109 | 48 | 22 | 17 | 59 | - |
| Legal advice sought | 610 | 294 | 338 | 277 | 358 | 404 | 411 | 454 | 302 | 403 |
| Other | 2,013 | 2,222 | 2,382 | 4,214 | 2,468 | 1,822 | 2,120 | 1,506 | 1,128 | 4,436 |
Consultations between federal institutions
Figure 11 indicates that over the last decade, the number of consultation requests closed annually has mostly kept pace with the volume of requests for consultation. However, some divergence in the years leading into the pandemic has carried forward into an ongoing increase in the number of consultation requests pending at the end of a year.
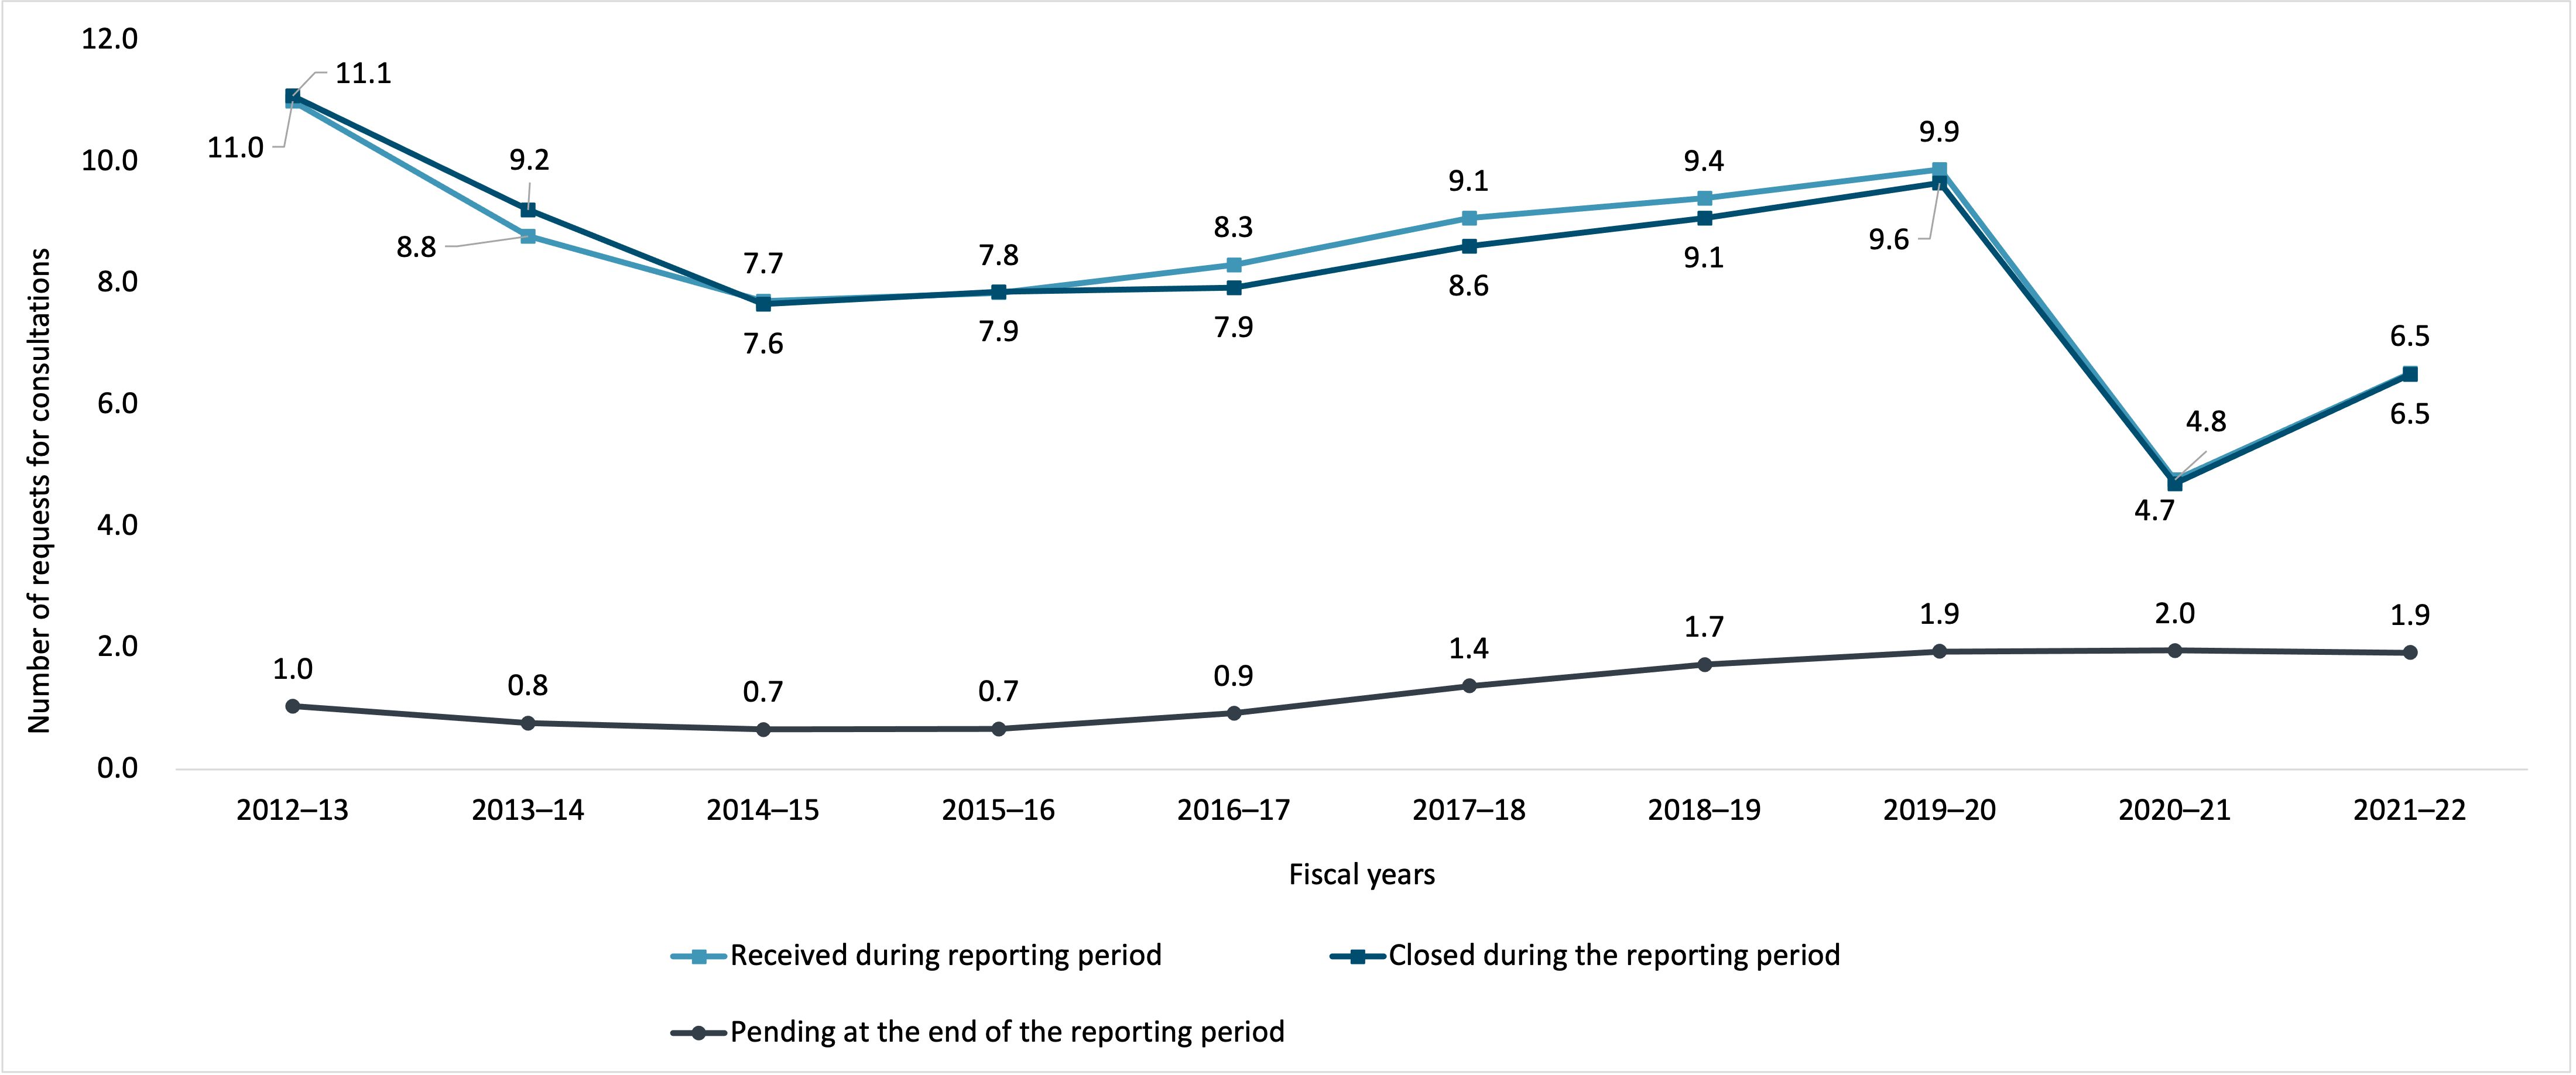
Figure 11 - Text version
| 2012–13 | 2013–14 | 2014–15 | 2015–16 | 2016–17 | 2017–18 | 2018–19 | 2019–20 | 2020–21 | 2021–22 | |
|---|---|---|---|---|---|---|---|---|---|---|
| Received during reporting period | 10,990 | 8,770 | 7,702 | 7,839 | 8,300 | 9,064 | 9,394 | 9,869 | 4,759 | 6,513 |
| Closed during the reporting period | 11,076 | 9,201 | 7,649 | 7,853 | 7,922 | 8,605 | 9,068 | 9,643 | 4,696 | 6,498 |
| Pending at the end of the reporting period | 1,035 | 759 | 655 | 663 | 920 | 1,369 | 1,722 | 1,937 | 1,951 | 1,918 |
Figure 12 shows a U-shaped curve over the last decade. Early in the decade, there were fewer consultations between institutions and more of these consultations were closed within 30 days. Going into the pandemic, consultations were on the rise, but fewer were being closed within 30 days. Over the last two years of the pandemic, numbers of consultation fell dramatically while the number closed beyond 120 days reached a new high.
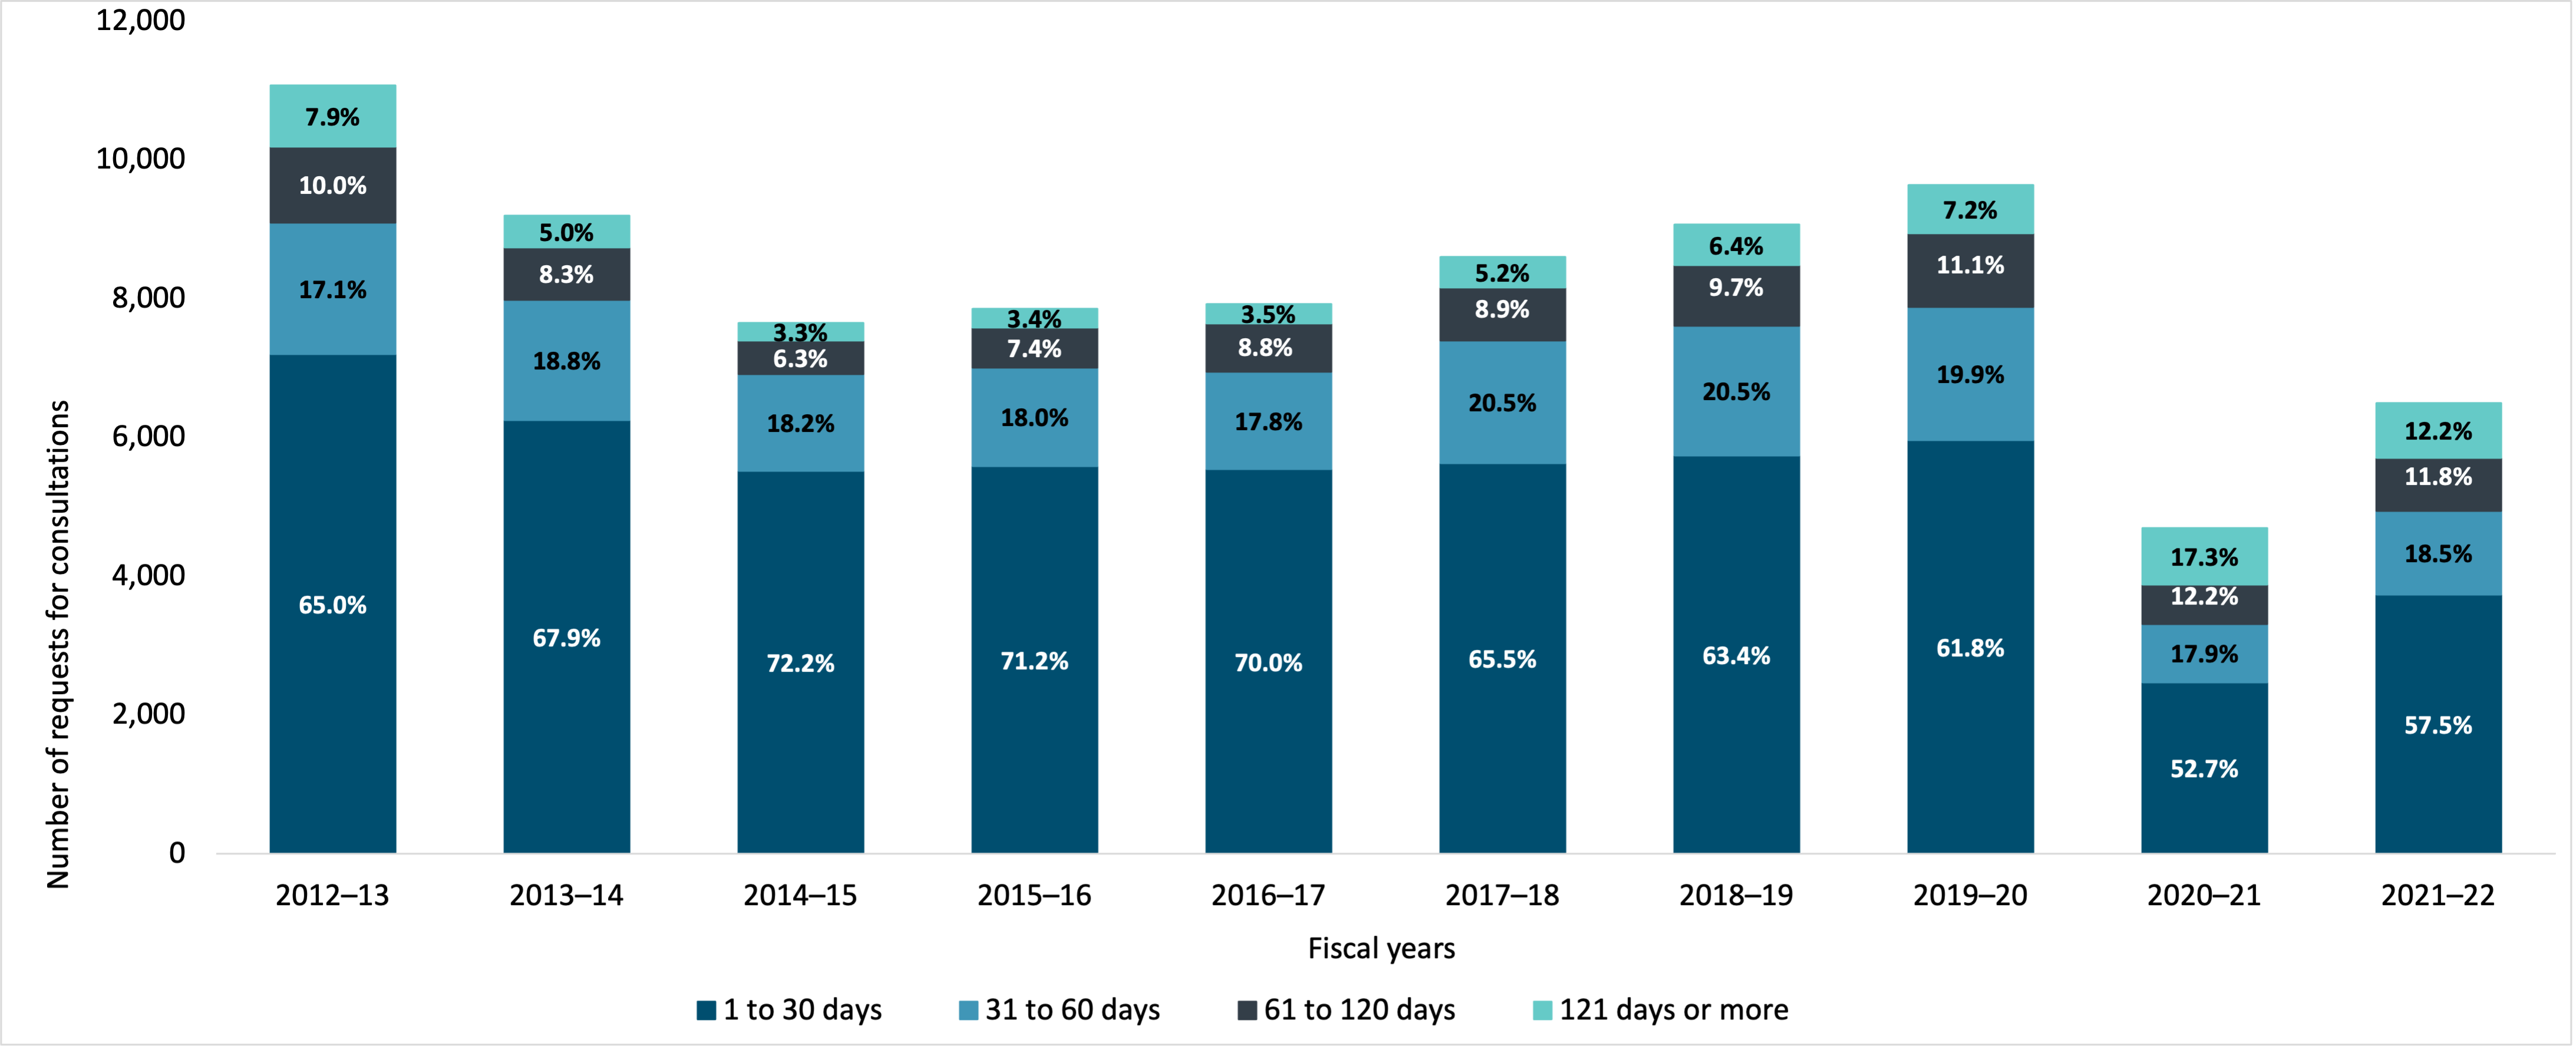
Figure 12 - Text version
| 2012–13 | 2013–14 | 2014–15 | 2015–16 | 2016–17 | 2017–18 | 2018–19 | 2019–20 | 2020–21 | 2021–22 | |
|---|---|---|---|---|---|---|---|---|---|---|
| 1 to 30 days | 7,200 | 6,249 | 5,520 | 5,590 | 5,542 | 5,634 | 5,745 | 5,960 | 2,473 | 3,737 |
| 31 to 60 days | 1,893 | 1,732 | 1,392 | 1,417 | 1,408 | 1,761 | 1,861 | 1,920 | 841 | 1,203 |
| 61 to 120 days | 1,102 | 761 | 485 | 579 | 698 | 766 | 880 | 1,066 | 571 | 766 |
| 121 days or more | 878 | 459 | 252 | 267 | 274 | 444 | 582 | 697 | 811 | 792 |
Exemptions
Figure 13 presents the most invoked exemptions. Note that more than one exemption can be invoked for a single request and therefore the same request may be represented more than once throughout the table. The increase in the application of exemptions tracks the increase in overall volume of requests.
For the last decade, subsection 19(1), which relates to personal information, has been the most frequently invoked exemption. Rounding out the top five most frequently invoked exemptions are those relating to law enforcement and lawful investigations, information obtained in confidence from a foreign state, accounts of consultations or deliberations in which government or Crown employees participate, and advice and recommendations.
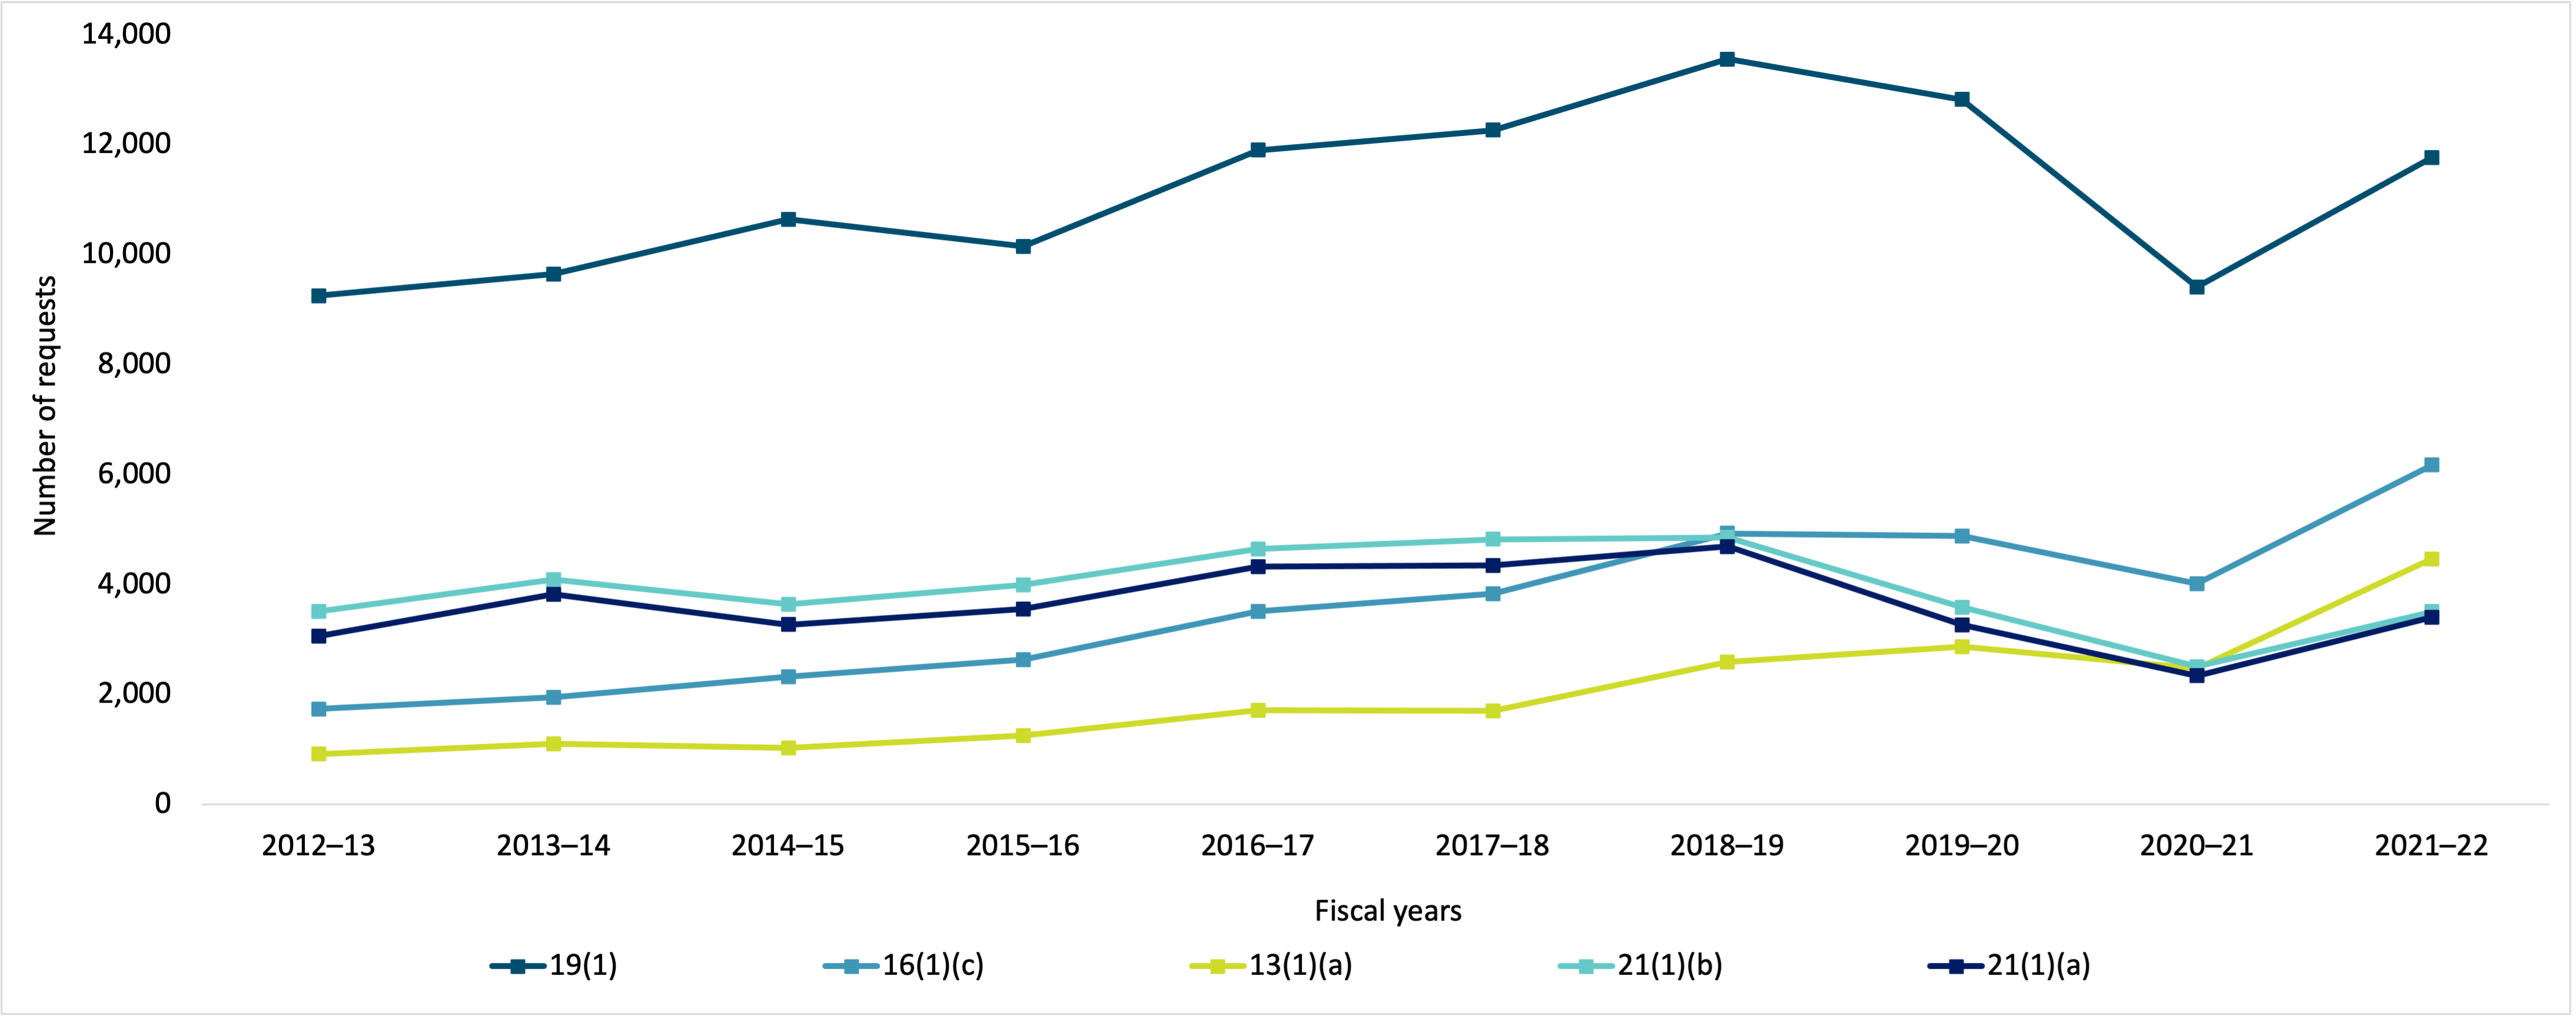
Figure 13 - Text version
| 2012–13 | 2013–14 | 2014–15 | 2015–16 | 2016–17 | 2017–18 | 2018–19 | 2019–20 | 2020–21 | 2021–22 | |
|---|---|---|---|---|---|---|---|---|---|---|
| 19(1) | 9,253 | 9,644 | 10,639 | 10,147 | 11,900 | 12,265 | 13,558 | 12,821 | 9,411 | 11,764 |
| 16(1)(c) | 1,734 | 1,946 | 2,321 | 2,629 | 3,512 | 3,834 | 4,929 | 4,883 | 4,009 | 6,172 |
| 13(1)(a) | 917 | 1,103 | 1,030 | 1,248 | 1,714 | 1,700 | 2,592 | 2,871 | 2,474 | 4,464 |
| 21(1)(b) | 3,509 | 4,092 | 3,639 | 3,996 | 4,647 | 4,822 | 4,854 | 3,589 | 2,503 | 3,504 |
| 21(1)(a) | 3,061 | 3,817 | 3,269 | 3,552 | 4,321 | 4,349 | 4,688 | 3,265 | 2,337 | 3,400 |
| Exemption | Description |
|---|---|
| 19(1) | Shall refuse to disclose any record containing personal information. |
| 16(1)(c) | May refuse to disclose any record containing information expected to be injurious to law enforcement and the conduct of lawful investigations. |
| 13(1)(a) | Shall refuse to disclose any record containing information obtained in confidence from the government of a foreign state. |
| 21(1)(b) | May refuse to disclose any record containing an account of consultations or deliberations in which government or Crown employees participate. |
| 21(1)(a) | May refuse to disclose any record containing advice or recommendations developed for or by a government institution or a minister of the Crown. |
Exclusions
Figure 14 indicates that for the last decade, except for 2020–21, the most invoked exemption was paragraph 69(1)(g) re (a), which relates to Cabinet confidences that include records that contain information about the contents of records pertaining to memoranda presenting proposals or recommendations. Rounding out the top five exclusions are three paragraphs that pertain to specific types of Cabinet confidences, as well as an exclusion that relates to published material or material available for purchase by the public.
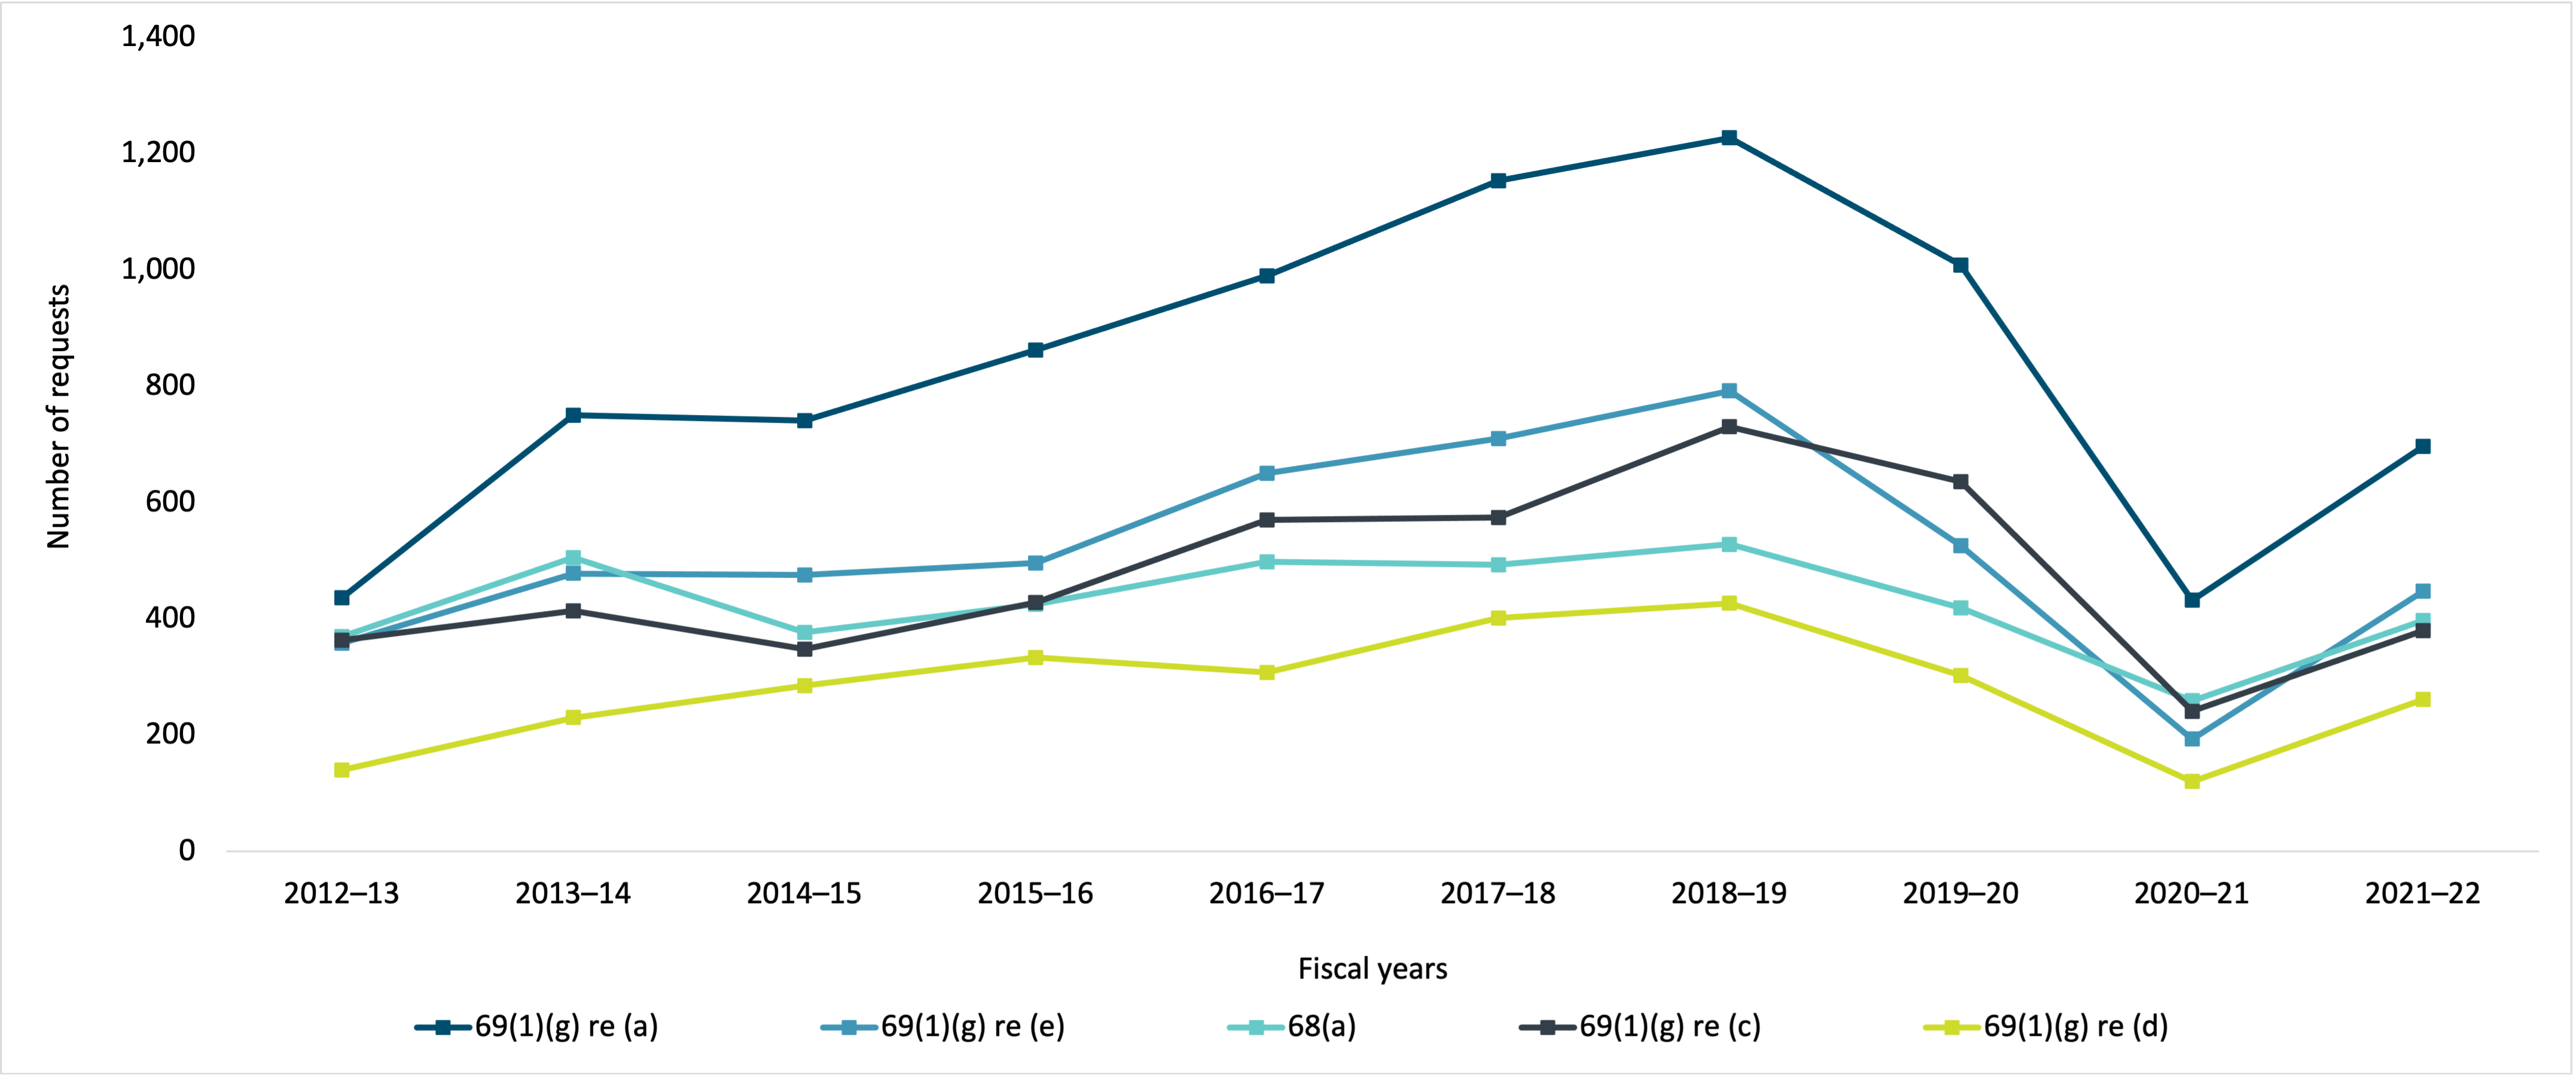
Figure 14 - Text version
| 2012–13 | 2013–14 | 2014–15 | 2015–16 | 2016–17 | 2017–18 | 2018–19 | 2019–20 | 2020–21 | 2021–22 | |
|---|---|---|---|---|---|---|---|---|---|---|
| 69(1)(g) re (a) | 436 | 750 | 741 | 862 | 990 | 1,153 | 1,227 | 1,008 | 432 | 697 |
| 69(1)(g) re (e) | 358 | 478 | 475 | 496 | 650 | 710 | 792 | 526 | 193 | 448 |
| 68(a) | 369 | 505 | 377 | 425 | 498 | 493 | 528 | 419 | 259 | 397 |
| 69(1)(g) re (c) | 363 | 414 | 348 | 428 | 570 | 574 | 730 | 636 | 241 | 380 |
| 69(1)(g) re (d) | 140 | 230 | 285 | 333 | 308 | 401 | 427 | 303 | 120 | 261 |
| Exemption | Description |
|---|---|
| 69(1)(g) re (a) | Does not apply to Cabinet confidences including records that contain information about the contents of any records pertaining to memoranda presenting proposals or recommendations. |
| 69(1)(g) re (e) | Does not apply to Cabinet confidences including records that contain information about the contents of any records pertaining to briefing materials relating to matters that are before or proposed to be brought before Council. |
| 68(a) | Does not apply to published material, other than material published under Part 2, or material available for purchase by the public. |
| 69(1)(g) re (c) | Does not apply to Cabinet confidences including records that contain information about the contents of any records pertaining to agenda or records recording deliberations or decisions of Council. |
| 69(1)(g) re (d) | Does not apply to Cabinet confidences including records that contain information about the contents of any records pertaining to records on communications or discussions between ministers of Crown on matters regarding government decision or formulation of policy. |
Informal requests for government information
An informal request is a request for information made to a government institution subject to the Access to Information Act that is either not made or not processed under the act.
Informal requests include:
- formal requests that are discontinued in favour of providing information informally, in consultation with the requester
- requests where the information sought is already publicly available online
- requests where the response involves re-releasing information that was made available in response to previously closed formal requests, summaries of which are found online
Figure 15 indicates that over the last eight years since the collection of informal request data, the percentage of informal requests closed within 30 days has decreased while the percentage closed beyond 120 days has reached a new high.
TBS supports maximizing the availability of previously released records and continues to provide guidance to departments in line with requirements set out in the Directive on Access to Information Requests. TBS continues to work on ways to improve access to information and transparency, recognizing that in the federal context, all online publications (including the publication of previously released requests) are made available in both official languages and in accessible format to meet the needs of all Canadians.
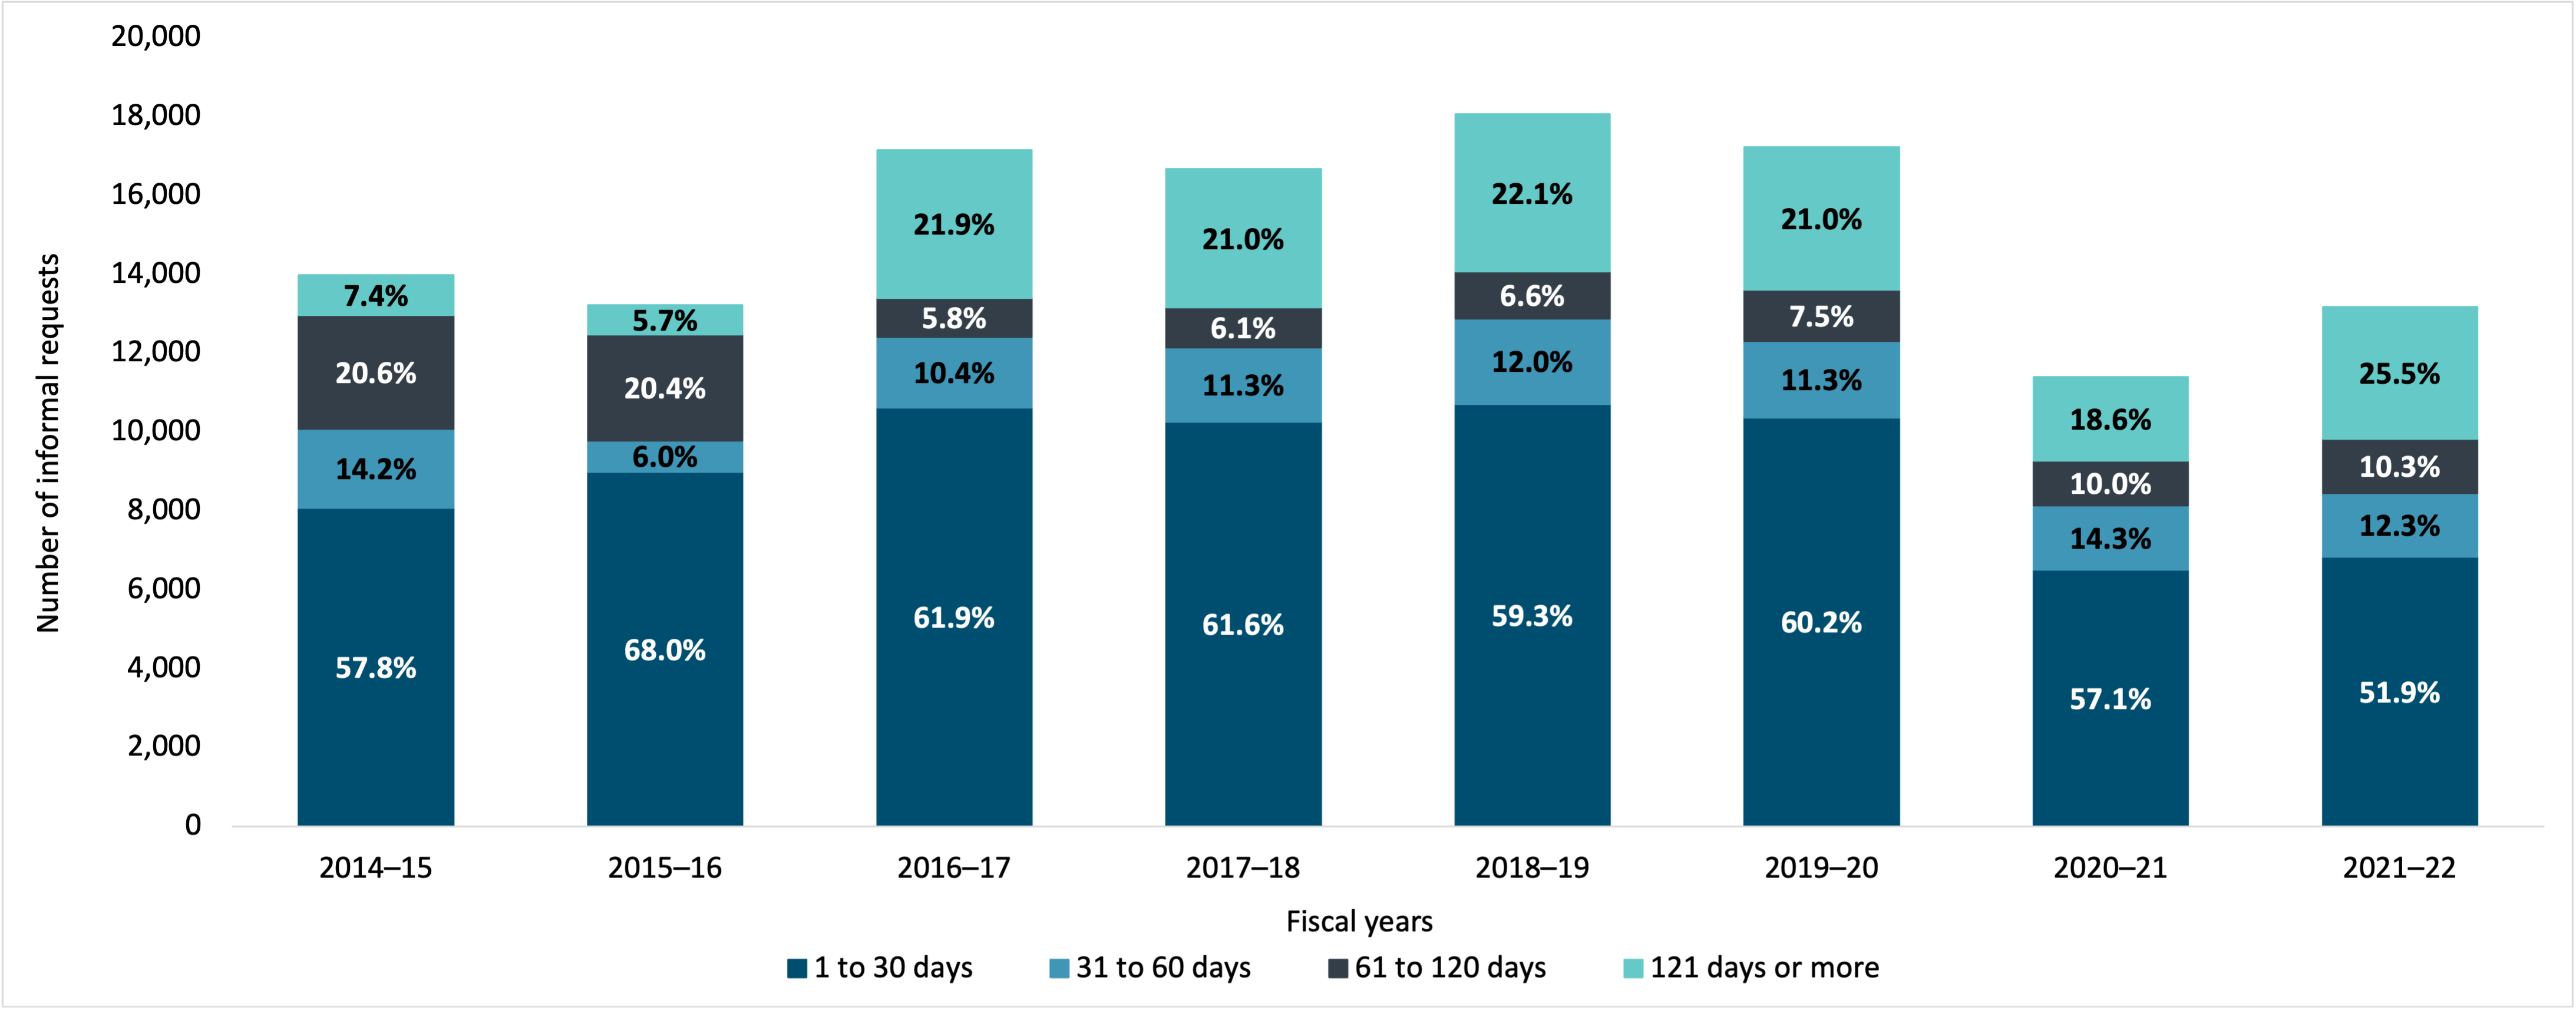
Figure 15 - Text version
| 2014–15 | 2015–16 | 2016–17 | 2017–18 | 2018–19 | 2019–20 | 2020–21 | 2021–22 | |
|---|---|---|---|---|---|---|---|---|
| 1 to 30 days | 8,077 | 8,982 | 10,616 | 10,257 | 10,706 | 10,363 | 6,497 | 6,831 |
| 31 to 60 days | 1,990 | 794 | 1,782 | 1,878 | 2,159 | 1,939 | 1,633 | 1,618 |
| 61 to 120 days | 2,885 | 2,693 | 1,000 | 1,022 | 1,192 | 1,292 | 1,142 | 1,363 |
| 121 days or more | 1,029 | 749 | 3,747 | 3,501 | 3,990 | 3,623 | 2,113 | 3,360 |
Fees and costs
Table 1 breaks down the fees and costs associated with the administration of the Access to Information Act. Due to changes in the financial information collected, it is not possible to provide a 10-year historical perspective.
| Description | Amount 2021–22 |
|---|---|
| Cost of institutions’ operationstable 1 note a | $83,202,144.00 |
| Cost of Access to Information and Privacy Online Request Service | $1,288,685.00 |
| Total | $84,490,829.00 |
| Number of requests in which fees were collected | 39,461 |
| Fees collected | $197,245.00 |
| Number of requests in which fees were waived or refunded | 5,941 |
| Fees waived or refunded | $29,690.00 |
Table 1 Notes
|
|
Figure 16 indicates that over the last decade, the total cost of institutions’ operations in actual dollars has increased.
Costs in actual dollars have largely been increasing over the last decade and are currently estimated at $84.1 million. After the reporting period, a study was conducted as part of the ATI review. The study found that the direct cost of processing one page of an ATI request is just over $5. The same study estimated that when indirect costs (for example, the cost of subject matter‑ experts collecting, reviewing and making recommendations on records) is factored in, the current regime costs $195 million to operate.
Note that the values in Figure 16 are different than what were reported in previous years because costs associated with IRCC’s administration of the Access to Information Act are presented in Appendix A. The values are in actual dollars and don’t reflect inflation.
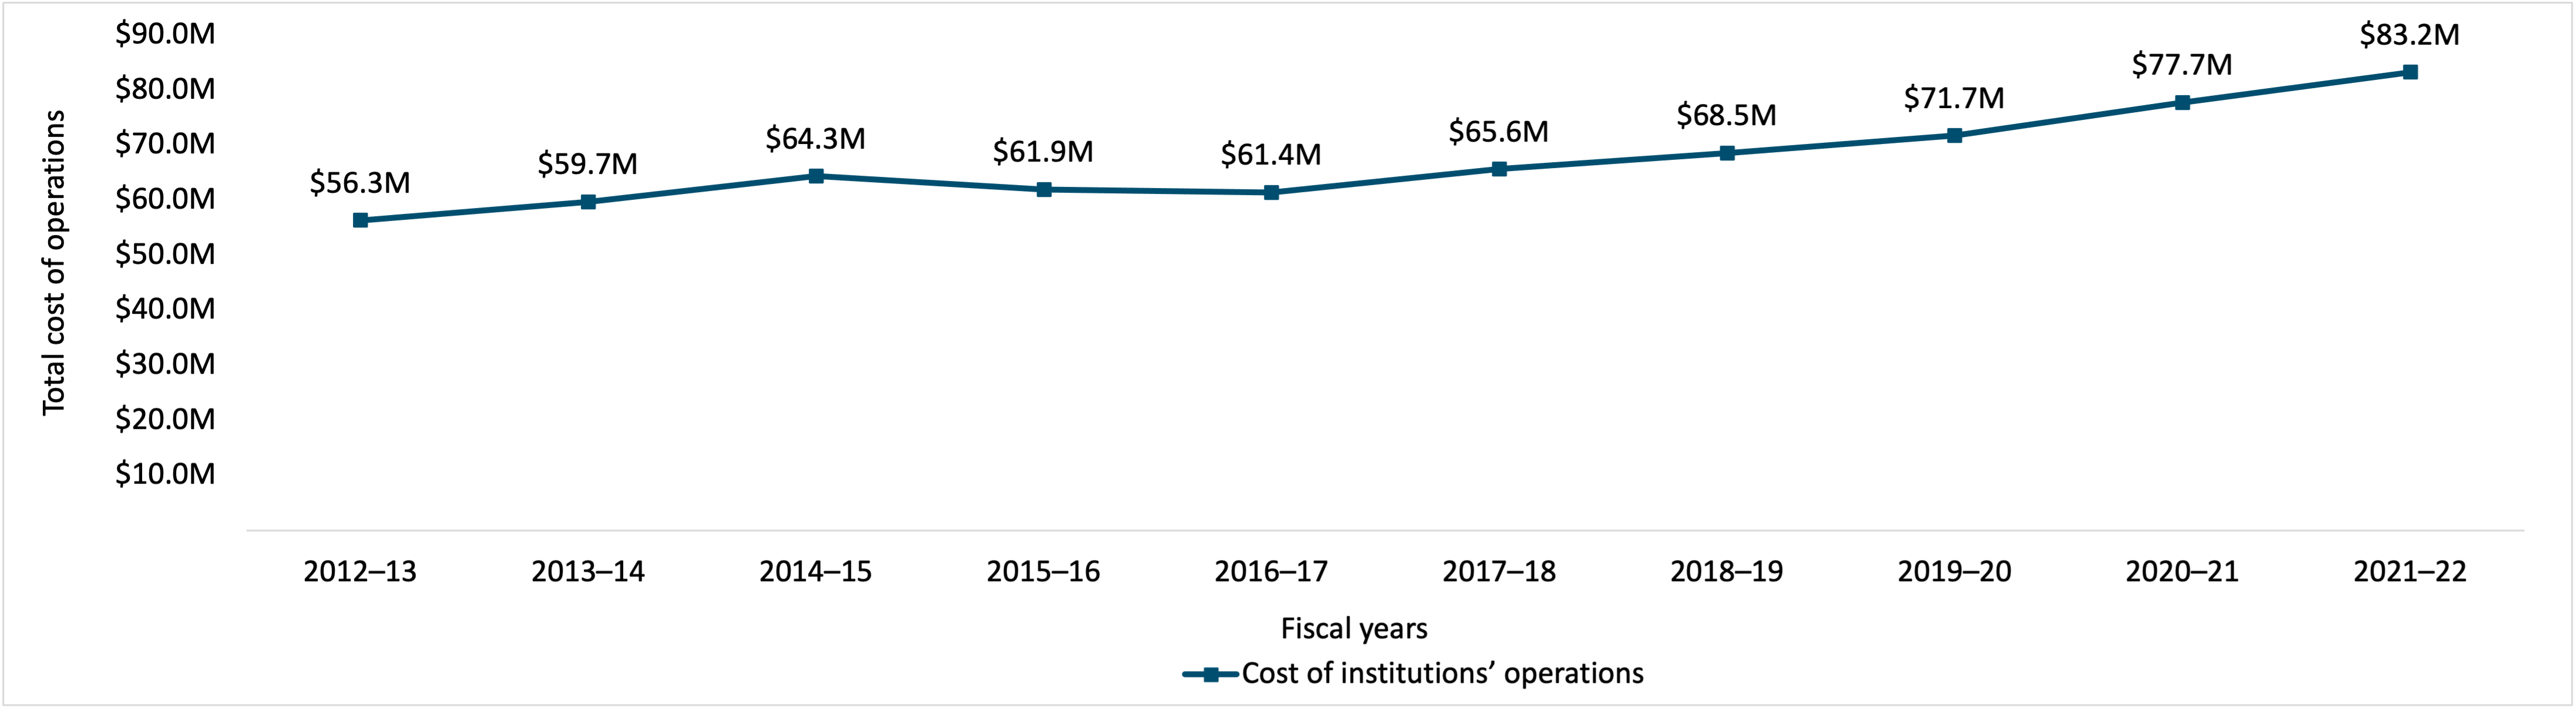
Figure 16 - Text version
| 2012–13 | 2013–14 | 2014–15 | 2015–16 | 2016–17 | 2017–18 | 2018–19 | 2019–20 | 2020–21 | 2021–22 | |
|---|---|---|---|---|---|---|---|---|---|---|
| Cost of institutions’ operations | $56,319,570 | $59,654,787 | $64,308,923 | $61,906,740 | $61,404,105 | $65,585,102 | $68,526,010 | $71,664,483 | $77,723,116 | $83,202,144 |
Figure 17 indicates that for the first three years of the decade, the total amount of fees collected increased. Since then, the trend reversed until 2020–21. In 2021–22, this number experienced the biggest increase over the last decade. Note that this is consistent with the observation in Figure 1 in which the number of ATI requests received experienced the biggest increase over the same period.
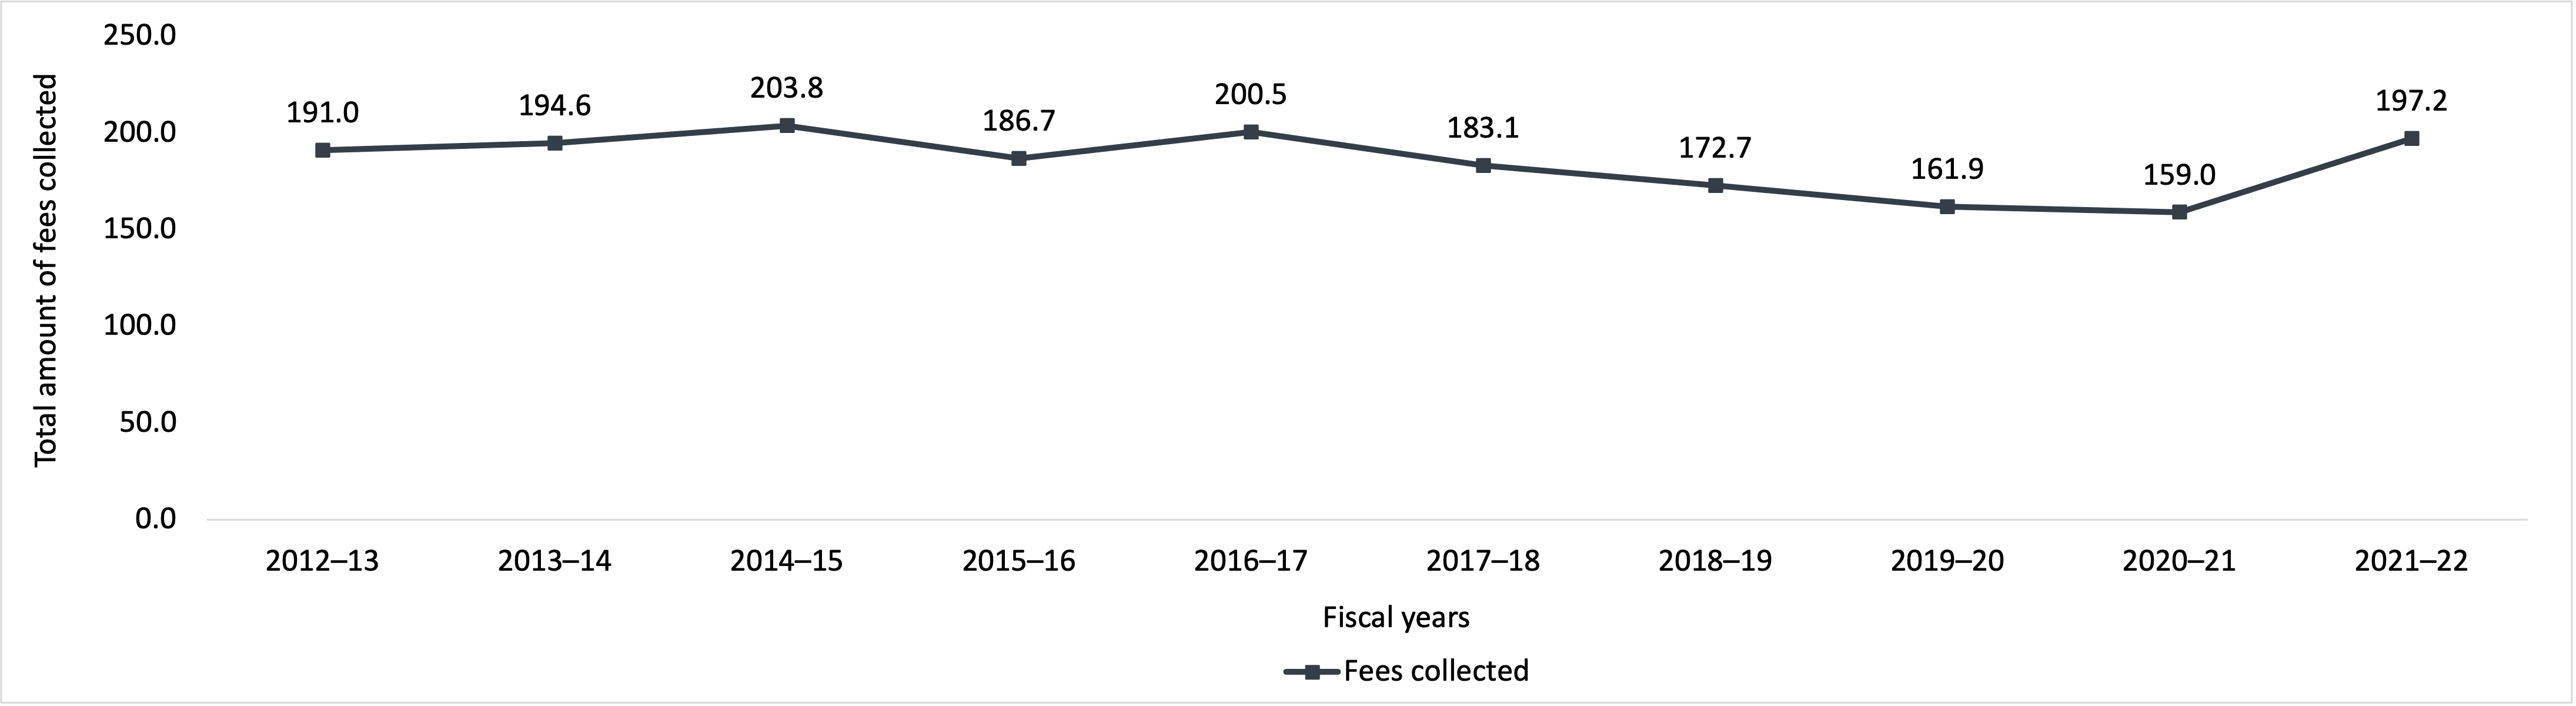
Figure 17 - Text version
| 2012–13 | 2013–14 | 2014–15 | 2015–16 | 2016–17 | 2017–18 | 2018–19 | 2019–20 | 2020–21 | 2021–22 | |
|---|---|---|---|---|---|---|---|---|---|---|
| Fees collected | $191,040 | $194,639 | $203,796 | $186,670 | $200,506 | $183,075 | $172,728 | $161,875 | $158,965 | $197,245 |
Figure 18 indicates that the total amount of fees waived or refunded experienced a sharp increase in 2016–17. However, since then, this number has decreased.
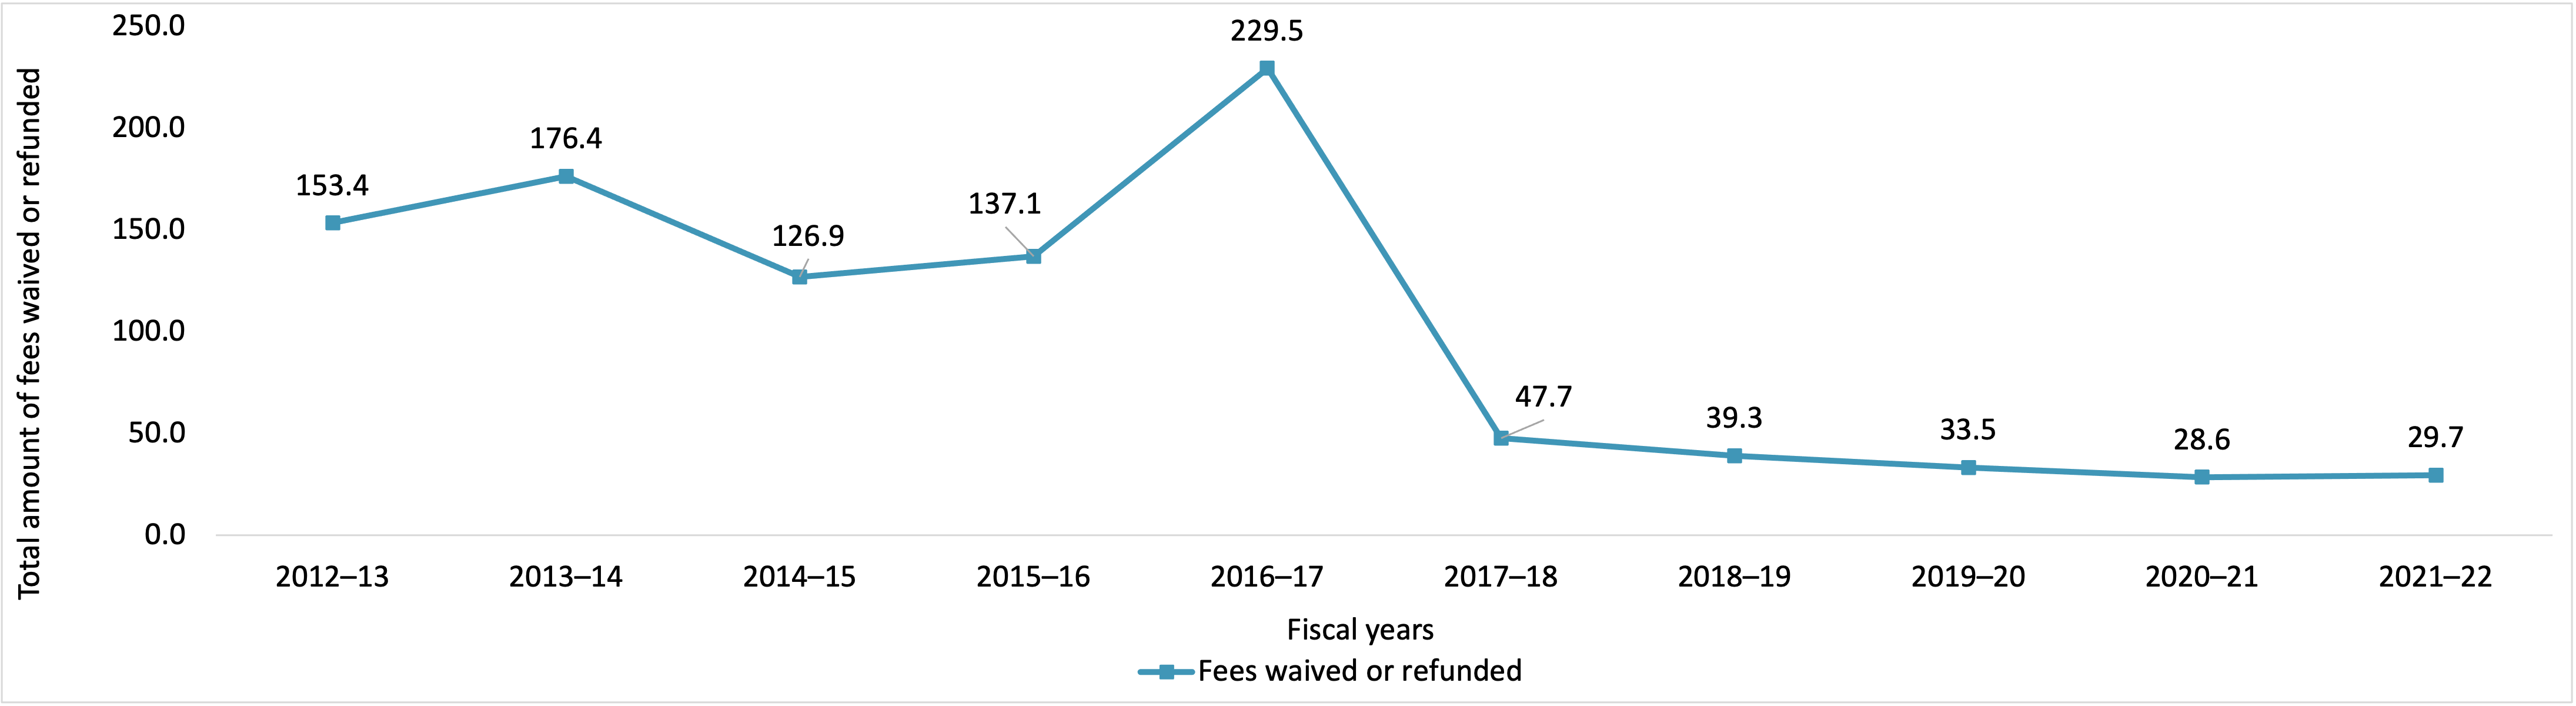
Figure 18 - Text version
| 2012–13 | 2013–14 | 2014–15 | 2015–16 | 2016–17 | 2017–18 | 2018–19 | 2019–20 | 2020–21 | 2021–22 | |
|---|---|---|---|---|---|---|---|---|---|---|
| Fees waived or refunded | $153,437 | $176,428 | $126,862 | $137,085 | $229,454 | $47,742 | $39,253 | $33,474 | $28,610 | $29,690 |
Privacy Act statistics for 2021–22
-
In this section
- Requests under Privacy Act
- Timeliness
- Disposition
- Complexity
- Consultations between federal institutions
- Exemptions
- Exclusions
- Costs
- Disclosures under subsections 8(2) and 8(5) of the Privacy Act
- Requests for correction of personal information and notations
- Privacy impact assessments
- Personal information banks
- Material privacy breaches
Requests under Privacy Act
When comparing the number of personal information requests closed to personal information requests received over the last decade, Figure 19 demonstrates that the number of personal information requests closed has not kept pace with the number of personal information requests received, except for 2012–13, where the number of personal information requests closed slightly surpassed the number of personal information requests received. The significant decrease for 2020–21 is primarily explained by public health restrictions due to COVID–19 which restricted access to physical worksites. In 2021–22, institutions increased their capacity to respond to requests largely due to the lessening of public health restrictions and closed 66,696 personal information requests.
Having a substantial number of outstanding personal information requests at the beginning of a fiscal year places institutions in a challenging situation even before new personal information requests are received. For example, in 2021–22, institutions started the reporting period with 35,135 personal information requests outstanding from the previous reporting periods – more than half as many requests than they would ultimately receive in 2021–22 – and carried over 36,535 personal information requests to 2022–23.
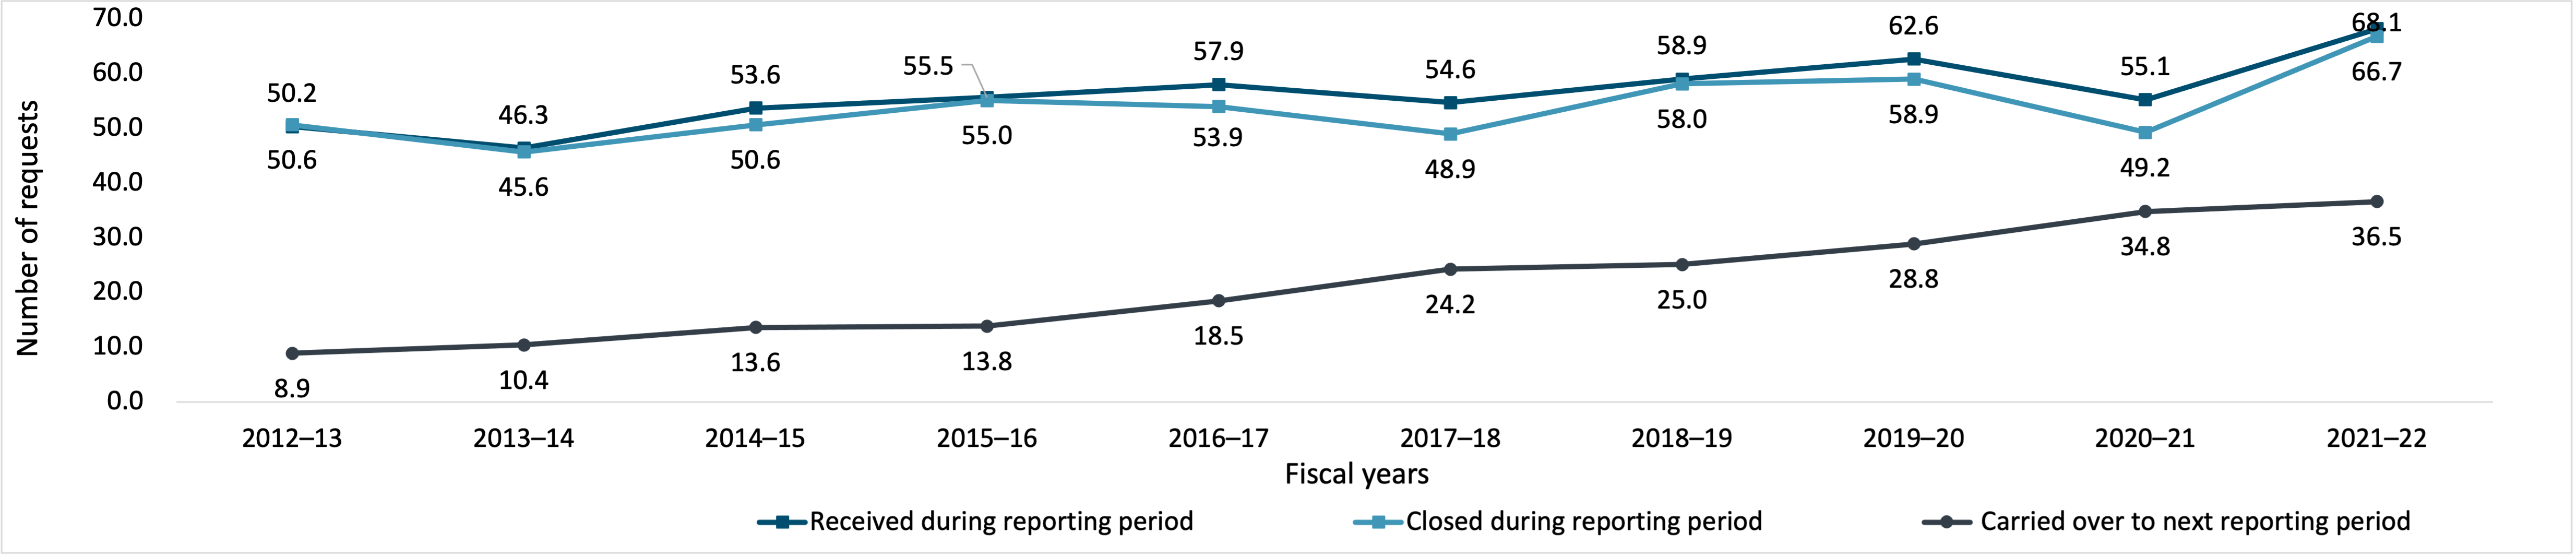
Figure 19 - Text version
| 2012–13 | 2013–14 | 2014–15 | 2015–16 | 2016–17 | 2017–18 | 2018–19 | 2019–20 | 2020–21 | 2021–22 | |
|---|---|---|---|---|---|---|---|---|---|---|
| Received during reporting period | 50,241 | 46,302 | 53,608 | 55,541 | 57,885 | 54,599 | 58,911 | 62,578 | 55,137 | 68,096 |
| Closed during reporting period | 50,573 | 45,614 | 50,554 | 55,002 | 53,905 | 48,876 | 58,028 | 58,881 | 49,178 | 66,696 |
| Carried over to next reporting period | 8,870 | 10,399 | 13,567 | 13,830 | 18,456 | 24,192 | 25,046 | 28,826 | 34,751 | 36,535 |
Figure 20 breaks down the number of personal information requests carried over to 2022–23 (36,535 requests) by fiscal year of receipt, and by whether the personal information request is within legislated timelines or beyond legislated timelines as of March 31, 2022. Note that the numbers in Figure 20 are not cumulative from one fiscal year to the next, and that personal information requests carried over to 2022–23 are referred to as open personal information requests in this figure.
Figure 20 indicates that 87.5% of open personal information requests were beyond legislated timelines as of March 31, 2022.
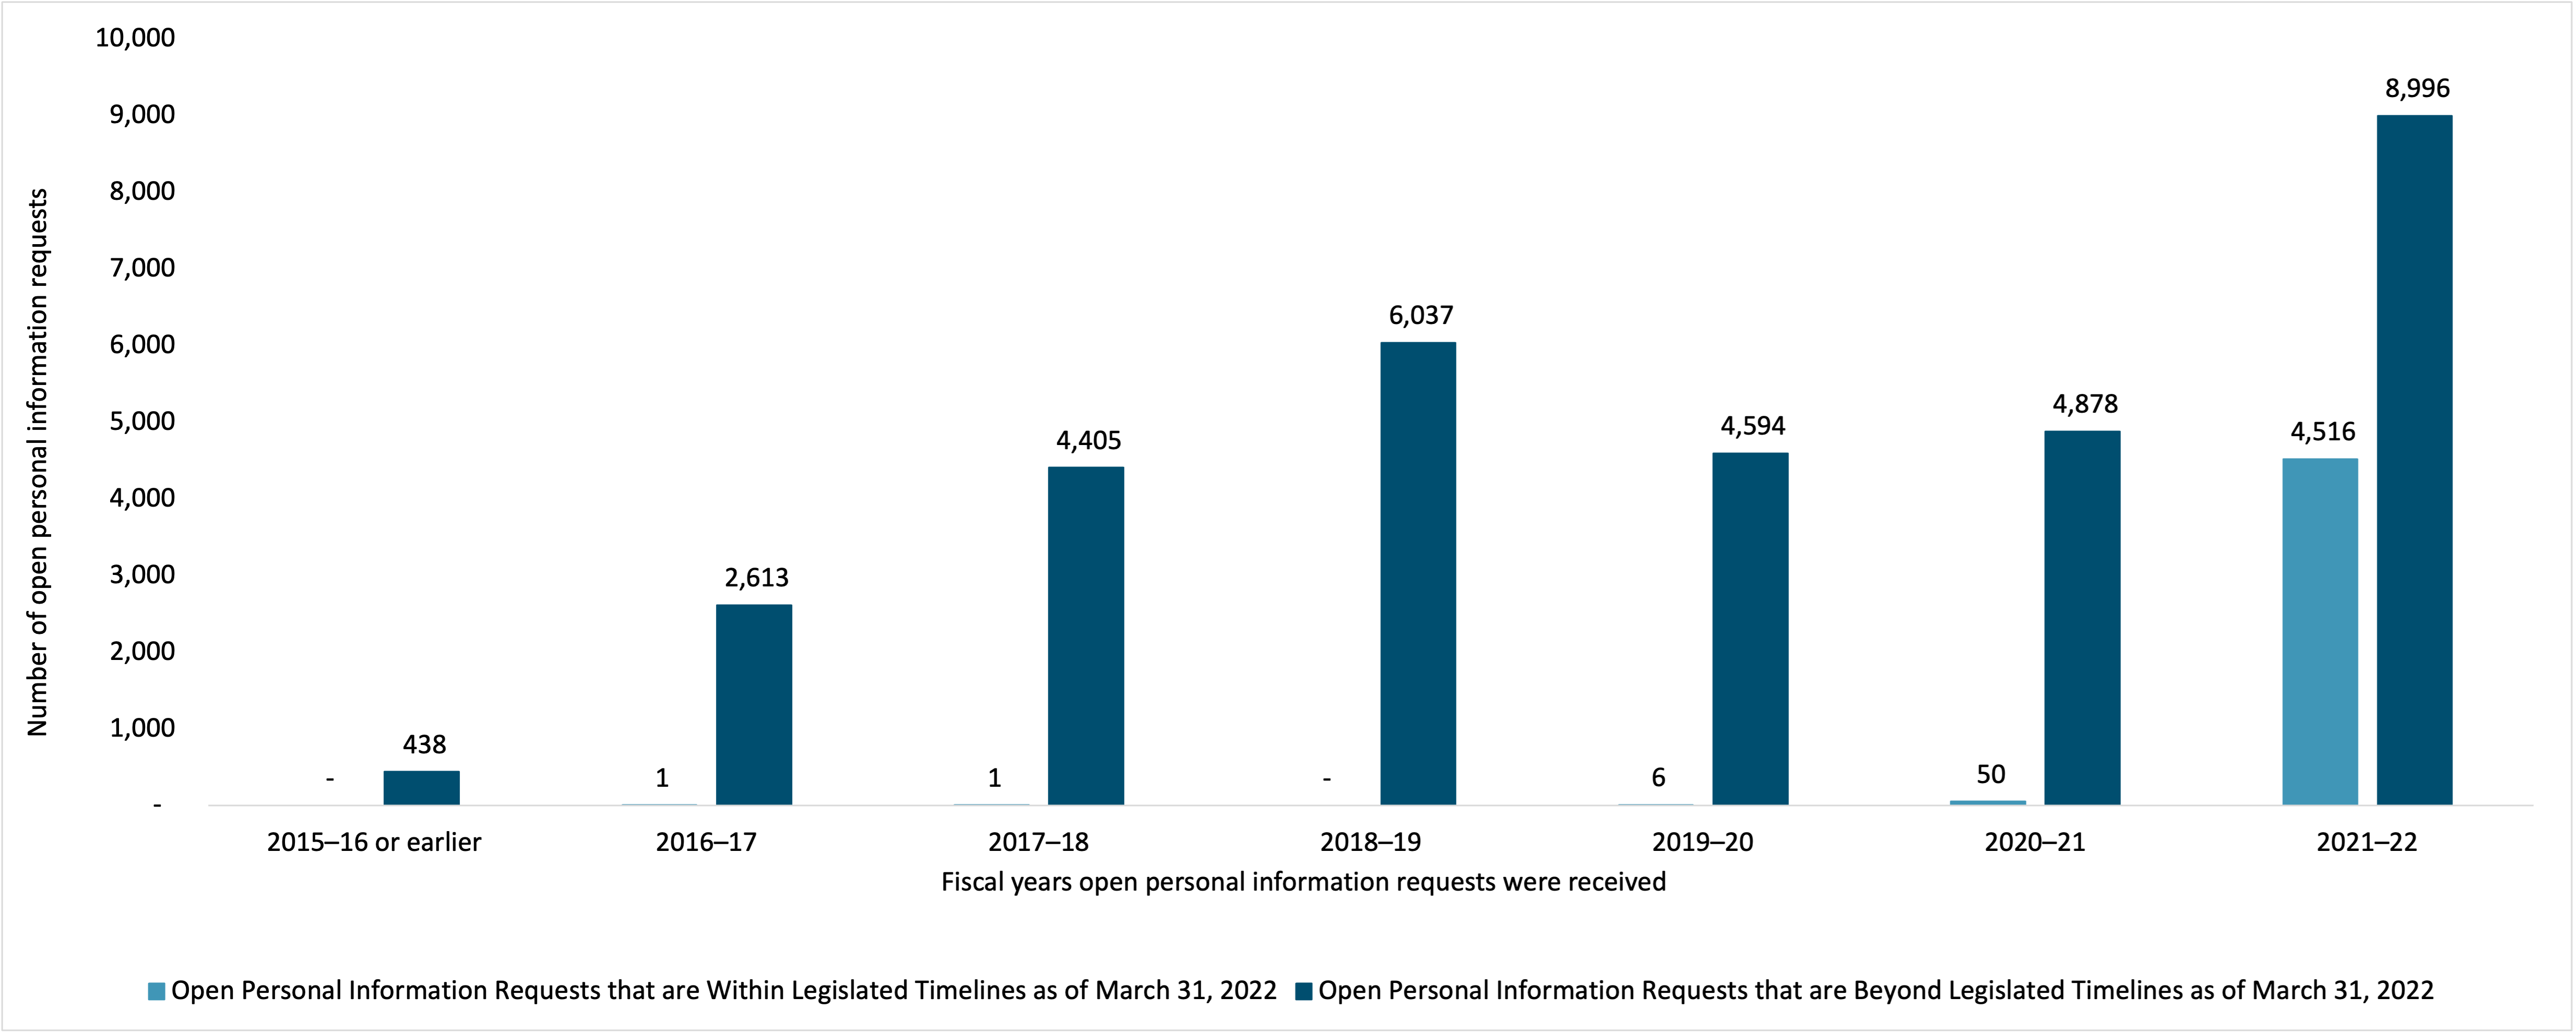
Figure 20 - Text version
| 2015–16 or earlier | 2016–17 | 2017–18 | 2018–19 | 2019–20 | 2020–21 | 2021–22 | |
|---|---|---|---|---|---|---|---|
| Open Personal Information Requests that are Within Legislated Timelines as of March 31, 2022 | - | 1 | 1 | - | 6 | 50 | 4,516 |
| Open Personal Information Requests that are Beyond Legislated Timelines as of March 31, 2022 | 438 | 2,613 | 4,405 | 6,037 | 4,594 | 4,878 | 8,996 |
Timeliness
The Privacy Act establishes a 30-day limit for responses to personal information requests. While the Privacy Act permits extensions for limited and specific reasons to the 30-day limit for responses to personal information requests, the intent of the Act is to provide timely access. The growing length of time to close requests undermines this intent.
Of the 66,696 personal information requests closed in 2021–22, 70% were closed within legislated timelines, including extensions. Over the last decade, this percentage gradually increased to 85.2% in 2019–20, but then declined to 62.9% in 2020–21.
Open personal information requests beyond legislated timelines mean that requesters are being denied timely access as defined under the Privacy Act. Furthermore, performance of the request-based system, as measured by requests closed within legislated timelines, will be hindered until existing open personal information requests are closed, even if all new personal information requests are closed within legislated timelines.

Figure 21 - Text version
| 2012–13 | 2013–14 | 2014–15 | 2015–16 | 2016–17 | 2017–18 | 2018–19 | 2019–20 | 2020–21 | 2021–22 | |
|---|---|---|---|---|---|---|---|---|---|---|
| Closed within legislated timeline, including extensions | 70.7% | 75.8% | 81.2% | 78.9% | 81.9% | 78.4% | 80.7% | 85.2% | 62.9% | 70.0% |
| Closed beyond legislated timeline, including extensions | 29.3% | 24.2% | 18.8% | 21.1% | 18.1% | 21.6% | 19.3% | 14.8% | 37.1% | 30.0% |
Institutions are expected to respond to 85% of personal information requests within legislated timelines, including extensions. This 85% performance standard (as opposed to 100%) is intended to allow some flexibility for institutions and reflects that personal information requests’ volumes can vary widely year over year.
Figure 22 indicates that over the last decade, the percentage of institutions meeting this standard fluctuated from 70% to 82%. 2020–21 marked the biggest drop to 54.1% because of public health restrictions due to COVID-19, with significant recovery to 70.8% in 2021–22.
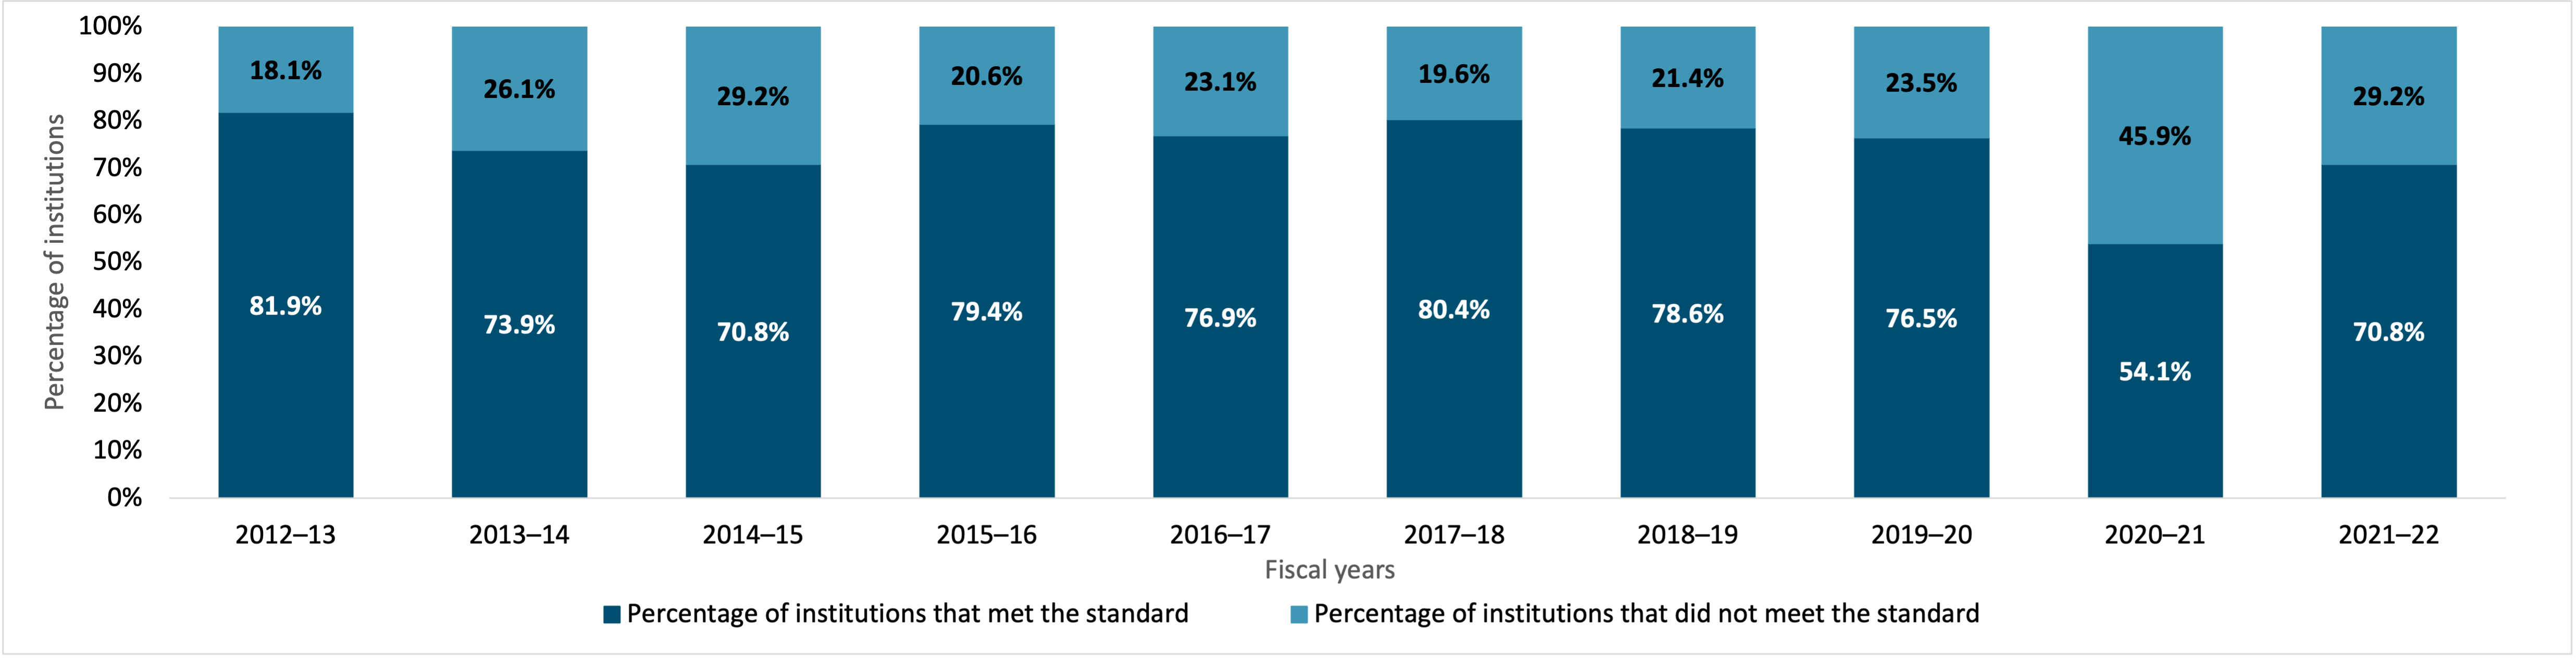
Figure 22 - Text version
| 2012–13 | 2013–14 | 2014–15 | 2015–16 | 2016–17 | 2017–18 | 2018–19 | 2019–20 | 2020–21 | 2021–22 | |
|---|---|---|---|---|---|---|---|---|---|---|
| Percentage of institutions that met the standard | 81.9% | 73.9% | 70.8% | 79.4% | 76.9% | 80.4% | 78.6% | 76.5% | 54.1% | 70.8% |
| Percentage of institutions that did not meet the standard | 18.1% | 26.1% | 29.2% | 20.6% | 23.1% | 19.6% | 21.4% | 23.5% | 45.9% | 29.2% |
Figure 23 indicates that for most of the last 10 years institutions generally closed between 65% and 74% of personal information requests within the first 30 days. As with most of the performance statistics in this report, this dropped in 2020 with the onset of the COVID epidemic but remained better than it had been in 2012–13 and shows signs of recovering last year.
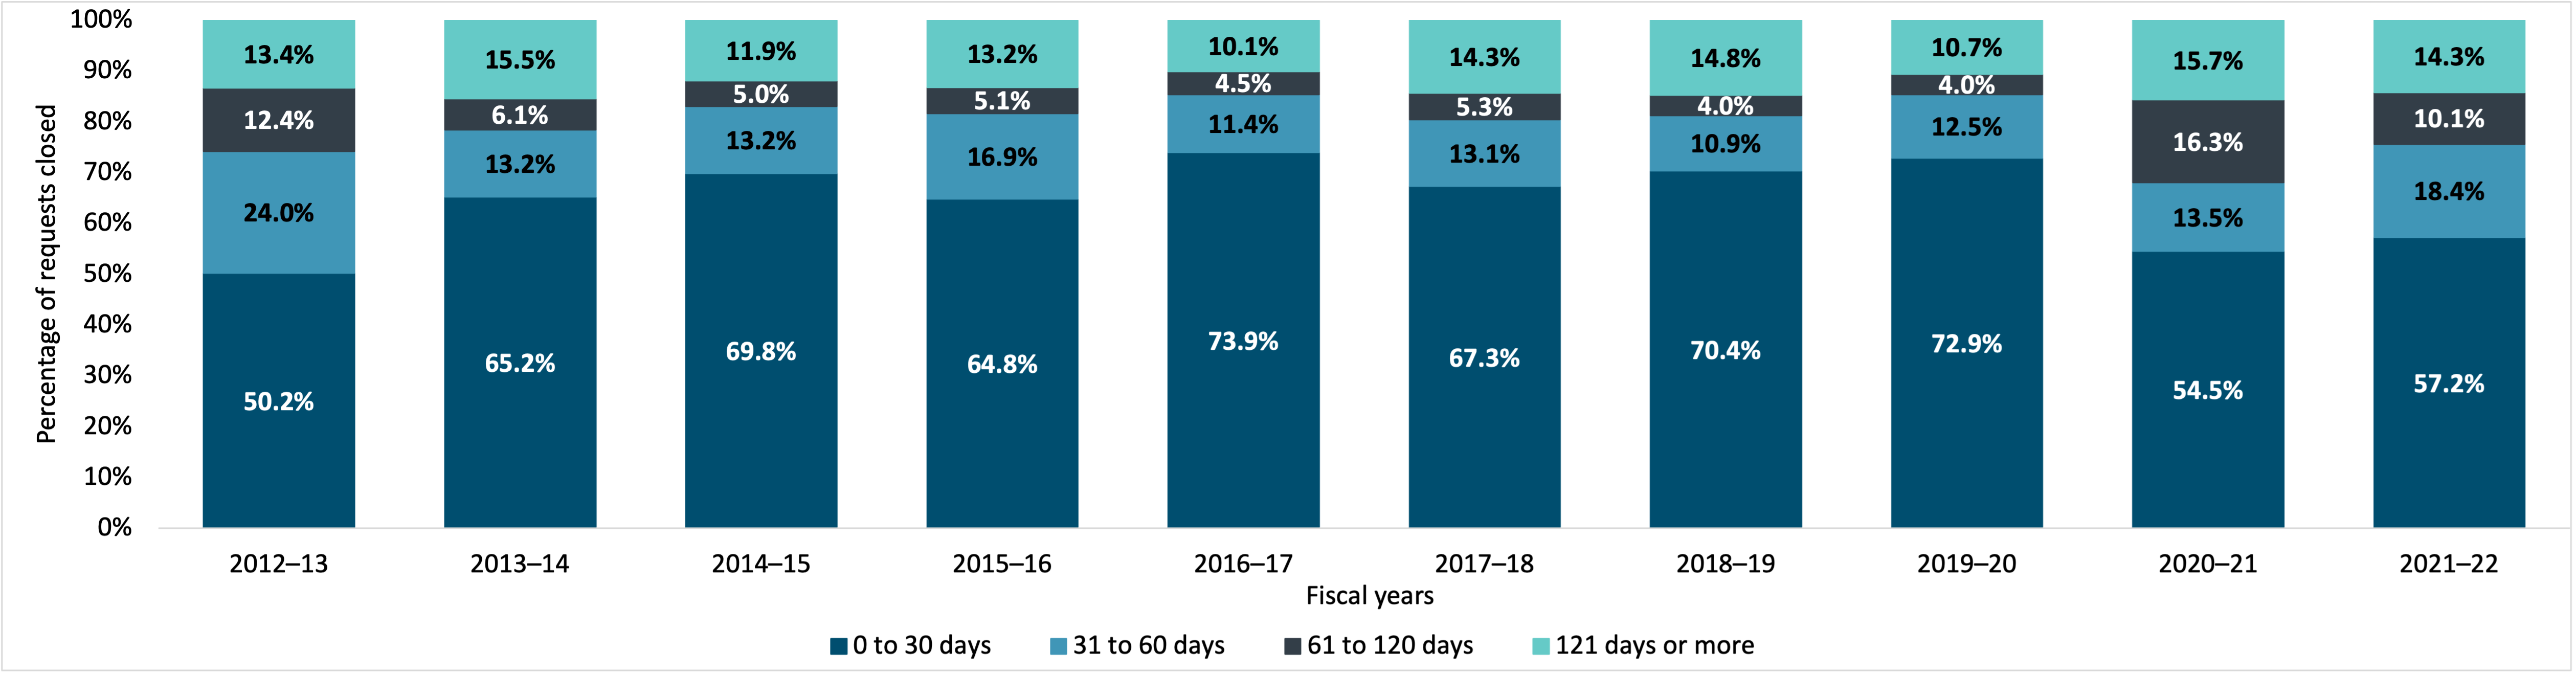
Figure 23 - Text version
| 2012–13 | 2013–14 | 2014–15 | 2015–16 | 2016–17 | 2017–18 | 2018–19 | 2019–20 | 2020–21 | 2021–22 | |
|---|---|---|---|---|---|---|---|---|---|---|
| 0 to 30 days | 50.2% | 65.2% | 69.8% | 64.8% | 73.9% | 67.3% | 70.4% | 72.9% | 54.5% | 57.2% |
| 31 to 60 days | 24.0% | 13.2% | 13.2% | 16.9% | 11.4% | 13.1% | 10.9% | 12.5% | 13.5% | 18.4% |
| 61 to 120 days | 12.4% | 6.1% | 5.0% | 5.1% | 4.5% | 5.3% | 4.0% | 4.0% | 16.3% | 10.1% |
| 121 days or more | 13.4% | 15.5% | 11.9% | 13.2% | 10.1% | 14.3% | 14.8% | 10.7% | 15.7% | 14.3% |
In terms of extensions taken on personal information requests closed in 2021–22, 98.7% of all extensions taken for closed requests cited paragraph 15(a)(i) of the Privacy Act as a reason for the extension, relating to interference with government operations.
| Length of extensiontable 2 note a | 15(a)(i): interference with operations | 15(a)(ii): consultation | 15(b): translation purposes or conversion | Total | |||||
|---|---|---|---|---|---|---|---|---|---|
| Further review required to determine exemptions | Large volume of pages | Large volume of requests | Documents are difficult to obtain | Cabinet confidence (section 70)table 2 note b | External | Internal | |||
| 1 to 15 days | 5 | 0 | 9 | 1 | 0 | 1 | 4 | 0 | 20 |
| 16 to 30 days | 123 | 539 | 14,408 | 182 | 1 | 121 | 65 | 3 | 15,442 |
| 31 days or greater | N/A | N/A | N/A | N/A | N/A | N/A | N/A | 0 | 0 |
| Total | 128 | 539 | 14,417 | 183 | 1 | 122 | 69 | 3 | 15,462 |
Table 2 Notes
|
|||||||||
Figure 24 indicates that over the last decade, institutions almost always cited “Workload” as the main reason for personal information requests failing to be closed within legislated timelines, including extensions. However, use of this rationale decreased sharply in 2020–21, when “Other” was cited in almost 64% of cases. Prior to 2020–21, as Figure 24 also indicates, institutions cited “Other” as the reason only 5% to 15% of the time.
In addition, Figure 24 also indicates that over the last decade, the overall annual volume of personal information requests closed beyond legislated timelines, including extensions, was generally steady or slightly declining year to year until 2019–20, but has sharply increased since then.
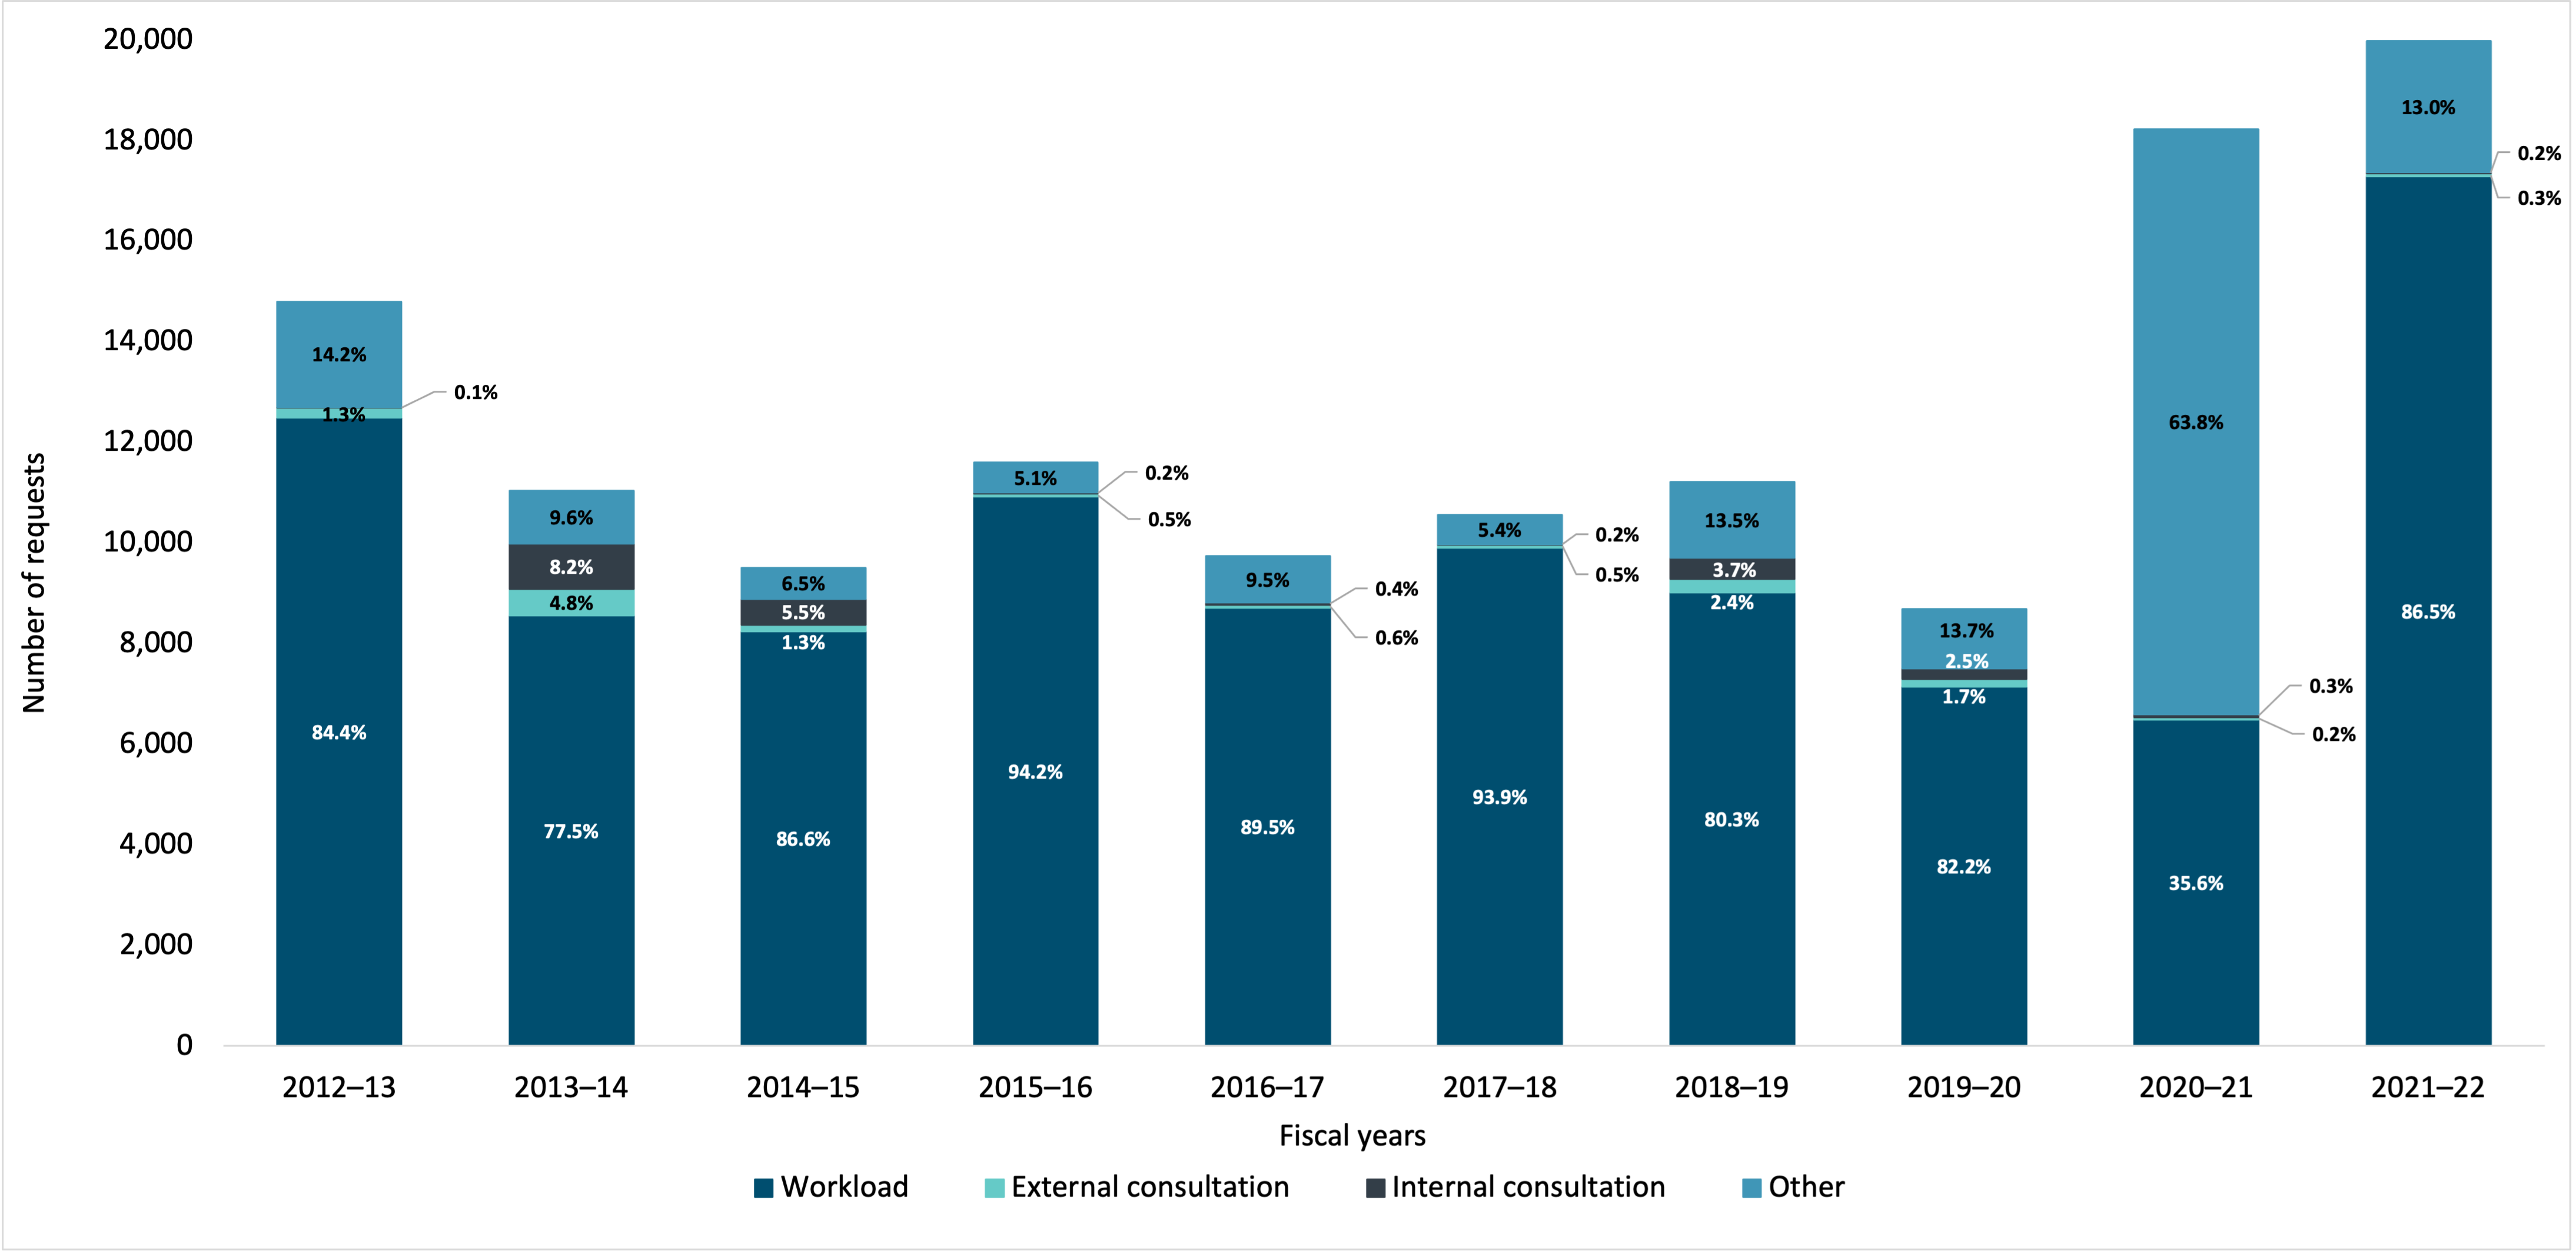
Figure 24 - Text version
| 2012–13 | 2013–14 | 2014–15 | 2015–16 | 2016–17 | 2017–18 | 2018–19 | 2019–20 | 2020–21 | 2021–22 | |
|---|---|---|---|---|---|---|---|---|---|---|
| Workload | 12,490 | 8,553 | 8,242 | 10,923 | 8,715 | 9,909 | 9,014 | 7,144 | 6,490 | 17,291 |
| External consultation | 195 | 528 | 128 | 55 | 56 | 50 | 272 | 145 | 43 | 55 |
| Internal consultation | 17 | 905 | 521 | 26 | 39 | 20 | 416 | 215 | 63 | 31 |
| Other | 2,100 | 1,057 | 621 | 594 | 930 | 575 | 1,518 | 1,188 | 11,627 | 2,603 |
Disposition
Records were either entirely disclosed, or disclosed in part, for 73.3% of closed personal information requests in 2021-22. Figure 25 indicates that the disposition of personal information requests closed has remained relatively stable over the last decade.
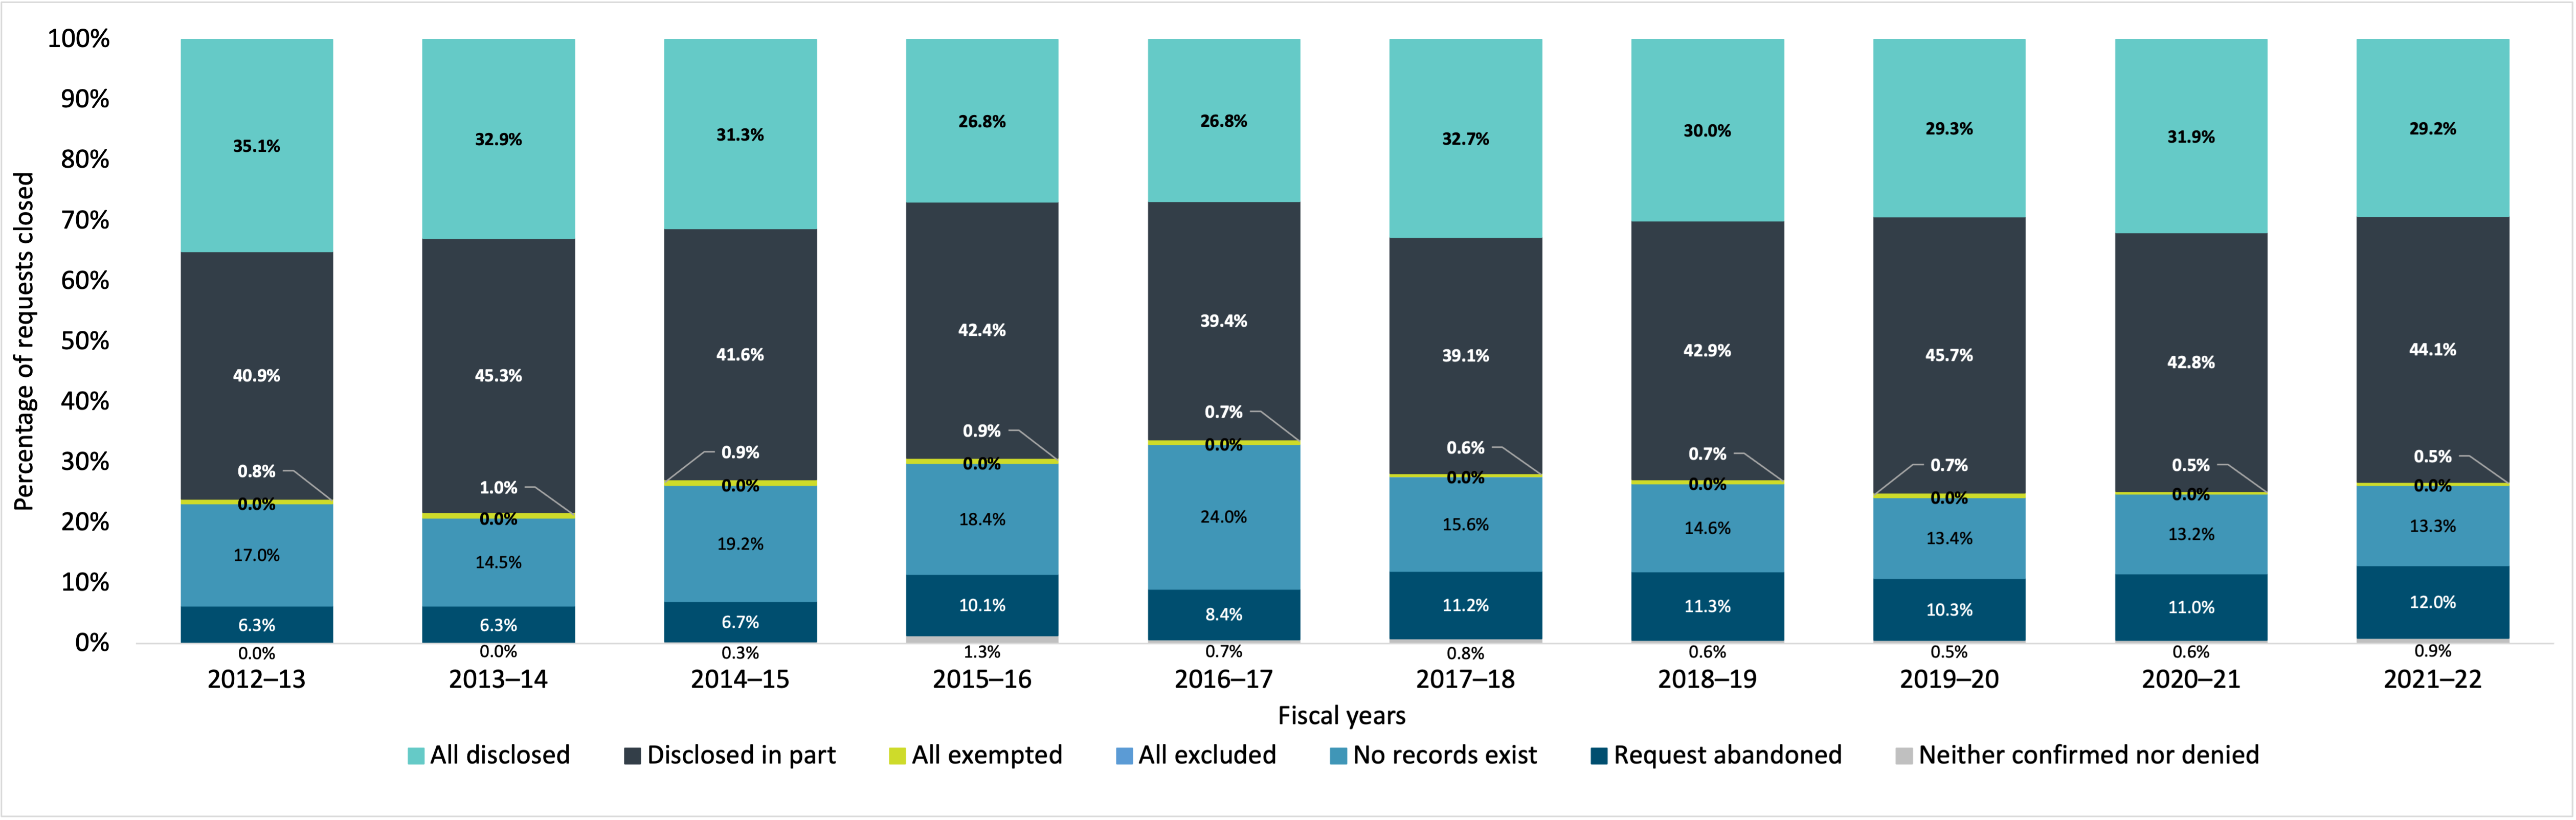
Figure 25 - Text version
| 2012–13 | 2013–14 | 2014–15 | 2015–16 | 2016–17 | 2017–18 | 2018–19 | 2019–20 | 2020–21 | 2021–22 | |
|---|---|---|---|---|---|---|---|---|---|---|
| All disclosed | 35.1% | 32.9% | 31.3% | 26.8% | 26.8% | 32.7% | 30.0% | 29.3% | 31.9% | 29.2% |
| Disclosed in part | 40.9% | 45.3% | 41.6% | 42.4% | 39.4% | 39.1% | 42.9% | 45.7% | 42.8% | 44.1% |
| All exempted | 0.8% | 1.0% | 0.9% | 0.9% | 0.7% | 0.6% | 0.7% | 0.7% | 0.5% | 0.5% |
| All excluded | 0.0% | 0.0% | 0.0% | 0.0% | 0.0% | 0.0% | 0.0% | 0.0% | 0.0% | 0.0% |
| No records exist | 17.0% | 14.5% | 19.2% | 18.4% | 24.0% | 15.6% | 14.6% | 13.4% | 13.2% | 13.3% |
| Request abandoned | 6.3% | 6.3% | 6.7% | 10.1% | 8.4% | 11.2% | 11.3% | 10.3% | 11.0% | 12.0% |
| Neither confirmed nor denied | 0.0% | 0.0% | 0.3% | 1.3% | 0.7% | 0.8% | 0.6% | 0.5% | 0.6% | 0.9% |
Complexity
While it is difficult to objectively measure the complexity of personal information requests, one aspect that is measurable is the number of pages to be processed. Figure 26 shows that the number of pages processed has been trending upward over the last decade. While there was a significant drop in 2020–21, the upward trend resumed in 2021–22.
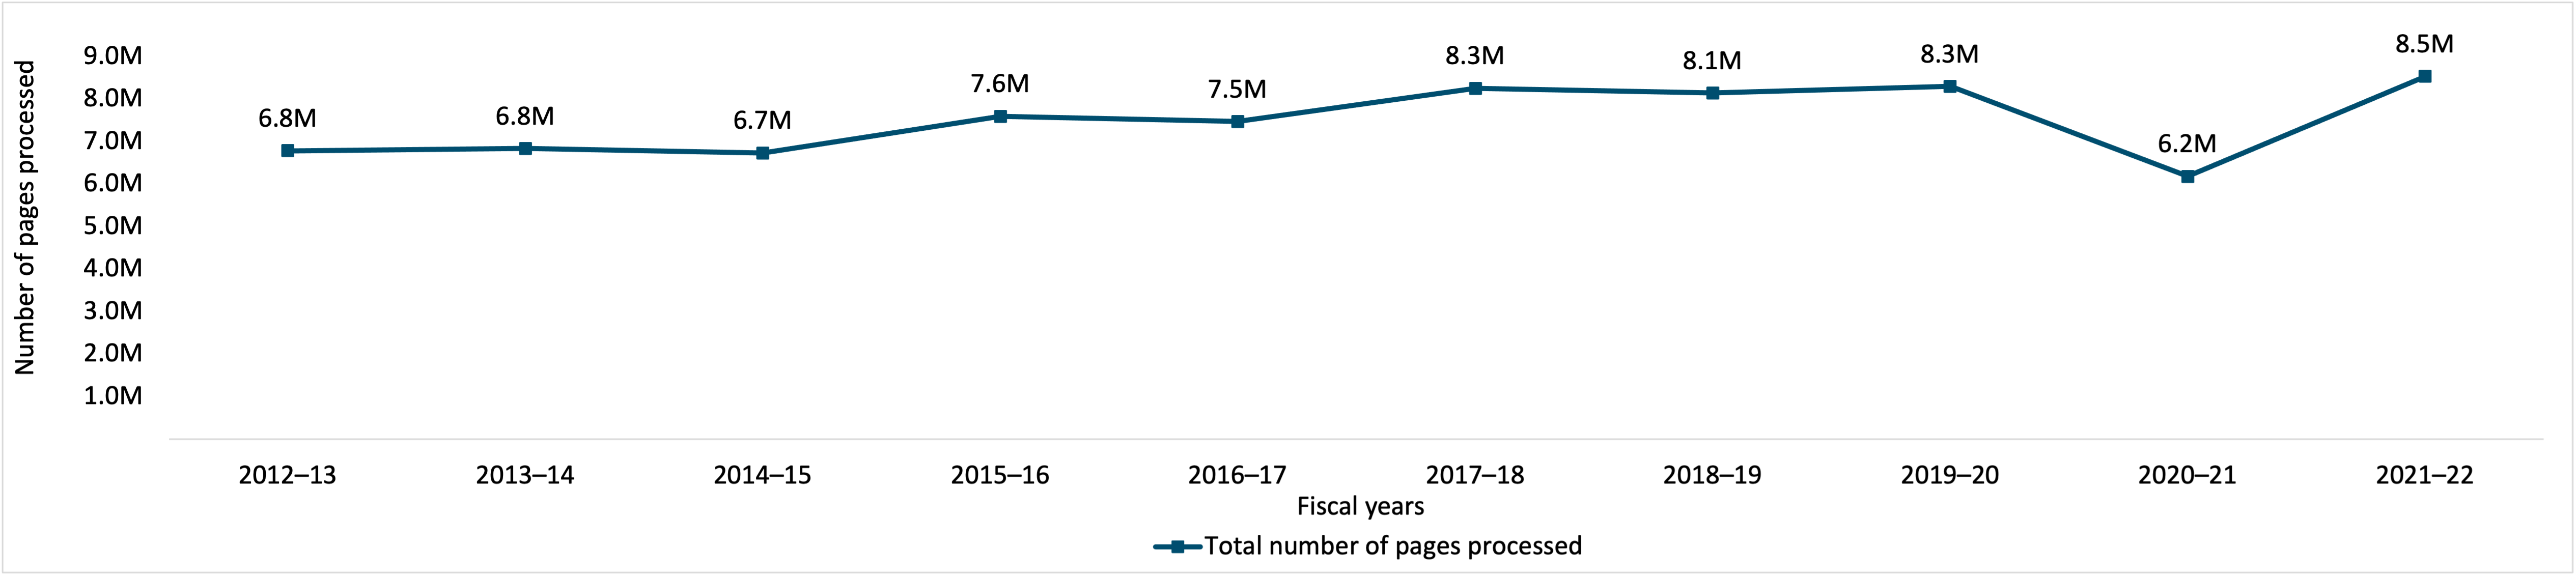
Figure 26 - Text version
| 2012–13 | 2013–14 | 2014–15 | 2015–16 | 2016–17 | 2017–18 | 2018–19 | 2019–20 | 2020–21 | 2021–22 | |
|---|---|---|---|---|---|---|---|---|---|---|
| Total number of pages processed | 6,785,283 | 6,835,955 | 6,733,140 | 7,594,670 | 7,468,952 | 8,250,595 | 8,141,008 | 8,297,697 | 6,178,716 | 8,532,891 |
Another aspect of complexity that can be measured is the number of requests that require consultation, where legal advice is sought, or when personal information is interwoven throughout the records. Figure 27 shows that over the last decade, the overall annual volume of complex personal information requests closed gradually decreased but increased sharply in 2021–22. Figure 27 indicates that for the first three years of the decade, the percentage of closed personal information requests considered complex due to “Interwoven information” increased early in the last decade, then remained in the 60% to 80% range for seven years until 2021–22, when it dropped to 39%. Use of the “Other” category was very high in the first two years of the decade but declined significantly and continued to diminish until 2020–21 when it jumped again.

Figure 27 - Text version
| 2012–13 | 2013–14 | 2014–15 | 2015–16 | 2016–17 | 2017–18 | 2018–19 | 2019–20 | 2020–21 | 2021–22 | |
|---|---|---|---|---|---|---|---|---|---|---|
| Consultation required | 872 | 869 | 669 | 906 | 746 | 846 | 695 | 568 | 329 | 431 |
| Legal advice sought | 61 | 47 | 77 | 71 | 61 | 32 | 59 | 41 | 41 | 33 |
| Interwoven information | 1,507 | 3,518 | 6,491 | 4,882 | 4,634 | 4,274 | 3,620 | 3,790 | 2,314 | 2,696 |
| Other | 6,816 | 7,242 | 1,074 | 1,327 | 1,050 | 822 | 457 | 427 | 1,037 | 3,632 |
Consultations between federal institutions
The number of closed personal information requests for consultation between institutions was 214 and the number of pages reviewed in connection to those requests was 13,536.
Figure 28 indicates that over the last decade, the number of requests for consultation has decreased. A similar trend is evident in the number of closed personal information requests for consultation.
Reducing the number of consultation requests decreases the complexity of request processing.
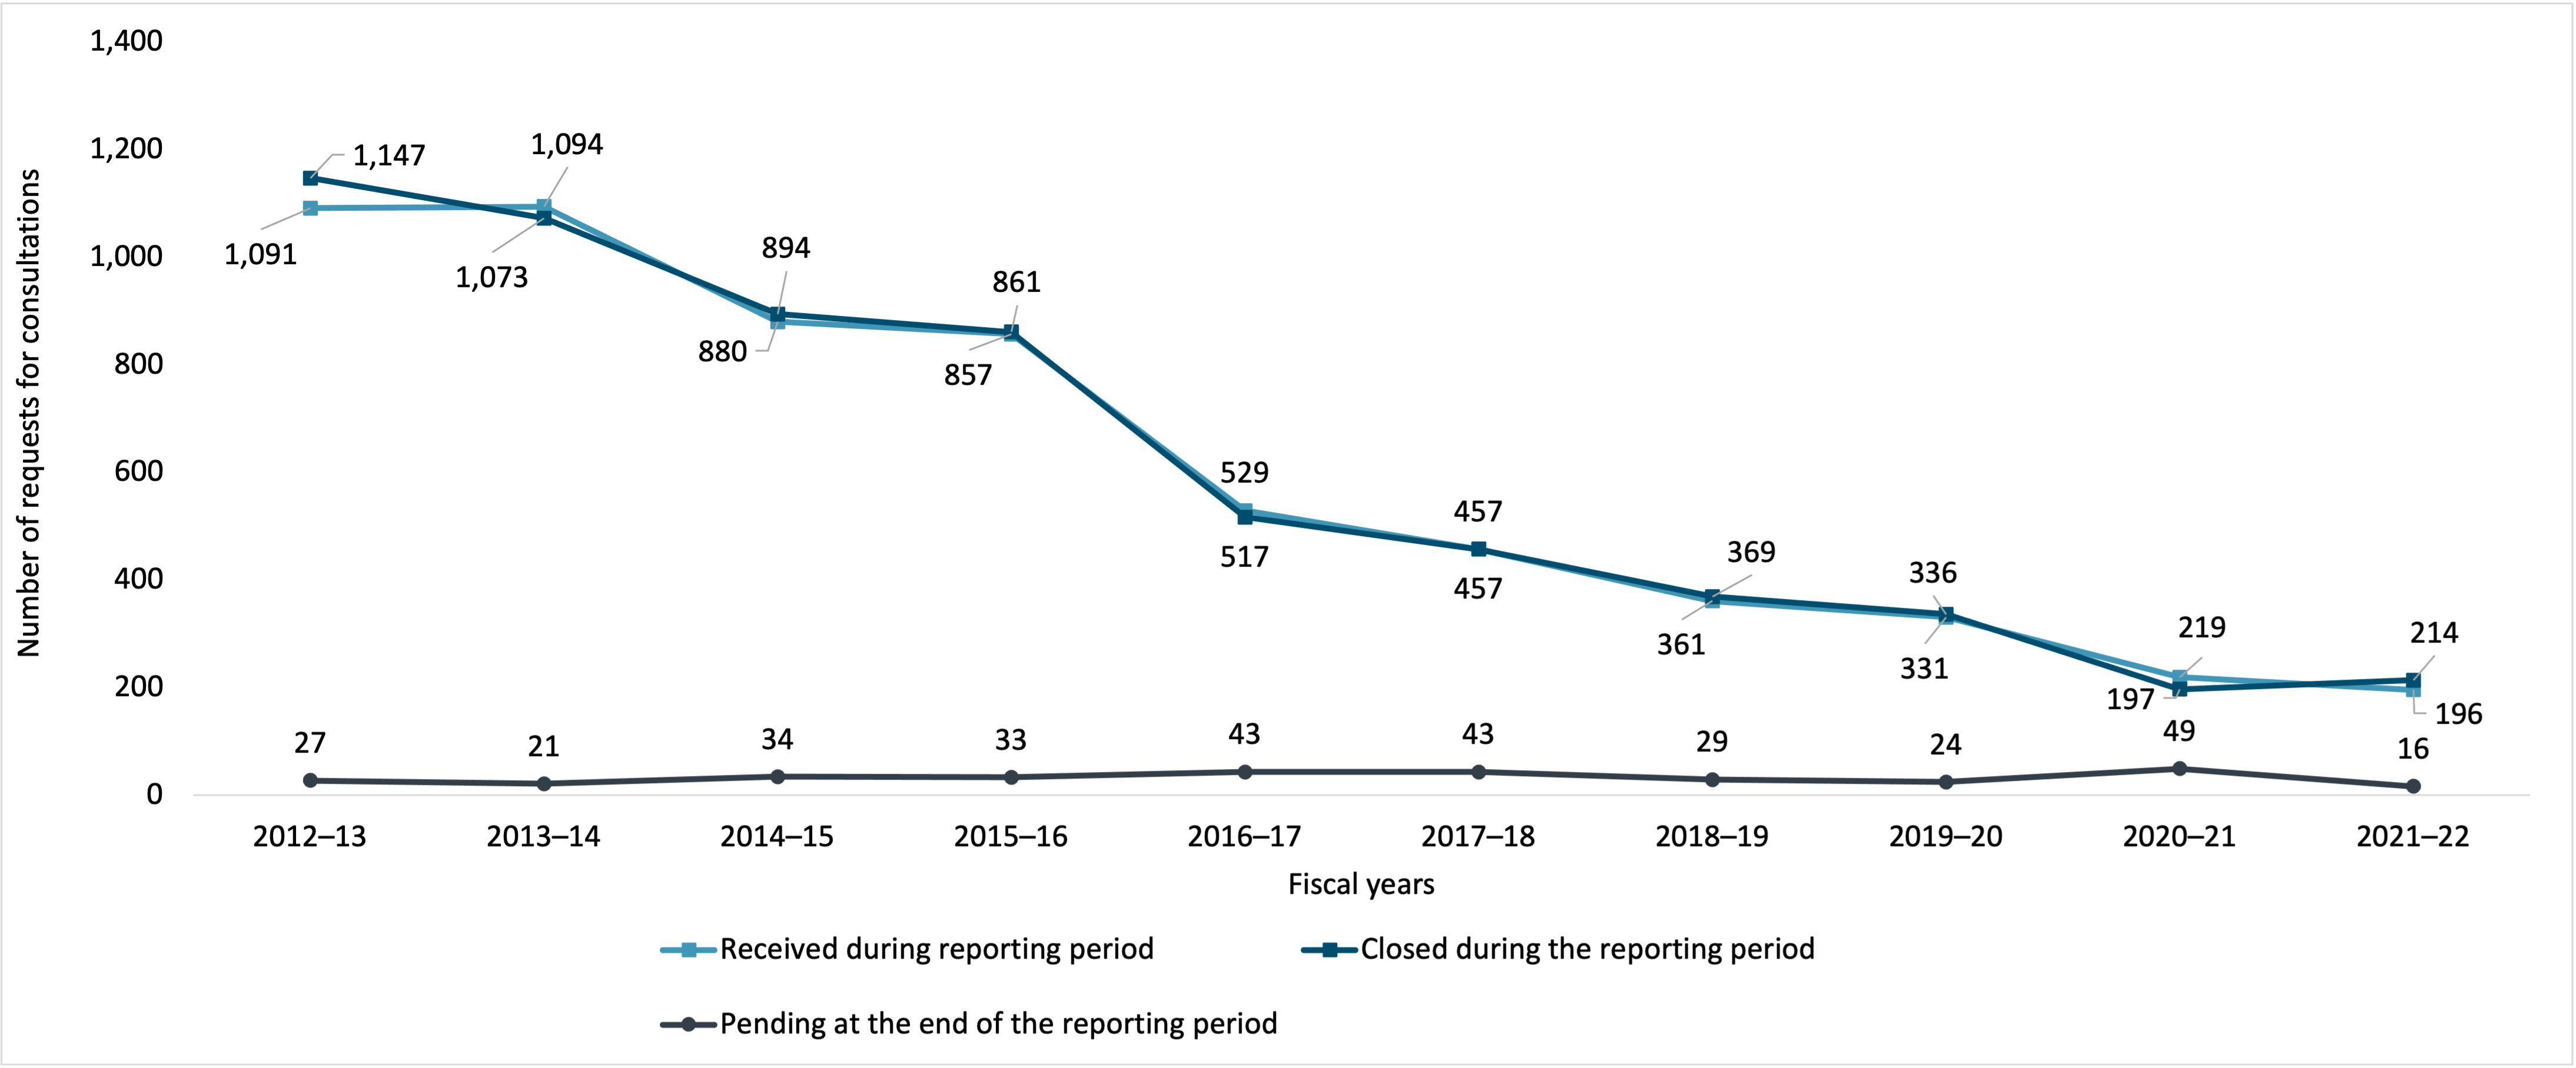
Figure 28 - Text version
| 2012–13 | 2013–14 | 2014–15 | 2015–16 | 2016–17 | 2017–18 | 2018–19 | 2019–20 | 2020–21 | 2021–22 | |
|---|---|---|---|---|---|---|---|---|---|---|
| Received during reporting period | 1,091 | 1,094 | 880 | 857 | 529 | 457 | 361 | 331 | 219 | 196 |
| Closed during the reporting period | 1,147 | 1,073 | 894 | 861 | 517 | 457 | 369 | 336 | 197 | 214 |
| Pending at the end of the reporting period | 27 | 21 | 34 | 33 | 43 | 43 | 29 | 24 | 49 | 16 |
Figure 29 indicates that, while the overall number of consultations are decreasing, the percentage of consultations closed within 30 days has also decreased year to year.
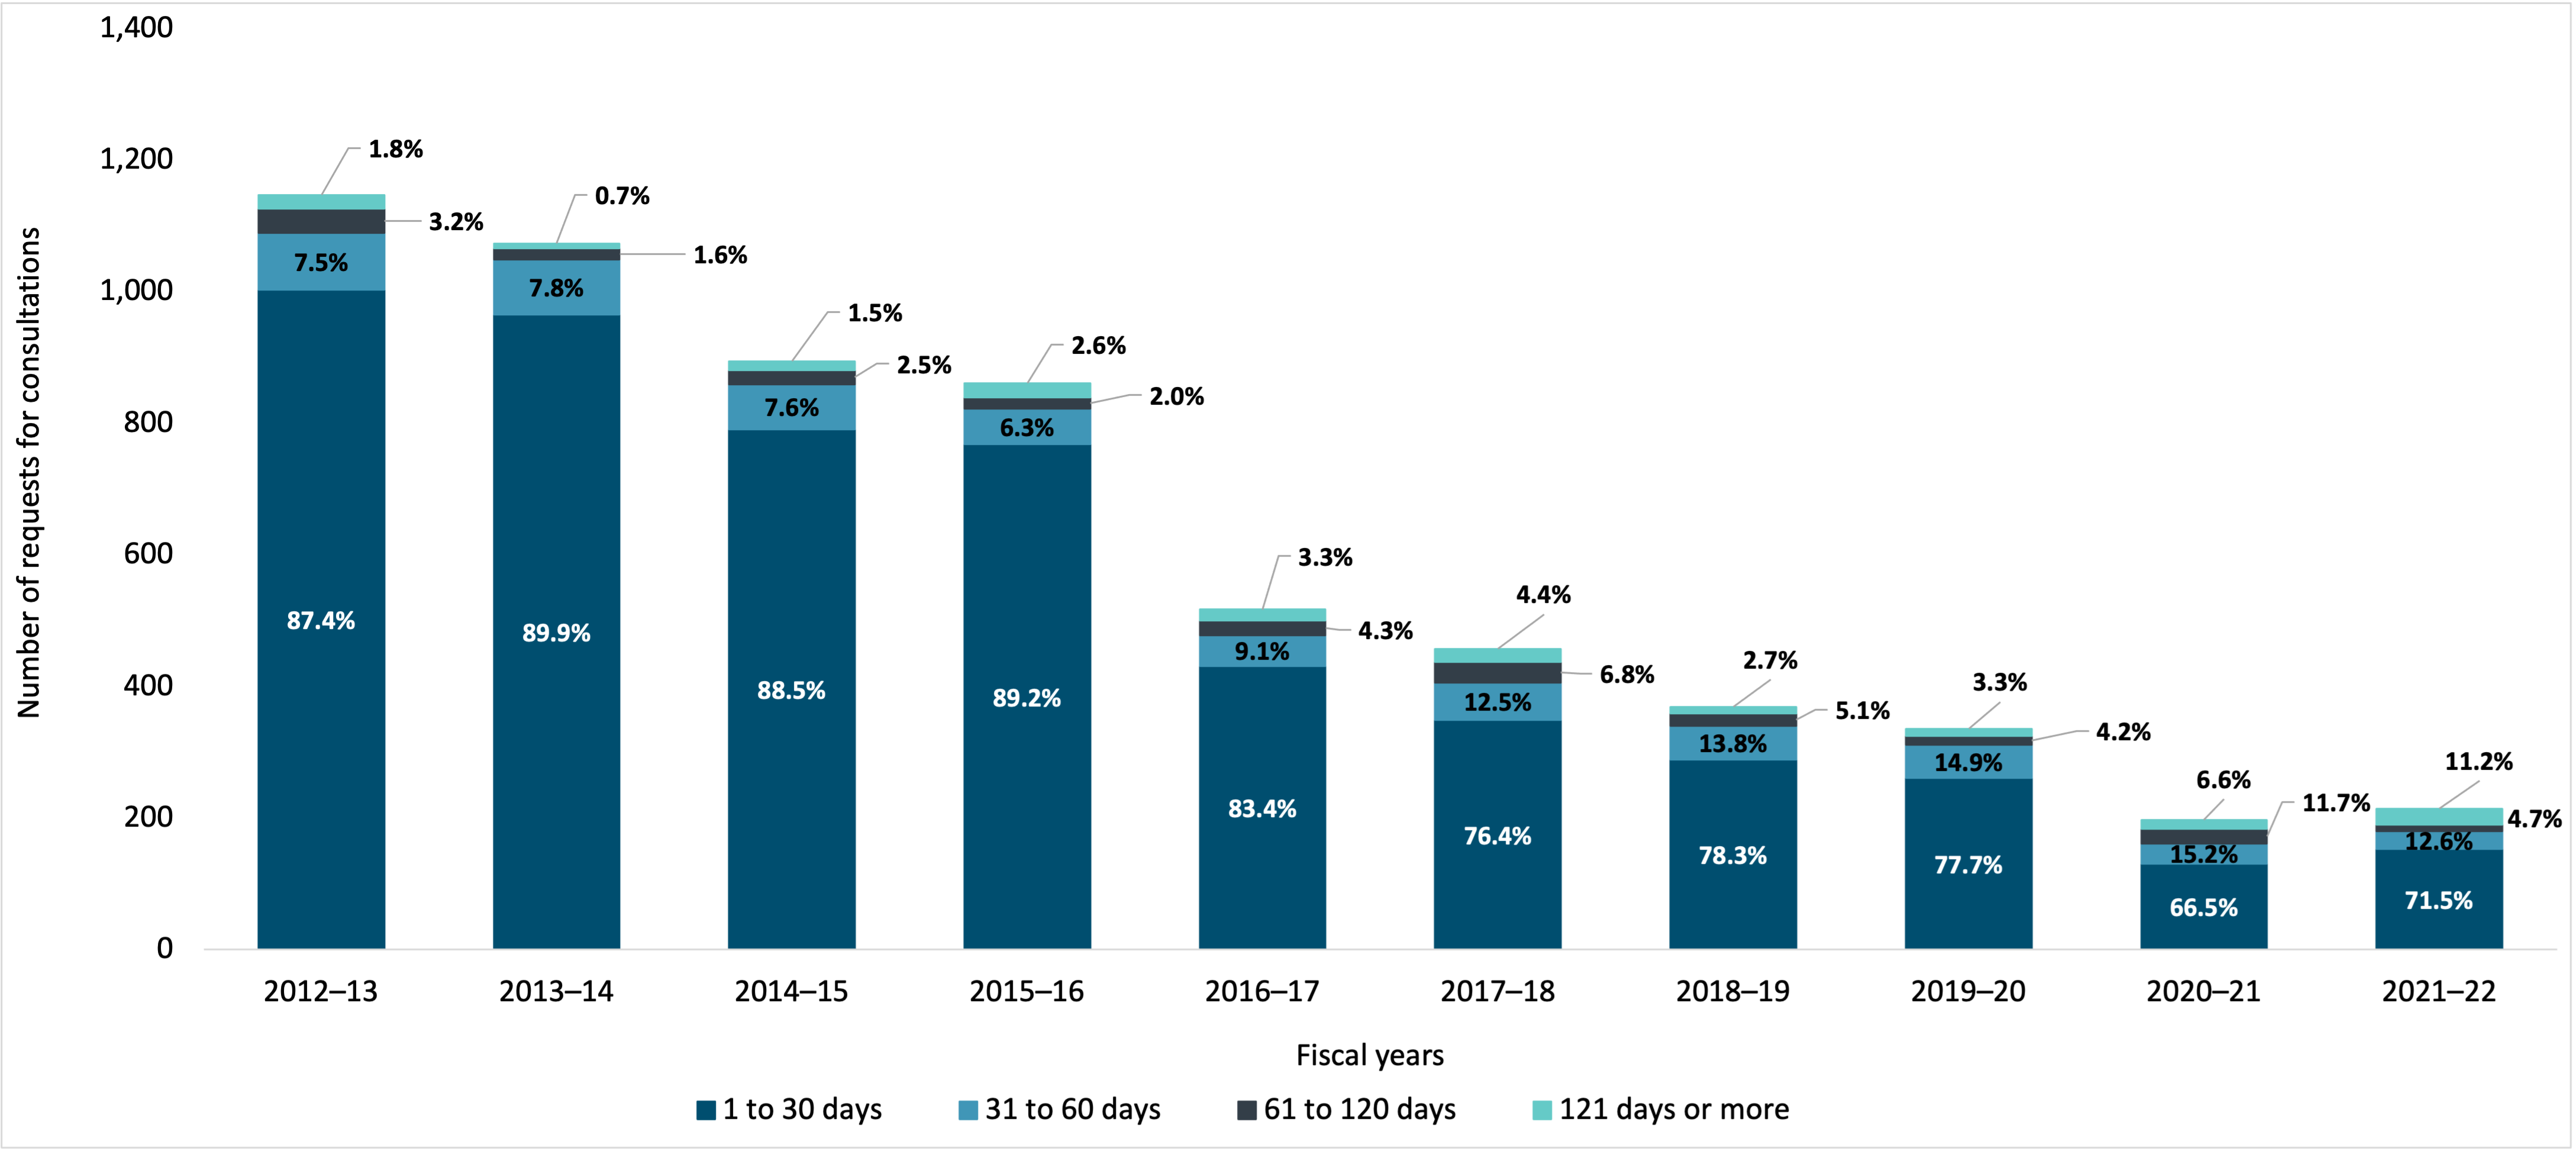
Figure 29 - Text version
| 2012–13 | 2013–14 | 2014–15 | 2015–16 | 2016–17 | 2017–18 | 2018–19 | 2019–20 | 2020–21 | 2021–22 | |
|---|---|---|---|---|---|---|---|---|---|---|
| 1 to 30 days | 1,003 | 965 | 791 | 768 | 431 | 349 | 289 | 261 | 131 | 153 |
| 31 to 60 days | 86 | 84 | 68 | 54 | 47 | 57 | 51 | 50 | 30 | 27 |
| 61 to 120 days | 37 | 17 | 22 | 17 | 22 | 31 | 19 | 14 | 23 | 10 |
| 121 days or more | 21 | 7 | 13 | 22 | 17 | 20 | 10 | 11 | 13 | 24 |
Exemptions
Figure 30 presents the exemptions most invoked by institutions. Note that an analyst can invoke more than one provision for a single request and therefore the same request may be represented more than once throughout the table. For example, if an analyst invoked three different provisions in relation to one request and they would count the request under each of the three exemptions.
Since 2013–14, by far the most frequently invoked exemption for personal information requests was section 26, which relates to the protection of personal information about another individual.
The other four most frequently invoked exemption are those relating to enforcement of any law, information obtained in confidence of a foreign state, information that could harm the conduct of international affairs and defense, as well as information obtained by law enforcement in the conduct of an investigation.
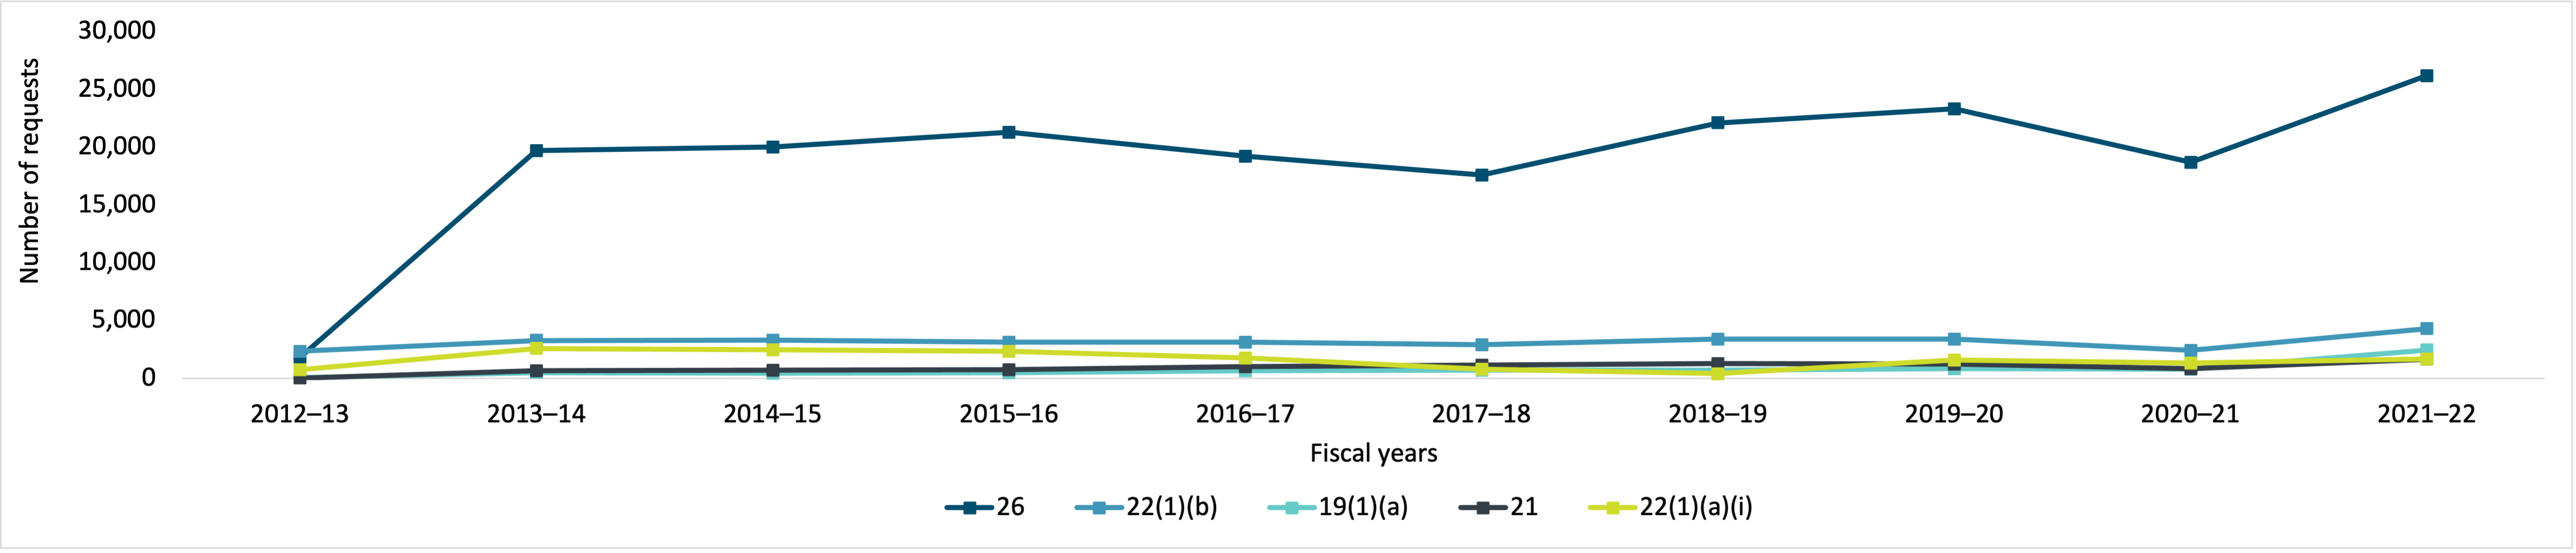
Figure 30 - Text version
| 2012–13 | 2013–14 | 2014–15 | 2015–16 | 2016–17 | 2017–18 | 2018–19 | 2019–20 | 2020–21 | 2021–22 | |
|---|---|---|---|---|---|---|---|---|---|---|
| 26 | 1,822 | 19,688 | 19,996 | 21,277 | 19,222 | 17,560 | 22,098 | 23,290 | 18,692 | 26,190 |
| 22(1)(b) | 2,329 | 3,271 | 3,307 | 3,121 | 3,112 | 2,885 | 3,371 | 3,386 | 2,415 | 4,298 |
| 19(1)(a) | 54 | 489 | 443 | 458 | 641 | 690 | 680 | 818 | 768 | 2,431 |
| 21 | 5 | 663 | 682 | 742 | 987 | 1,147 | 1,271 | 1,215 | 827 | 1,645 |
| 22(1)(a)(i) | 740 | 2,566 | 2,442 | 2,320 | 1,761 | 772 | 382 | 1,569 | 1,316 | 1,642 |
| Exemption | Description |
|---|---|
| 26 | May refuse to disclose any personal information about another individual. |
| 22(1)(b) | May refuse to disclose any personal information the disclosure of which could be injurious to the enforcement of any law of Canada. |
| 19(1)(a) | Shall refuse to disclose any personal information obtained in confidence from the government of a foreign state. |
| 21 | May refuse to disclose any personal information the disclosure of which could be injurious to the conduct of international affairs and defence. |
| 22(1)(a)(i) | May refuse to disclose any personal information that was obtained by law enforcement in the course of an investigation pertaining to the detection, prevention or suppression of crime. |
Exclusions
In 2021–22, the most frequently invoked exclusion for personal information requests closed was section 69.1, which relates to the exclusion of personal information that the Canadian Broadcasting Corporation collects, uses or discloses for journalistic, artistic or literary purposes. Use of this exclusion has been trending upward since 2019–20, and in 2021–22 it overtook the use of section 69(1)(a), which relates to library or museum material preserved for public reference or exhibition purposes.
In 2012–13 and 2013–14, institutions most frequently invoked 70(1)(c), which relates to Cabinet confidences including any information contained in agenda or records of deliberations or decisions. From 2015–16 through to 2020–21, institutions most frequently invoked 69(1)(a), which relates to library or museum material preserved for public reference or exhibition purposes.
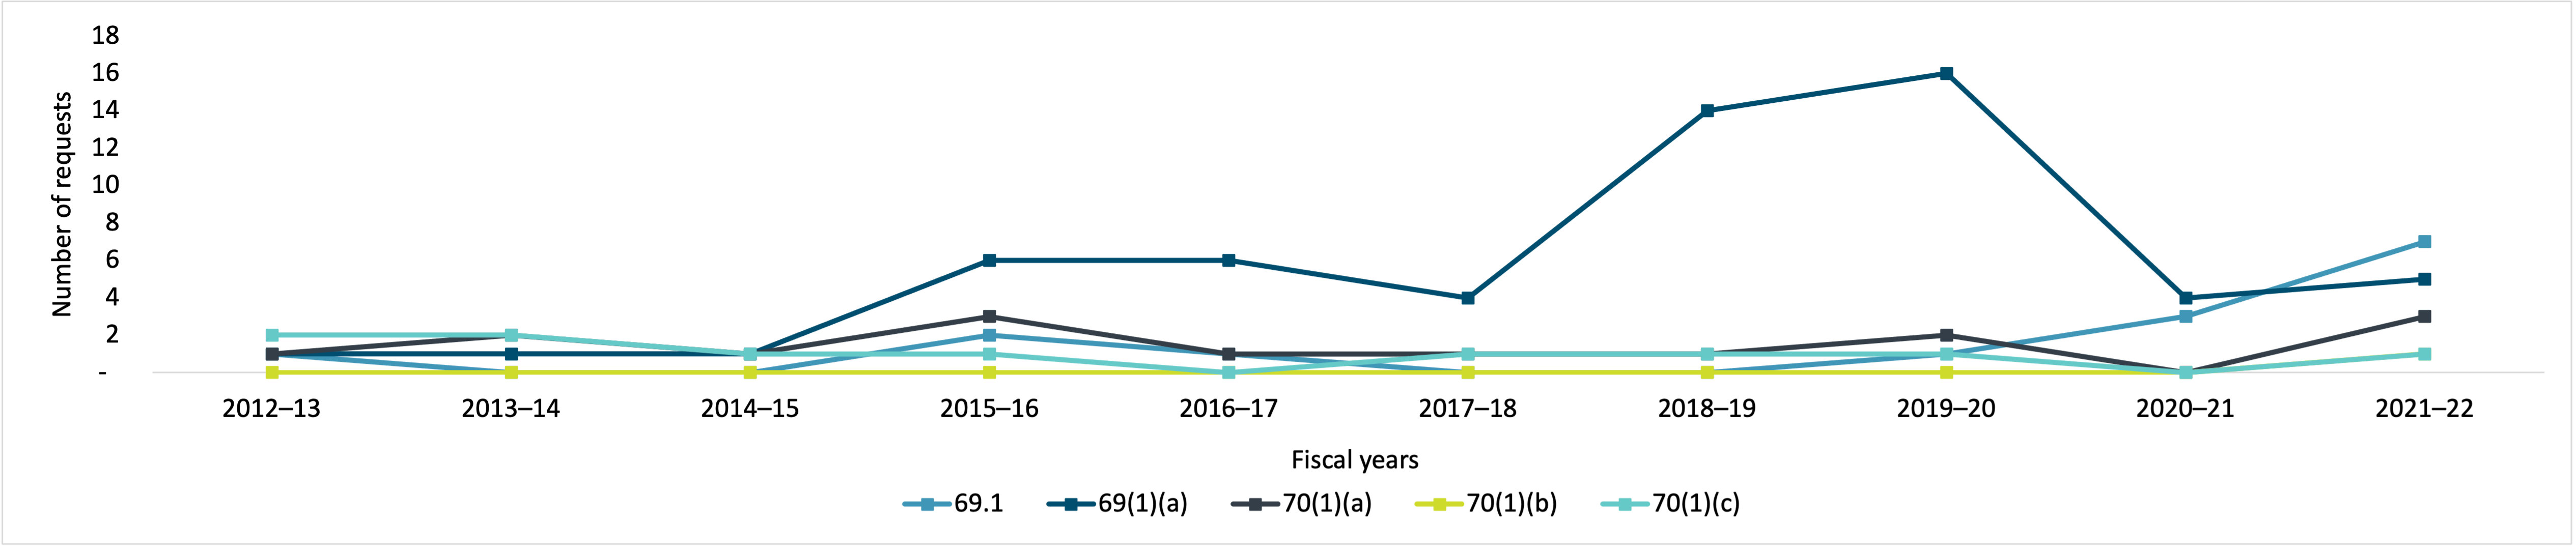
Figure 31 - Text version
| 2012–13 | 2013–14 | 2014–15 | 2015–16 | 2016–17 | 2017–18 | 2018–19 | 2019–20 | 2020–21 | 2021–22 | |
|---|---|---|---|---|---|---|---|---|---|---|
| 69.1 | 1 | - | - | 2 | 1 | - | - | 1 | 3 | 7 |
| 69(1)(a) | 1 | 1 | 1 | 6 | 6 | 4 | 14 | 16 | 4 | 5 |
| 70(1)(a) | 1 | 2 | 1 | 3 | 1 | 1 | 1 | 2 | - | 3 |
| 70(1)(b) | - | - | - | - | - | - | - | - | - | 1 |
| 70(1)(c) | 2 | 2 | 1 | 1 | - | 1 | 1 | 1 | - | 1 |
| Exemption | Description |
|---|---|
| 69.1 | Does not apply to personal information that the Canadian Broadcasting Corporation collects, uses, or discloses for journalistic, artistic, or literary purposes. |
| 69(1)(a) | Does not apply to library or museum material preserved for public reference or exhibition purposes. |
| 70(1)(a) | Does not apply to Cabinet confidences including any information contained in memoranda presenting proposals or recommendations. |
| 70(1)(b) | Does not apply to Cabinet confidences including any information contained in discussion papers presenting background explanations, analysis of problems or policy options for decision-making purposes. |
| 70(1)(c) | Does not apply to Cabinet confidences including any information contained in agenda or records of deliberations or decisions. |
Costs
The annual cost to administer the Government of Canada’s privacy program was about $68.1 million in 2021–22.
Table 3 breaks down the costs associated with the administration of the Privacy Act. Given changes to the financial information collected, it is not possible to provide a historical perspective.
| Description | Amount 2021–22 |
|---|---|
| Cost of institutions’ operationstable 1 note a | $67,509,390.00 |
| Cost of Access to Information Online Request Service | $627,327.00 |
| Total | $68,136,717.00 |
Table 3 Notes
|
|
Figure 32 indicates that over the last decade, the total cost of institutions’ operations in actual dollars has increased.
Note that the values in Figure 32 are different than what were reported in previous years because costs associated with IRCC’s administration of the Privacy Act are presented in Appendix A. The values are in actual dollars and don’t reflect inflation.
The costing study referenced above examined only costs related to processing ATI requests. There is no similar data for personal information requests.
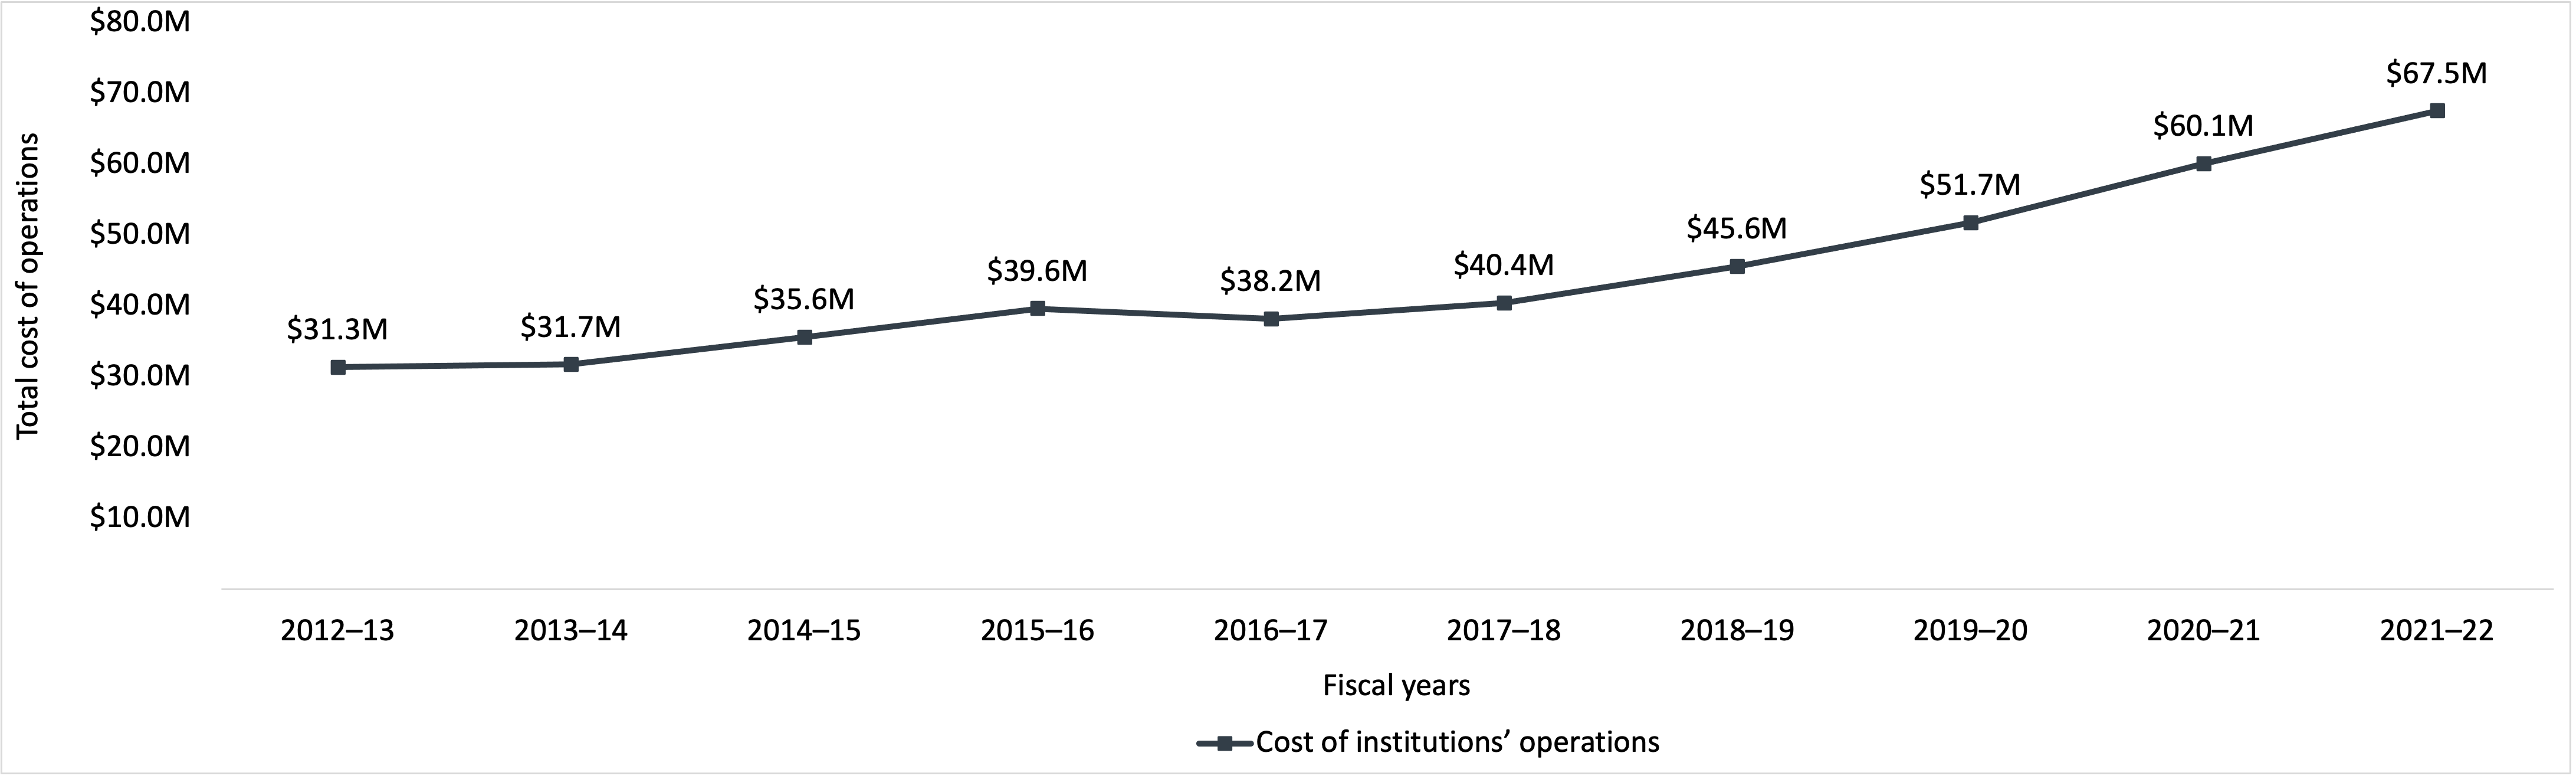
Figure 32 - Text version
| 2012–13 | 2013–14 | 2014–15 | 2015–16 | 2016–17 | 2017–18 | 2018–19 | 2019–20 | 2020–21 | 2021–22 | |
|---|---|---|---|---|---|---|---|---|---|---|
| Cost of institutions’ operations | $31,326,783 | $31,688,104 | $35,577,129 | $39,599,396 | $38,169,706 | $40,401,188 | $45,571,458 | $51,695,588 | $60,051,005 | $67,509,390 |
Disclosures under subsections 8(2) and 8(5) of the Privacy Act
Subsection 8(2) of the Privacy Act, subject to other acts of Parliament, provides for the disclosure of personal information without the consent of the individual. Subsection 8(5) of the act requires institutions to notify the Privacy Commissioner in writing of any disclosure of personal information made pursuant to paragraph 8(2)(m), which relates to public interest disclosures or where disclosures would benefit individuals to whom it relates. Institutions should notify the individual prior to the disclosure when it is reasonably practical or, in any other cases, forthwith.
In 2021–22, the number of disclosures pursuant to subsection 8(2)(e), which relates to disclosure to an investigative body, was 1,190.
Requests for correction of personal information and notations
The Privacy Act allows for individuals to request correction to their personal information held by government institutions. During 2021–22, 36 requests for correction were received and 16 of these were accepted and corrections were made. In instances where a requester sought a correction, but it was not made, a notation was added to the information in question.
Privacy impact assessments
Privacy impact assessments (PIAs) provide a framework to ensure that institutions consider privacy throughout the design or redesign of programs or service delivery. PIAs identify the extent to which proposals comply with all appropriate statutes, assist managers and decision makers in avoiding or mitigating privacy risks, and promote informed policy, program, and system design choices.
Government institutions completed 117 PIAs in 2021–22.
Personal information banks
Personal information banks are descriptions of personal information held by government institutions. The Privacy Act requires that these banks describe all personal information about individuals that is organized and retrievable by a person’s name or by an identifying number, symbol or other particular assigned only to that person. Institutions must include personal information that has been or is being used, or is available for use, to support a program or activity.
| Personal information banks | Amount |
|---|---|
| Active | 1,893 |
| Created | 48 |
| Modified | 126 |
| Terminated | 18 |
| Personal information banks | Amount |
|---|---|
| Active | 2,017 |
| Created | 0 |
| Modified | 1 |
| Terminated | 10 |
Material privacy breaches
A privacy breach involves improper or unauthorized collection, use, disclosure, retention, or disposal of personal information. A breach is deemed a “material privacy breach” if it involves sensitive personal information and could reasonably be expected to cause serious injury or harm to the individual.
During 2021–22, government institutions reported 427 material privacy breaches to both TBS and the Office of the Privacy Commissioner of Canada.
Appendix A: Immigration, Refugees and Citizenship Canada
Requests under the Access to Information Act
When comparing the levels of ATI requests closed to ATI requests received by IRCC over the last decade, Figure 33 demonstrates that the number of ATI requests closed has not kept pace with the number of ATI requests received, except for 2012–13 and 2018–19, where the number of requests closed slightly surpassed the number of requests received. In 2021–22, IRCC received 177,473 ATI requests and carried over 49,392 ATI requests to 2022–23.
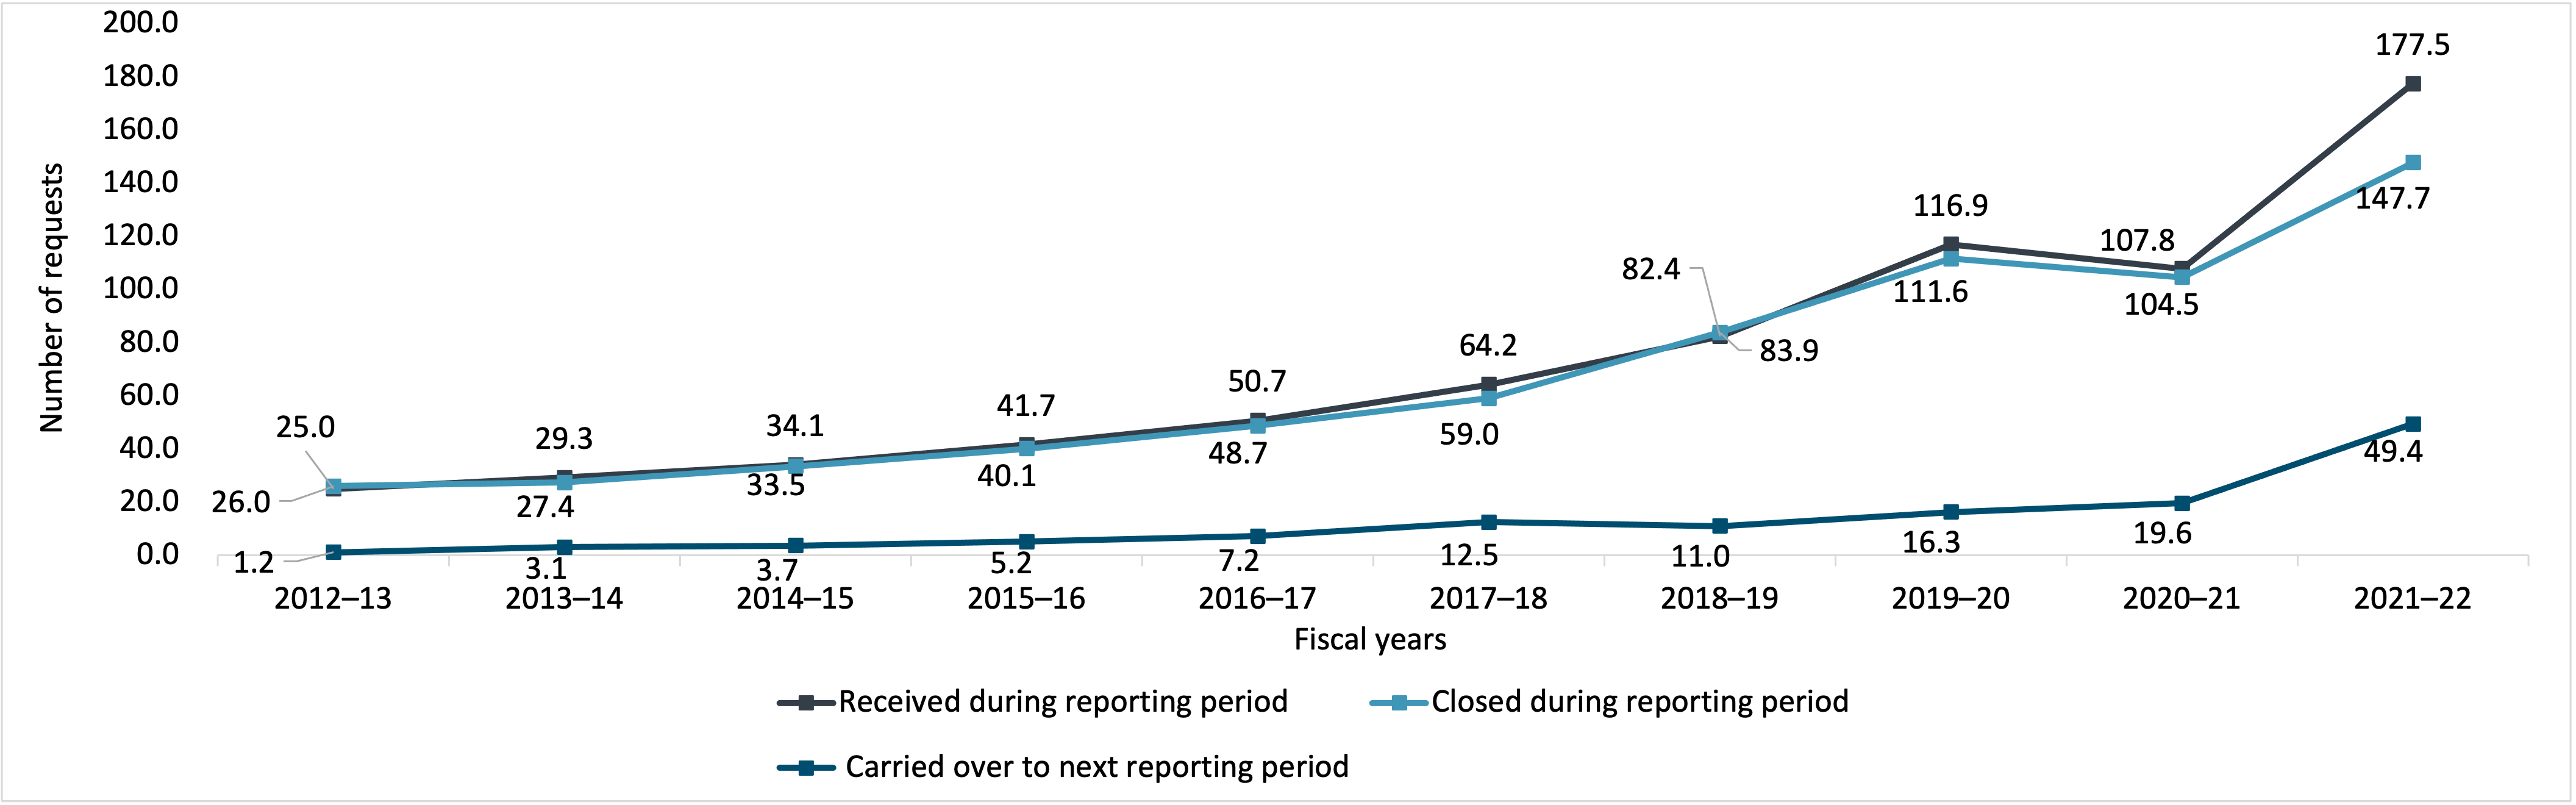
Figure 33 - Text version
| 2012–13 | 2013–14 | 2014–15 | 2015–16 | 2016–17 | 2017–18 | 2018–19 | 2019–20 | 2020–21 | 2021–22 | |
|---|---|---|---|---|---|---|---|---|---|---|
| Received during reporting period | 25,010 | 29,281 | 34,066 | 41,660 | 50,728 | 64,234 | 82,387 | 116,928 | 107,845 | 177,473 |
| Closed during reporting period | 26,020 | 27,407 | 33,524 | 40,107 | 48,733 | 59,021 | 83,895 | 111,593 | 104,547 | 147,712 |
| Carried over to next reporting period | 1,207 | 3,097 | 3,656 | 5,215 | 7,237 | 12,506 | 10,998 | 16,333 | 19,631 | 49,392 |
Figure 34 breaks down the number of ATI requests carried over to 2022–23 (49,392 requests) by the fiscal year of receipt, and by whether the ATI request is within legislated timelines or beyond legislated timelines as of March 31, 2022. Note that the numbers in Figure 34 are not cumulative from one fiscal year to the next, and that ATI requests carried over to 2022–23 are referred to as open ATI requests in this figure.
Figure 34 indicates that 59.9% of open ATI requests were beyond legislated timelines as of March 31, 2022.
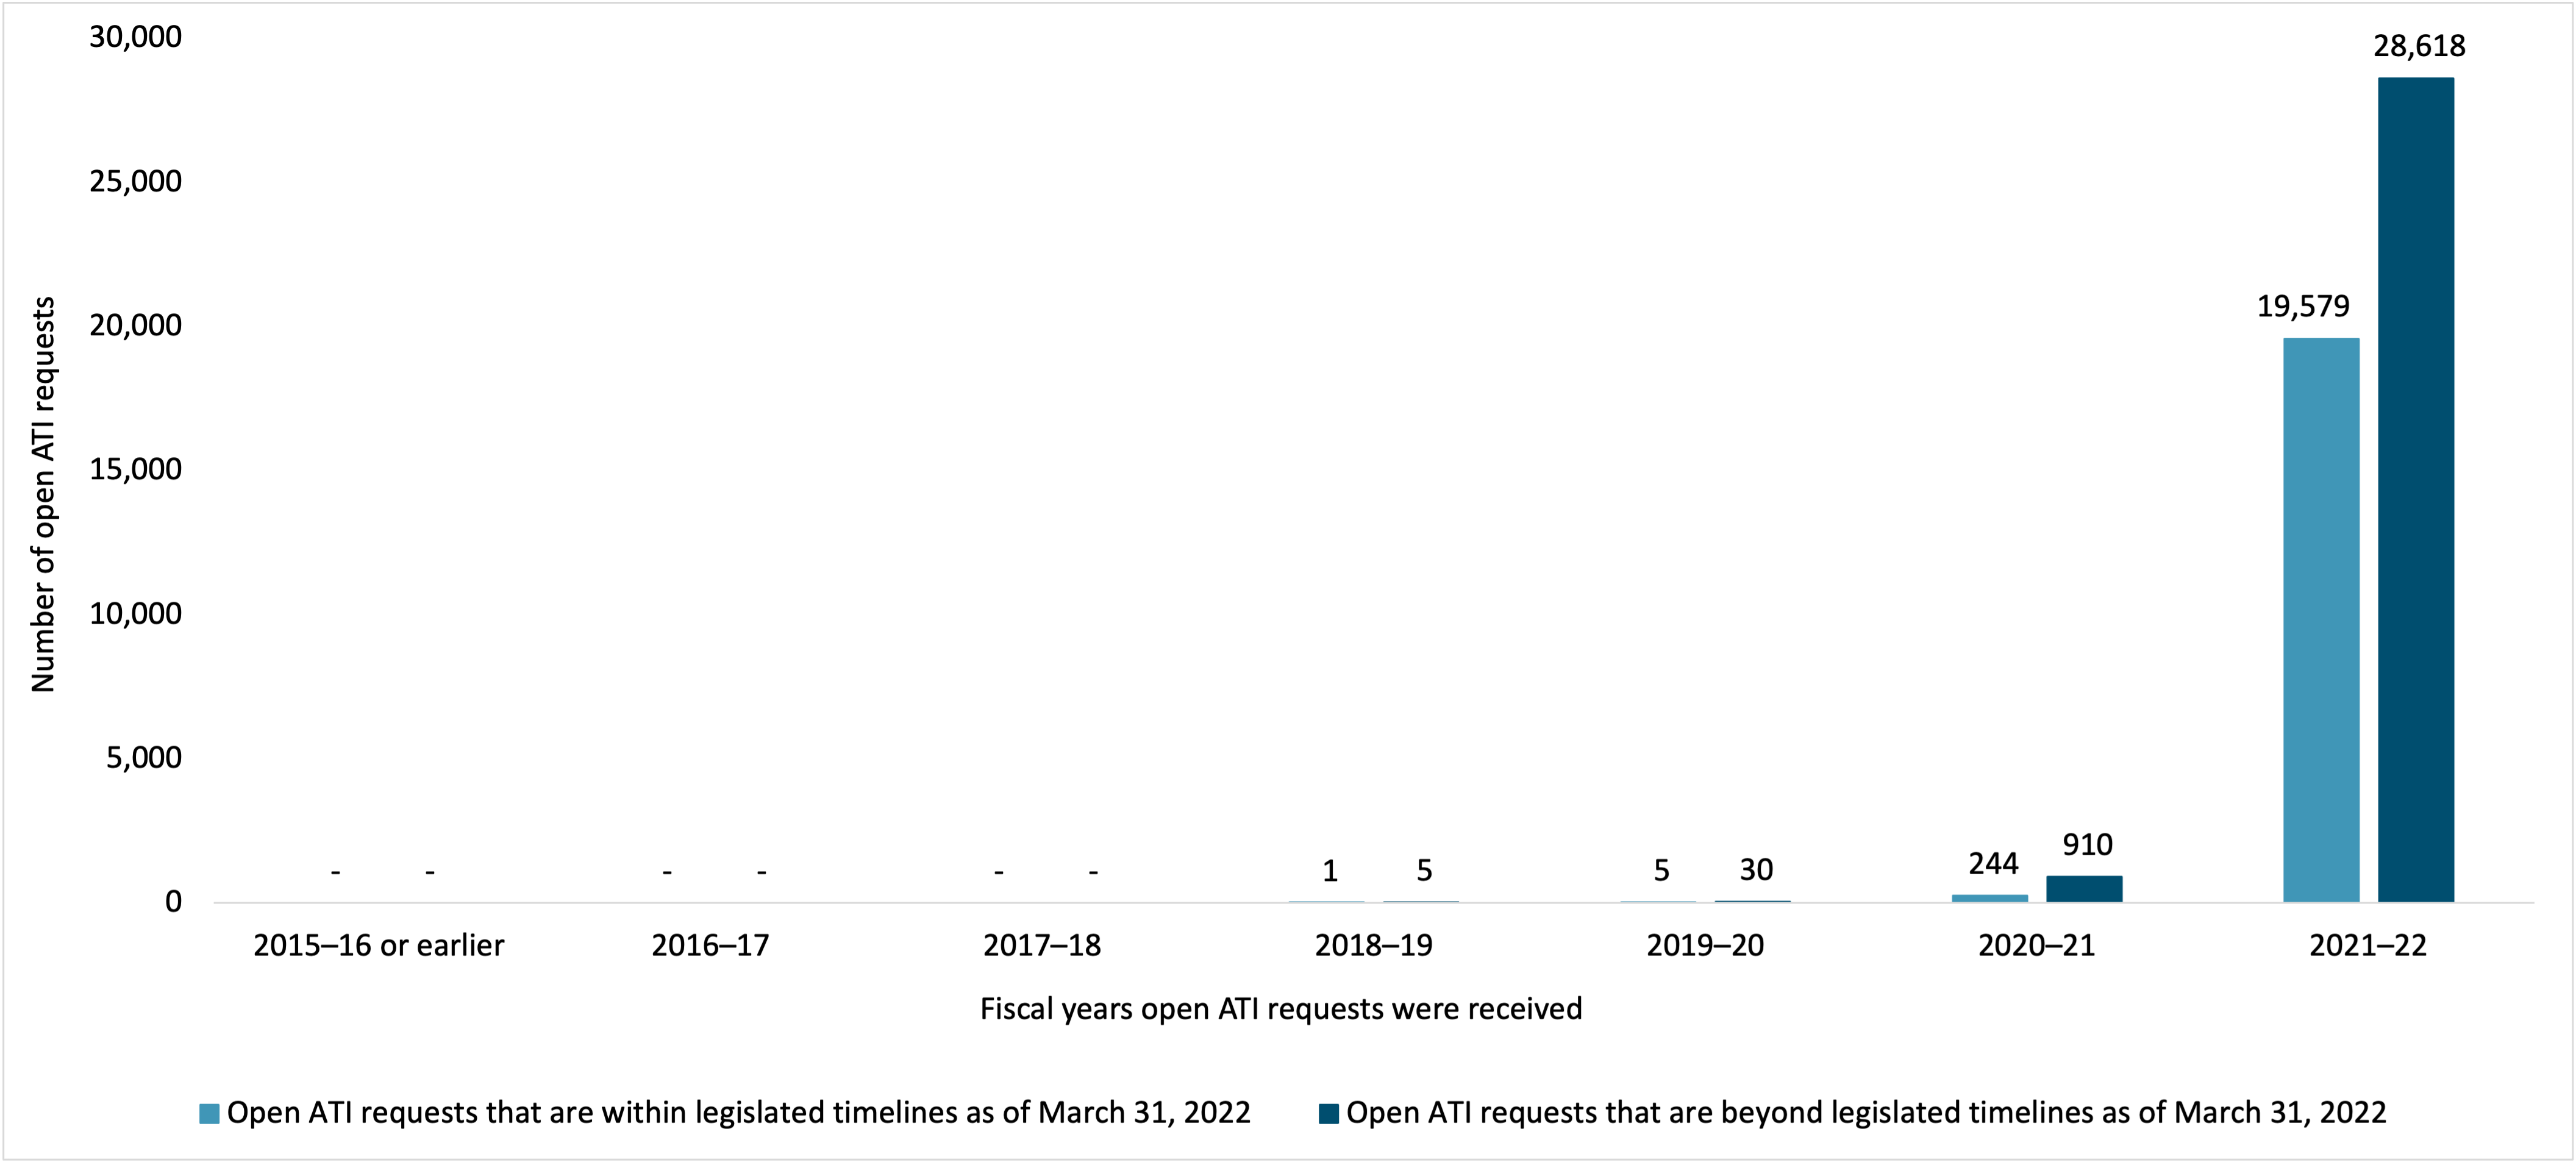
Figure 34 - Text version
| 2015–16 or earlier | 2016–17 | 2017–18 | 2018–19 | 2019–20 | 2020–21 | 2021–22 | |
|---|---|---|---|---|---|---|---|
| Open ATI requests that are within legislated timelines as of March 31, 2022 | - | - | - | 1 | 5 | 244 | 19,579 |
| Open ATI requests that are beyond legislated timelines as of March 31, 2022 | - | - | - | 5 | 30 | 910 | 28,618 |
Timeliness
In 2021–22, of the 147,712 ATI requests closed by IRCC, only 34% of requests were closed within legislated timelines, including extensions. Figure 35 shows that this is a sharp decline from previous years over the last decade.
The open ATI requests beyond legislated timelines mean that requesters are being denied timely access and signify that the performance of the system, as measured by requests closed within legislated timelines, will be hindered until these open ATI requests are closed, even if all new ATI requests are closed within legislated timelines.
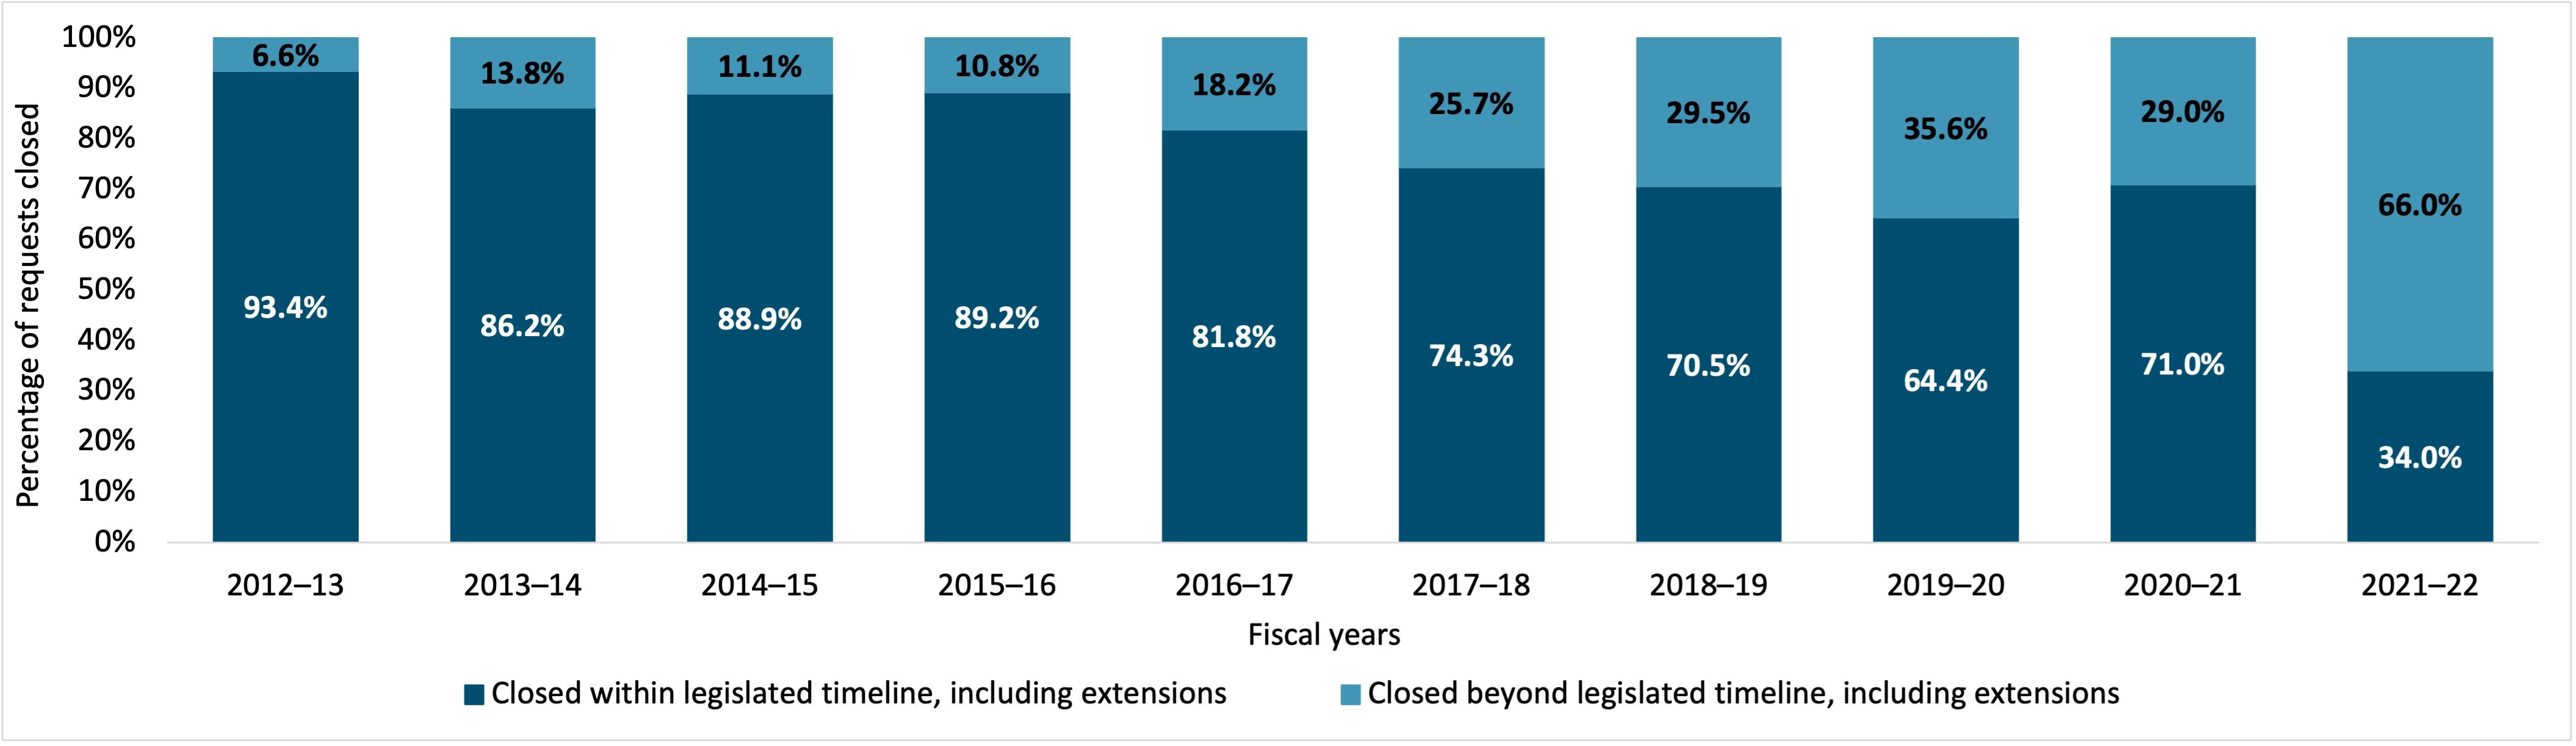
Figure 35 - Text version
| 2012–13 | 2013–14 | 2014–15 | 2015–16 | 2016–17 | 2017–18 | 2018–19 | 2019–20 | 2020–21 | 2021–22 | |
|---|---|---|---|---|---|---|---|---|---|---|
| Closed within legislated timeline, including extensions | 93.4% | 86.2% | 88.9% | 89.2% | 81.8% | 74.3% | 70.5% | 64.4% | 71.0% | 34.0% |
| Closed beyond legislated timeline, including extensions | 6.6% | 13.8% | 11.1% | 10.8% | 18.2% | 25.7% | 29.5% | 35.6% | 29.0% | 66.0% |
Figure 36 indicates that over the last decade, the percentage of ATI requests closed within the first 30 days gradually decreased to 25.6% in 2021–22.
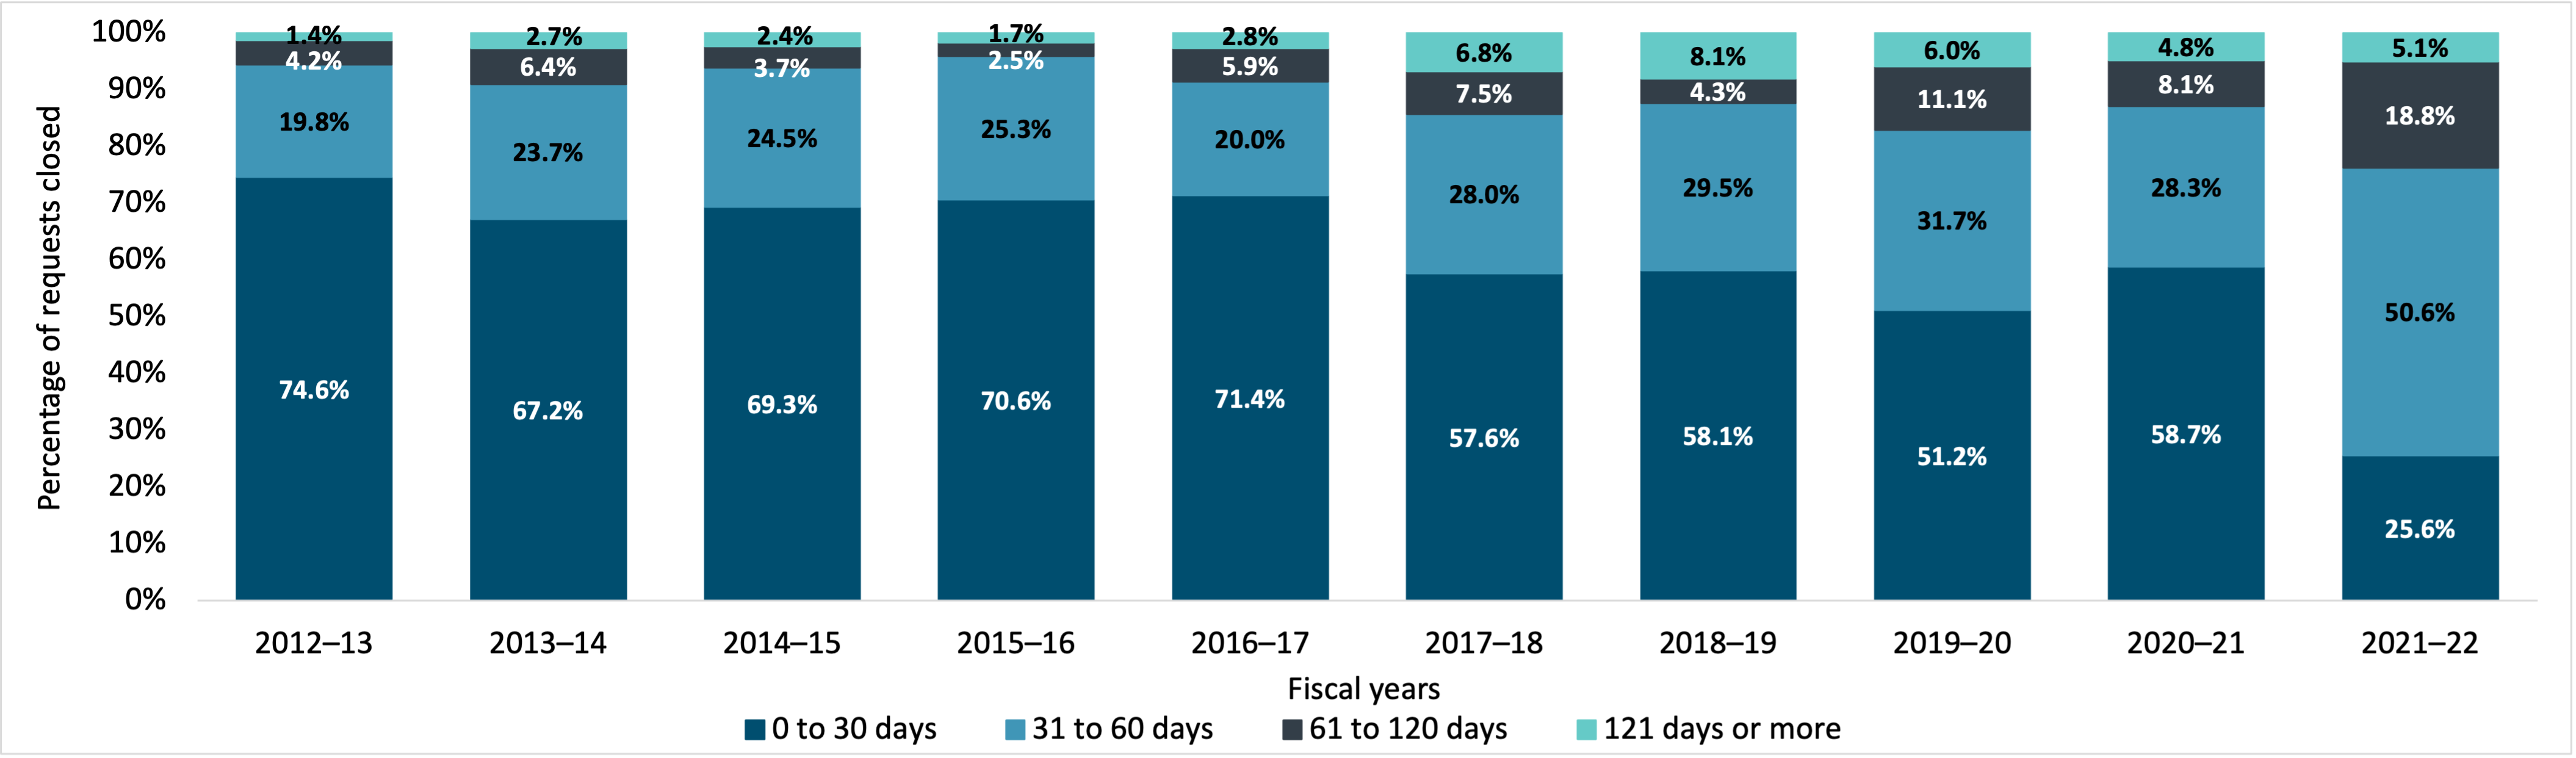
Figure 36 - Text version
| 2012–13 | 2013–14 | 2014–15 | 2015–16 | 2016–17 | 2017–18 | 2018–19 | 2019–20 | 2020–21 | 2021–22 | |
|---|---|---|---|---|---|---|---|---|---|---|
| 0 to 30 days | 74.6% | 67.2% | 69.3% | 70.6% | 71.4% | 57.6% | 58.1% | 51.2% | 58.7% | 25.6% |
| 31 to 60 days | 19.8% | 23.7% | 24.5% | 25.3% | 20.0% | 28.0% | 29.5% | 31.7% | 28.3% | 50.6% |
| 61 to 120 days | 4.2% | 6.4% | 3.7% | 2.5% | 5.9% | 7.5% | 4.3% | 11.1% | 8.1% | 18.8% |
| 121 days or more | 1.4% | 2.7% | 2.4% | 1.7% | 2.8% | 6.8% | 8.1% | 6.0% | 4.8% | 5.1% |
In terms of extensions taken on ATI requests closed by IRCC in 2021–22, 81.5% of all extensions taken cited paragraph 9(1)(b) (Consultation: Other) as a reason for the extension. 3.1% of all extensions taken for closed requests were for 30 days or less and 72.6% were for 120 days or less.
Figure 37 indicates that over the last decade, the percentage of all extensions taken by IRCC that cited paragraph 9(1)(a) has decreased to 4.4% in 2018–19. However, since then, the percentage increased to 55.2% in 2019–20, and then has decreased to 18.2% in 2021–22. Figure 37 also indicates that over the last decade, the percentage of all extensions taken by IRCC that cited paragraph 9(1)(b) (Consultation: Other) has increased.
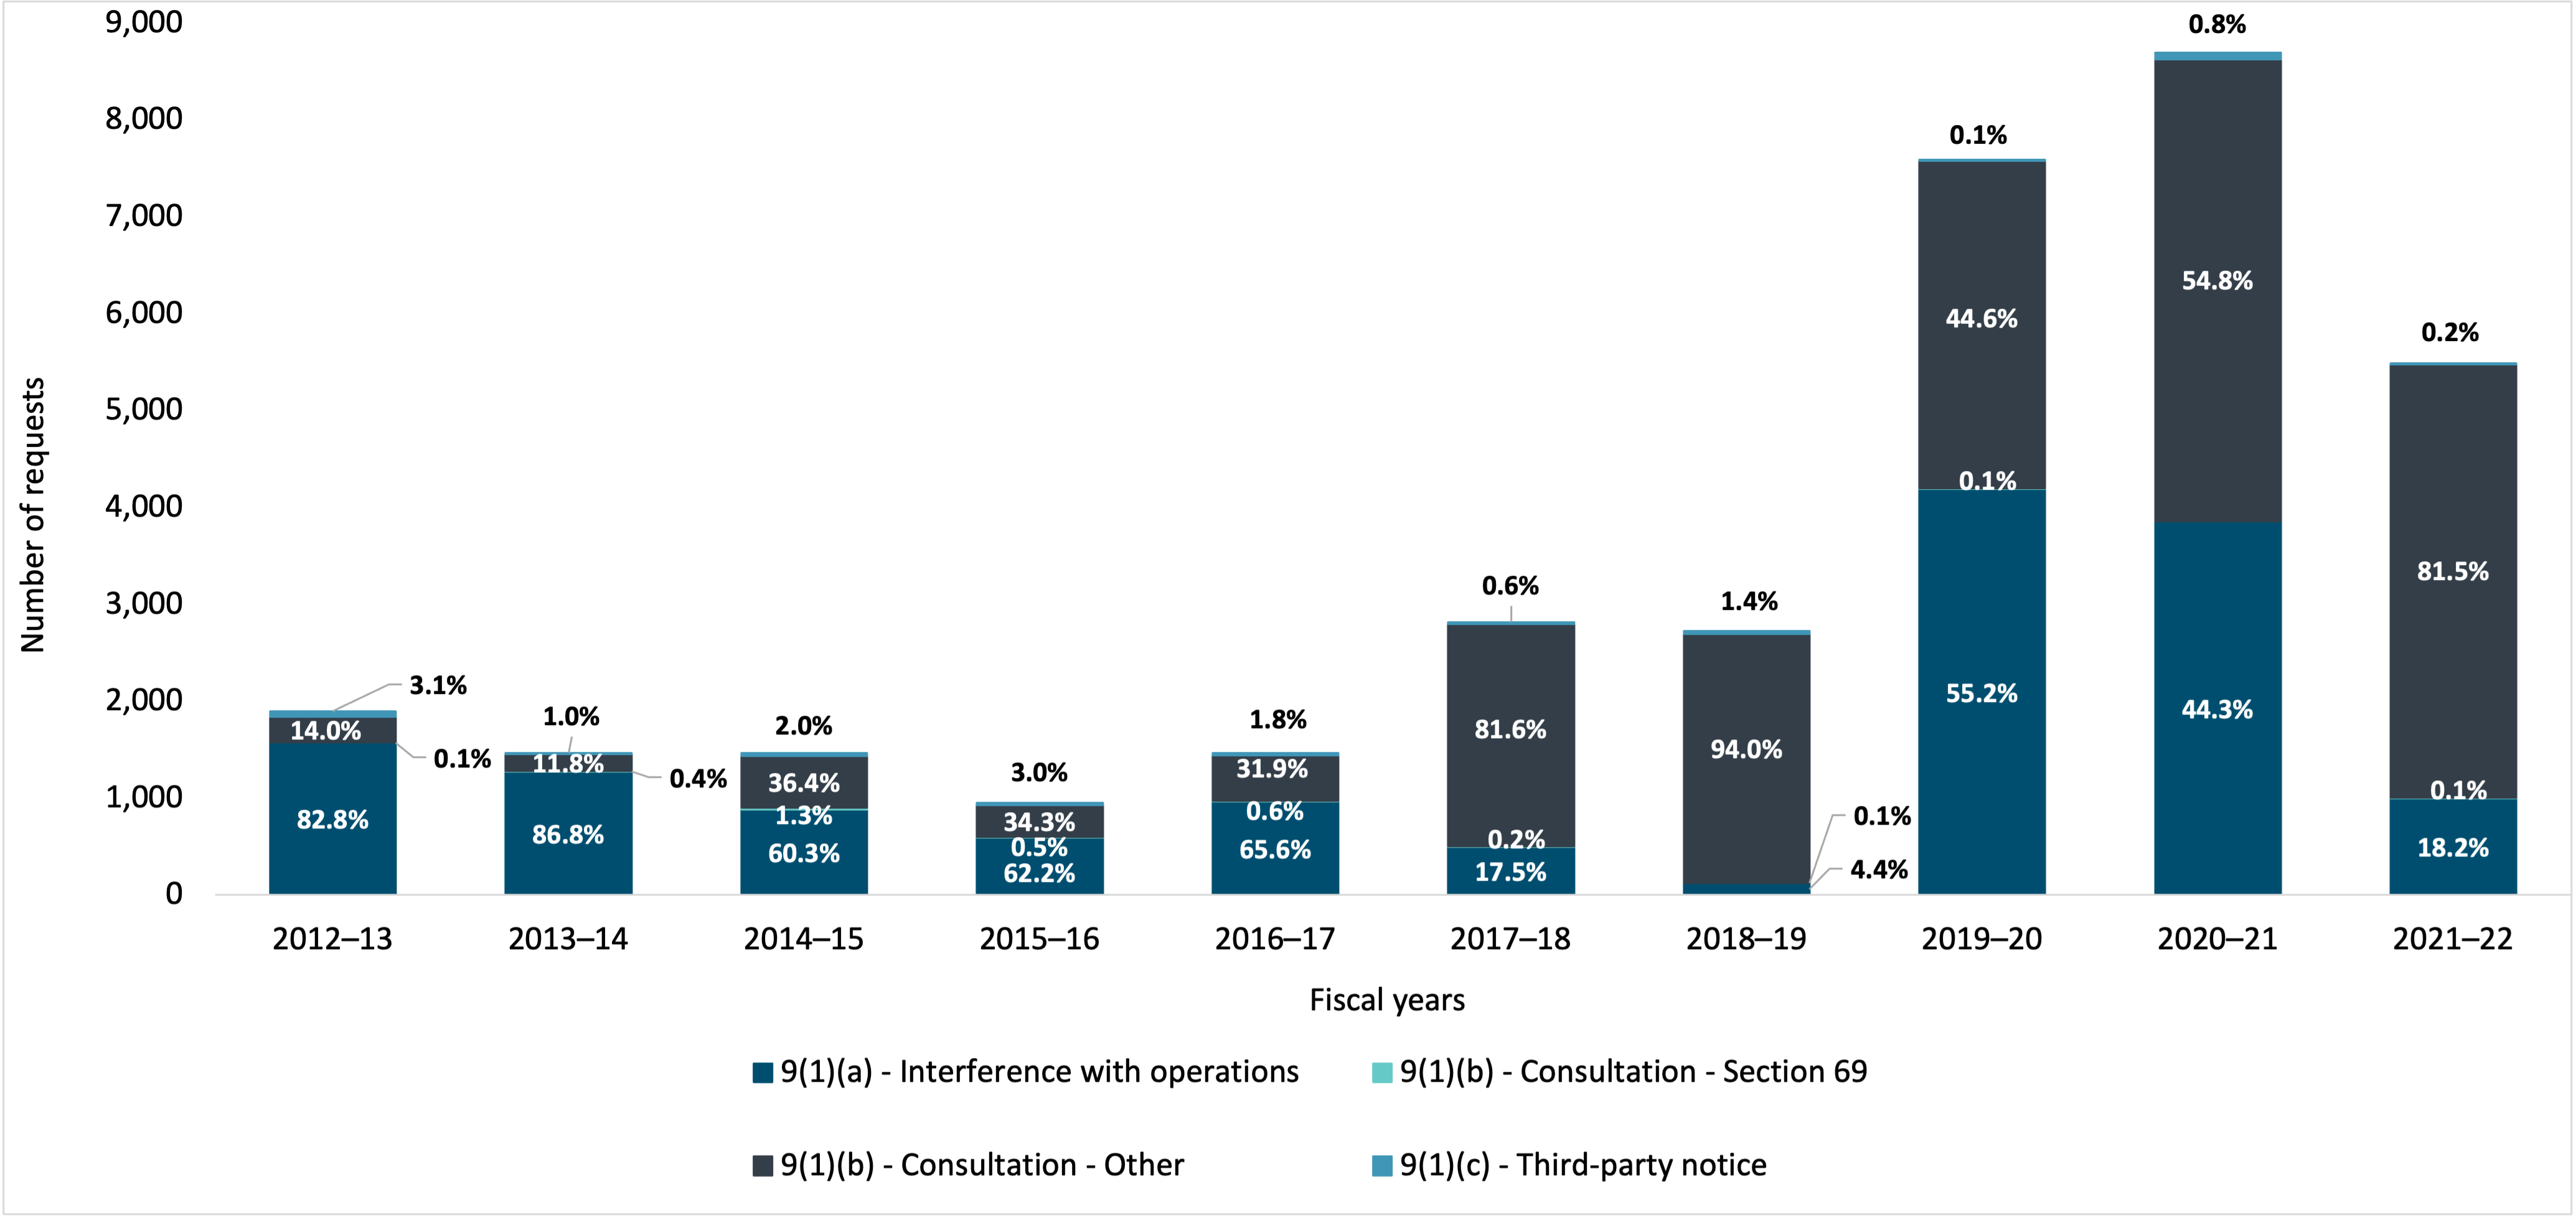
Figure 37 - Text version
| 2012–13 | 2013–14 | 2014–15 | 2015–16 | 2016–17 | 2017–18 | 2018–19 | 2019–20 | 2020–21 | 2021–22 | |
|---|---|---|---|---|---|---|---|---|---|---|
| 9(1)(a) - Interference with operations | 1,573 | 1,273 | 883 | 593 | 963 | 493 | 121 | 4,191 | 3,856 | 999 |
| 9(1)(b) - Consultation - Section 69 | 1 | 6 | 19 | 5 | 9 | 7 | 4 | 6 | 3 | 5 |
| 9(1)(b) - Consultation - Other | 266 | 173 | 533 | 327 | 469 | 2,298 | 2,566 | 3,381 | 4,768 | 4,472 |
| 9(1)(c) - Third-party notice | 59 | 15 | 30 | 29 | 27 | 18 | 38 | 9 | 68 | 11 |
Figure 38 indicates that over the last decade, IRCC increasingly cited “Workload” as the reason that ATI requests were closed beyond legislated timelines, including extensions. Figure 38 also indicates that over the last decade, the overall annual volume of ATI requests closed beyond legislated timelines, including extensions, increased year to year.
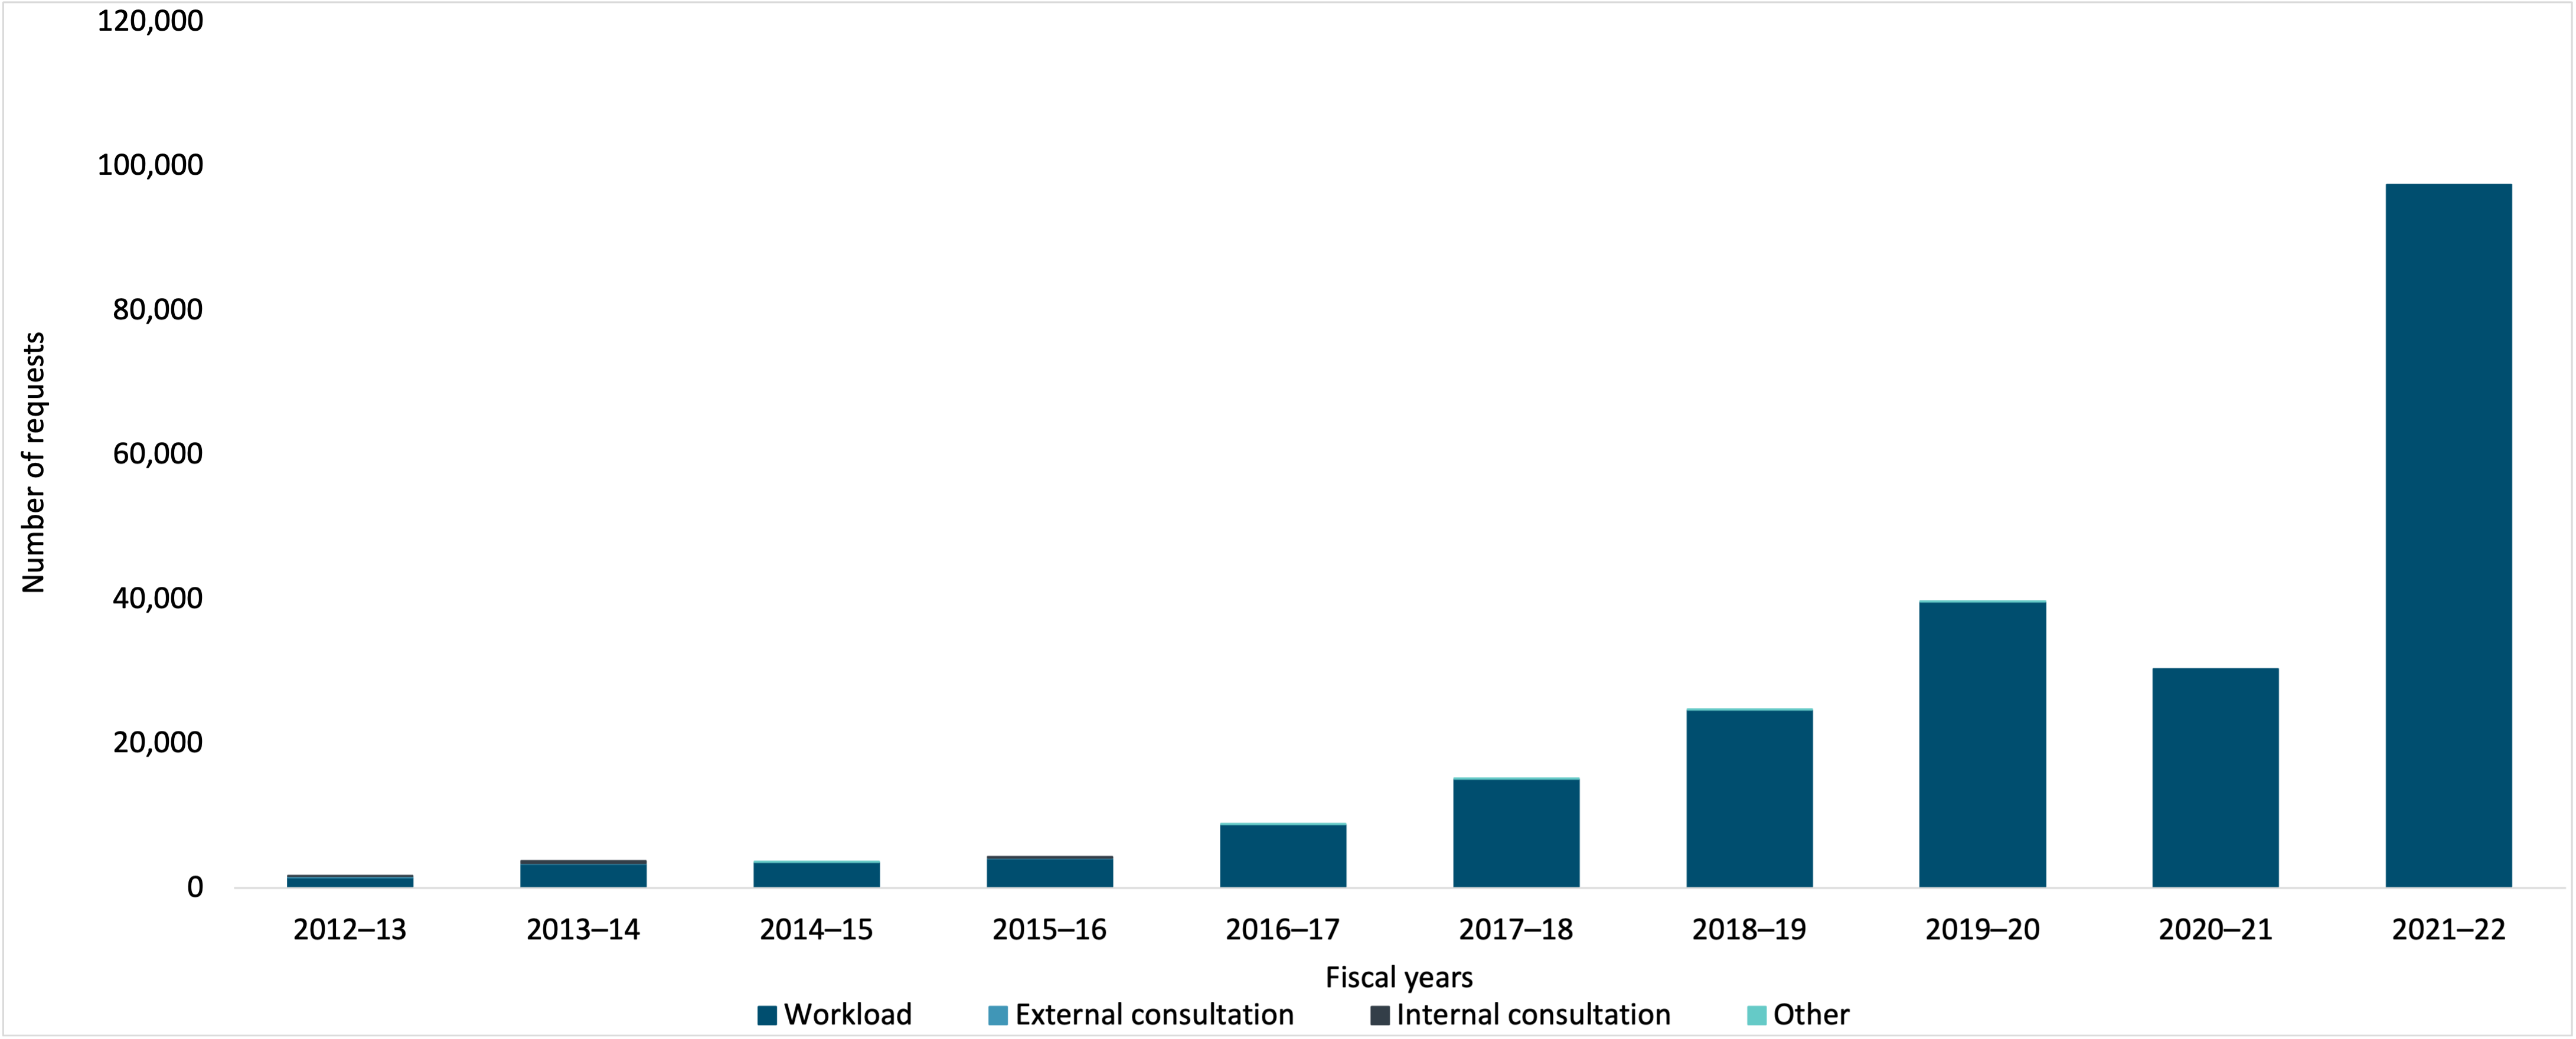
Figure 38 - Text version
| 2012–13 | 2013–14 | 2014–15 | 2015–16 | 2016–17 | 2017–18 | 2018–19 | 2019–20 | 2020–21 | 2021–22 | |
|---|---|---|---|---|---|---|---|---|---|---|
| Workload | 1,512 | 3,418 | 3,628 | 4,085 | 8,836 | 15,154 | 24,697 | 39,705 | 30,363 | 97,436 |
| External consultation | 138 | 28 | 4 | 126 | 11 | 23 | 1 | 19 | - | - |
| Internal consultation | 69 | 337 | 31 | 117 | 9 | 4 | - | 6 | - | - |
| Other | - | - | 43 | - | 4 | 1 | 51 | 7 | - | - |
Disposition
Records were all disclosed or disclosed in part in response to 95.1% of closed ATI requests in 2021–22.
Figure 39 indicates that over the last decade, the percentage of ATI requests closed by IRCC with the disposition “All disclosed” has decreased, while the percentage of ATI requests with the disposition “Disclosed in part” has increased. Figure 39 also indicates that over the same period, the percentage of ATI requests closed with the disposition “no records exist” has decreased.
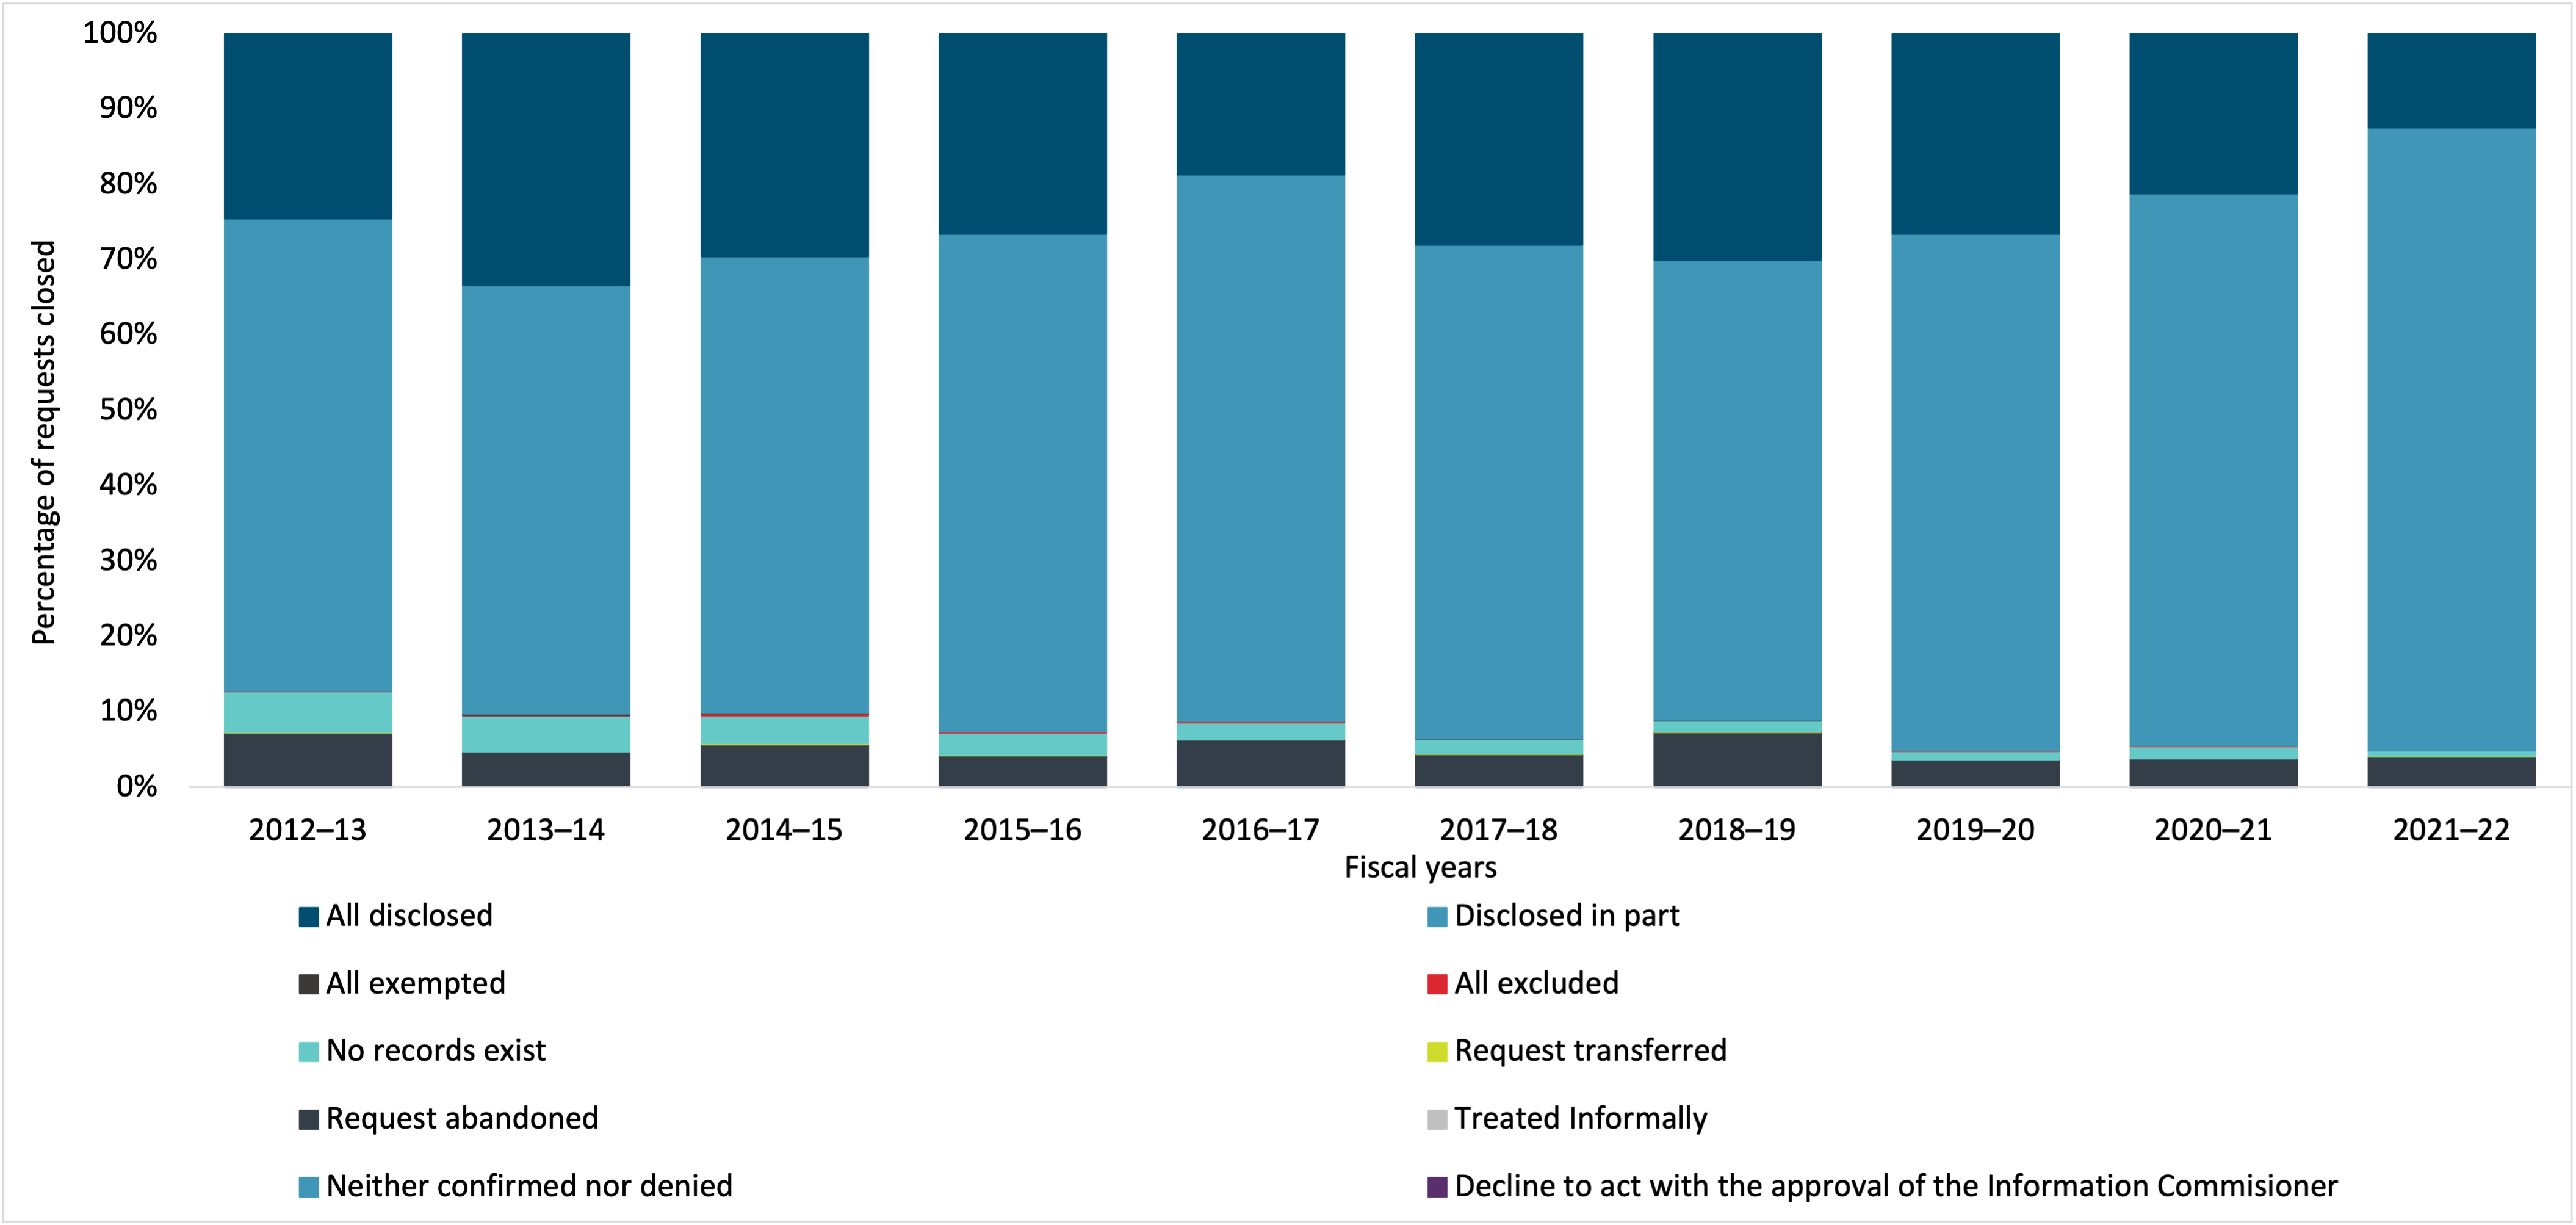
Figure 39 - Text version
| 2012–13 | 2013–14 | 2014–15 | 2015–16 | 2016–17 | 2017–18 | 2018–19 | 2019–20 | 2020–21 | 2021–22 | |
|---|---|---|---|---|---|---|---|---|---|---|
| All disclosed | 24.5% | 33.4% | 29.6% | 26.6% | 18.7% | 28.0% | 30.0% | 26.5% | 21.2% | 12.5% |
| Disclosed in part | 62.6% | 56.9% | 60.5% | 66.0% | 72.5% | 65.5% | 61.1% | 68.6% | 73.3% | 82.6% |
| All exempted | 0.0% | 0.1% | 0.1% | 0.0% | 0.0% | 0.0% | 0.0% | 0.0% | 0.0% | 0.0% |
| All excluded | 0.0% | 0.1% | 0.3% | 0.2% | 0.1% | 0.0% | 0.0% | 0.0% | 0.0% | 0.0% |
| No records exist | 5.4% | 4.8% | 3.7% | 3.0% | 2.3% | 2.0% | 1.5% | 1.2% | 1.6% | 0.8% |
| Request transferred | 0.1% | 0.1% | 0.2% | 0.0% | 0.0% | 0.0% | 0.0% | 0.0% | 0.0% | 0.0% |
| Request abandoned | 7.2% | 4.6% | 5.6% | 4.2% | 6.3% | 4.4% | 7.3% | 3.6% | 3.8% | 4.1% |
| Treated Informally | 0.0% | 0.1% | 0.0% | 0.0% | 0.0% | 0.0% | 0.0% | 0.0% | 0.0% | 0.0% |
| Neither confirmed nor denied | 0.0% | 0.0% | 0.0% | 0.0% | 0.0% | 0.0% | 0.0% | 0.0% | 0.0% | 0.0% |
| Decline to act with the approval of the Information Commisioner | 0.0% | 0.0% | 0.0% | 0.0% | 0.0% | 0.0% | 0.0% | 0.0% | 0.0% | 0.0% |
Complexity
Figure 40 indicates that over the last decade, the number of pages processed by IRCC has increased. The increase in the number of pages processed over the last decade is due to the increase in the number of ATI requests closed by IRCC over the same period (see Figure 33).
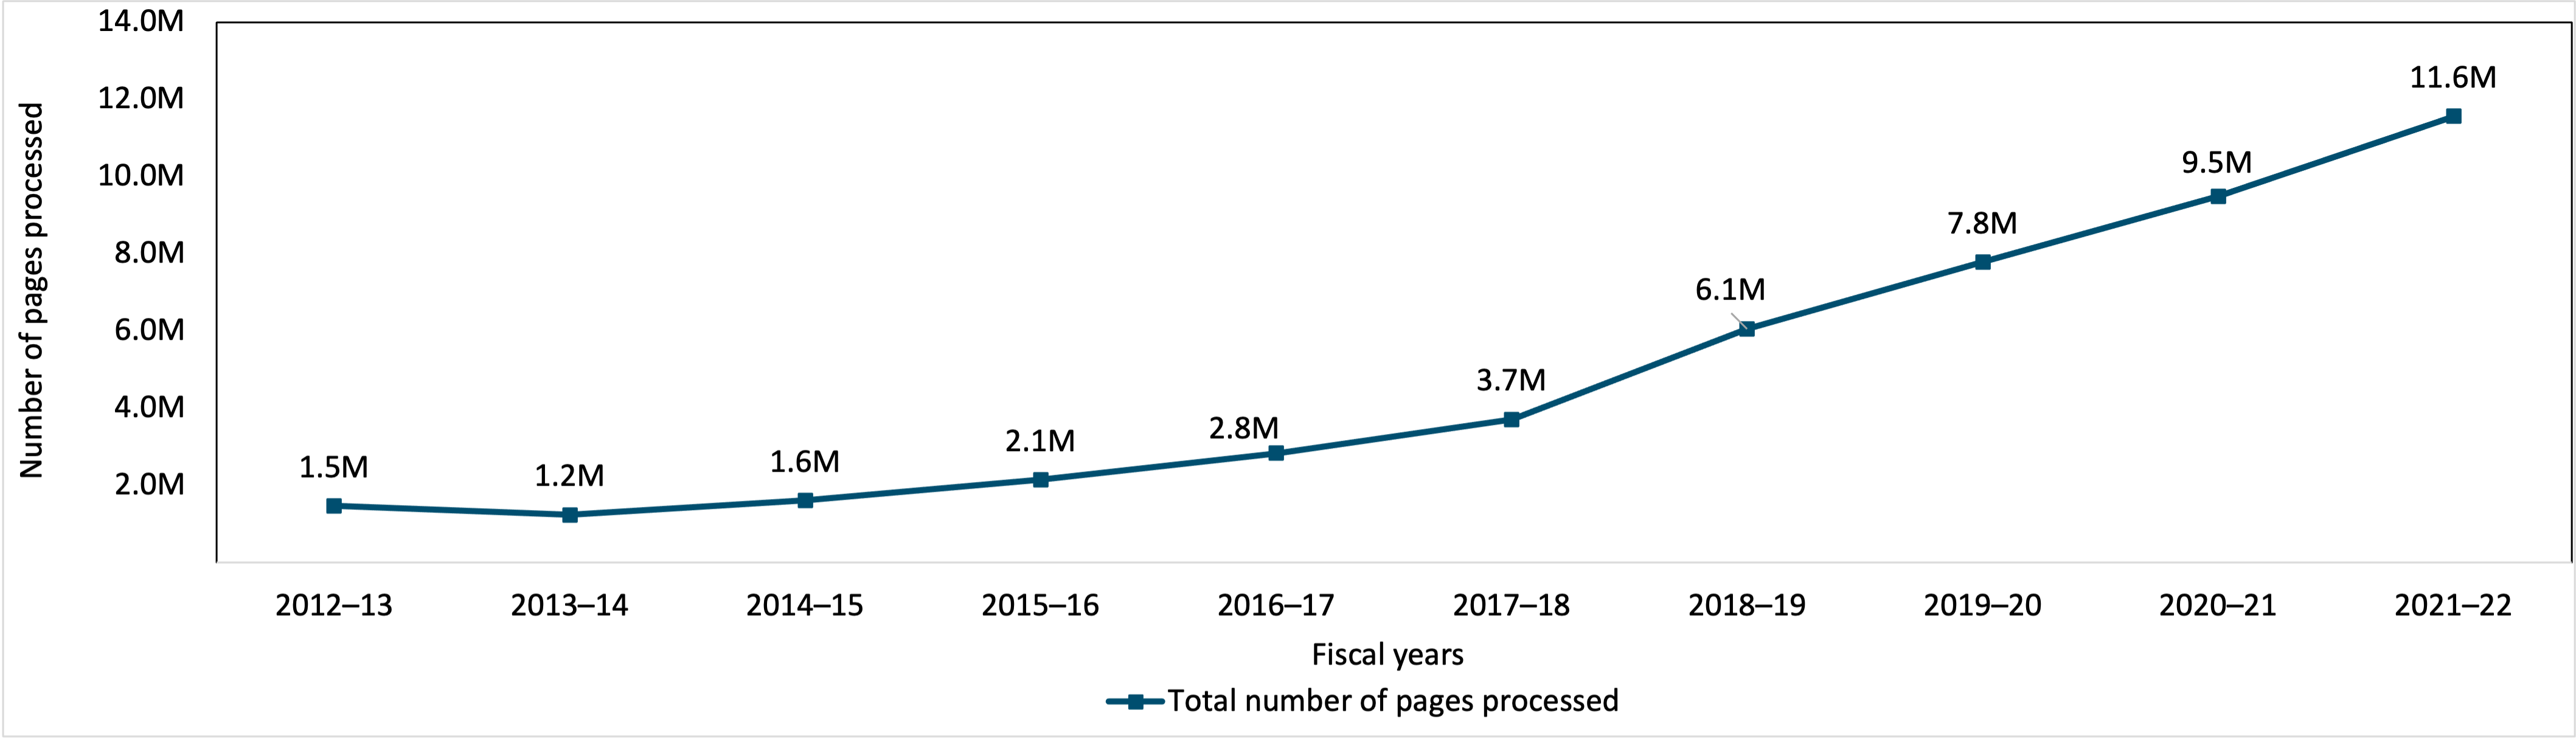
Figure 40 - Text version
| 2012–13 | 2013–14 | 2014–15 | 2015–16 | 2016–17 | 2017–18 | 2018–19 | 2019–20 | 2020–21 | 2021–22 | |
|---|---|---|---|---|---|---|---|---|---|---|
| Total number of pages processed | 1,471,572 | 1,241,427 | 1,615,772 | 2,145,173 | 2,834,527 | 3,713,374 | 6,058,588 | 7,787,738 | 9,486,193 | 11,564,878 |
Consultations between IRCC and federal institutions
During 2021–22, IRCC sought consultations with other institution in 131 requests.
Figure 41 indicates that over the last decade, the number of ATI requests for consultation received by IRCC has increased until 2019–20, after which this number sharply decreased in 2020–21. A similar trend is observed in the number of ATI requests for consultation closed by IRCC.
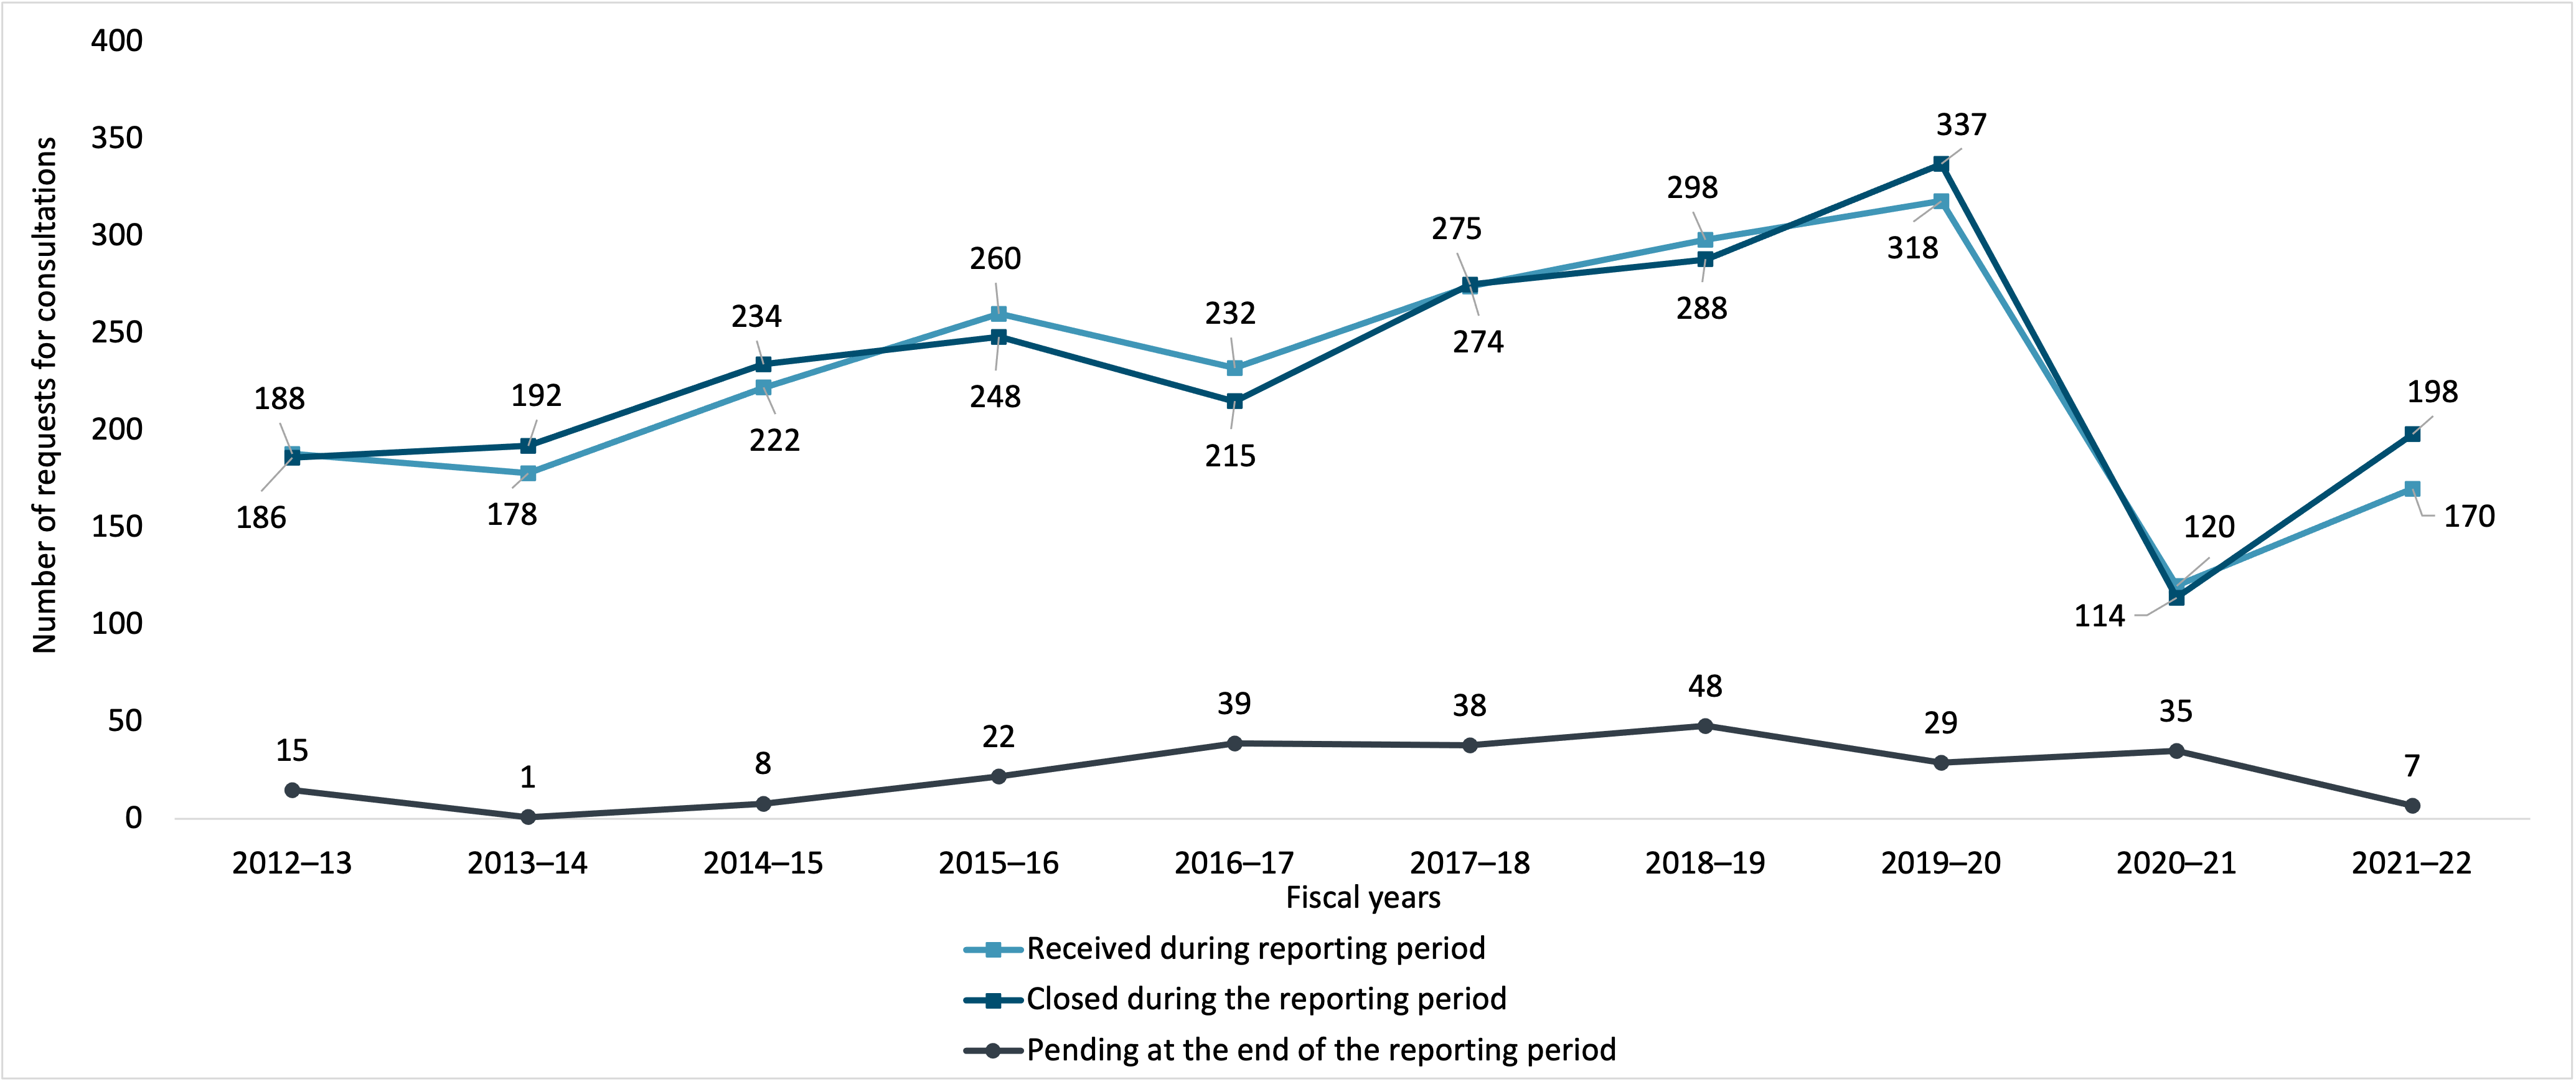
Figure 41 - Text version
| 2012–13 | 2013–14 | 2014–15 | 2015–16 | 2016–17 | 2017–18 | 2018–19 | 2019–20 | 2020–21 | 2021–22 | |
|---|---|---|---|---|---|---|---|---|---|---|
| Received during reporting period | 188 | 178 | 222 | 260 | 232 | 274 | 298 | 318 | 120 | 170 |
| Closed during the reporting period | 186 | 192 | 234 | 248 | 215 | 275 | 288 | 337 | 114 | 198 |
| Pending at the end of the reporting period | 15 | 1 | 8 | 22 | 39 | 38 | 48 | 29 | 35 | 7 |
Figure 42 indicates that over the last decade, the percentage of consultations closed within 30 days by IRCC has fluctuated between 46% and 78%.
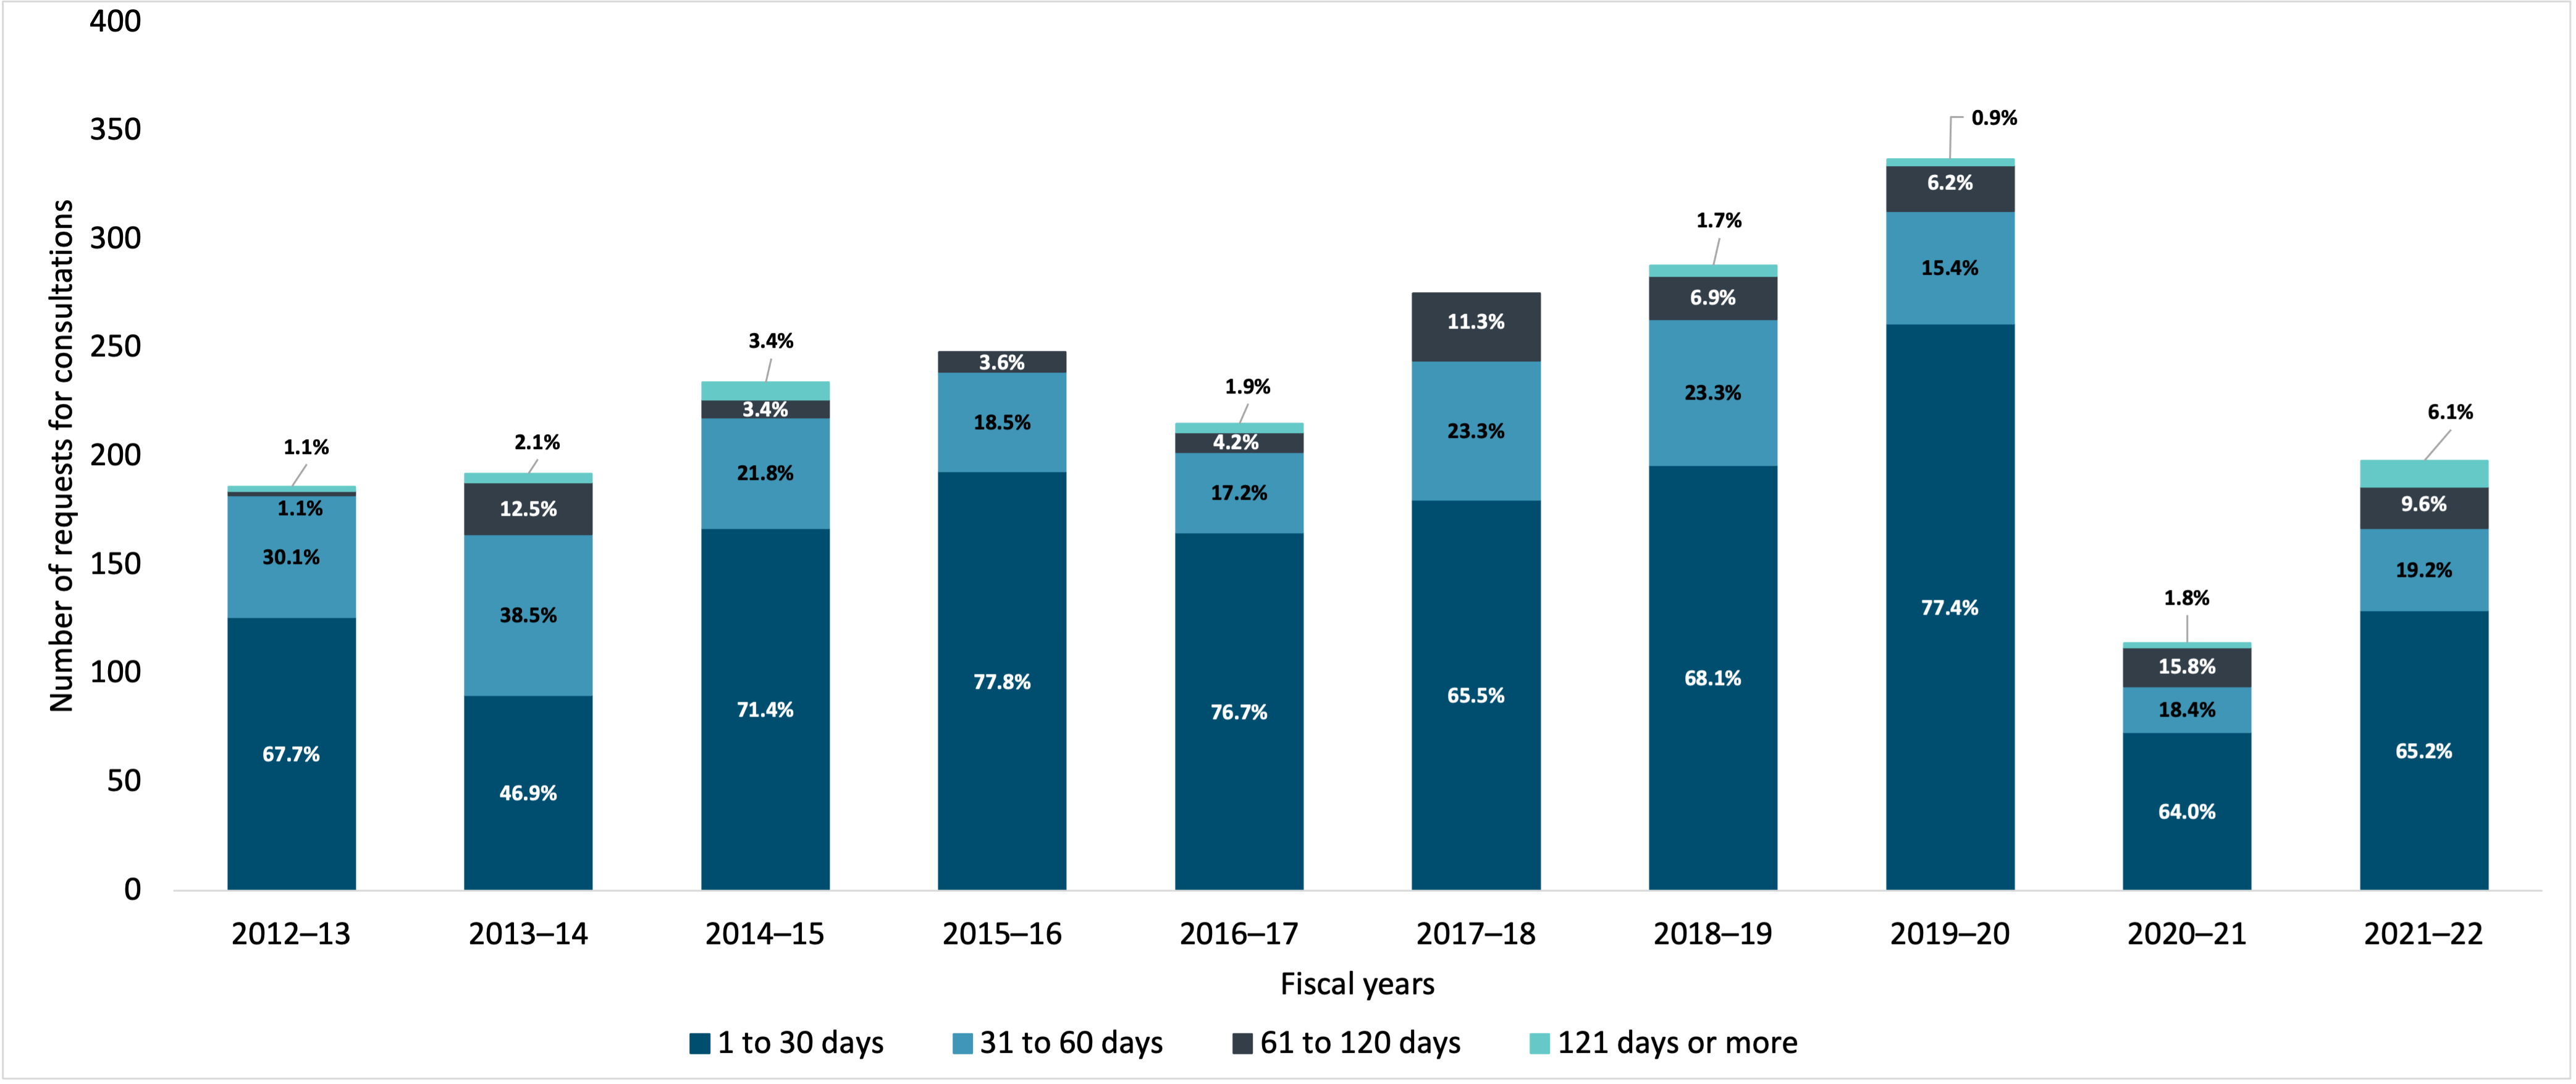
Figure 42 - Text version
| 2012–13 | 2013–14 | 2014–15 | 2015–16 | 2016–17 | 2017–18 | 2018–19 | 2019–20 | 2020–21 | 2021–22 | |
|---|---|---|---|---|---|---|---|---|---|---|
| 1 to 30 days | 126 | 90 | 167 | 193 | 165 | 180 | 196 | 261 | 73 | 129 |
| 31 to 60 days | 56 | 74 | 51 | 46 | 37 | 64 | 67 | 52 | 21 | 38 |
| 61 to 120 days | 2 | 24 | 8 | 9 | 9 | 31 | 20 | 21 | 18 | 19 |
| 121 days or more | 2 | 4 | 8 | - | 4 | - | 5 | 3 | 2 | 12 |
Exemptions
Figure 43 indicates that over the last decade, the use of the five most frequently invoked exemptions by IRCC has increased. Until 2019–20, the most frequently invoked exemption was 19(1), which relates to personal information. The exemption that experienced the biggest increase over this period was paragraph 16(2)(c), which relates to the protection of any record containing information that could facilitate the commission of an offence, including any information on the vulnerability of particular buildings or other structures or systems.
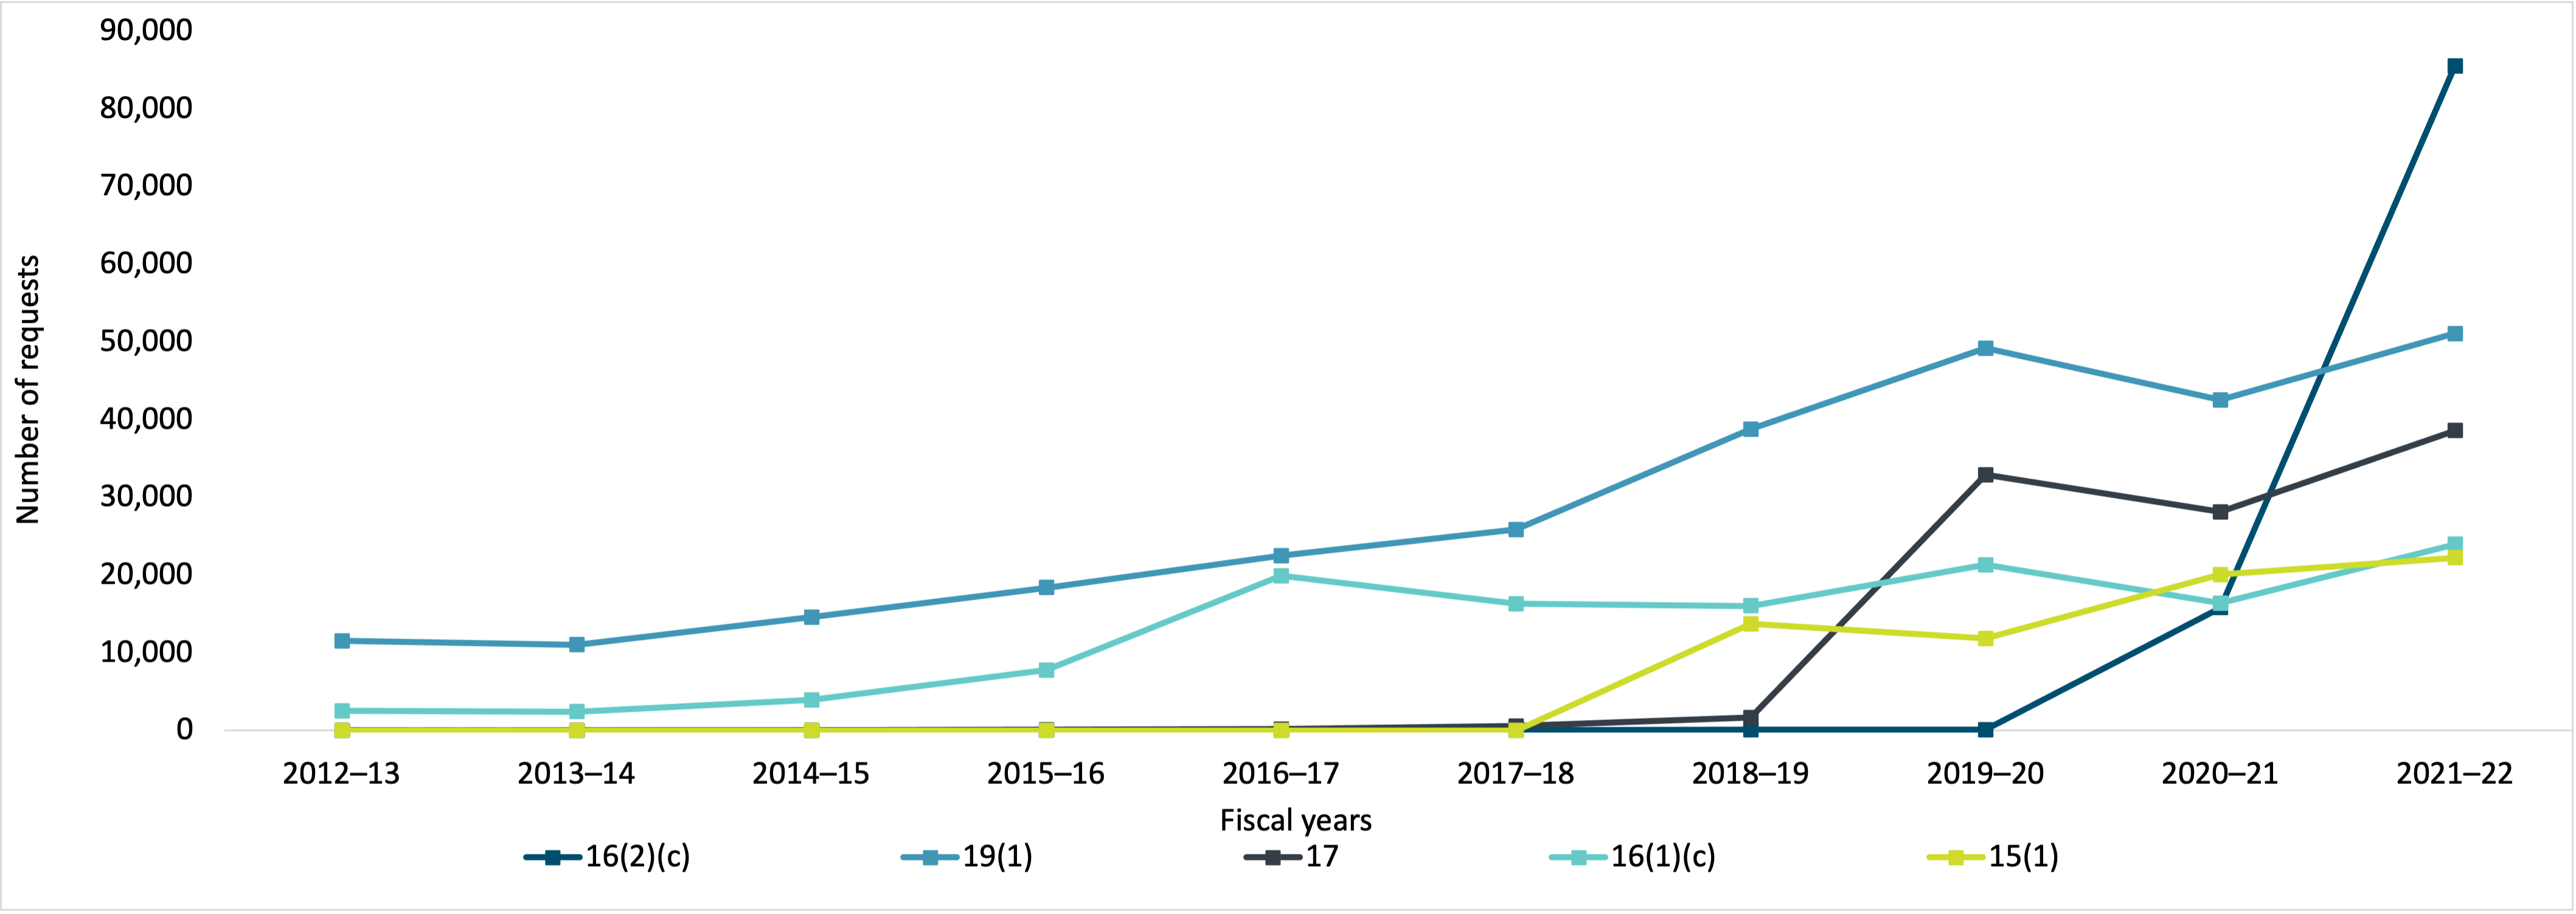
Figure 43 - Text version
| 2012–13 | 2013–14 | 2014–15 | 2015–16 | 2016–17 | 2017–18 | 2018–19 | 2019–20 | 2020–21 | 2021–22 | |
|---|---|---|---|---|---|---|---|---|---|---|
| 16(2)(c) | 11 | 16 | 13 | 22 | 23 | 55 | 82 | 112 | 15,804 | 85,566 |
| 19(1) | 11,544 | 11,057 | 14,579 | 18,388 | 22,526 | 25,880 | 38,816 | 49,212 | 42,519 | 51,105 |
| 17 | 24 | 13 | 53 | 100 | 187 | 547 | 1,635 | 32,935 | 28,170 | 38,595 |
| 16(1)(c) | 2,532 | 2,418 | 3,971 | 7,763 | 19,941 | 16,304 | 16,043 | 21,346 | 16,415 | 23,957 |
| 15(1) | N/A | N/A | 0 | 0 | 0 | 0 | 13,721 | 11,820 | 20,057 | 22,236 |
| Exemption | Description |
|---|---|
| 16(2)(c) | May refuse to disclose any record containing information that could facilitate the commission of an offence, including any information on the vulnerability of particular buildings or other structures or systems. |
| 19(1) | Shall refuse to disclose any record containing personal information. |
| 17 | May refuse to disclose any records containing information the disclosure could be expected to threaten the safety of individuals. |
| 16(1)(c) | May refuse to disclose any record containing information expected to be injurious to law enforcement and the conduct of lawful investigations. |
| 15(1) | May refuse to disclose any records containing information the disclosure could be injurious to the conduct of international affairs and defence. |
Exclusions
Figure 44 indicates that, over the last decade, the use of the five most frequently invoked exclusions by IRCC fluctuated. However, over this period, the most invoked exclusion by IRCC was 68(a), which relates to published material, other than material published under Part 2, or material available for purchase by the public.
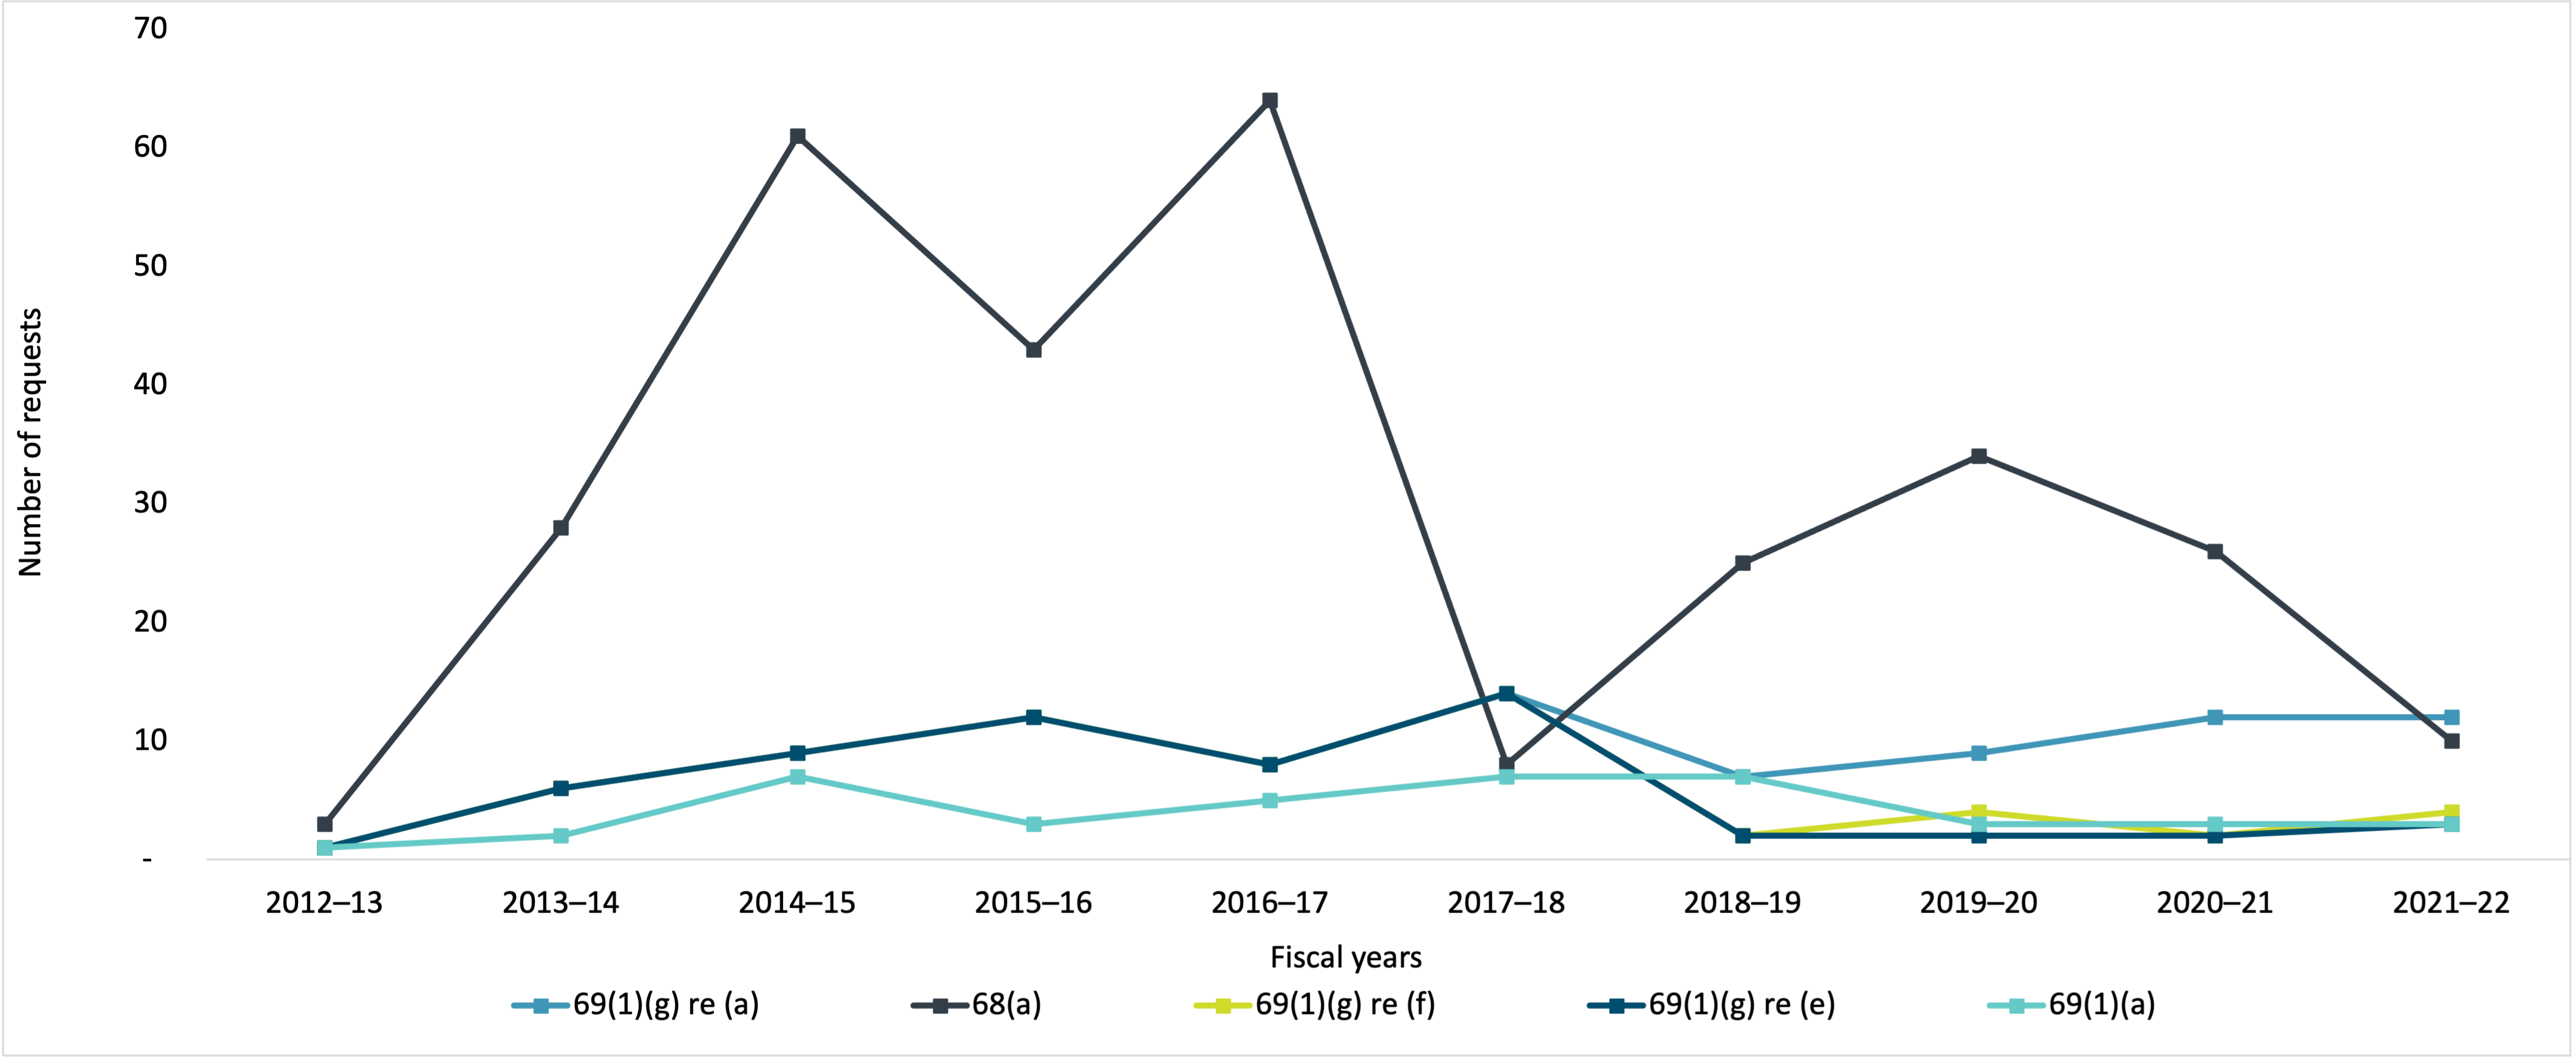
Figure 44 - Text version
| 2012–13 | 2013–14 | 2014–15 | 2015–16 | 2016–17 | 2017–18 | 2018–19 | 2019–20 | 2020–21 | 2021–22 | |
|---|---|---|---|---|---|---|---|---|---|---|
| 69(1)(g) re (a) | 1 | 6 | 9 | 12 | 8 | 14 | 7 | 9 | 12 | 12 |
| 68(a) | 3 | 28 | 61 | 43 | 64 | 8 | 25 | 34 | 26 | 10 |
| 69(1)(g) re (f) | 1 | 6 | 9 | 12 | 8 | 14 | 2 | 4 | 2 | 4 |
| 69(1)(g) re (e) | 1 | 6 | 9 | 12 | 8 | 14 | 2 | 2 | 2 | 3 |
| 69(1)(a) | 1 | 2 | 7 | 3 | 5 | 7 | 7 | 3 | 3 | 3 |
| Exemption | Description |
|---|---|
| 69(1)(g) re (a) | Does not apply to Cabinet confidences including records that contain information about the contents of any records pertaining to memoranda presenting proposals or recommendations. |
| 68(a) | Does not apply to published material, other than material published under Part 2, or material available for purchase by the public |
| 69(1)(g) re (f) | Does not apply to Cabinet confidences including records that contain information about the contents of any records pertaining to draft legislation. |
| 69(1)(g) re (e) | Does not apply to Cabinet confidences including records that contain information about the contents of any records pertaining to briefing materials relating to matters that are before or proposed to be brought before Council. |
| 69(1)(a) | Does not apply to Cabinet confidences including memoranda presenting proposals or recommendations. |
Fees and costs
The annual cost to administer IRCC’s access to information program was about $9.6 million in 2021–22.
| Description | Amount 2021–22 |
|---|---|
| Cost of IRCC operationsTable 6 note a | $9,607,654.00 |
| Total | $9,607,654.00 |
| Number of requests in which fees were collected | 176,814 |
| Fees collected | $735,665.00 |
| Number of requests in which fees were waived or refunded | 551 |
| Fees waived or refunded | $2,755.00 |
Table 6 Notes
|
|
Figure 45 indicates that, from 2012–13 to 2020–21, the annual cost to administer IRCC’s access to information program increased year to year to approximately $11.2 million in 2020–21. However, this cost decreased by 14.3% from 2020–21 to 2021–22.
Figure 45 indicates that over the last decade, the annual cost in actual dollars to administer IRCC’s access to information program has increased. However, the trend reversed in 2021-22.
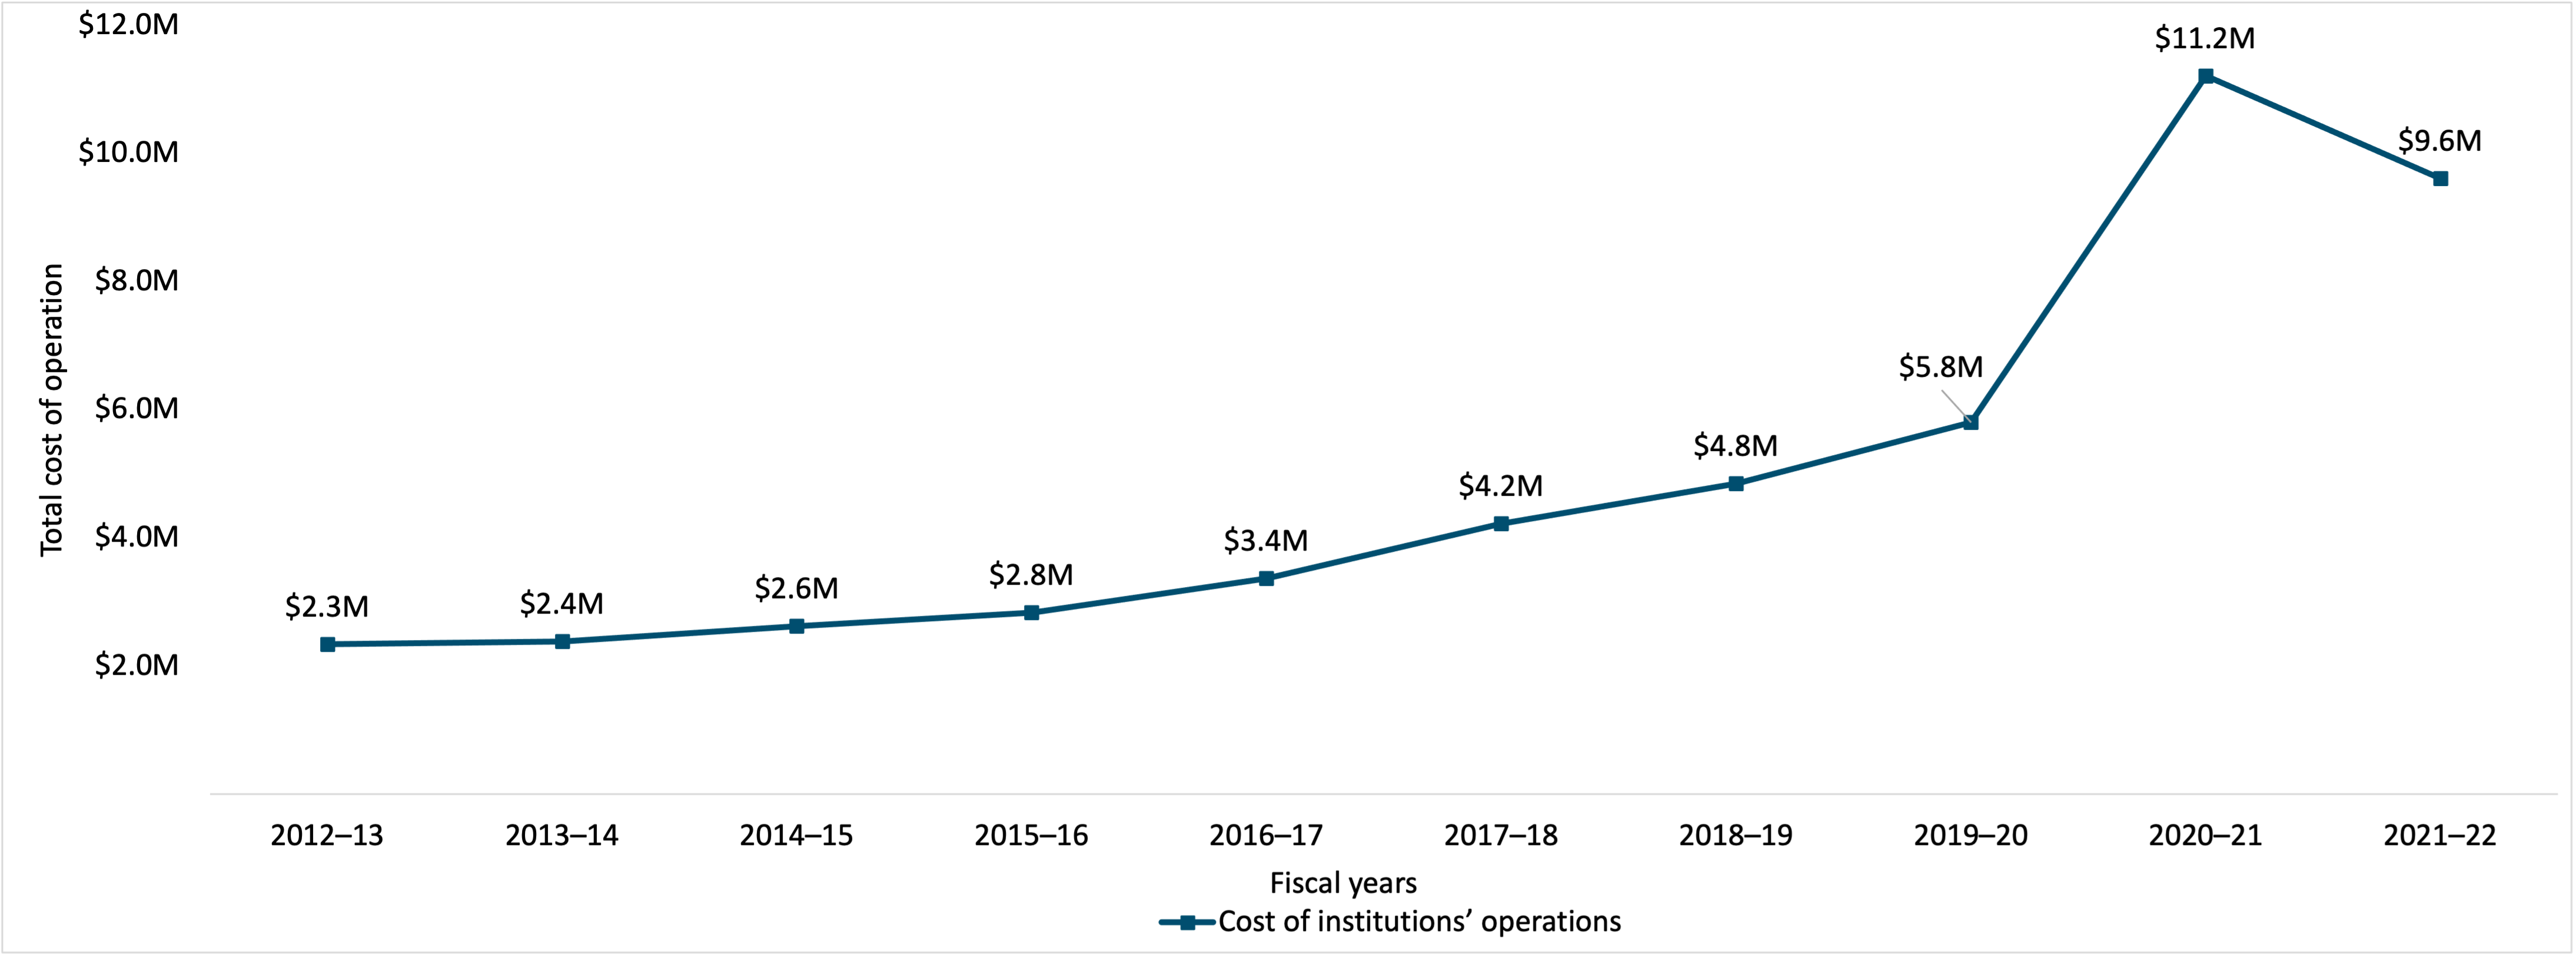
Figure 45 - Text version
| 2012–13 | 2013–14 | 2014–15 | 2015–16 | 2016–17 | 2017–18 | 2018–19 | 2019–20 | 2020–21 | 2021–22 | |
|---|---|---|---|---|---|---|---|---|---|---|
| Cost of institutions’ operations | $2,338,470 | $2,387,559 | $2,621,693 | $2,831,095 | $3,367,366 | $4,225,452 | $4,847,695 | $5,804,708 | $11,208,981 | $9,607,654 |
Figure 46 indicates that over the last decade, the total amount of fees collected has increased.
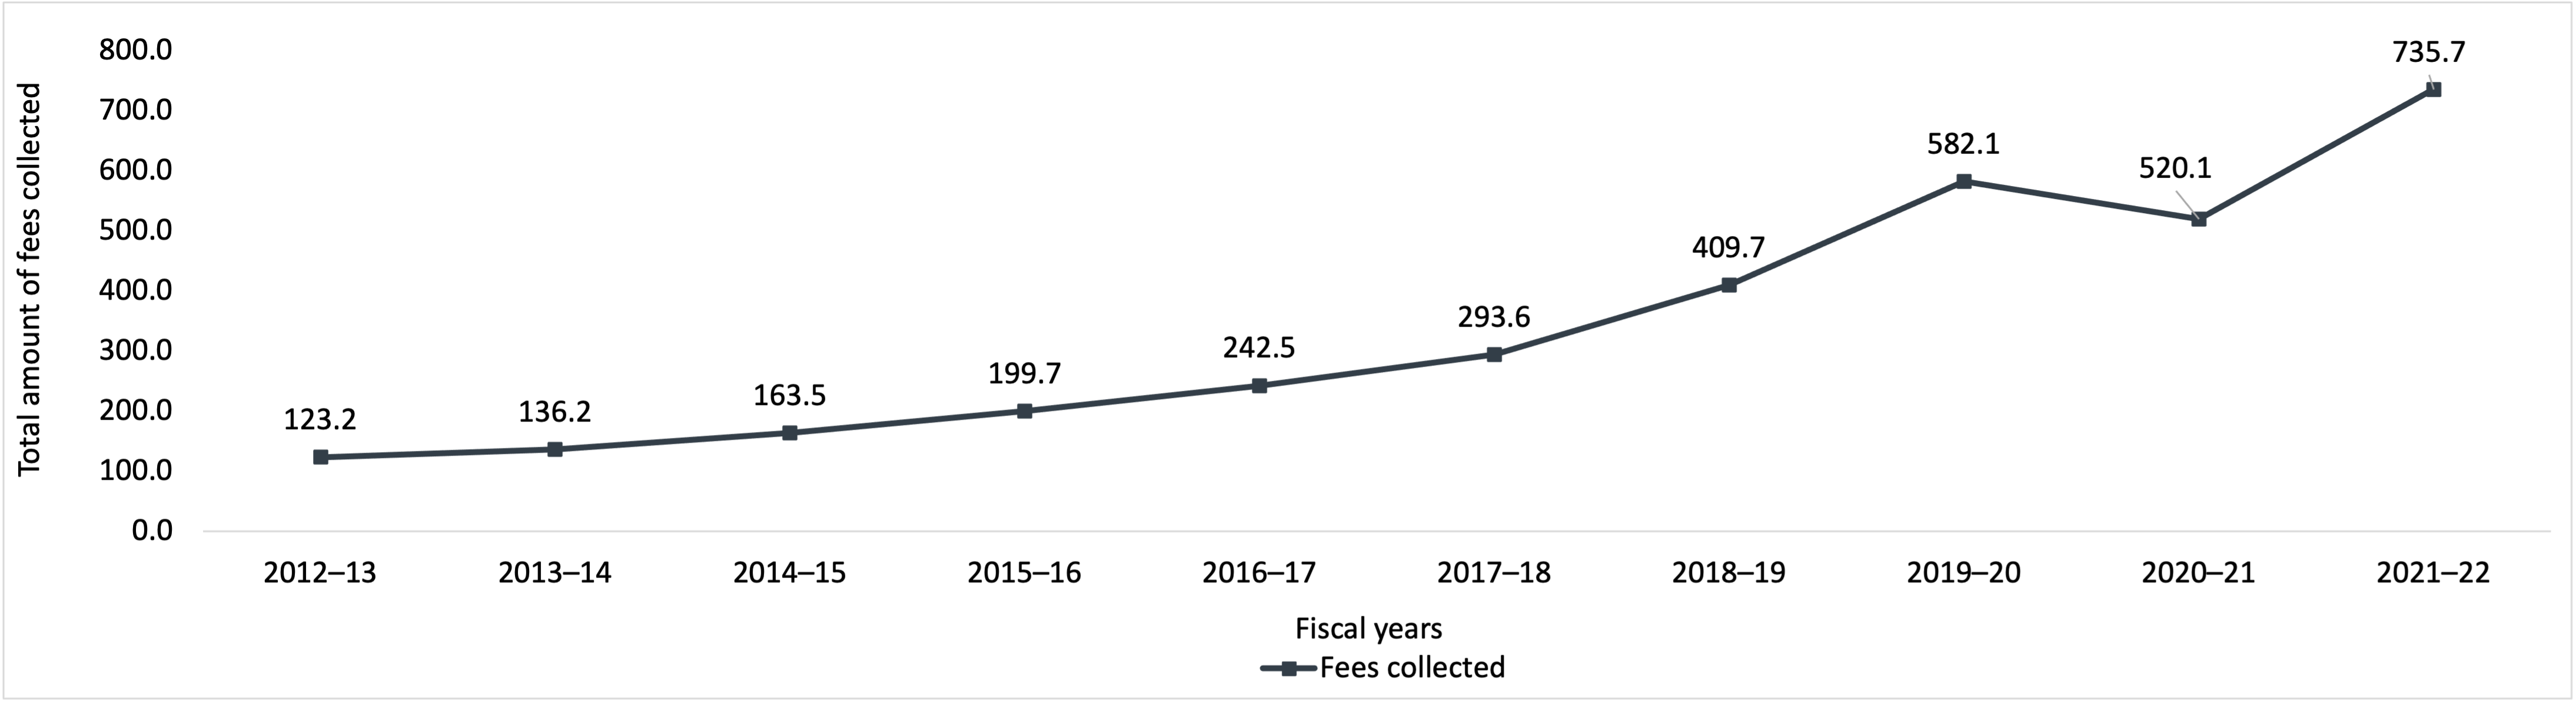
Figure 46 - Text version
| 2012–13 | 2013–14 | 2014–15 | 2015–16 | 2016–17 | 2017–18 | 2018–19 | 2019–20 | 2020–21 | 2021–22 | |
|---|---|---|---|---|---|---|---|---|---|---|
| Fees collected | $123,165 | $136,190 | $163,460 | $199,720 | $242,450 | $293,635 | $409,745 | $582,080 | $520,050 | $735,665 |
Figure 47 indicates that for the first five years of the decade, the total amount of fees waived or refunded by IRCC has decreased. However, the trend reversed since 2016-17.
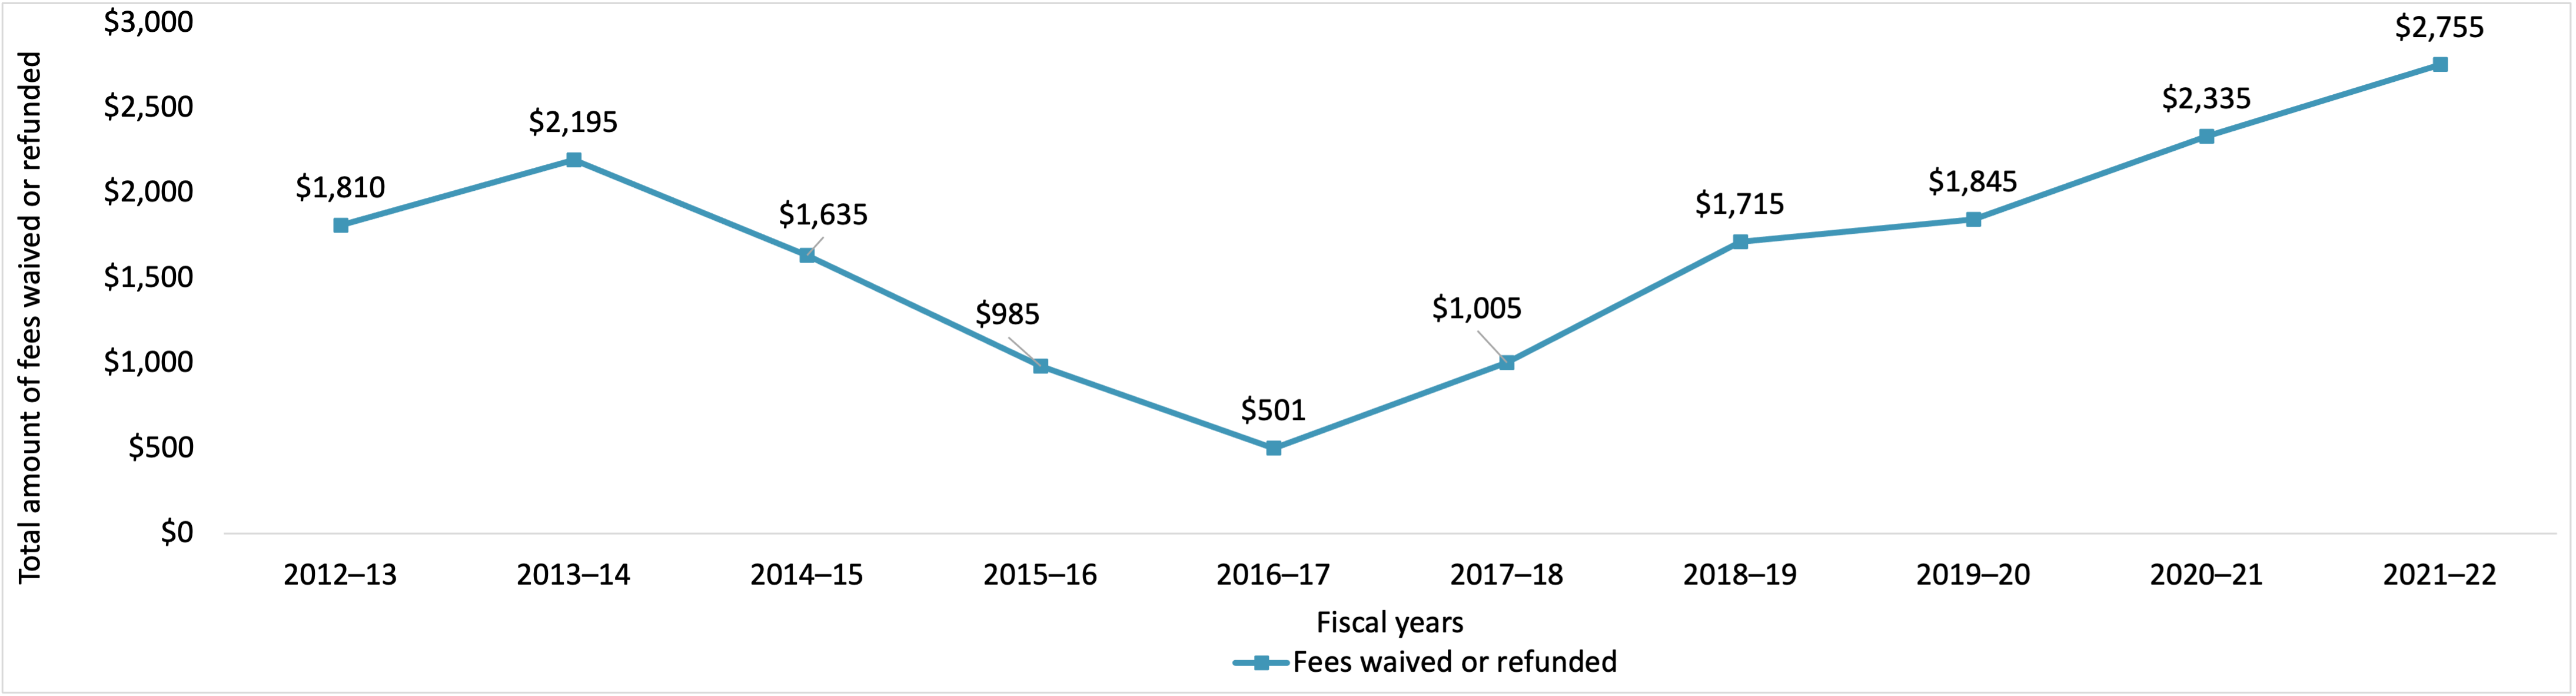
Figure 47 - Text version
| 2012–13 | 2013–14 | 2014–15 | 2015–16 | 2016–17 | 2017–18 | 2018–19 | 2019–20 | 2020–21 | 2021–22 | |
|---|---|---|---|---|---|---|---|---|---|---|
| Fees waived or refunded | $1,810 | $2,195 | $1,635 | $985 | $501 | $1,005 | $1,715 | $1,845 | $2,335 | $2,755 |
Informal requests for government information
Figure 48 indicates that over the last eight years, the overall annual volume of informal requests received by IRCC has increased.

Figure 48 - Text version
| 2014–15 | 2015–16 | 2016–17 | 2017–18 | 2018–19 | 2019–20 | 2020–21 | 2021–22 | |
|---|---|---|---|---|---|---|---|---|
| 1 to 30 days | 394 | 489 | 192 | 1,158 | 794 | 313 | 554 | 988 |
| 31 to 60 days | 207 | 137 | 115 | 173 | 318 | 306 | 242 | 1,437 |
| 61 to 120 days | 222 | 206 | 86 | 113 | 114 | 349 | 480 | 634 |
| 121 days or more | 76 | 68 | 99 | - | 28 | 109 | 603 | 94 |
Requests under the Privacy Act
When comparing the levels of personal information requests closed to personal information requests received by IRCC over the last decade, Figure 49 demonstrates that the number of personal information requests closed has not kept pace with the number of personal information requests received, except for 2018–19, where the number of requests closed surpassed the number of requests received. In 2021–22, IRCC received 26,806 personal information requests and carried over 8,100 personal information requests to 2022–23.
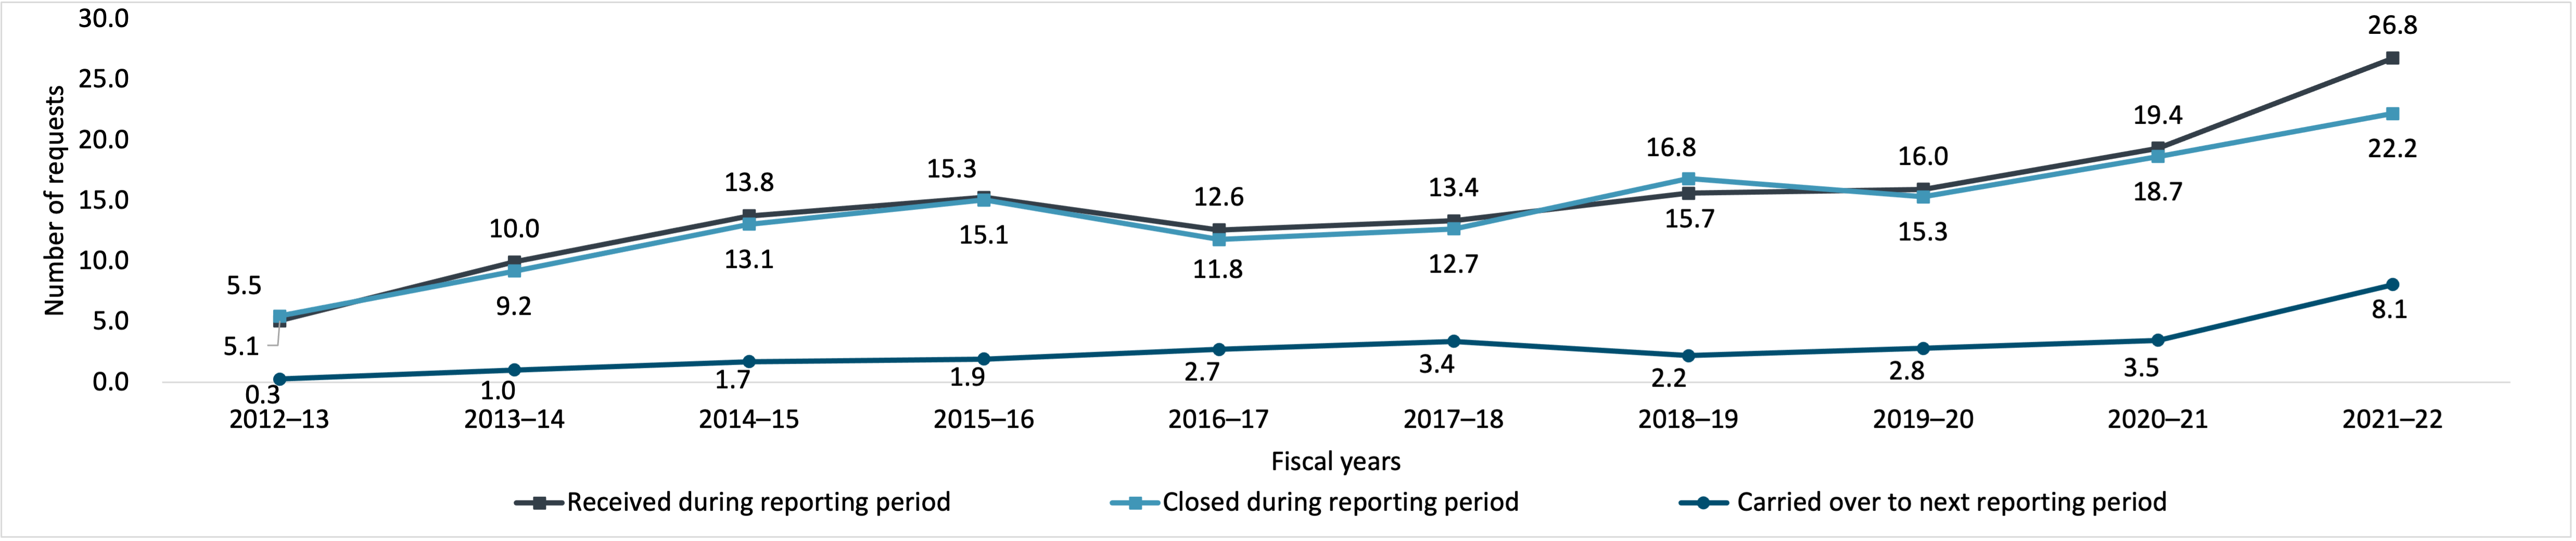
Figure 49 - Text version
| 2012–13 | 2013–14 | 2014–15 | 2015–16 | 2016–17 | 2017–18 | 2018–19 | 2019–20 | 2020–21 | 2021–22 | |
|---|---|---|---|---|---|---|---|---|---|---|
| Received during reporting period | 5,114 | 9,961 | 13,778 | 15,292 | 12,605 | 13,368 | 15,655 | 15,963 | 19,357 | 26,806 |
| Closed during reporting period | 5,486 | 9,225 | 13,082 | 15,077 | 11,808 | 12,698 | 16,846 | 15,349 | 18,687 | 22,220 |
| Carried over to next reporting period | 293 | 1,031 | 1,731 | 1,946 | 2,747 | 3,405 | 2,217 | 2,831 | 3,501 | 8,100 |
Figure 50 breaks down the number of personal information requests carried over to 2022–23 (8,100 requests) by the fiscal year of receipt, and by whether the personal information request is within legislated timelines or beyond legislated timelines as of March 31, 2022. Note that the numbers in Figure 50 are not cumulative from one fiscal year to the next, and that personal information requests carried over to 2022–23 are referred to as open personal information requests in this figure.
Figure 50 indicates that 73.3% of open personal information requests within IRCC were beyond legislated timelines as of March 31, 2022.
Figure 50 also tells quite a different story for IRCC as compared to the statistics of other institutions shown in Figure 19 above. Where other institutions are carrying significant numbers of open personal information requests dating back over multiple years, IRCC’s open requests are almost entirely from 2021–22, showing that IRCC does not have the same challenge as others with longstanding open requests over multiple years, and is largely successful in closing requests that are more than one year old.
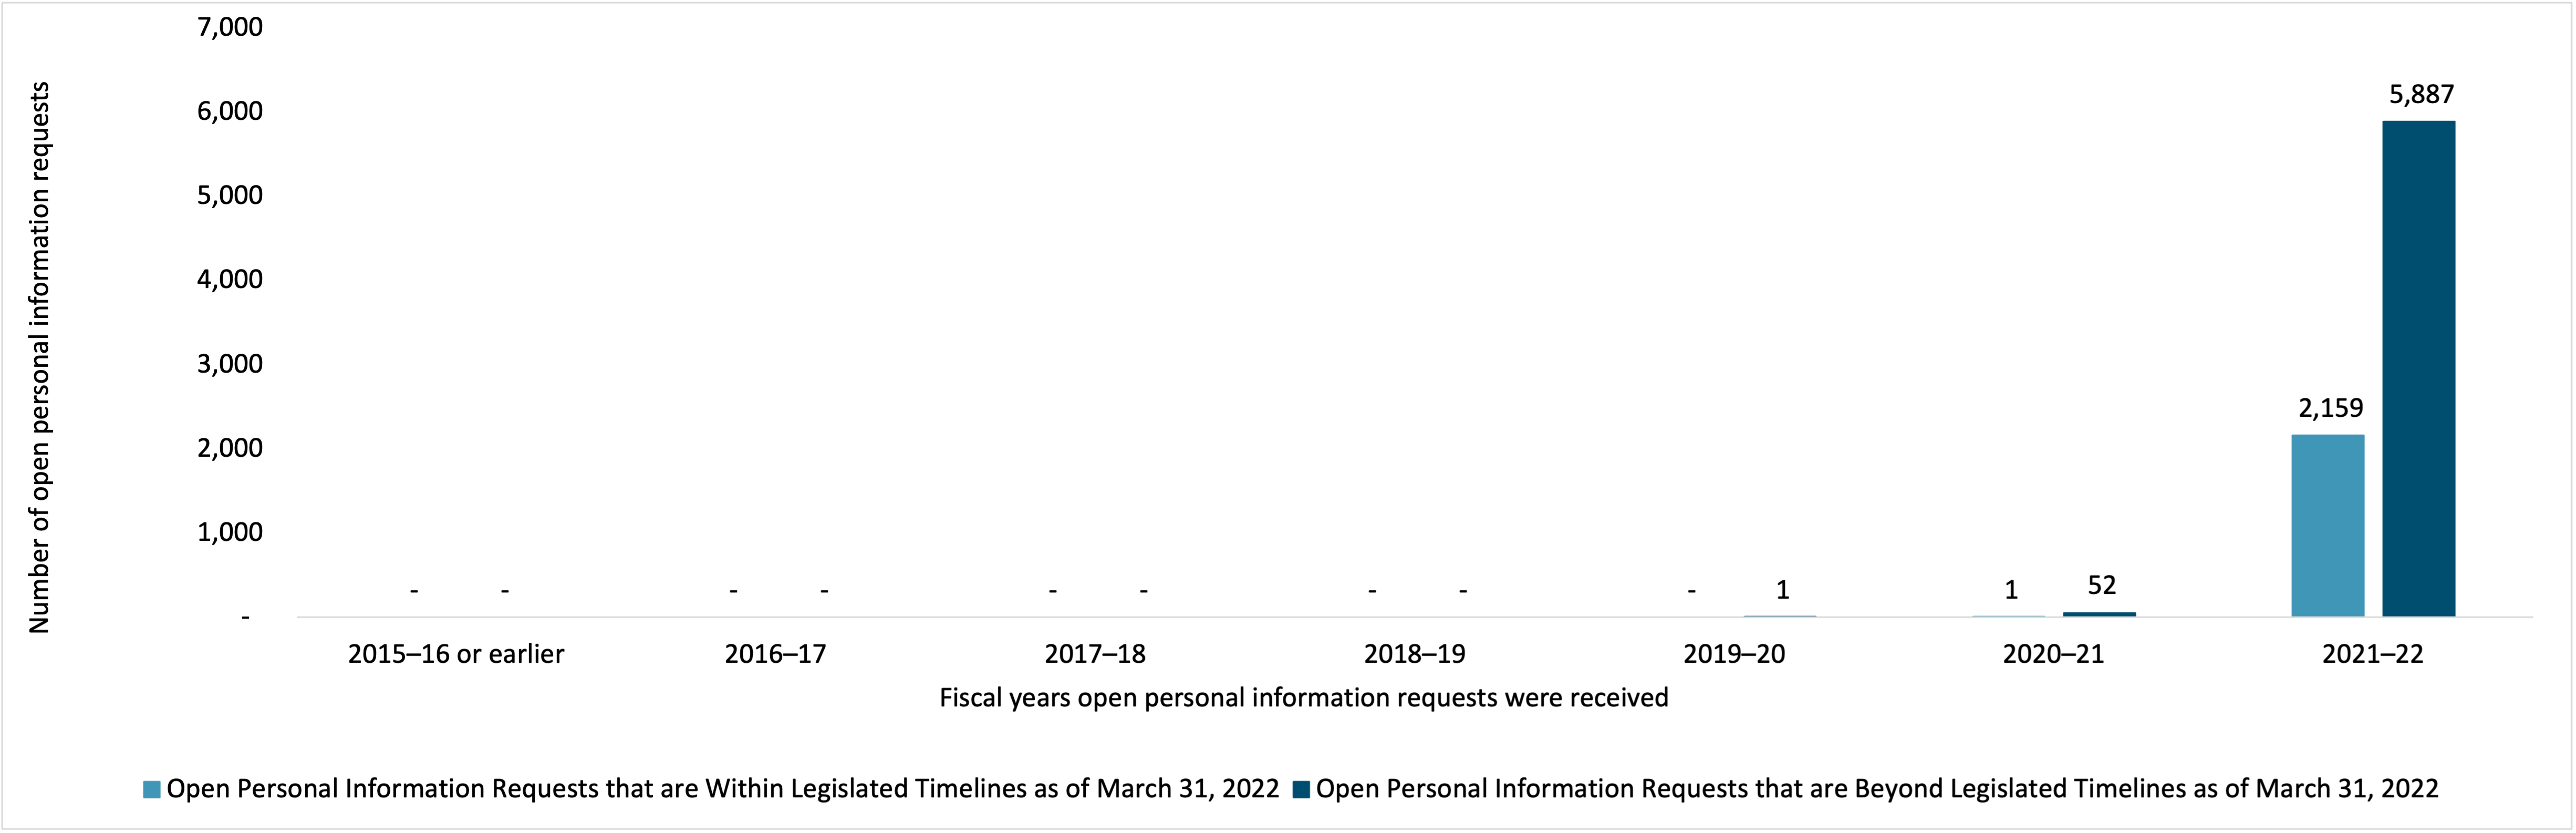
Figure 50 - Text version
| 2015–16 or earlier | 2016–17 | 2017–18 | 2018–19 | 2019–20 | 2020–21 | 2021–22 | |
|---|---|---|---|---|---|---|---|
| Open Personal Information Requests that are Within Legislated Timelines as of March 31, 2022 | - | - | - | - | - | 1 | 2,159 |
| Open Personal Information Requests that are Beyond Legislated Timelines as of March 31, 2022 | - | - | - | - | 1 | 52 | 5,887 |
Timeliness
In 2021–22, of the 22,220 personal information requests closed by IRCC, only 38% were closed within legislated timelines, including extensions. Figure 51 shows this is a significant drop from previous years, which were in the 55% to 85% range.
The open personal information requests beyond legislated timelines mean that requesters are being denied timely access and signify that the performance of the system, as measured by requests closed within legislated timelines, will be hindered until these open personal information requests are closed, even if all new personal information requests are closed within legislated timelines.
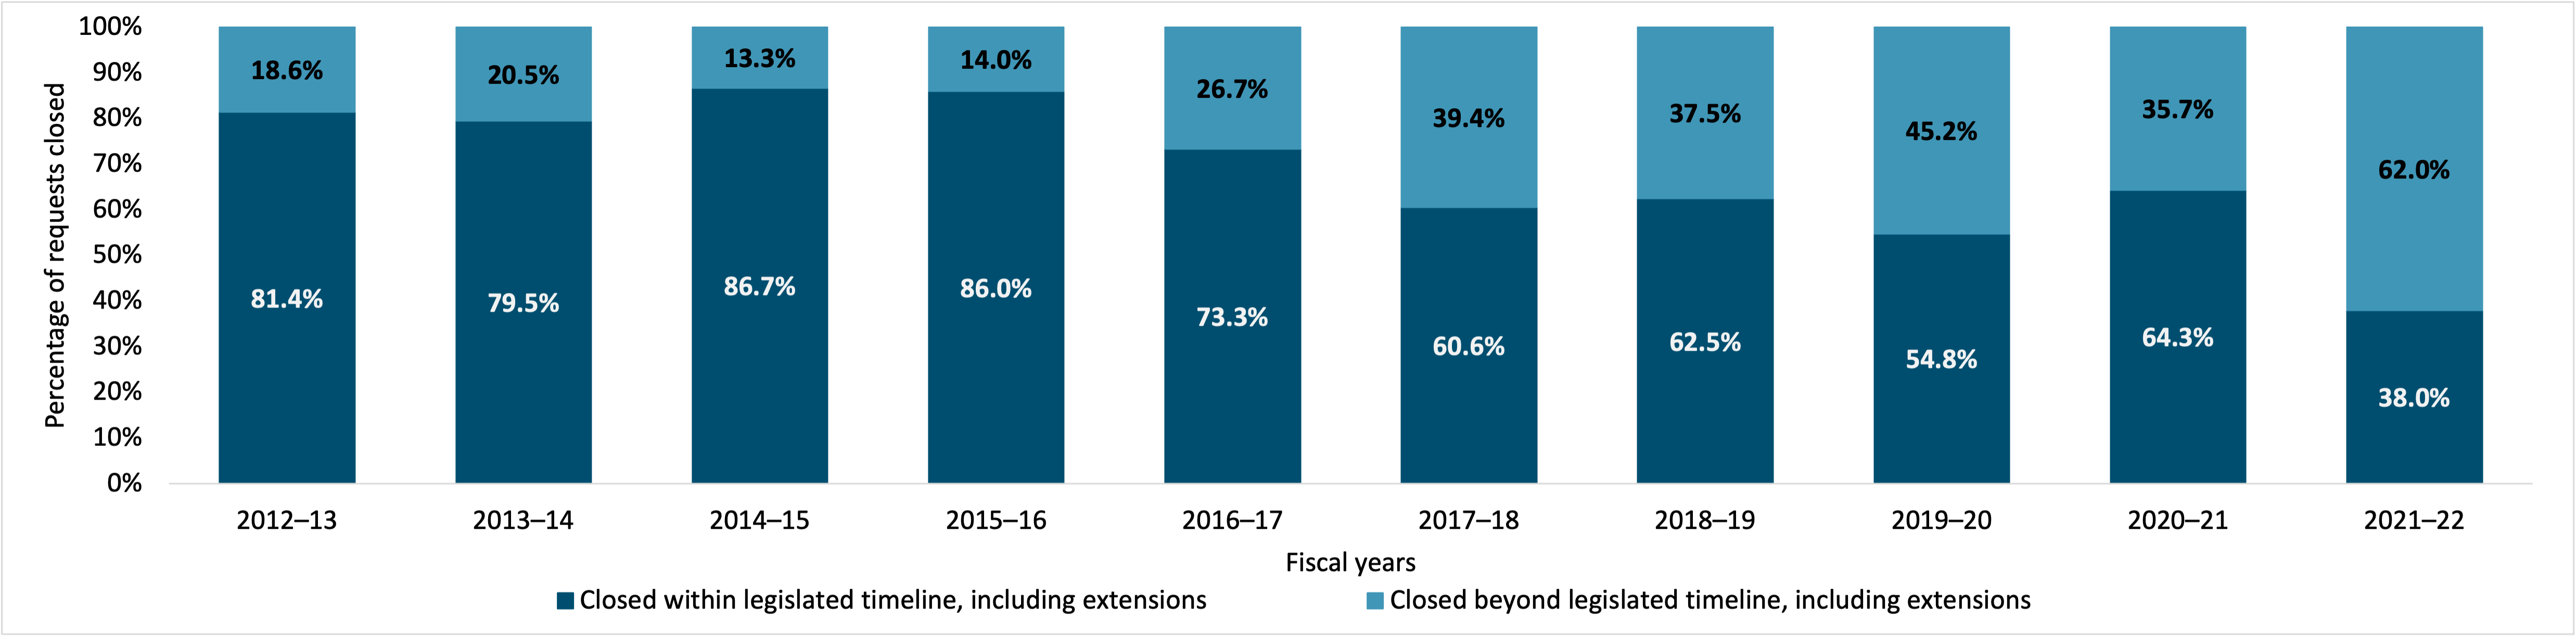
Figure 51 - Text version
| 2012–13 | 2013–14 | 2014–15 | 2015–16 | 2016–17 | 2017–18 | 2018–19 | 2019–20 | 2020–21 | 2021–22 | |
|---|---|---|---|---|---|---|---|---|---|---|
| Closed within legislated timeline, including extensions | 81.4% | 79.5% | 86.7% | 86.0% | 73.3% | 60.6% | 62.5% | 54.8% | 64.3% | 38.0% |
| Closed beyond legislated timeline, including extensions | 18.6% | 20.5% | 13.3% | 14.0% | 26.7% | 39.4% | 37.5% | 45.2% | 35.7% | 62.0% |
Figure 52 indicates, over the last decade, a similar tendency as Figure 51, with the percentage of personal information requests closed within the first 30 days trending downward with notable drops in 2017–18 and 2021–22. However, Figure 52 also shows that the percentage of requests closed within the first 60 days has stayed remarkably steady over the last ten years and dropping only slightly to 79.8% in 2021–22.
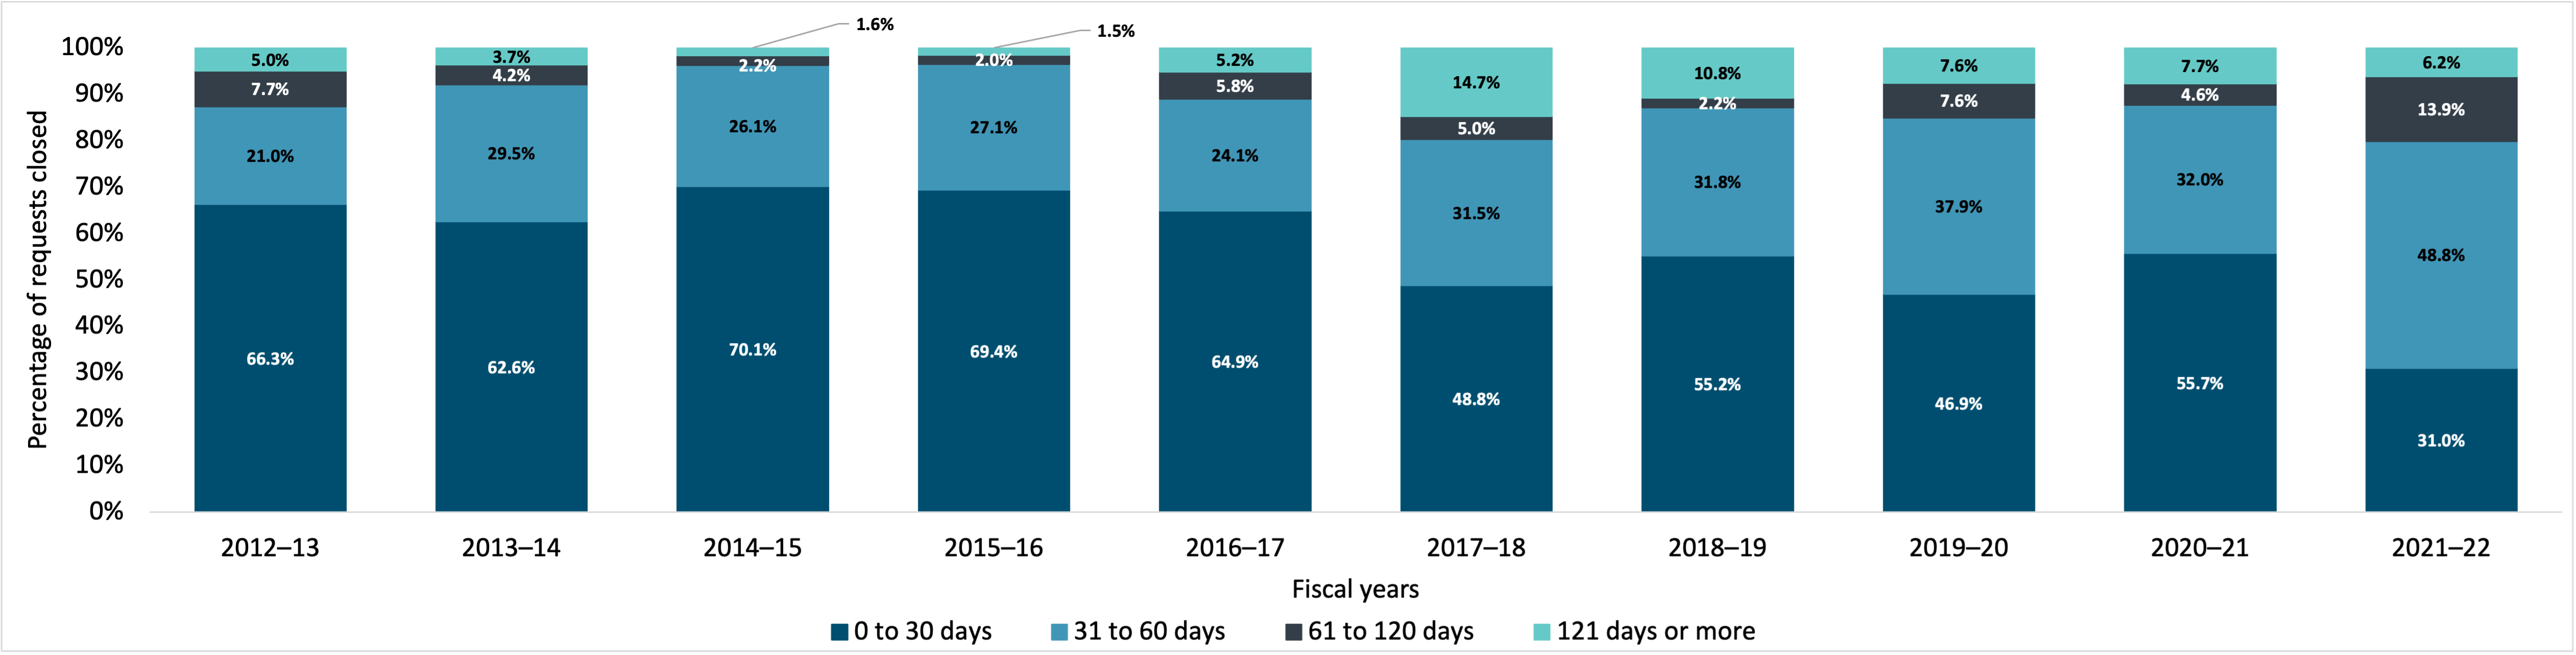
Figure 52 - Text version
| 2012–13 | 2013–14 | 2014–15 | 2015–16 | 2016–17 | 2017–18 | 2018–19 | 2019–20 | 2020–21 | 2021–22 | |
|---|---|---|---|---|---|---|---|---|---|---|
| 0 to 30 days | 66.3% | 62.6% | 70.1% | 69.4% | 64.9% | 48.8% | 55.2% | 46.9% | 55.7% | 31.0% |
| 31 to 60 days | 21.0% | 29.5% | 26.1% | 27.1% | 24.1% | 31.5% | 31.8% | 37.9% | 32.0% | 48.8% |
| 61 to 120 days | 7.7% | 4.2% | 2.2% | 2.0% | 5.8% | 5.0% | 2.2% | 7.6% | 4.6% | 13.9% |
| 121 days or more | 5.0% | 3.7% | 1.6% | 1.5% | 5.2% | 14.7% | 10.8% | 7.6% | 7.7% | 6.2% |
In terms of extensions taken on personal information requests closed by IRCC in 2021–22, 99.5% of all extensions taken cited paragraph 15(a)(ii) of the Privacy Act, relating to consultations, as a reason for the extension.
| Length of extensionTable 7 note a | 15(a)(i): interference with operations | 15(a)(ii): consultation | 15(b): translation purposes or conversion | Total | |||||
|---|---|---|---|---|---|---|---|---|---|
| Further review required to determine exemptions | Large volume of pages | Large volume of requests | Documents are difficult to obtain | Cabinet confidence (section 70)Table 7 note b | External | Internal | |||
| 1 to 15 days | 0 | 0 | 0 | 0 | 0 | 0 | 0 | 0 | 0 |
| 16 to 30 days | 0 | 0 | 5 | 0 | 0 | 1 | 1,232 | 0 | 1,238 |
| 31 days or greater | N/A | N/A | N/A | N/A | N/A | N/A | 0 | 0 | |
| Total | 0 | 0 | 5 | 0 | 0 | 1 | 1,232 | 0 | 1,238 |
Table 7 Notes
|
|||||||||
Figure 53 indicates that over the last decade, IRCC overwhelmingly cited “Workload” as the main reason that personal information requests were closed beyond legislated timelines, including extensions, with a low of 94.9% of all personal information requests closed beyond legislated timelines in 2012–13.
In addition, Figure 53 also indicates that, over the last decade, the overall annual volume of personal information requests closed beyond legislated timelines, including extensions, increased steadily, with a notable upward trend from 2015–16 to 2019–20, and more than doubling in 2021–22.
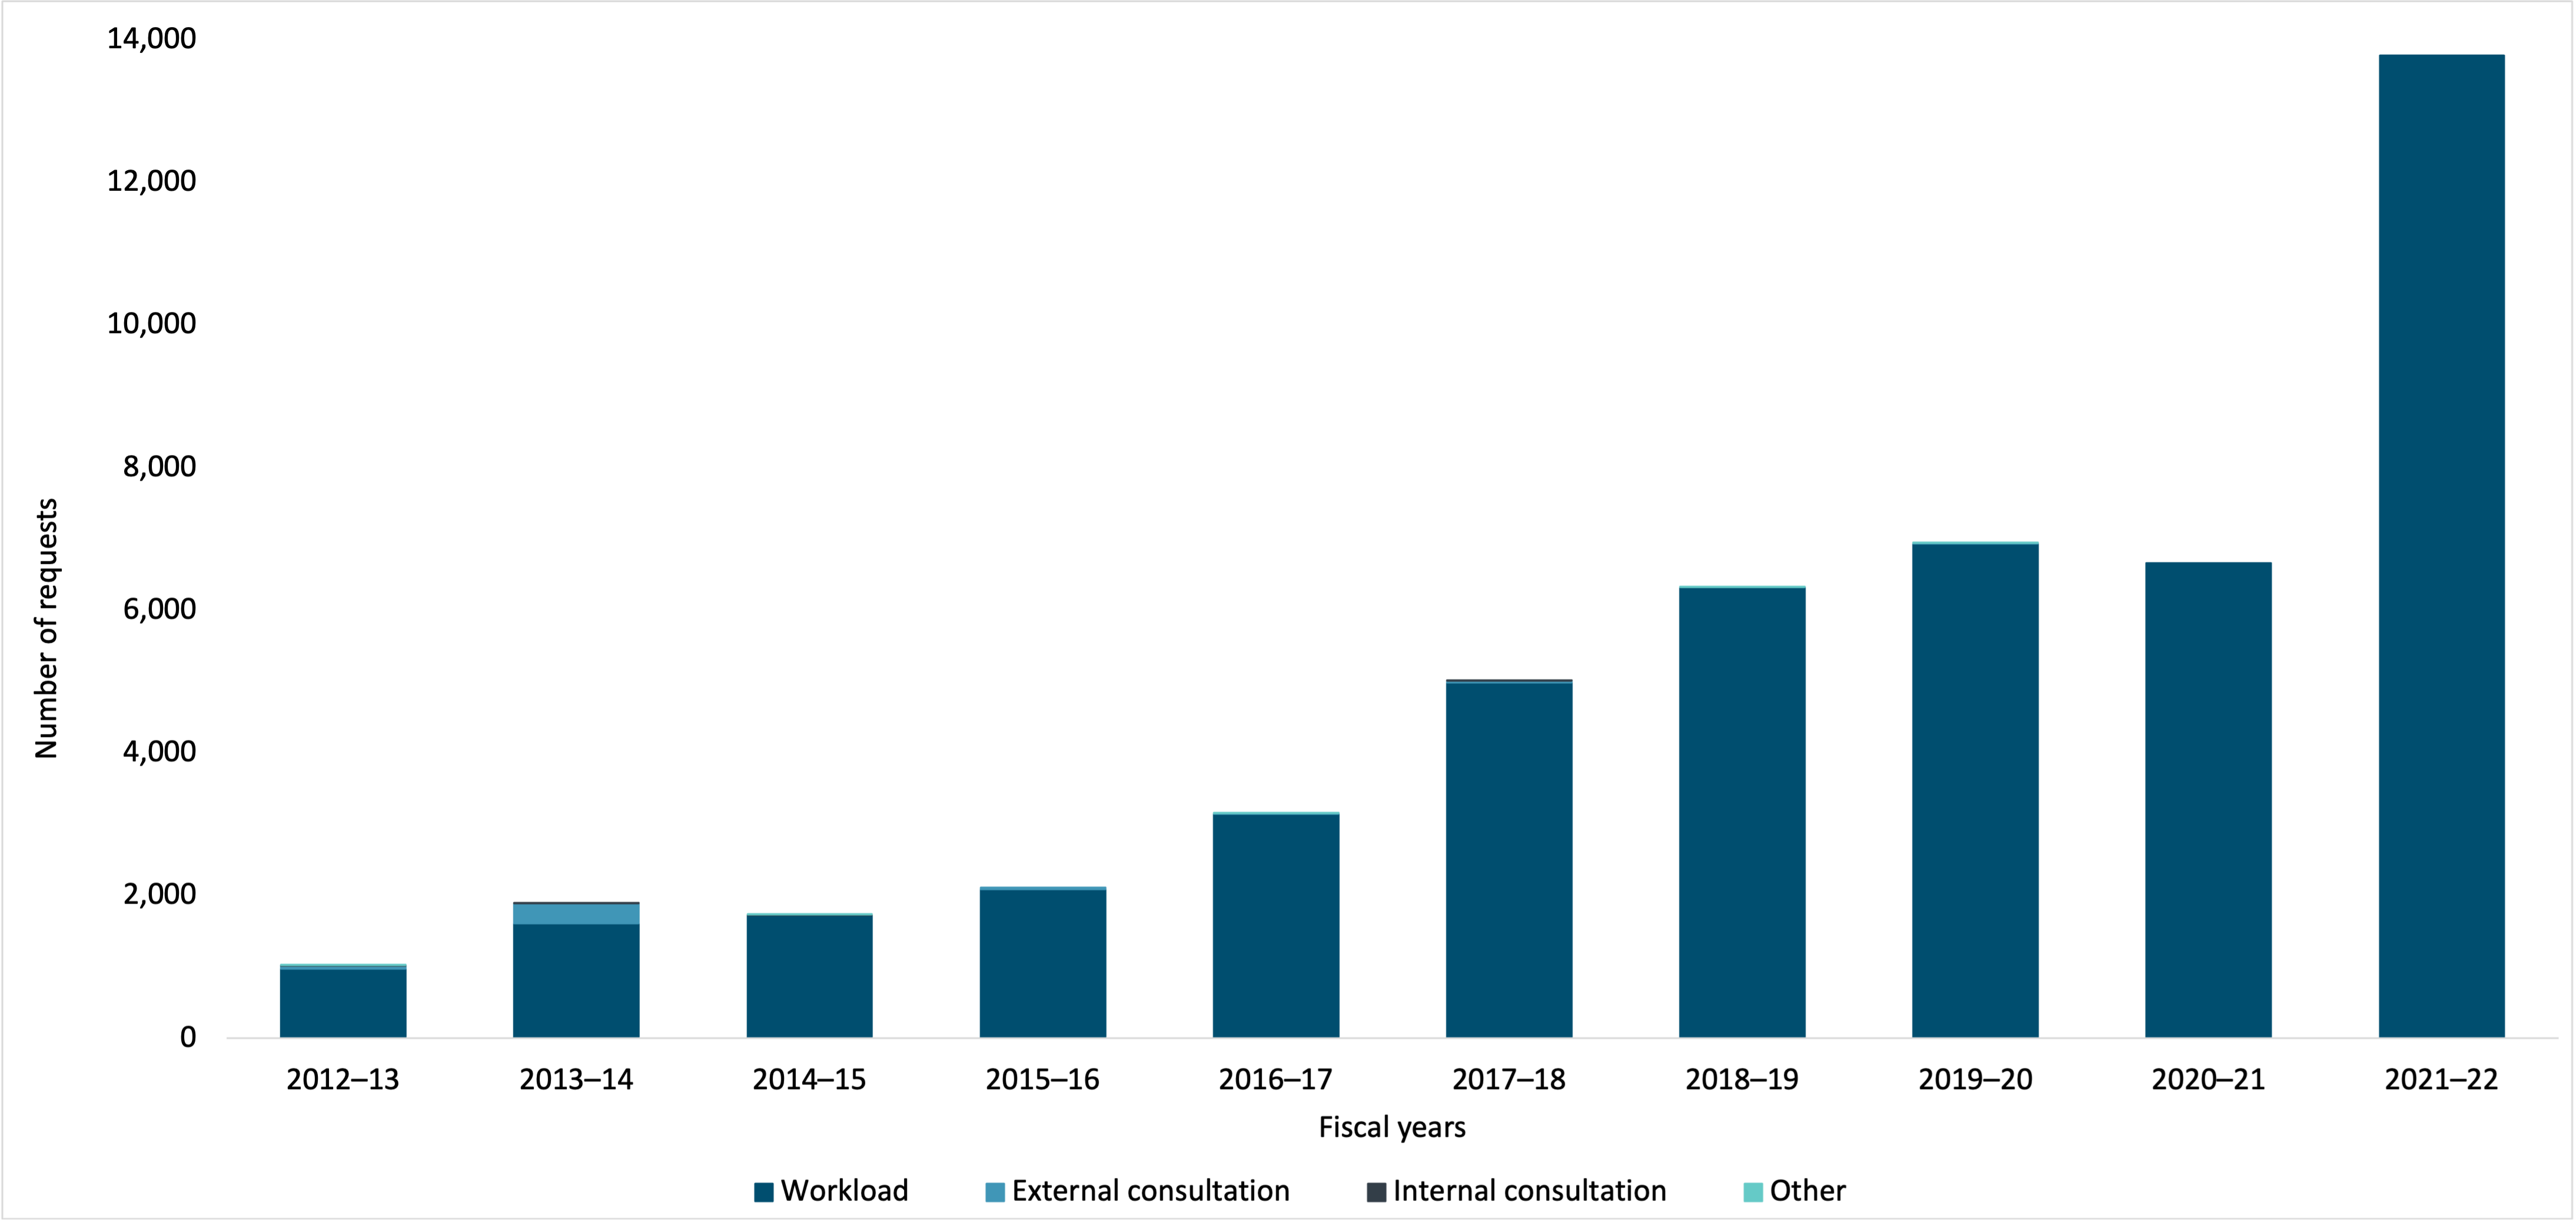
Figure 53 - Text version
| 2012–13 | 2013–14 | 2014–15 | 2015–16 | 2016–17 | 2017–18 | 2018–19 | 2019–20 | 2020–21 | 2021–22 | |
|---|---|---|---|---|---|---|---|---|---|---|
| Workload | 968 | 1,607 | 1,725 | 2,087 | 3,143 | 4,987 | 6,318 | 6,934 | 6,662 | 13,777 |
| External consultation | 41 | 281 | - | 24 | 4 | 19 | - | 3 | - | - |
| Internal consultation | 10 | 3 | 2 | - | 1 | 3 | - | - | - | - |
| Other | 1 | - | 8 | - | 1 | - | 2 | 2 | - | - |
Disposition
Records were all disclosed or disclosed in part in response to 78.4% of closed personal information requests in 2021–22.
Figure 54 indicates that the distribution of personal information requests closed in terms of the requests’ dispositions has remained relatively stable over the last decade, except for the dispositions “No records exist” and “Request abandoned”. The percentage of personal information requests closed by IRCC with the disposition “No records exist” has decreased over the same period and the percentage with the disposition “Request abandoned” increased but showed some variability year to year.
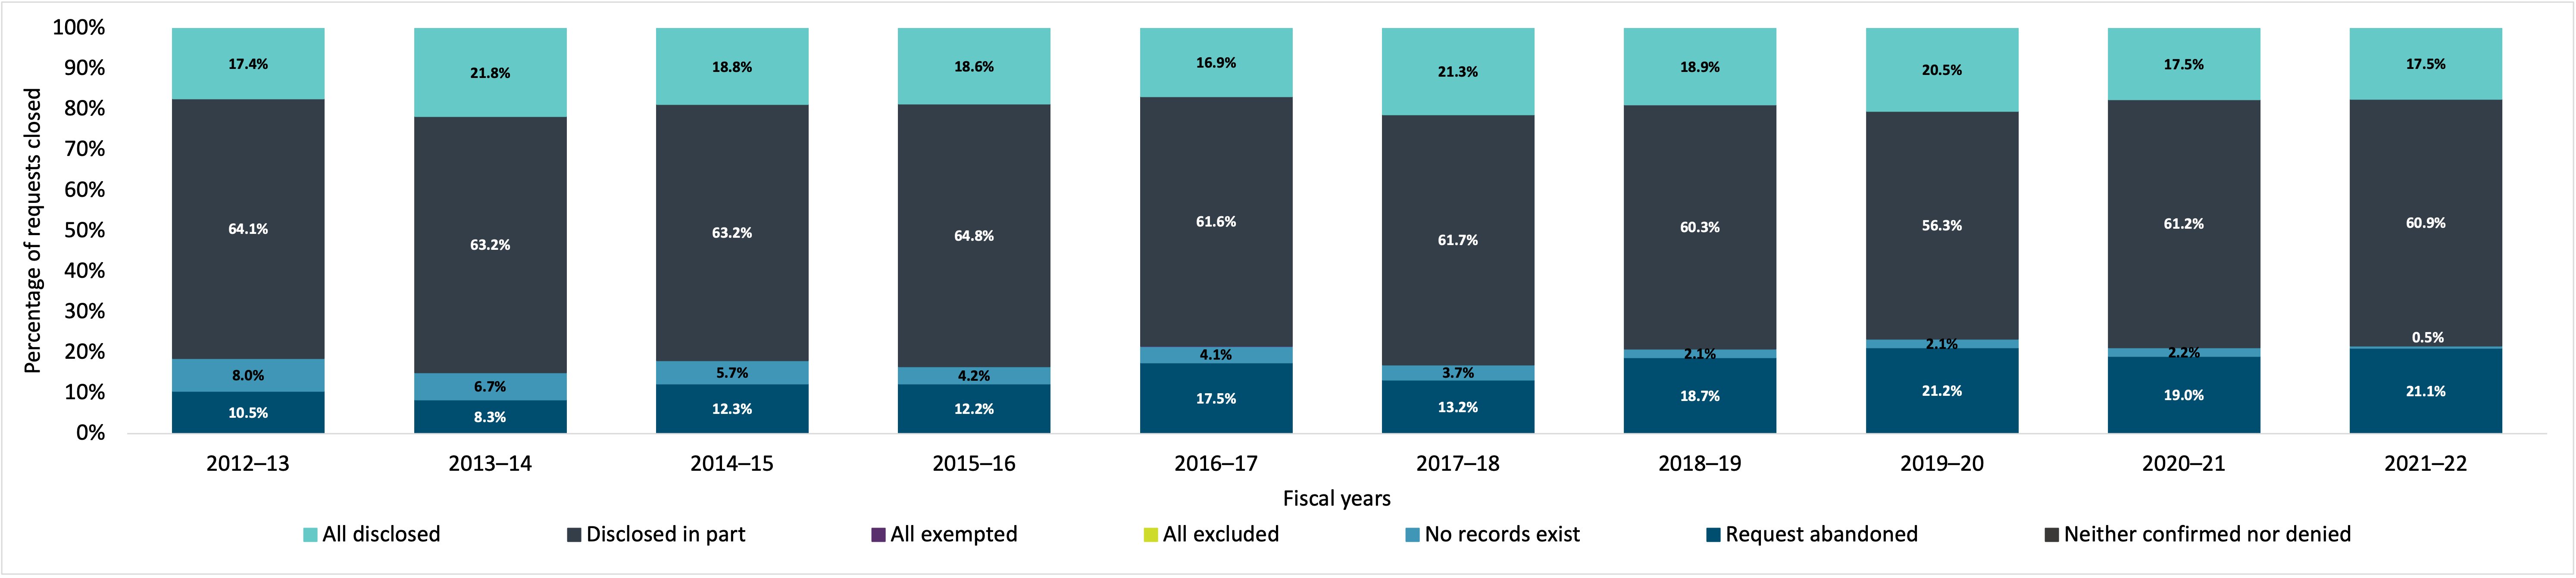
Figure 54 - Text version
| 2012–13 | 2013–14 | 2014–15 | 2015–16 | 2016–17 | 2017–18 | 2018–19 | 2019–20 | 2020–21 | 2021–22 | |
|---|---|---|---|---|---|---|---|---|---|---|
| All disclosed | 17.4% | 21.8% | 18.8% | 18.6% | 16.9% | 21.3% | 18.9% | 20.5% | 17.5% | 17.5% |
| Disclosed in part | 64.1% | 63.2% | 63.2% | 64.8% | 61.6% | 61.7% | 60.3% | 56.3% | 61.2% | 60.9% |
| All exempted | 0.0% | 0.0% | 0.0% | 0.0% | 0.0% | 0.0% | 0.0% | 0.0% | 0.0% | 0.0% |
| All excluded | 0.0% | 0.0% | 0.0% | 0.0% | 0.0% | 0.0% | 0.0% | 0.0% | 0.0% | 0.0% |
| No records exist | 8.0% | 6.7% | 5.7% | 4.2% | 4.1% | 3.7% | 2.1% | 2.1% | 2.2% | 0.5% |
| Request abandoned | 10.5% | 8.3% | 12.3% | 12.2% | 17.5% | 13.2% | 18.7% | 21.2% | 19.0% | 21.1% |
| Neither confirmed nor denied | 0.0% | 0.0% | 0.0% | 0.0% | 0.0% | 0.0% | 0.0% | 0.0% | 0.0% | 0.0% |
Complexity
Figure 55 indicates that, over the last decade, the number of pages processed by IRCC has increased. However, the last three years have been highly variable, likely due to COVID-related factors, and it is not yet possible to determine if the trendline from 2012–13 to 2018–19 has changed.
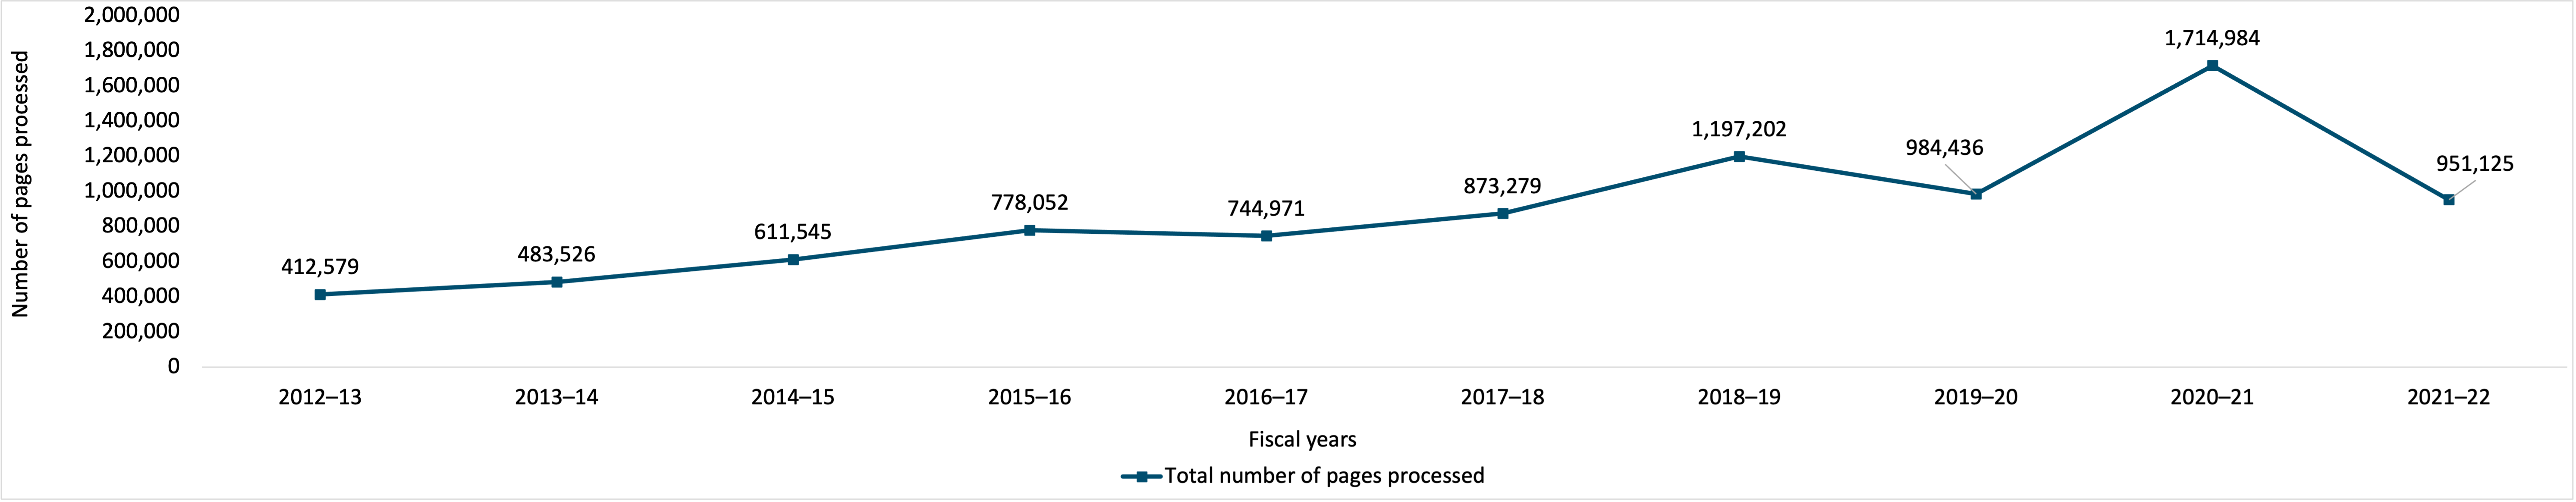
Figure 55 - Text version
| 2012–13 | 2013–14 | 2014–15 | 2015–16 | 2016–17 | 2017–18 | 2018–19 | 2019–20 | 2020–21 | 2021–22 | |
|---|---|---|---|---|---|---|---|---|---|---|
| Total number of pages processed | 412,579 | 483,526 | 611,545 | 778,052 | 744,971 | 873,279 | 1,197,202 | 984,436 | 1,714,984 | 951,125 |
Additional key aspects of complexity are requests that require consultation, where legal advice is sought or when personal information of others is interwoven throughout the records.
Figures 56 indicates that, for the first two years of the decade, most complex personal information requests were due to “Other”. However, for the remainder of the decade, the percentage of complex personal information requests due to “Other” dropped to 0%. In addition, Figure 56 also indicates that, from 2014–15 to 2017–18, almost all complex personal information requests were due to “Consultation required”. This shifted again in 2018–19 to 2021–22, when 91% to 100% of complex personal information requests were due to “Interwoven information”.
In addition, Figure 56 also indicates that, over the last decade, the overall annual volume of complex personal information requests was quite low until 2018–19, when they moved from the low hundreds up to almost 8,000 and held steady there for the last four years. In 2021–22, there were 7,433 complex personal information requests.
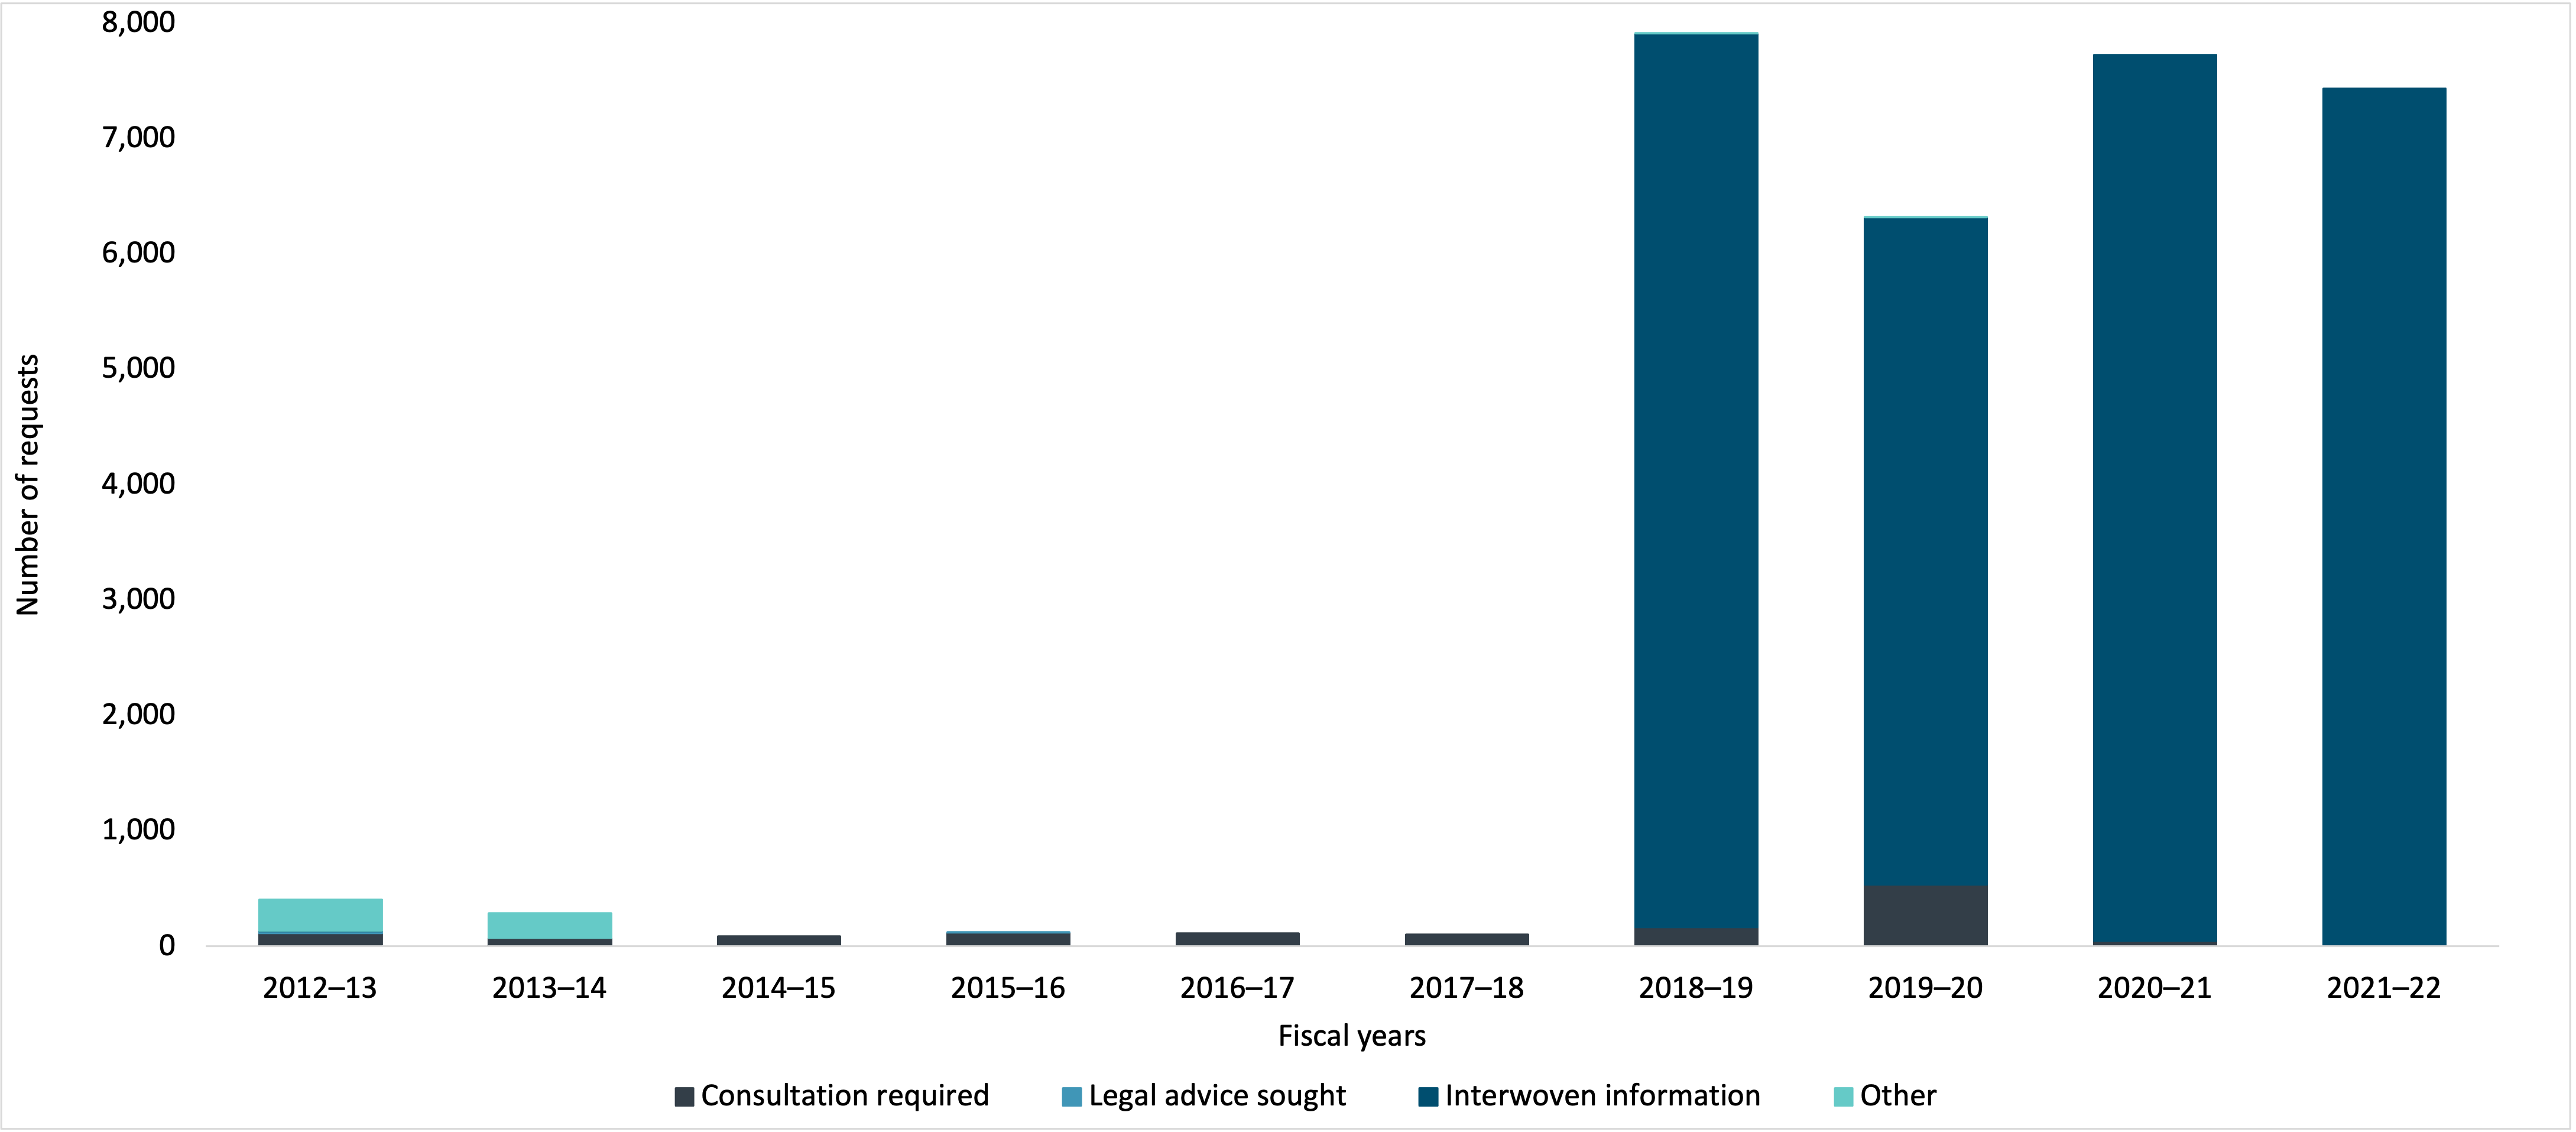
Figure 56 - Text version
| 2012–13 | 2013–14 | 2014–15 | 2015–16 | 2016–17 | 2017–18 | 2018–19 | 2019–20 | 2020–21 | 2021–22 | |
|---|---|---|---|---|---|---|---|---|---|---|
| Consultation required | 112 | 71 | 87 | 117 | 111 | 102 | 166 | 532 | 44 | 5 |
| Legal advice sought | 18 | - | - | 2 | - | - | - | - | - | - |
| Interwoven information | 1 | - | - | - | - | - | 7,744 | 5,783 | 7,679 | 7,428 |
| Other | 274 | 218 | - | - | - | - | 3 | 2 | - | - |
Consultations between IRCC and federal institutions
Figure 57 indicates that over the last decade, the number of personal information requests for consultation received by IRCC fluctuated between 26 and 49, averaging 39 per year. An almost identical trend is observed in the number of personal information requests for consultation closed by IRCC, showing that IRCC has largely succeeded in closing requests for consultation in the same year that they were received.
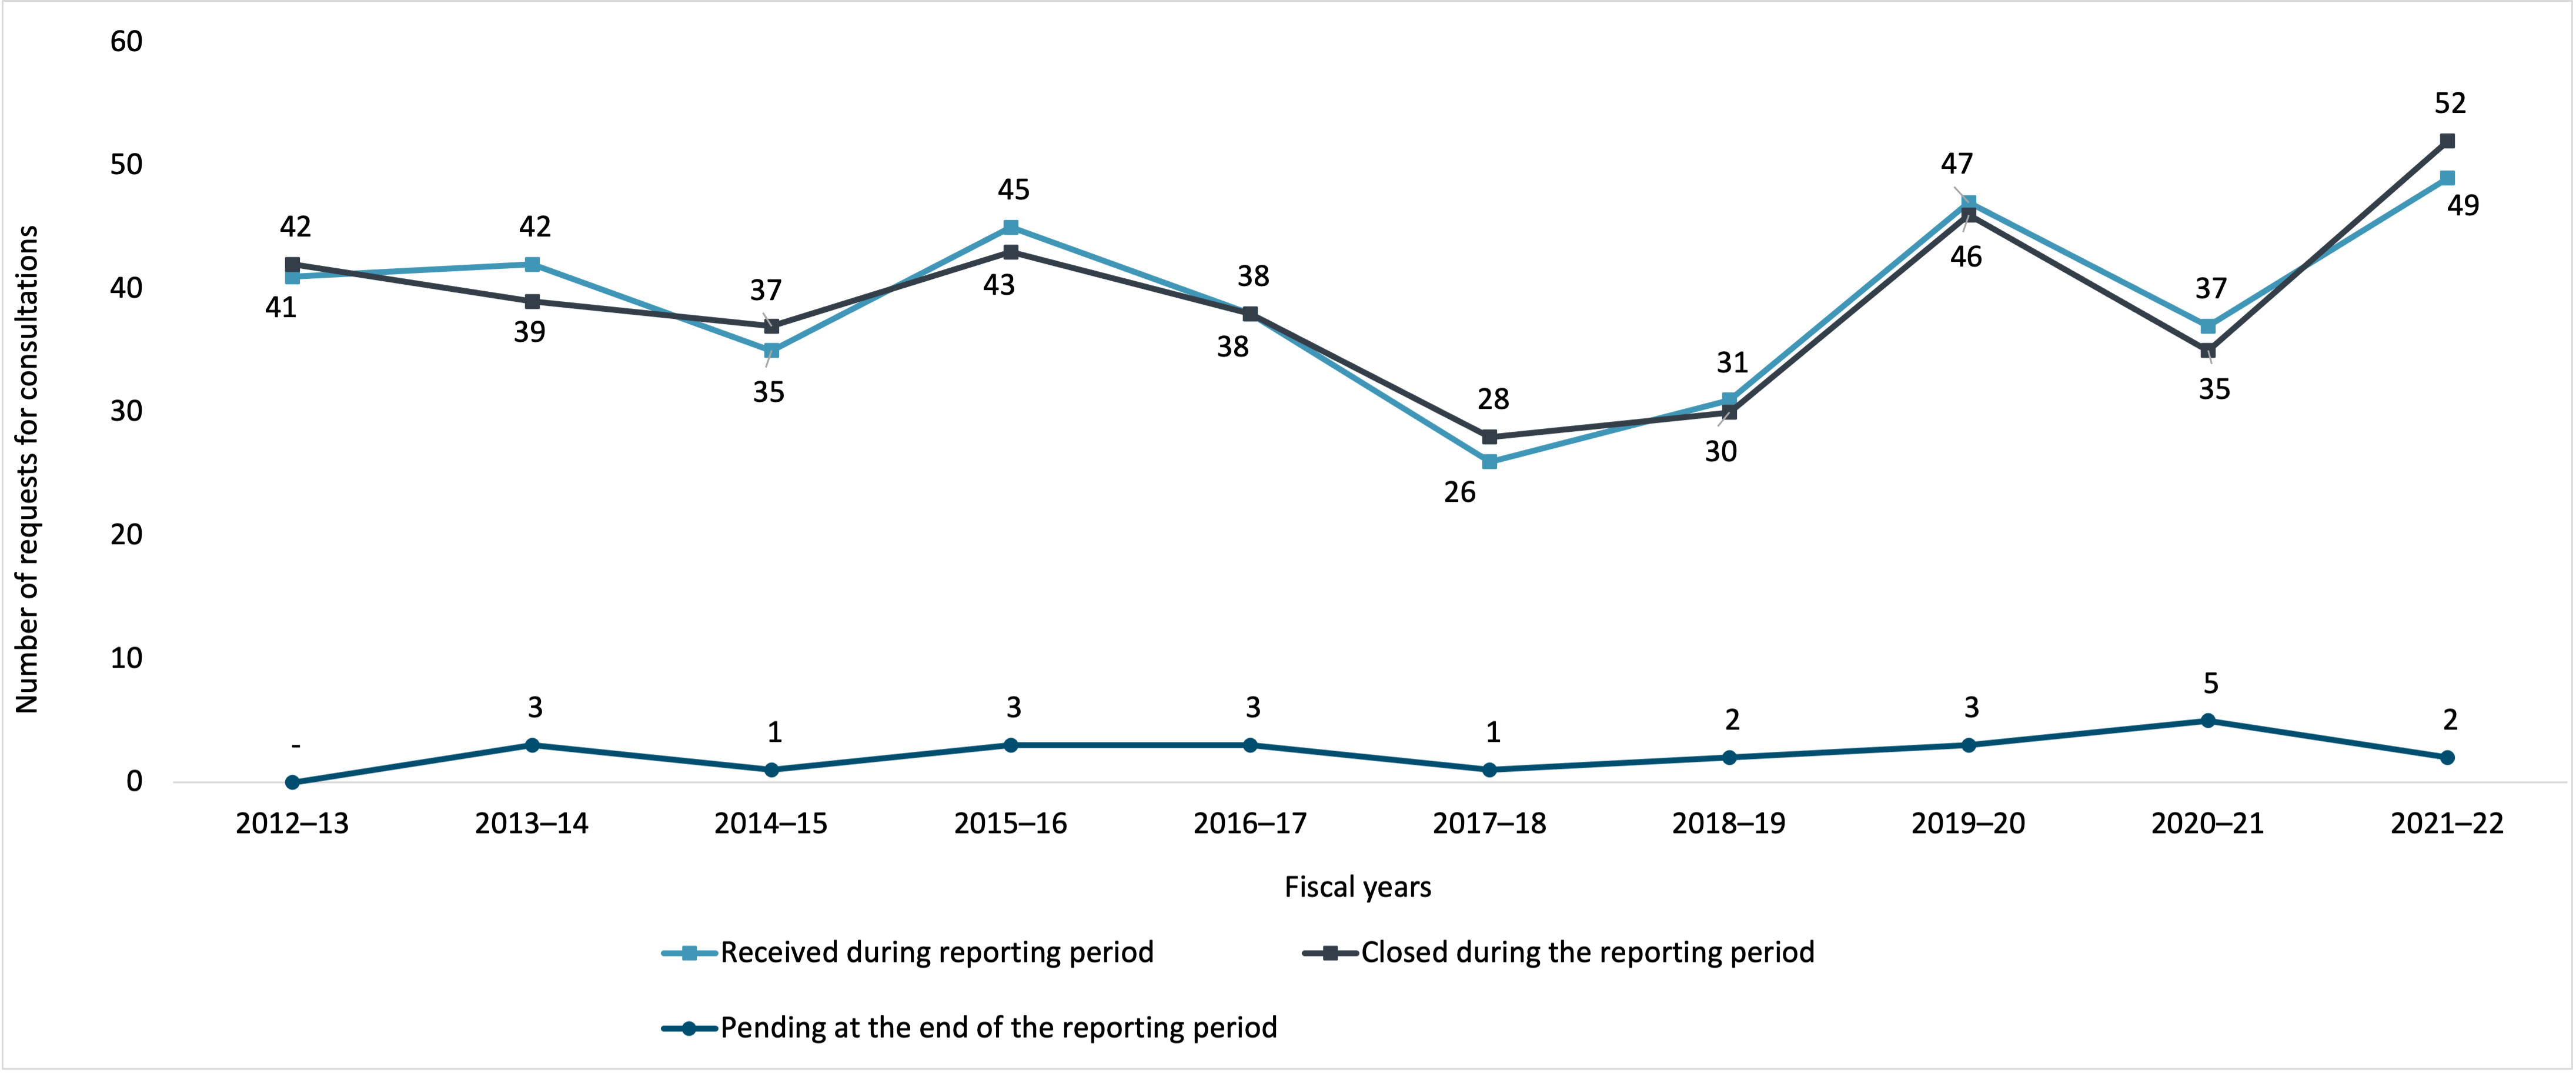
Figure 57 - Text version
| 2012–13 | 2013–14 | 2014–15 | 2015–16 | 2016–17 | 2017–18 | 2018–19 | 2019–20 | 2020–21 | 2021–22 | |
|---|---|---|---|---|---|---|---|---|---|---|
| Received during reporting period | 41 | 42 | 35 | 45 | 38 | 26 | 31 | 47 | 37 | 49 |
| Closed during the reporting period | 42 | 39 | 37 | 43 | 38 | 28 | 30 | 46 | 35 | 52 |
| Pending at the end of the reporting period | - | 3 | 1 | 3 | 3 | 1 | 2 | 3 | 5 | 2 |
Figure 58 indicates that for the first six years of the decade, the percentage of consultations closed within 30 days by IRCC has decreased. However, from 2017–18 to 2021–22, performance improved to 80% or better. Even in 2021–22, when consultations closed within 30 days dropped to 59.6%, those closed within 60 days totaled 90.4%, exceeding every other year except 2019–20 when 97.9% were closed within 60 days.
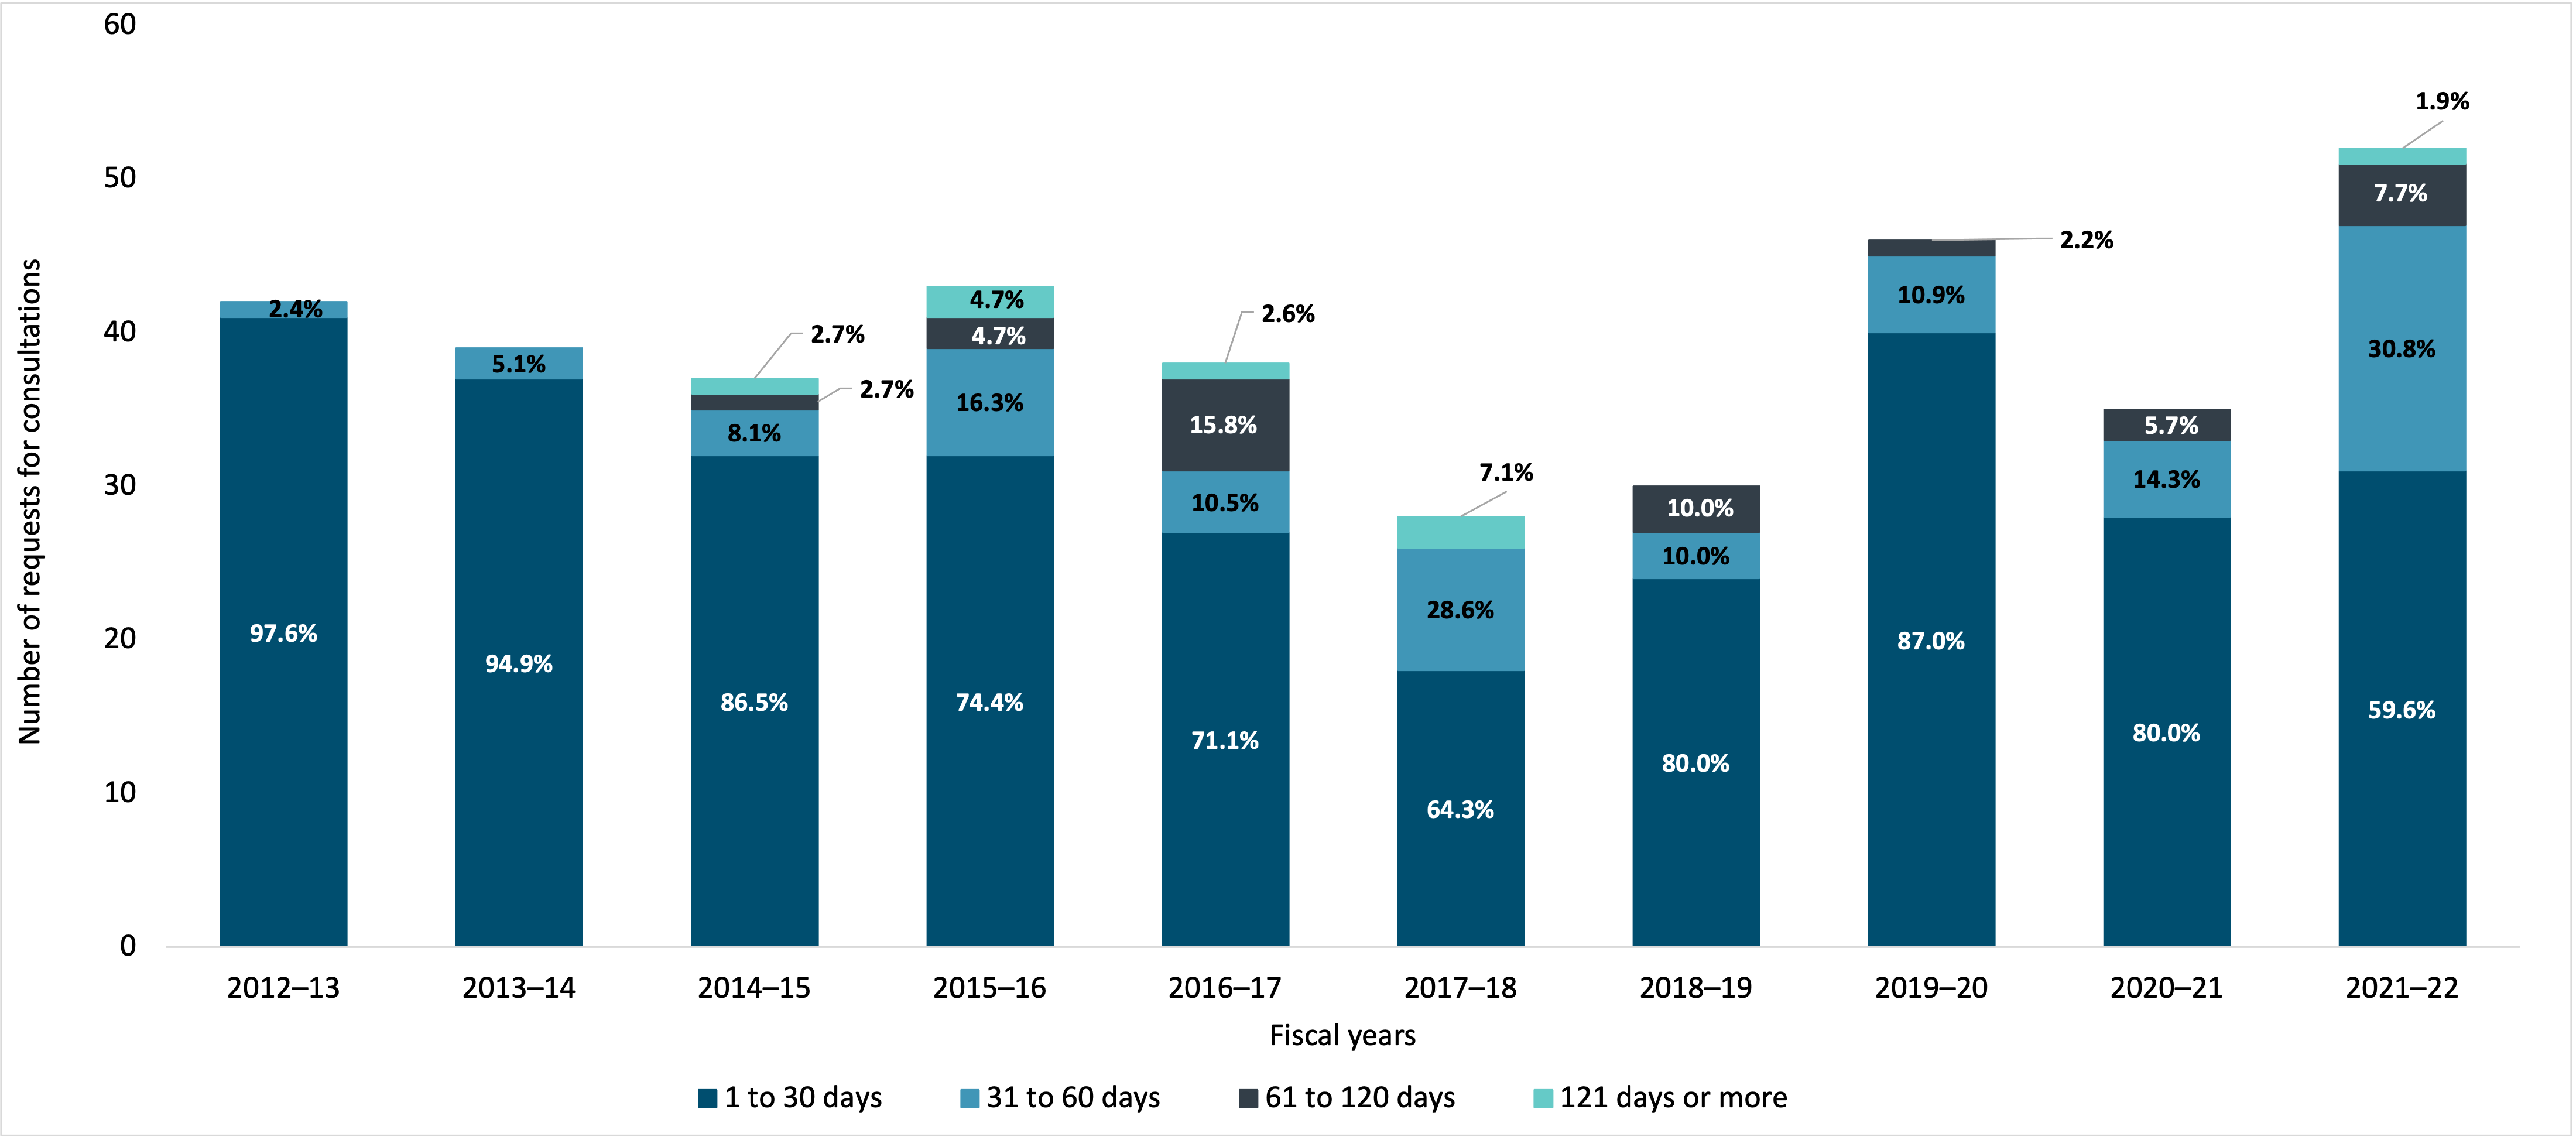
Figure 58 - Text version
| 2012–13 | 2013–14 | 2014–15 | 2015–16 | 2016–17 | 2017–18 | 2018–19 | 2019–20 | 2020–21 | 2021–22 | |
|---|---|---|---|---|---|---|---|---|---|---|
| 1 to 30 days | 41 | 37 | 32 | 32 | 27 | 18 | 24 | 40 | 28 | 31 |
| 31 to 60 days | 1 | 2 | 3 | 7 | 4 | 8 | 3 | 5 | 5 | 16 |
| 61 to 120 days | - | - | 1 | 2 | 6 | - | 3 | 1 | 2 | 4 |
| 121 days or more | - | - | 1 | 2 | 1 | 2 | - | - | - | 1 |
Exemptions
Figure 59 indicates that, over the last decade, the use of three of the five most frequently invoked exemptions by IRCC gradually increased. The exceptions were a decrease in the use of section 25, which was only significantly used in 2012–13, and section 19(1)(a), use of which has remained very low overall. The exemptions that experienced the biggest increases over this period were section 21 and section 26.
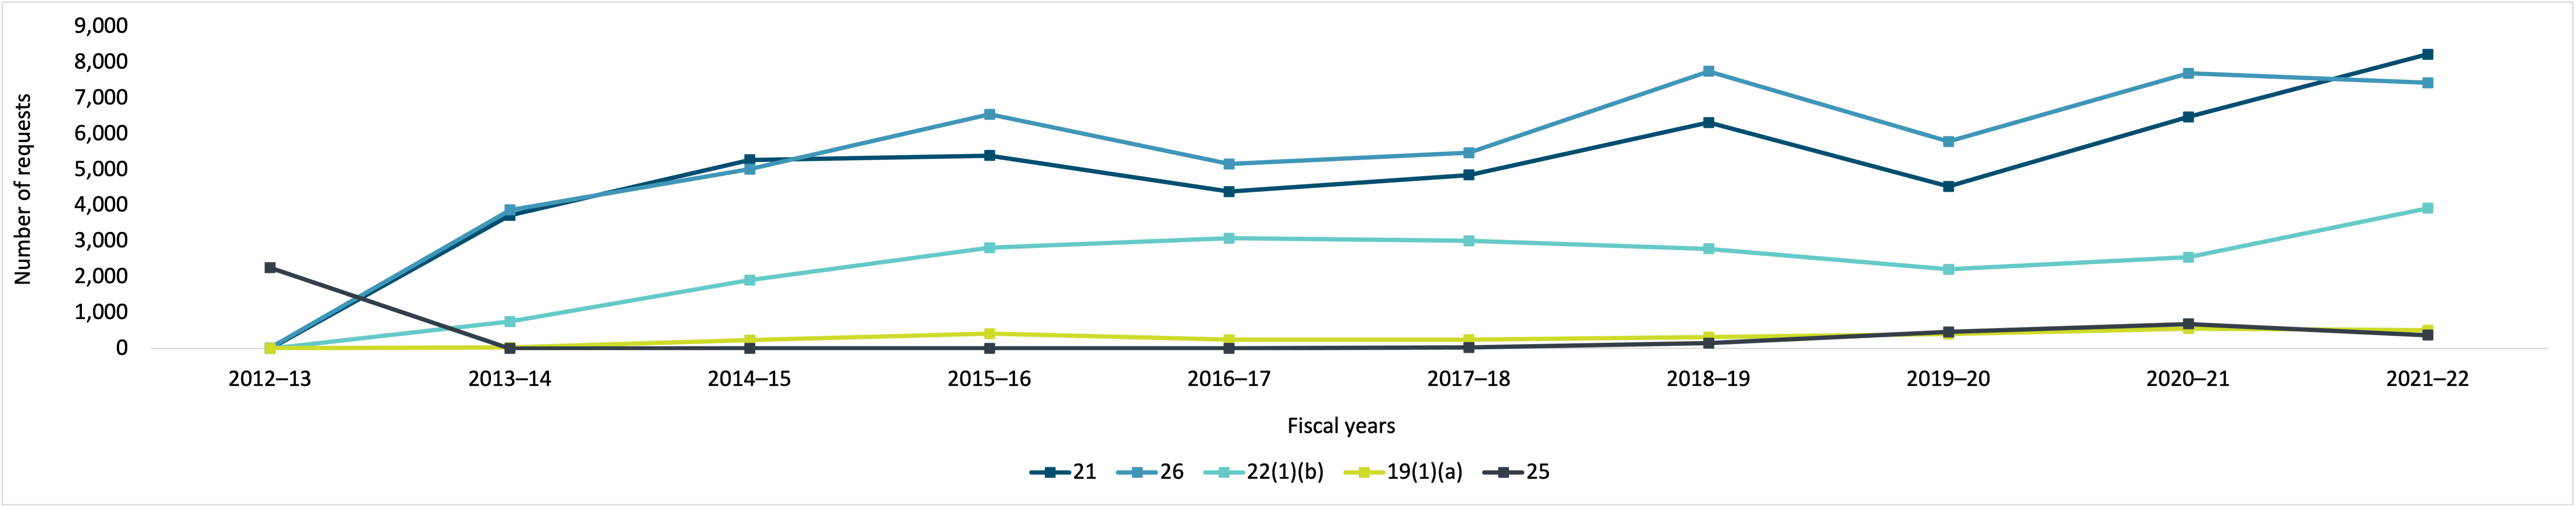
Figure 59 - Text version
| 2012–13 | 2013–14 | 2014–15 | 2015–16 | 2016–17 | 2017–18 | 2018–19 | 2019–20 | 2020–21 | 2021–22 | |
|---|---|---|---|---|---|---|---|---|---|---|
| 21 | - | 3,724 | 5,273 | 5,394 | 4,388 | 4,851 | 6,311 | 4,530 | 6,474 | 8,226 |
| 26 | 21 | 3,873 | 5,013 | 6,549 | 5,155 | 5,474 | 7,744 | 5,784 | 7,689 | 7,428 |
| 22(1)(b) | 4 | 758 | 1,911 | 2,820 | 3,086 | 3,013 | 2,787 | 2,213 | 2,553 | 3,922 |
| 19(1)(a) | 7 | 30 | 238 | 420 | 250 | 246 | 323 | 402 | 559 | 511 |
| 25 | 2,256 | 1 | 3 | 10 | 8 | 30 | 148 | 463 | 688 | 375 |
| Exemption | Description |
|---|---|
| 21 | May refuse to disclose any personal information the disclosure of which could be injurious to the conduct of international affairs and defence. |
| 26 | May refuse to disclose any personal information about another individual. |
| 22(1)(b) | May refuse to disclose any personal information the disclosure of which could be injurious to the enforcement of any law of Canada. |
| 19(1)(a) | Shall refuse to disclose any personal information obtained in confidence from the government of a foreign state. |
| 25 | May refuse to disclose any personal information the disclosure of which could threaten the safety of individuals. |
Exclusions
IRCC did not invoke any Privacy Act exclusions in personal information requests closed during 2021–22.
Costs
Figure 60 indicates that over the last decade, the annual cost in actual dollars to administer IRCC’s privacy program has increased. However, the trend reversed since 2019-20.
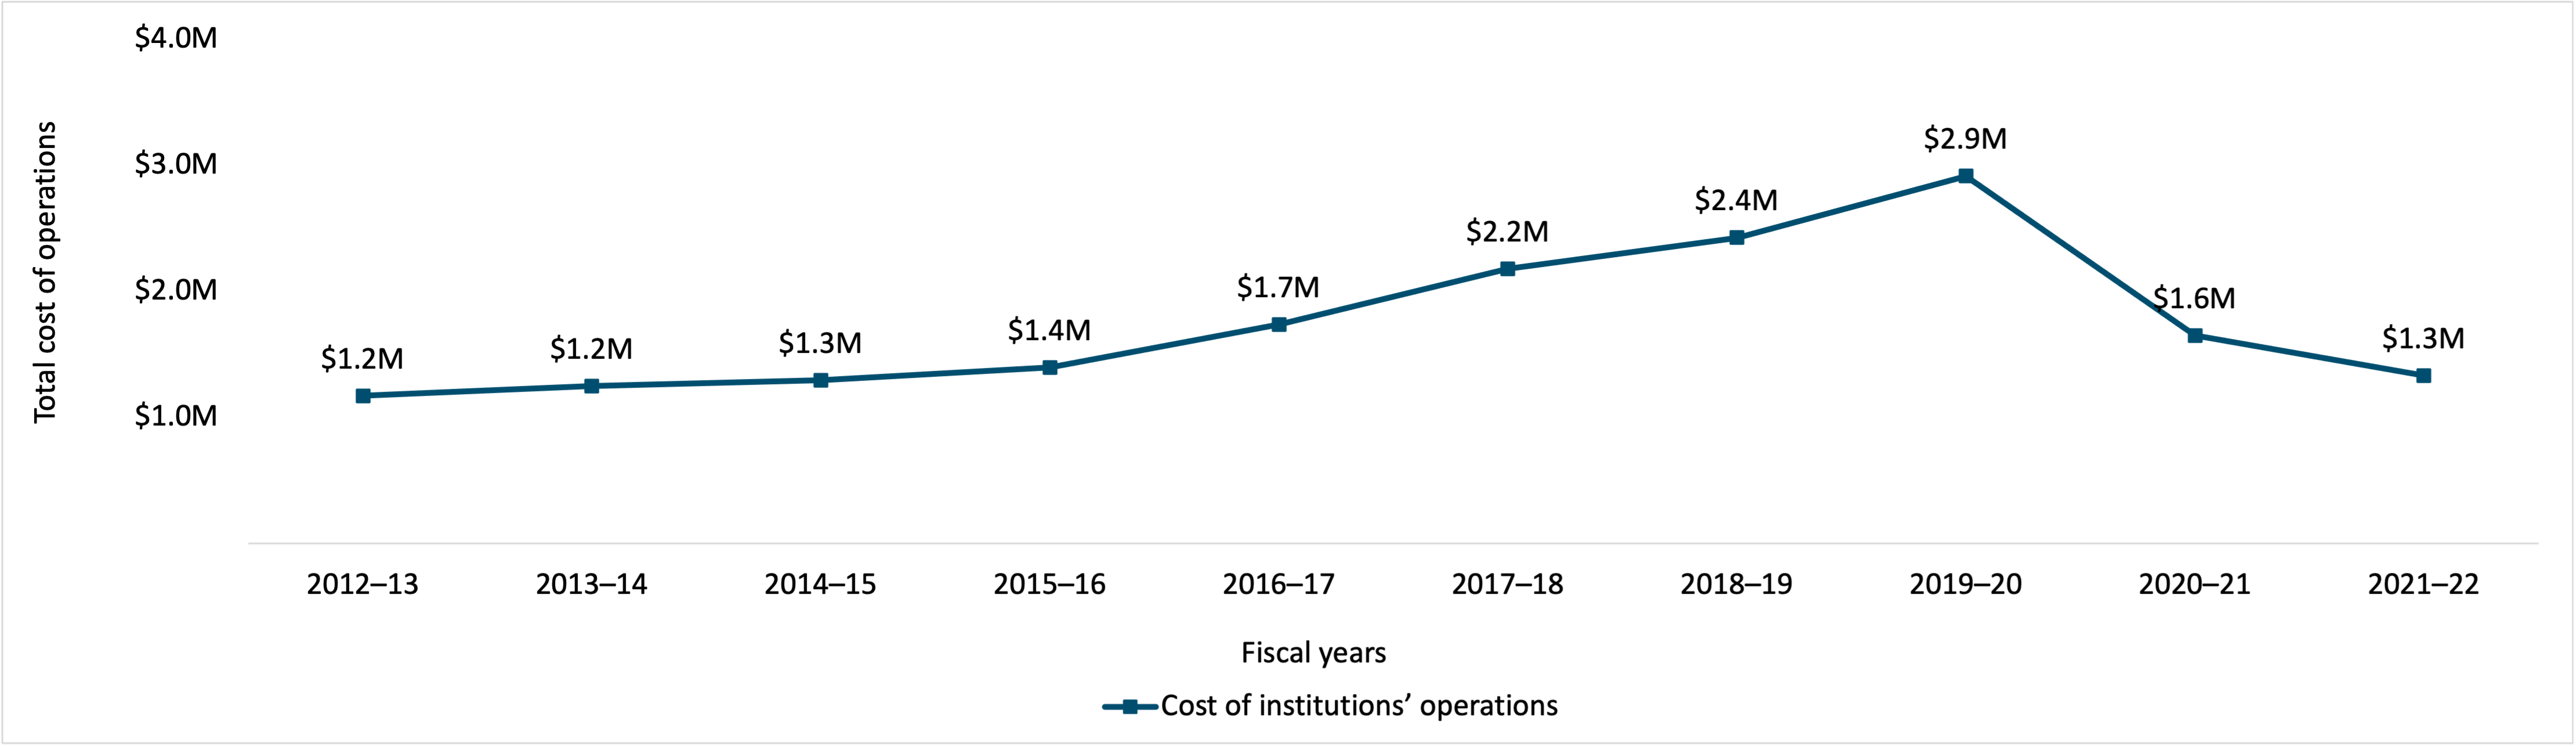
Figure 60 - Text version
| 2012–13 | 2013–14 | 2014–15 | 2015–16 | 2016–17 | 2017–18 | 2018–19 | 2019–20 | 2020–21 | 2021–22 | |
|---|---|---|---|---|---|---|---|---|---|---|
| Cost of institutions’ operations | $1,169,234 | $1,247,118 | $1,291,282 | $1,394,420 | $1,734,703 | $2,176,746 | $2,423,849 | $2,912,354 | $1,647,656 | $1,330,037 |
Disclosures under subsections 8(2) and 8(5) of the Privacy Act
In 2021–22, the number of disclosures pursuant to subsection 8(2)(e), which relates to disclosure to an investigative body, was 2,159. The number of disclosures pursuant to paragraph 8(2)(m), which relates to public interest disclosure for IRCC was 188.
Privacy impact assessments
IRCC completed 1 PIA in 2021–22.
Personal information banks
| Personal information banks | Amount |
|---|---|
| Active | 18 |
| Created | 0 |
| Modified | 0 |
| Terminated | 0 |
Material Privacy Breaches
During 2021–22, IRCC reported seven material privacy breaches to both the Treasury Board of Canada Secretariat and the Office of the Privacy Commissioner of Canada.