
Access to Information and Privacy Statistical Report for 2024–2025 Fiscal Year
On this page
Introduction
The Access to Information Act (ATIA) and the Privacy Act both came into effect on July 1, 1983.
Paragraph 70(1)(d) of the ATIA gives the President of the Treasury Board, as the designated minister, responsibility for collecting statistics and publishing a report containing a summary of those statistics on an annual basis. These statistics are used to assess the performance of the access to information (ATI) and privacy programs of the Government of Canada (GC).
This report presents statistical information submitted by institutions subject to the ATIA and Privacy Act, detailing the GC’s ATI and privacy programs across all federal institutions subject to the ATIA and the Privacy Act from April 1, 2024, to March 31, 2025.
Every institution subject to the ATIA and the Privacy Act also tables an annual report in Parliament on the administration of each act. These reports can be found on institutions’ websites.
The complete statistical datasets for 2024–25 will be available on the GC’s Open Data Portal.
Exclusion of data from Immigration, Refugees and Citizenship Canada
Immigration, Refugees and Citizenship Canada (IRCC) accounted for 83.3% of ATI requests and 43% of personal information requests received by the GC in 2024–25 (including 77.4% of requests for personal information by foreign nationals outside Canada), the vast majority of which related to clients’ immigration applications.Footnote 1
Because the nature and volume of requests received by IRCC differ significantly from the overall body of requests across the ATI and privacy system, IRCC’s data are excluded from this report.
More information about IRCC’s ATI and privacy programs can be found in its 2024-2025 Annual Report on the Access to Information Act and 2024–2025 Annual Report on the Privacy Act.
Key observations on volume of requests and performance
Access to information program data
With respect to requests made under the ATIA, in 2024–25, requests received decreased by 27.6% from the previous year, to 33,928; requests closed, by 23.7%, to 36,361; and requests carried over, by 9.4%, to 23,859. Pages processed increased by 33.1% from the previous year, to 13,740,293.
In terms of performance, at the government-wide level, 64.5% of ATI requests were closed within legislated timelines. At the institutional level, 59.1% of institutions met the performance target of closing 90% of ATI requests within legislated timelines.
Privacy program data
With respect to requests made under the Privacy Act, in 2024–25, requests received increased by 23% from the previous year, to 134,528; requests closed, by 26.2%, to 135,462; and requests carried over, by 6%, to 35,581. Pages processed increased by 29.3% from the previous year, to 10,657,876.
In July 2022, the GC extended the right of access to all individuals, regardless of citizenship. This means that anyone in the world can submit a request for their personal information under the Privacy Act. In 2024–25 15,728 personal information requests were received from foreign nationals outside Canada.
In terms of performance, at the government-wide level, 83.5% of requests for personal information were closed within legislated timelines. At the institutional level, 57.9% of institutions met the performance target of closing 90% of requests for personal information within legislated timelines.
Performance and statistical summary
Tables 1 to 4 provide a summary of results against key performance indicators and key data points for the ATI and privacy programs over the past three fiscal years, from 2022–23 to 2024–25.
| Key performance indicator | 2022–23 | 2023–24 | 2024–25 | Relative percentage change |
|---|---|---|---|---|
| Percentage of ATI requests responded to within legislated timelinesFootnote 2 | 72.3% | 69.9% | 64.5% | -7.7% |
| Percentage of institutions that respond to 90% or more of ATI requests within legislated timelines | 54.2%Footnote 3 | 58.9% | 59.1% | +0.3% |
| Key performance indicator | 2022–23 | 2023–24 | 2024–25 | Relative percentage change |
|---|---|---|---|---|
| Percentage of personal information requests responded to within legislated timelinesFootnote 4 | 72.7% | 79.9% | 83.5% | +4.5% |
| Percentage of institutions that respond to 90% or more of personal information requests within legislated timelines | 60.8%Footnote 5 | 68.4% | 57.9% | -15.4% |
| Indicator | 2022–23 | 2023–24 | 2024–25 | Relative percentage change |
|---|---|---|---|---|
| Number of requests received | 52,377 | 46,857 | 33,928 | -27.6% |
| Number of requests closed | 48,308 | 47,644 | 36,361 | -23.7% |
| Number of requests carried over | 32,637 | 26,329 | 23,859 | -9.4% |
| Number of extensions taken on closed requests | 16,747 | 16,960 | 19,315 | +13.9% |
| Percentage of requests closed with partial or full information disclosed | 79.5% | 73.8% | 74.9% | +1.5% |
| Number of consultations received | 6,402 | 5,181 | 5,299 | +2.3% |
| Number of consultations closed | 6,612 | 5,376 | 5,331 | -0.8% |
| Number of pages processed for closed requests | 8,260,971 | 10,326,722 | 13,740,293 | +33.1% |
| Total cost of ATI program operations | $95,694,045 | $116,387,899 | $118,022,916 | +1.4% |
| Indicator | 2022–23 | 2023–24 | 2024–25 | Relative percentage change |
|---|---|---|---|---|
| Number of requests received | 81,679Footnote 6 | 109,401Footnote 7 | 134,528Footnote 8 | +23% |
| Number of requests closed | 81,932 | 107,374 | 135,462 | +26.2% |
| Number of requests carried over | 36,301 | 33,577 | 35,581 | +6% |
| Number of extensions taken on closed requests | 13,879 | 15,345 | 23,784 | +55% |
| Percentage of requests closed with partial or full information disclosed | 79.1% | 64.5% | 72.2% | +11.9% |
| Number of consultations received | 177 | 134 | 221 | +64.9% |
| Number of consultations closed | 171 | 130 | 219 | +68.5% |
| Number of pages processed for closed requests | 7,717,559 | 8,241,062 | 10,657,876 | +29.3% |
| Number of reported material privacy breachesFootnote 9 | 305 | 581 | 36,118 | +6,116.5%Footnote 10 |
| Total cost of privacy program operations | $73,346,139 | $99,188,449 | $94,867,002 | -4.4% |
Trend analysis
This section provides a trend analysis of results against key performance indicators and key data points for the ATI and privacy programs over the past 10 fiscal years, from 2015–16 to 2024–25. For material privacy breaches, data is only available starting in 2019–20.
Each radio button below corresponds to a trend graph of one or more of the key performance indicators and key data points. To view a graph, select one of the radio buttons.
Trend analysis of access to information program data
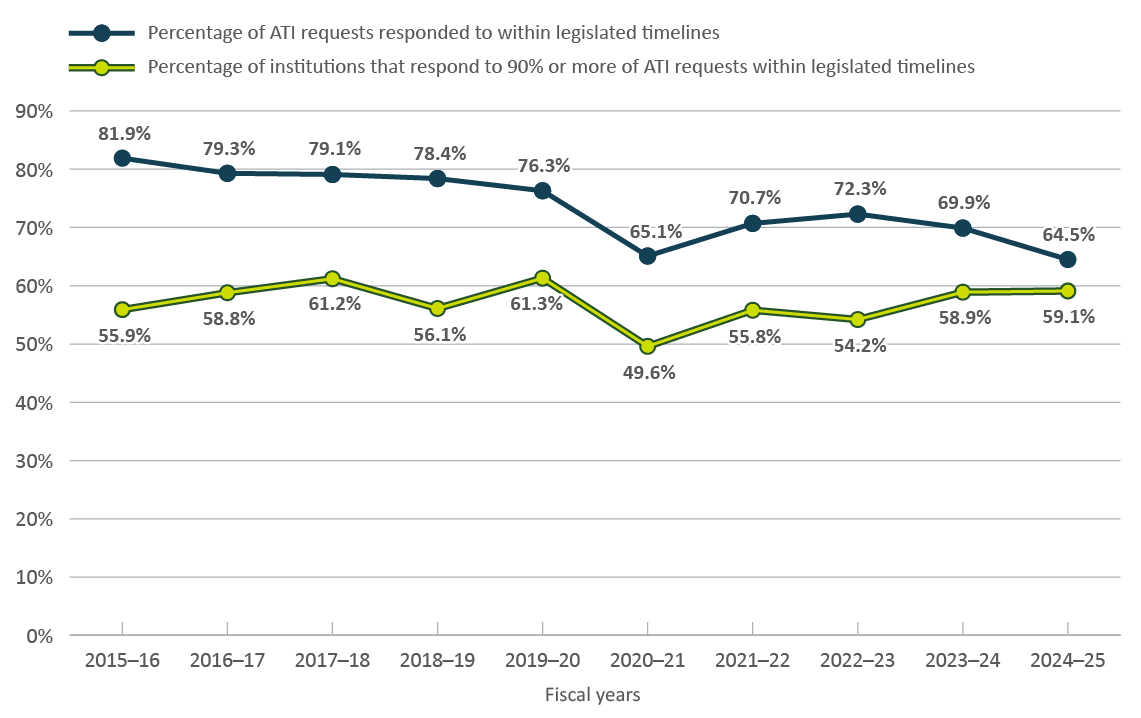
Figure 1 – Text version
| 2015–16 | 2016–17 | 2017–18 | 2018–19 | 2019–20 | 2020–21 | 2021–22 | 2022–23 | 2023–24 | 2024-25 | |
|---|---|---|---|---|---|---|---|---|---|---|
| Percentage of ATI requests responded to within legislated timelines | 81.9% | 79.3% | 79.1% | 78.4% | 76.3% | 65.1% | 70.7% | 72.3% | 69.9% | 64.5% |
| Percentage of institutions that respond to 90% or more of ATI requests within legislated timelines | 55.9% | 58.8% | 61.2% | 56.1% | 61.3% | 49.6% | 55.8% | 54.2% | 58.9% | 59.1% |
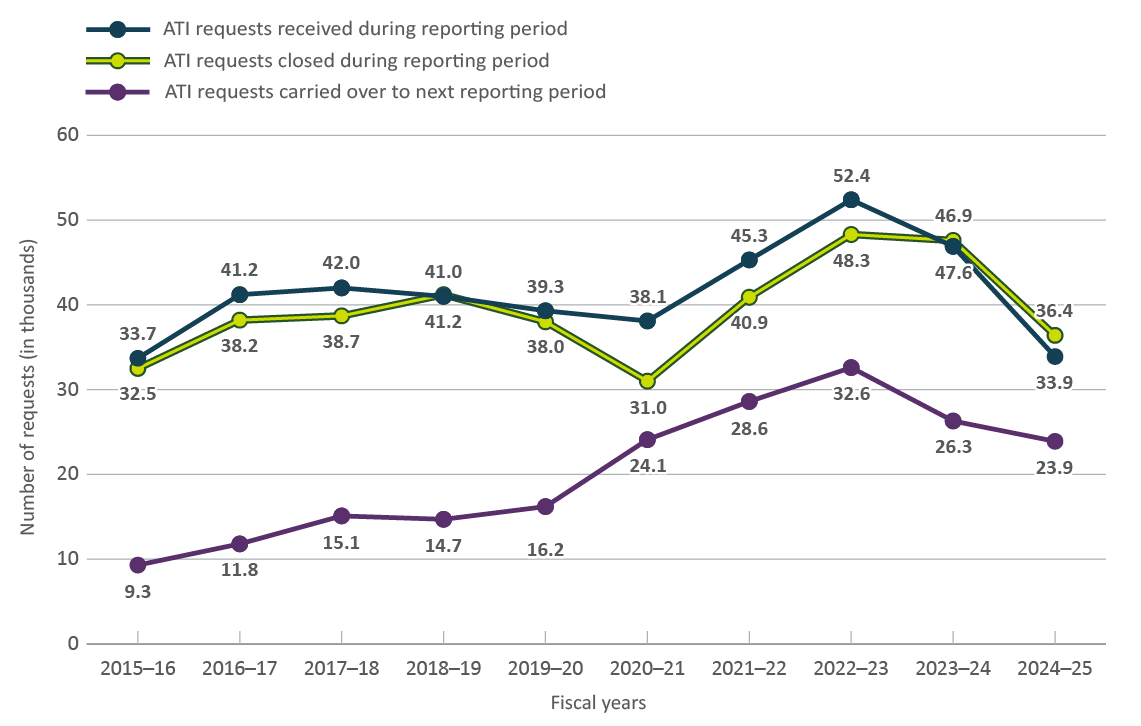
Figure 2 – Text version
| 2015–16 | 2016–17 | 2017–18 | 2018–19 | 2019–20 | 2020–21 | 2021–22 | 2022–23 | 2023–24 | 2024-25 | |
|---|---|---|---|---|---|---|---|---|---|---|
| ATI requests received during reporting period | 33,727 | 41,152 | 42,021 | 41,034 | 39,294 | 38,117 | 45,334 | 52,377 | 46,857 | 33,928 |
| ATI requests closed during reporting period | 32,474 | 38,175 | 38,684 | 41,165 | 37,977 | 30,989 | 40,889 | 48,308 | 47,644 | 36,361 |
| ATI requests carried over to next reporting period | 9,319 | 11,828 | 15,118 | 14,734 | 16,235 | 24,088 | 28,585 | 32,637 | 26,329 | 23,859 |
Figure 3 shows the breakdown of the 23,867 ATI requests that were carried over to 2025–26, by year of receipt and by status (that is, within or beyond legislated timelines).
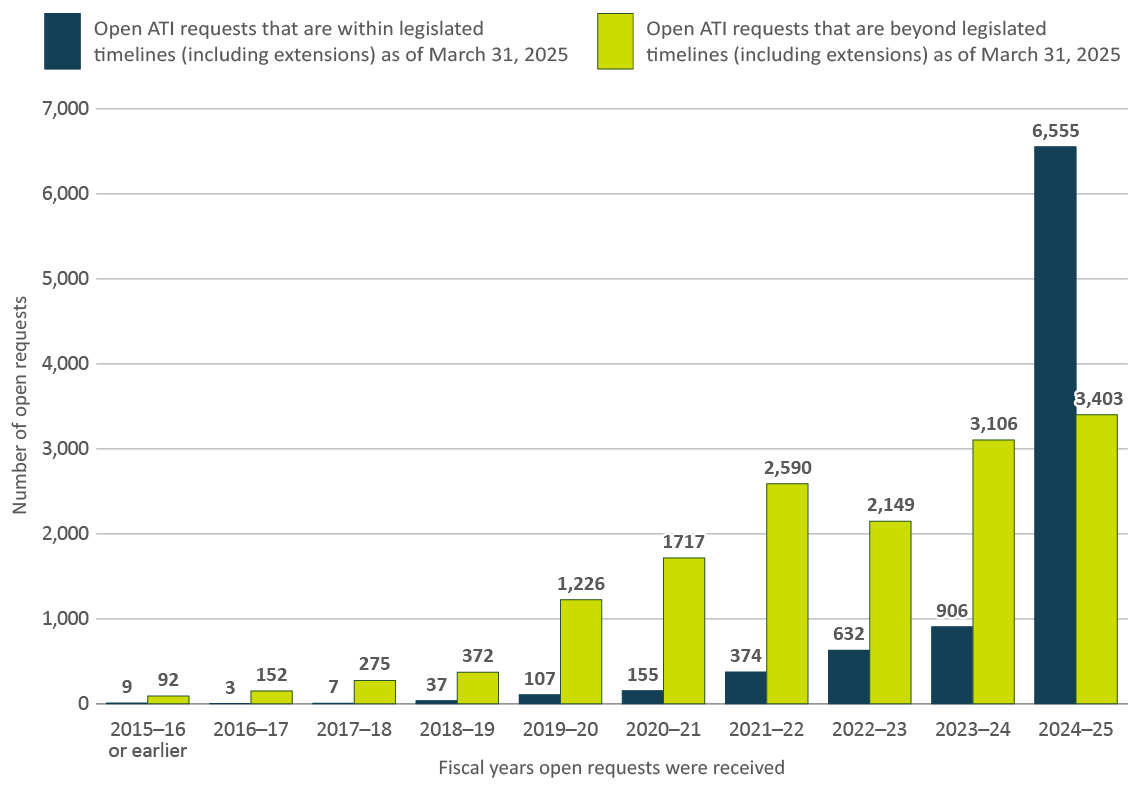
Figure 3 – Text version
| 2015–16 or earlier | 2016–17 | 2017–18 | 2018–19 | 2019–20 | 2020–21 | 2021–22 | 2022–23 | 2023–24 | 2024-25 | |
|---|---|---|---|---|---|---|---|---|---|---|
| Open ATI requests that are within legislated timelines (including extensions) as of March 31, 2025 | 9 | 3 | 7 | 37 | 107 | 155 | 374 | 632 | 906 | 6,555 |
| Open ATI requests that are beyond legislated timelines (including extensions) as of March 31, 2025 | 92 | 152 | 275 | 372 | 1,226 | 1,717 | 2,590 | 2,149 | 3,106 | 3,403 |
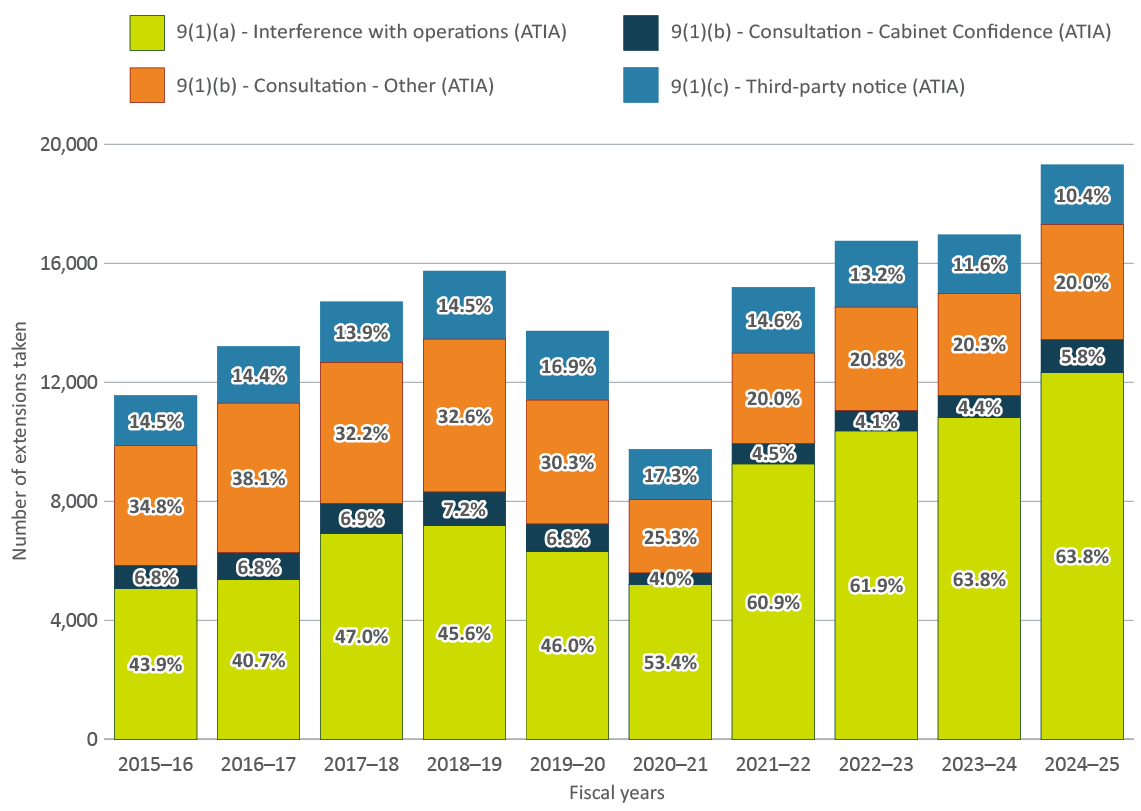
Figure 4 – Text version
| 2015–16 | 2016–17 | 2017–18 | 2018–19 | 2019–20 | 2020–21 | 2021–22 | 2022–23 | 2023–24 | 2024-25 | |
|---|---|---|---|---|---|---|---|---|---|---|
| 9(1)(a) - Interference with operations (ATIA) | 5,071 | 5,378 | 6,919 | 7,184 | 6,313 | 5,205 | 9,261 | 10,366 | 10,818 | 12,331 |
| 9(1)(b) - Consultation - Cabinet Confidence (ATIA) | 780 | 895 | 1,011 | 1,135 | 927 | 386 | 683 | 689 | 740 | 1,111 |
| 9(1)(b) - Consultation - Other (ATIA) | 4,024 | 5,026 | 4,741 | 5,132 | 4,164 | 2,467 | 3,041 | 3,479 | 3,437 | 3,860 |
| 9(1)(c) - Third-party notice (ATIA) | 1,677 | 1,907 | 2,038 | 2,288 | 2,319 | 1,688 | 2,213 | 2,213 | 1,965 | 2,013 |
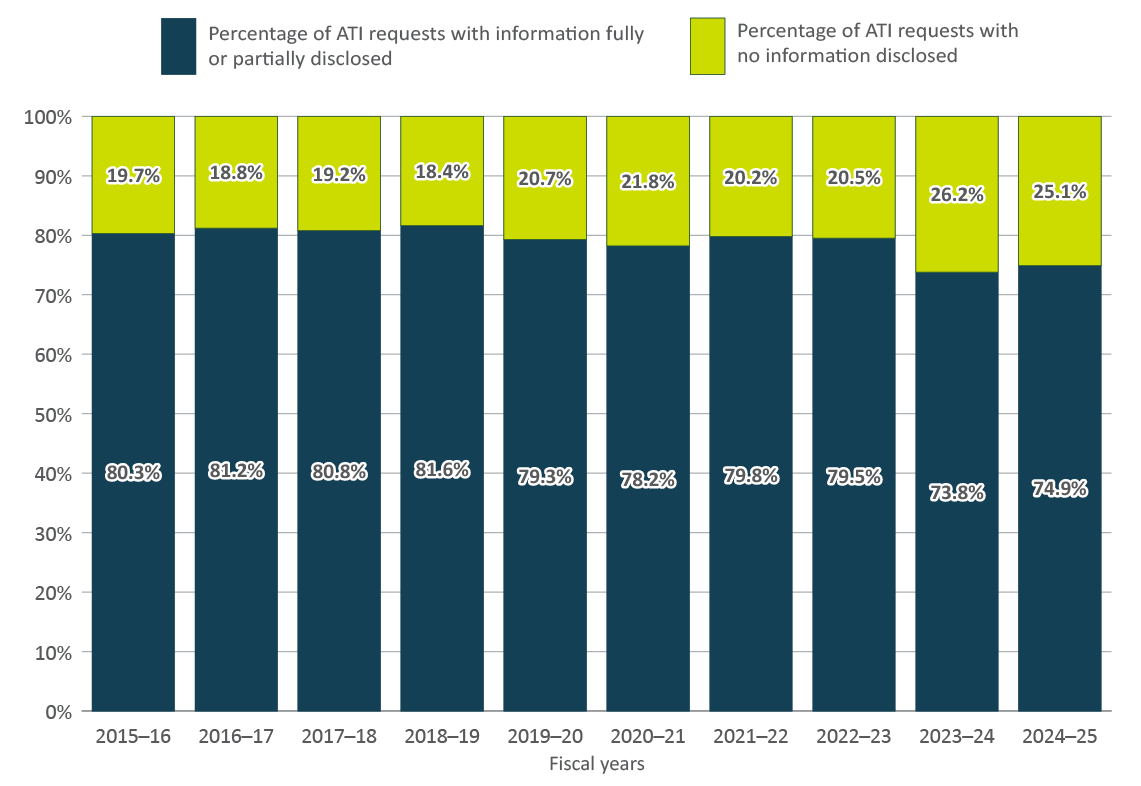
Figure 5 – Text version
| 2015–16 | 2016–17 | 2017–18 | 2018–19 | 2019–20 | 2020–21 | 2021–22 | 2022–23 | 2023–24 | 2024-25 | |
|---|---|---|---|---|---|---|---|---|---|---|
| Percentage of ATI requests with information fully or partially disclosed | 80.3% | 81.2% | 80.8% | 81.6% | 79.3% | 78.2% | 79.8% | 79.5% | 73.8% | 74.9% |
| Percentage of ATI requests with no information disclosed | 19.7% | 18.8% | 19.2% | 18.4% | 20.7% | 21.8% | 20.2% | 20.5% | 26.2% | 25.1% |
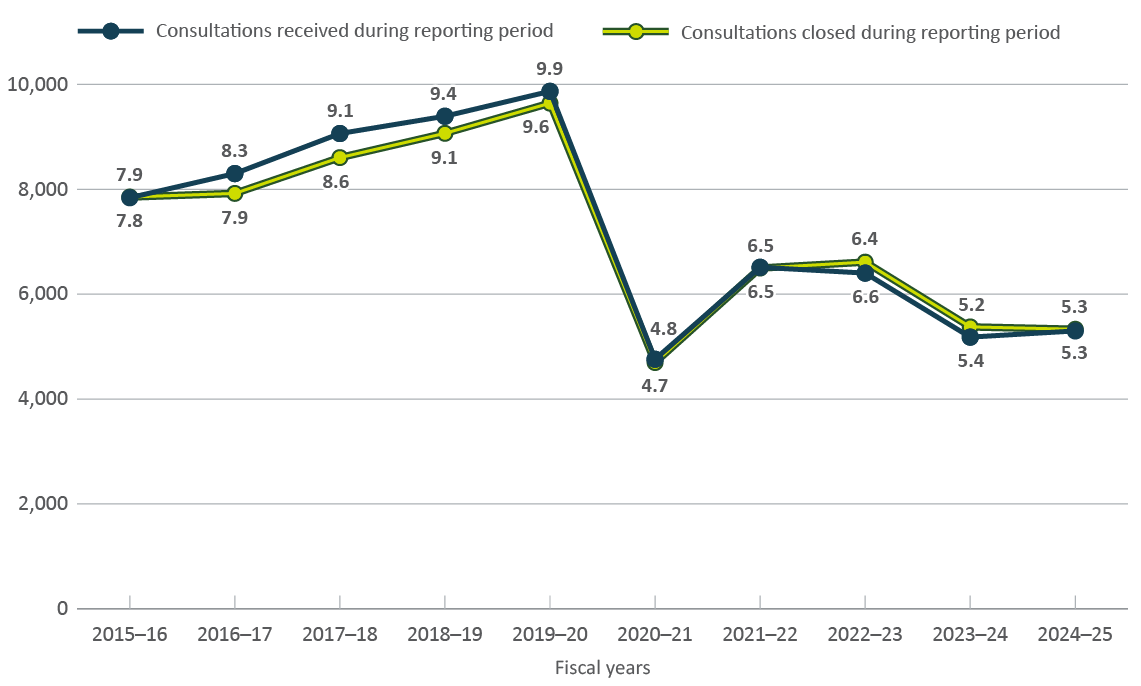
Figure 6 – Text version
| 2015–16 | 2016–17 | 2017–18 | 2018–19 | 2019–20 | 2020–21 | 2021–22 | 2022–23 | 2023–24 | 2024-25 | |
|---|---|---|---|---|---|---|---|---|---|---|
| Consultations received during reporting period | 7,839 | 8,300 | 9,064 | 9,394 | 9,869 | 4,759 | 6,513 | 6,402 | 5,181 | 5,299 |
| Consultations closed during reporting period | 7,853 | 7,922 | 8,605 | 9,068 | 9,643 | 4,696 | 6,498 | 6,612 | 5,376 | 5,331 |
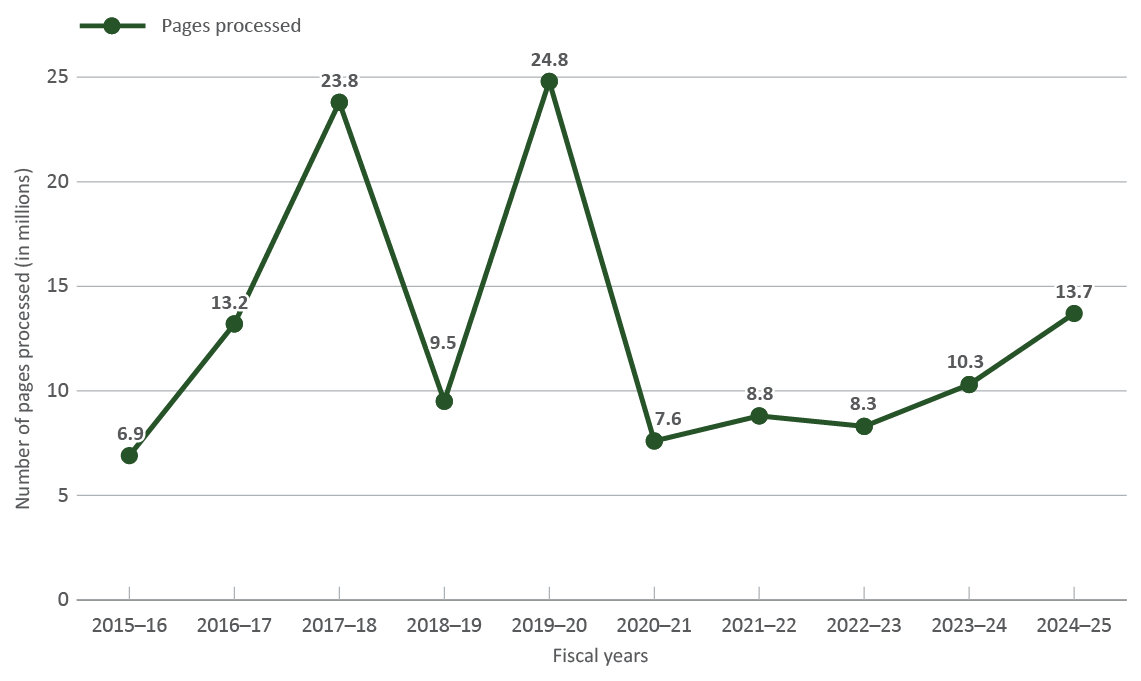
Note: Pages processed spiked in 2017–18 because of one request of about 14.8 million pages. It spiked again in 2019–20 because one institution closed three requests on the same subject involving nearly 15 million pages in total.
Figure 7 – Text version
| 2015–16 | 2016–17 | 2017–18 | 2018–19 | 2019–20 | 2020–21 | 2021–22 | 2022–23 | 2023–24 | 2024-25 | |
|---|---|---|---|---|---|---|---|---|---|---|
| Pages processed | 6,880,556 | 13,212,719 | 23,822,962 | 9,494,607 | 24,812,554 | 7,628,868 | 8,752,652 | 8,260,971 | 10,326,722 | 13,740,293 |

Figure 8 – Text version
| 2015–16 | 2016–17 | 2017–18 | 2018–19 | 2019–20 | 2020–21 | 2021–22 | 2022–23 | 2023–24 | 2024-25 | |
|---|---|---|---|---|---|---|---|---|---|---|
| Cost of institutions’ operations | $61,906,740 | $61,404,105 | $65,585,102 | $68,526,010 | $71,664,483 | $77,723,116 | $83,202,144 | $95,694,045 | $116,387,899 | $118,022,916 |
Trend analysis of privacy program data
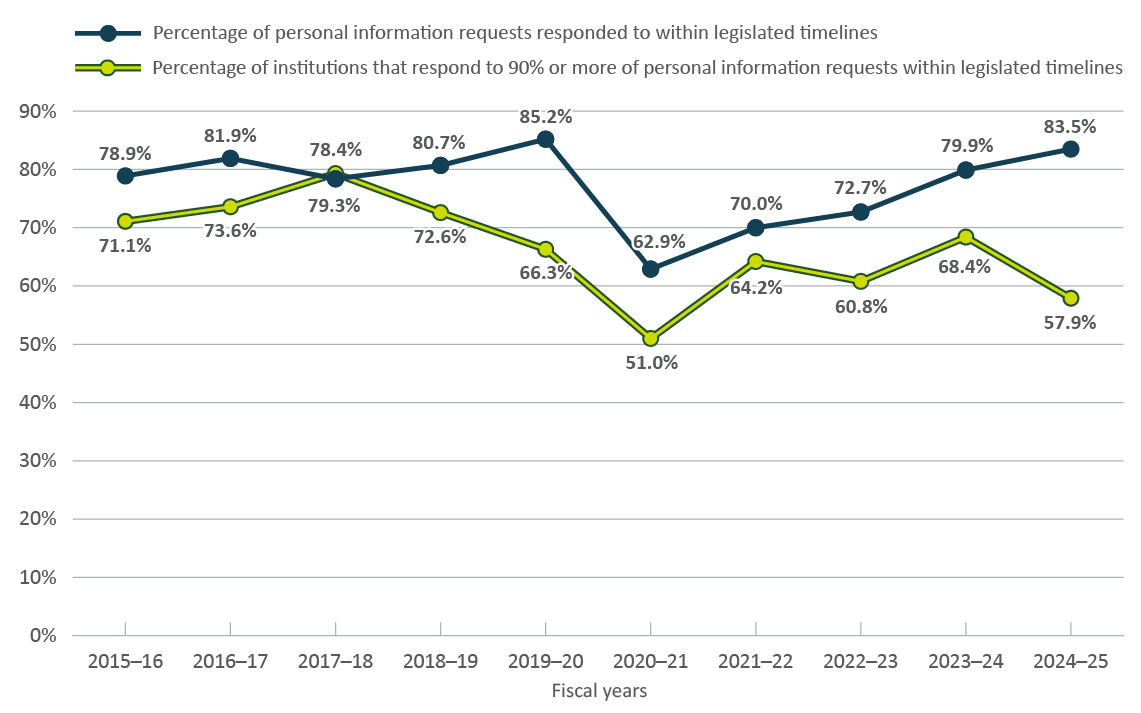
Figure 9 – Text version
| 2015–16 | 2016–17 | 2017–18 | 2018–19 | 2019–20 | 2020–21 | 2021–22 | 2022–23 | 2023–24 | 2024-25 | |
|---|---|---|---|---|---|---|---|---|---|---|
| Percentage of personal information requests responded to within legislated timelines | 78.9% | 81.9% | 78.4% | 80.7% | 85.2% | 62.9% | 70.0% | 72.7% | 79.9% | 83.5% |
| Percentage of institutions that respond to 90% or more of personal information requests within legislated timelines | 71.1% | 73.6% | 79.3% | 72.6% | 66.3% | 51.0% | 64.2% | 60.8% | 68.4% | 57.9% |
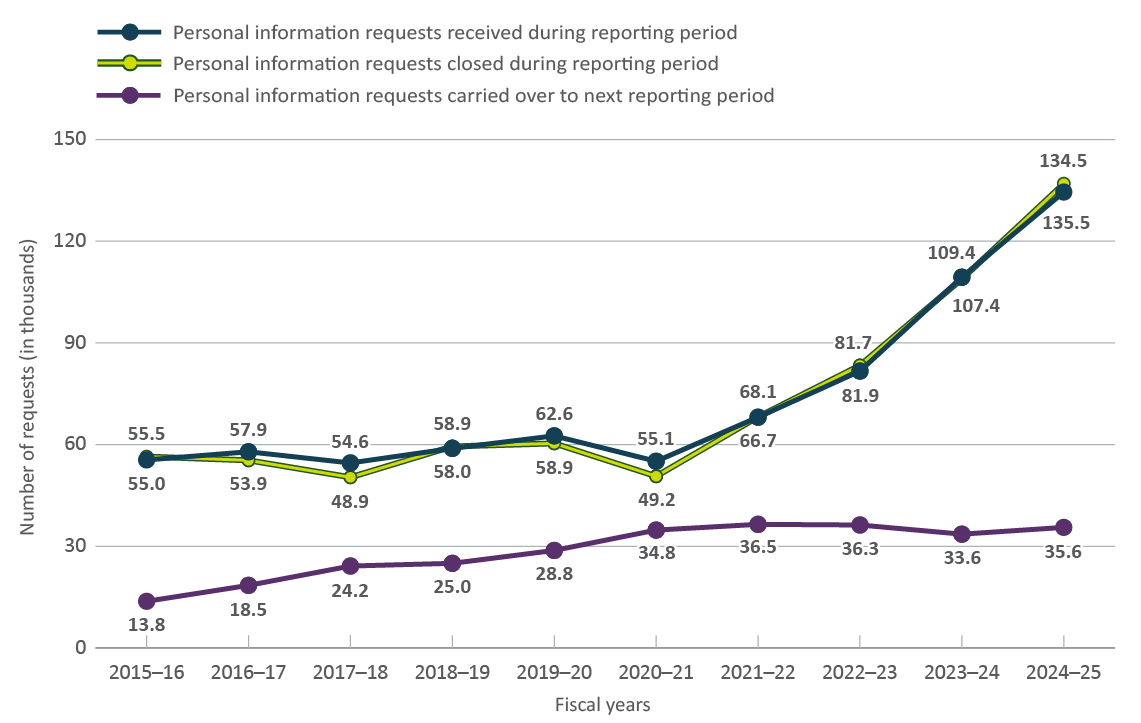
Figure 10 – Text version
| 2015–16 | 2016–17 | 2017–18 | 2018–19 | 2019–20 | 2020–21 | 2021–22 | 2022–23 | 2023–24 | 2024-25 | |
|---|---|---|---|---|---|---|---|---|---|---|
| Personal information requests received during reporting period | 55,541 | 57,885 | 54,599 | 58,911 | 62,578 | 55,137 | 68,096 | 81,679 | 109,401 | 134,528 |
| Personal information requests closed during reporting period | 55,002 | 53,905 | 48,876 | 58,028 | 58,881 | 49,178 | 66,696 | 81,932 | 107,374 | 135,462 |
| Personal information requests carried over to next reporting period | 13,830 | 18,456 | 24,192 | 25,046 | 28,826 | 34,751 | 36,535 | 36,301 | 33,577 | 35,581 |
Figure 11 shows the breakdown of the 35,583 personal information requests that were carried over to 2025–26, by year of receipt and by status (that is, within or beyond legislated timelines).
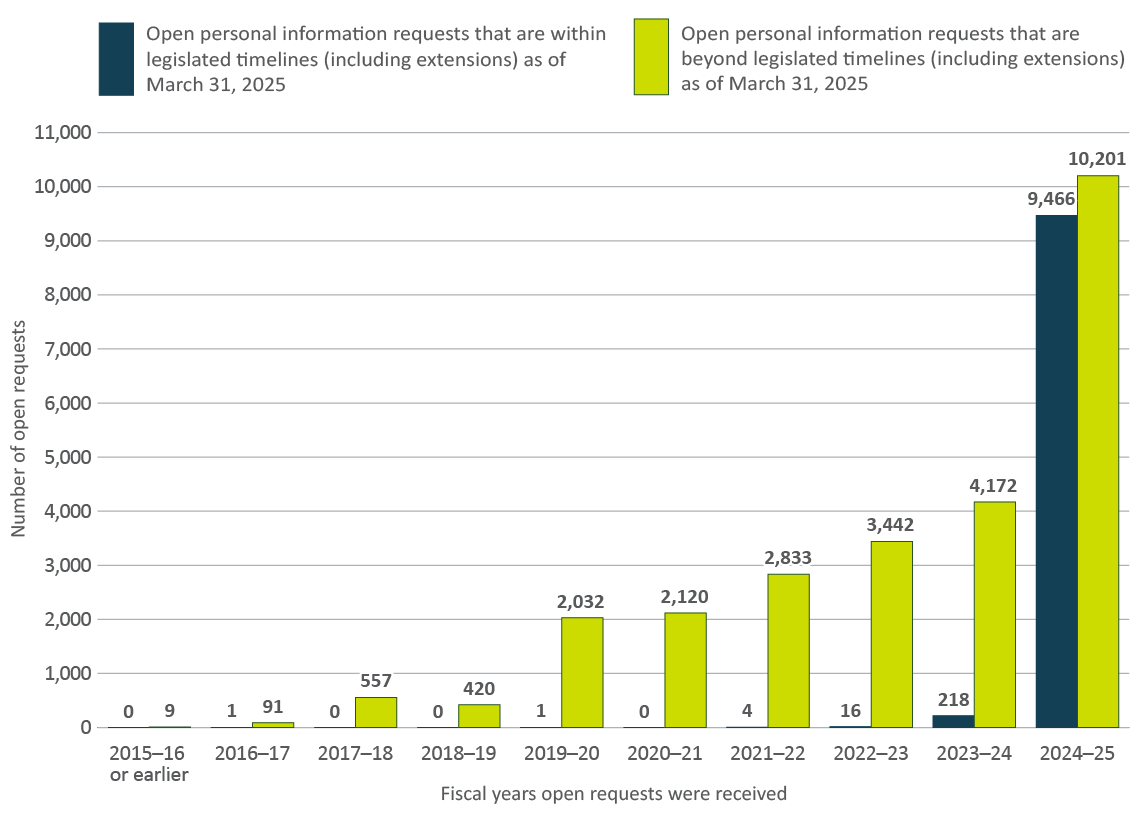
Figure 11 – Text version
| 2015–16 or earlier | 2016–17 | 2017–18 | 2018–19 | 2019–20 | 2020–21 | 2021–22 | 2022–23 | 2023–24 | 2024-25 | |
|---|---|---|---|---|---|---|---|---|---|---|
| Open personal information requests that are within legislated timelines (including extensions) as of March 31, 2025 | 0 | 1 | 0 | 0 | 1 | 0 | 4 | 16 | 218 | 9,466 |
| Open personal information requests that are beyond legislated timelines (including extensions) as of March 31, 2025 | 9 | 91 | 557 | 420 | 2,032 | 2,120 | 2,833 | 3,442 | 4,172 | 10,201 |
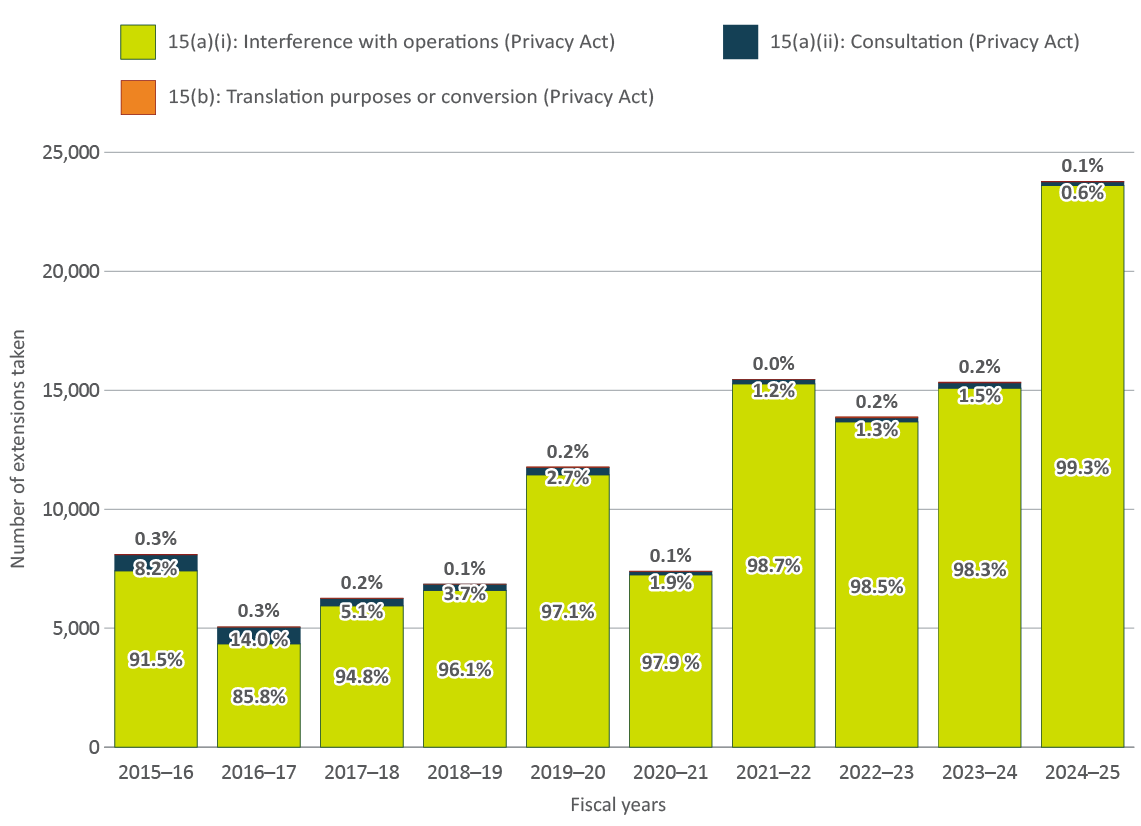
Figure 12 – Text version
| 2015–16 | 2016–17 | 2017–18 | 2018–19 | 2019–20 | 2020–21 | 2021–22 | 2022–23 | 2023–24 | 2024-25 | |
|---|---|---|---|---|---|---|---|---|---|---|
| 15(a)(i): Interference with operations (Privacy Act) | 7,414 | 4,339 | 5,939 | 6,594 | 11,441 | 7,243 | 15,267 | 13,671 | 15,090 | 23,607 |
| 15(a)(ii): Consultation (Privacy Act) | 665 | 707 | 317 | 255 | 316 | 144 | 192 | 176 | 225 | 150 |
| 15(b): Translation purposes or conversion (Privacy Act) | 23 | 14 | 10 | 10 | 20 | 11 | 3 | 32 | 30 | 27 |

Figure 13 – Text version
| 2015–16 | 2016–17 | 2017–18 | 2018–19 | 2019–20 | 2020–21 | 2021–22 | 2022–23 | 2023–24 | 2024-25 | |
|---|---|---|---|---|---|---|---|---|---|---|
| Percentage of personal information requests with information fully or partially disclosed | 86.3% | 87.8% | 85.9% | 85.9% | 87.2% | 86.7% | 85.4% | 79.1% | 64.5% | 72.2% |
| Percentage of personal information requests with no information disclosed | 13.7% | 12.2% | 14.1% | 14.1% | 12.8% | 13.3% | 14.6% | 20.9% | 35.5% | 27.8% |
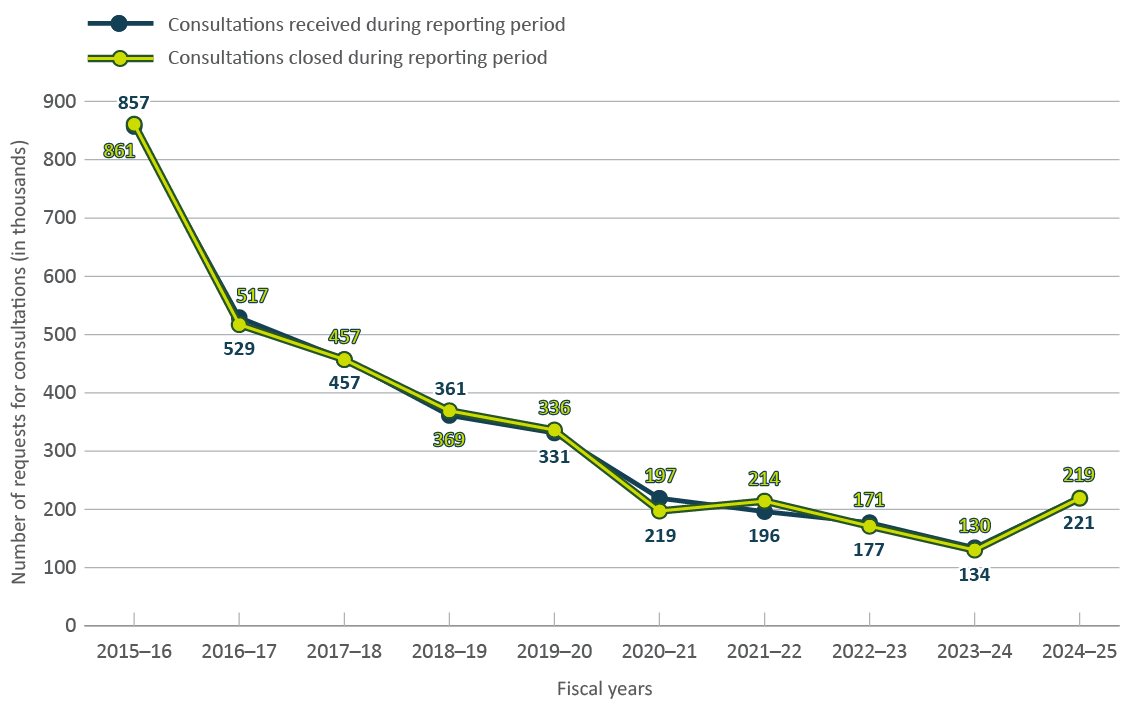
Figure 14 – Text version
| 2015–16 | 2016–17 | 2017–18 | 2018–19 | 2019–20 | 2020–21 | 2021–22 | 2022–23 | 2023–24 | 2024-25 | |
|---|---|---|---|---|---|---|---|---|---|---|
| Consultations received during reporting period | 857 | 529 | 457 | 361 | 331 | 219 | 196 | 177 | 134 | 221 |
| Consultations closed during reporting period | 861 | 517 | 457 | 369 | 336 | 197 | 214 | 171 | 130 | 219 |
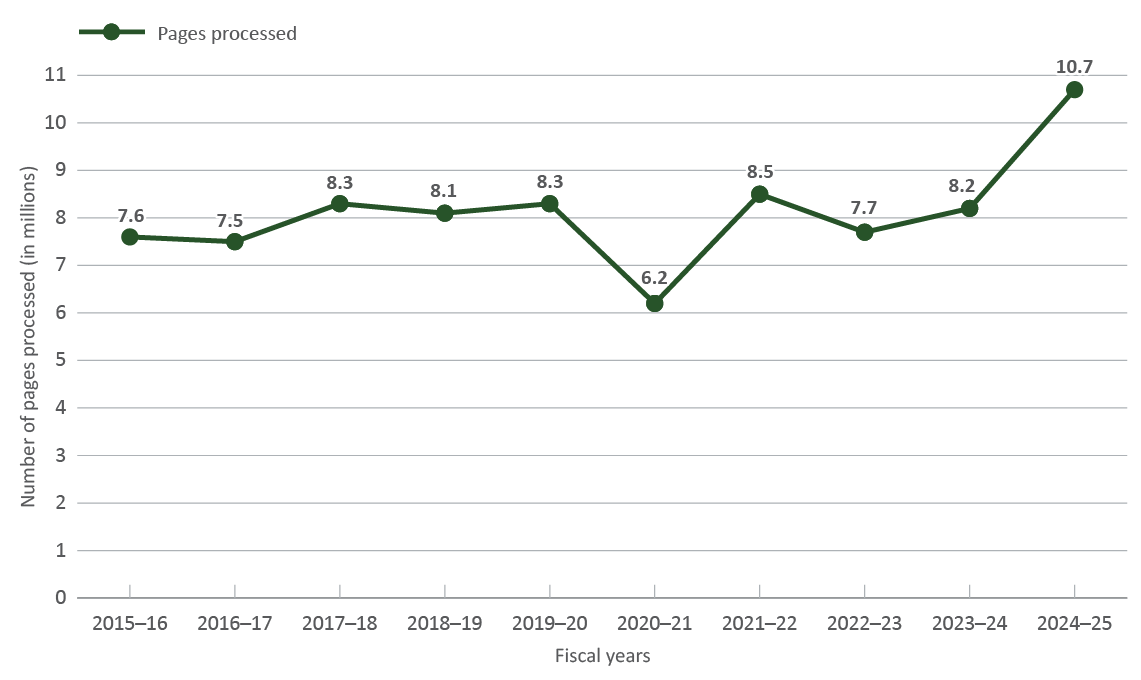
Figure 15 – Text version
| 2015–16 | 2016–17 | 2017–18 | 2018–19 | 2019–20 | 2020–21 | 2021–22 | 2022–23 | 2023–24 | 2024-25 | |
|---|---|---|---|---|---|---|---|---|---|---|
| Pages processed | 7,594,670 | 7,468,952 | 8,250,595 | 8,141,008 | 8,297,697 | 6,178,716 | 8,532,891 | 7,717,559 | 8,241,062 | 10,657,876 |
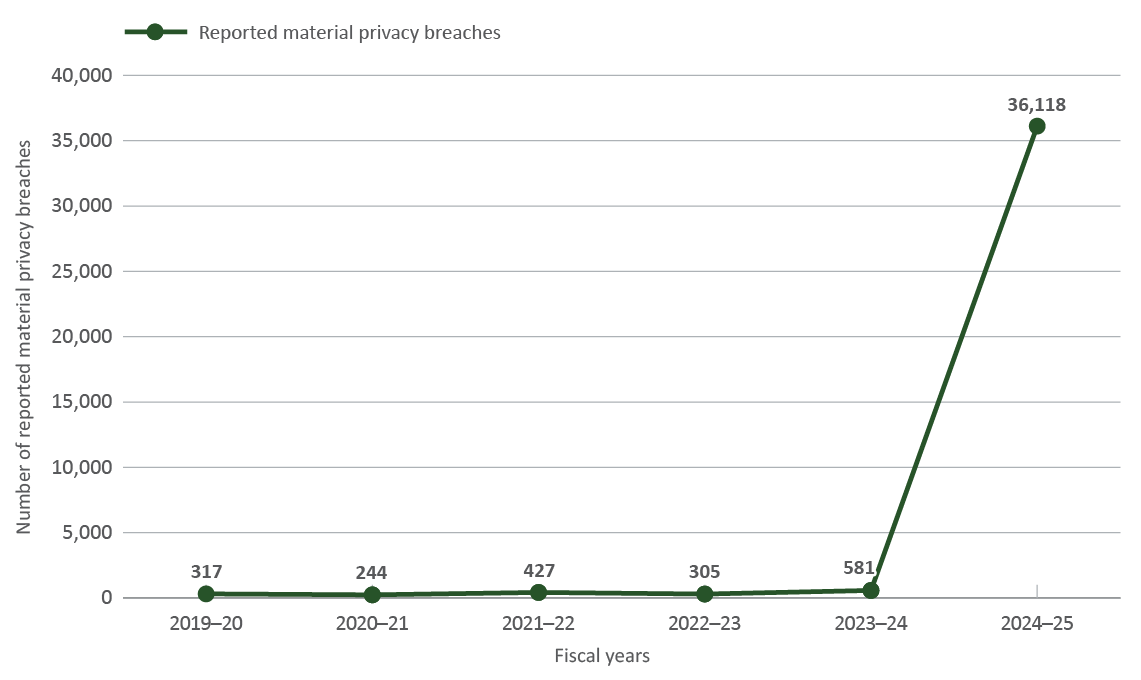
Note: The large increase in the number of reported material privacy breaches is due to a reporting increase from the Canada Revenue Agency (CRA). CRA has begun experiencing and managing Unauthorized Use of Taxpayer Information privacy breaches. For more information, see CRA’s 2024–2025 Annual Report on the Privacy Act.
Figure 16 – Text version
| 2019–20 | 2020–21 | 2021–22 | 2022–23 | 2023–24 | 2024-25 | |
|---|---|---|---|---|---|---|
| Reported material privacy breaches | 317 | 244 | 427 | 305 | 581 | 36,118 |

Figure 17 – Text version
| 2015–16 | 2016–17 | 2017–18 | 2018–19 | 2019–20 | 2020–21 | 2021–22 | 2022–23 | 2023–24 | 2024-25 | |
|---|---|---|---|---|---|---|---|---|---|---|
| Cost of institutions’ operations | $39,599,396 | $38,169,706 | $40,401,188 | $45,571,458 | $51,695,588 | $60,051,005 | $67,509,390 | $73,346,139 | $99,188,449 | $94,867,002 |